Namibian Sector Perfromance Review 2011 · Namibian Sector Performance 2011 . 1. Introduction 1 2....
44
Prepared by: Dr Christoph Stork Survey funded by: International Development Research Centre (IDRC) Namibian Sector Performance 2011
Transcript of Namibian Sector Perfromance Review 2011 · Namibian Sector Performance 2011 . 1. Introduction 1 2....
Prepared by: Dr Christoph StorkSurvey funded by: International Development Research Centre(IDRC)
Namibian Sector Performance 2011

1. Introduction 1
2. Namibia’s Telecommunication Sector 3
3. Policy and Legal Environment 7.....................................................................................................................................2008 ICT Policies 7
...........................................................................................................National Development Plan (NDP3) 8..............................................................................................................................................Vision 2030 8
.................................................................................................................Millennium Development Goals 9...........................................................................................................................ICT Policy for Education 9
...................................................................................................................Regional Policy Co-ordination 9.......................................................................................................Rollout obligations of Leo and MTC 10
...........................................................................................................................................Conclusions 10
4. Fixed-Line 11............................................................................................................................................Affordability 12
....................................................................................................................Household Internet Access 13..........................................................................................................................................Gap Analysis 13
...........................................................................................................Next Generation Business Model 14...........................................................................................................................................Conclusions 16
5. Mobile Phone 17.............................................................................................................................Duplicated Sim Cards 18
...............................................................................................................................................Coverage 19............................................................................................................................................Affordability 20..........................................................................................................................................Gap Analysis 23...........................................................................................................................................Conclusions 25
6. Public Phone Access & Usage 26
7. Individual Internet Access & Usage 29..........................................................................................................................................Gap Analysis 30...........................................................................................................................................Conclusions 30
8. Market Access Gap vs True Access Gap 31
9. Conclusions & Recommendations 33
10. References 34
11. Glossary 36
12. Survey Methodology 37...............................................................................................................................................Sampling 37
..........................................................................................................................................Sample Size 37..............................................................................................................................................Weighting 38
...........................................................................................................Stated and Revealed Preferences 40...........................................................................................................................Bottom of the Pyramid 42
Universal Service Baseline Study 1
Table of Contents

1. IntroductionThe universal service baseline study is a study of the current situation in terms of access and usage of ICTs in Namibia. It uses supply side data in the form of annual financial reports from operators and demand side data from a household and individual ICT access and usage survey conducted by Research ICT Africa in cooperation with the Communications Regulatory Authority of Namibia (CRAN) and the Namibian Broadcasting Corporation (NBC) in July and August 2011 for this purpose.1
Research ICT Africa conducted demand-side studies in Namibia in 2004, 2007 and 2011. Comparing the results over time documents both progress in terms of access and usage of ICTs as well as an increasing digital divide. The digital divide (the divide between those that have access to electricity and ICTs and those that do not) declined in Namibia from 2004 to 2007. More households had access to electricity, a fixed-line phone, a TV, a computer and an Internet connection at home in 2007 compared to 2004. The only ICT access indicator that declined during that period was the number of households with a working radio; indicating a substitution of radio by TV. The difference between rural and urban areas’ access to electricity, fixed-line phones, radio and TV at home even declined. For computer and Internet however, despite more rural and urban households having access, the difference increased. Computer and Internet access, apart from requiring a larger once-off as well as monthly financial commitment, are also limited by educational barriers. This success can be attributed to general
Universal Service Baseline Study 1
1 The survey results are preliminary results and will be adjusted as soon as the 2011 Census results are released. Official projections from the 2001 Census for 2011 were used to gross up the results (weight the results) to the national level. The census results for 2011 are likely to be different from the projections and will thus change the weighting. An updated report will be made available as soon as the census data has been released.
Table 1.1: Namibia’s digital divide at a household level (RIA 2004 2007and 2011 surveys)Table 1.1: Namibia’s digital divide at a household level (RIA 2004 2007and 2011 surveys)Table 1.1: Namibia’s digital divide at a household level (RIA 2004 2007and 2011 surveys)Table 1.1: Namibia’s digital divide at a household level (RIA 2004 2007and 2011 surveys)Table 1.1: Namibia’s digital divide at a household level (RIA 2004 2007and 2011 surveys)Table 1.1: Namibia’s digital divide at a household level (RIA 2004 2007and 2011 surveys)Table 1.1: Namibia’s digital divide at a household level (RIA 2004 2007and 2011 surveys)Table 1.1: Namibia’s digital divide at a household level (RIA 2004 2007and 2011 surveys)Table 1.1: Namibia’s digital divide at a household level (RIA 2004 2007and 2011 surveys)Table 1.1: Namibia’s digital divide at a household level (RIA 2004 2007and 2011 surveys)Table 1.1: Namibia’s digital divide at a household level (RIA 2004 2007and 2011 surveys)Table 1.1: Namibia’s digital divide at a household level (RIA 2004 2007and 2011 surveys)Table 1.1: Namibia’s digital divide at a household level (RIA 2004 2007and 2011 surveys)Table 1.1: Namibia’s digital divide at a household level (RIA 2004 2007and 2011 surveys)Table 1.1: Namibia’s digital divide at a household level (RIA 2004 2007and 2011 surveys)Table 1.1: Namibia’s digital divide at a household level (RIA 2004 2007and 2011 surveys)Table 1.1: Namibia’s digital divide at a household level (RIA 2004 2007and 2011 surveys)
Households with working...
NamibiaNamibiaNamibiaNamibia UrbanUrbanUrbanUrban RuralRuralRuralRural Urban Rural DifferenceUrban Rural DifferenceUrban Rural DifferenceUrban Rural DifferenceHouseholds with working... 2004 2007 2011 2004 2007 2011 2004 2007 2011 2004 2007 2011
Electricity 34.4% 46.6% 45.5% ↓ 77.9% 81.0% 81.9% ↑ 6.1% 24% 21.5% ↓ 71.8% 57% 60.4% ↑
Fixed-line phone 13% 17.4% 11.5% ↓ 30.5% 32% 24.6% ↓ 1.6% 7.9% 2.8% ↓ 28.9% 24.1% 21.8% ↓
Radio 77.1% 72.6% 72% ↓ 88.0% 82.0% 81.1% ↓ 69.9% 66.4% 66% - 18.1% 15.6% 15.1% ↓
TV 31.1% 37.9% 40.6% ↑ 70.7% 72.4% 73.3% ↑ 5.2% 15.4% 18.8% ↑ 65.5% 57.0% 54.5% ↓
Computer 4.6% 11.2% 14.7% ↑ 11.0% 22.8% 34.8% ↑ 0.4% 3.6% 1.3% ↑ 10.6% 19.2% 33.5% ↑
Internet Connection 1.6% 3.3% 11.9% ↑ 4.1% 6.7% 26.9% ↑ 0.0% 1.1% 1.9% ↑ 4.1% 5.6% 25% ↑Which EA is rural and which urban is defined by the census.Which EA is rural and which urban is defined by the census.Which EA is rural and which urban is defined by the census.Which EA is rural and which urban is defined by the census.Which EA is rural and which urban is defined by the census.Which EA is rural and which urban is defined by the census.Which EA is rural and which urban is defined by the census.Which EA is rural and which urban is defined by the census.Which EA is rural and which urban is defined by the census.Which EA is rural and which urban is defined by the census.Which EA is rural and which urban is defined by the census.Which EA is rural and which urban is defined by the census.Which EA is rural and which urban is defined by the census.Which EA is rural and which urban is defined by the census.Which EA is rural and which urban is defined by the census.Which EA is rural and which urban is defined by the census.Which EA is rural and which urban is defined by the census.

economic growth, but also to falling prices of telecommunication and Internet access and hence Namibia’s policy and regulatory environment. In 2011 another trend has emerged; and that is a widening gap in terms of household electricity access between urban and rural households. The number of households with electricity decreased from 47% to 45% in Namibia during that period. Furthermore access to electricity in urban areas increased, whilst access in rural areas decreased. The drop in households with electricity in rural areas may be linked to a slowing down of rural electrification projects in Namibia.2
The digital divide between rural and urban households with respect to household computer and Internet access also widened further between 2007 and 2011, despite progress in Internet access in rural and urban areas. Household ownership of a computer or laptop dropped dramatically in 2011 compared to 2007, most likely due to a shift toward the use of mobile phones for Internet access. More households had Internet connection than a working laptop or computer.A further noticeable trend is the decline in households with working fixed-line connections.An important conclusion from those trends is that Namibian ICT policies should ideally be formulated in a technologically neutral way. Fixed-line access decreases in significance whilst mobile access rapidly increases in importance. This is the consequence of product design and roll out by Namibia’s operators.
Universal Service Baseline Study 2
2 See for example: “Rural electrification too slow” Namibian 14 June 2010 and “Rural electrification moving slow” Namibian 27 May 2011.

2. Namibia’s Telecommunication SectorThe past years have been record years in terms of policy making and implementation through regulation in Namibia:
Liberalisation of the mobile telecommunications sector through the granting of a second mobile licence in 2006;A single ministry has been put in charge of sector policies instead of having one for fixed and one for mobile telephony in 2008;New ICT policies were formulated in 2009;A termination rate dispute was settled within nine months, setting standards for the region in 2009;A retail price dispute was addressed by the NCC in March 2011, leading to fairer and more transparent prices for consumers;A new communications Act was passed by parliament in 2009 which commenced in May 2011.
Minister Joel Kaapanda has driven widespread reforms within the sector. The second mobile licence and subsequent competition in the mobile sector in 2006 was the first game changer. Enforcement of the licence conditions of Leo and MTC (termination rates based on cost) in 2009 added to that new game being played more fairly.MTC’s EBIDTA margin rose from 50.9% in 2008 to 55.8% in 2010. MTC also invested more since the lower termination rates led to fairer competition and hence the need to stay ahead of the field. Also remarkable is that MTC’s user numbers increased further, to nearly 1.6 million subscribers. Leo and Telecom Namibia also managed to attract new customers, indicating that the lower prices led to an expansion of the market.
Table 2.1: MTC: Key Financial Indicators (Group)Table 2.1: MTC: Key Financial Indicators (Group)Table 2.1: MTC: Key Financial Indicators (Group)Table 2.1: MTC: Key Financial Indicators (Group)Table 2.1: MTC: Key Financial Indicators (Group)Table 2.1: MTC: Key Financial Indicators (Group)Table 2.1: MTC: Key Financial Indicators (Group)
2005 2006 2007 2008 2009 2010
Revenue N$ million 769 937 1,113 1,232 1,390 1,407Shareholders’ Equity N$ million 646 903 999 1,136 1,153 1,166Taxation N$ million 146.5 171.3 177.0 180.7 198.8 187Net profit after tax N$ million 293 337 340 358 388 397Capital Expenditure in million N$ 160 188 340 286 260 410Total assets N$ million 915 1,169 1,329 1,608 1,632 1,791Dividend N$ million 110.0 80.0 245.0 220.8 369.5 383.6Dividend as % of after tax profit 37.5% 23.7% 72.1% 61.7% 95.4% 96.7%Return on equity 45.4% 37.3% 34.0% 31.5% 33.6% 34.0%Profit Margin 38.1% 36.0% 30.5% 29.0% 27.9% 28.2%EBITDA margin 61% 60.2% 52.2% 50.9% 53.8% 55.8%Active SIM cards in 1000 403.7 555.5 743.5 1,008.7 1,283.5 1,535Full-time Staff 276 272 296 397 416 395Monthly ARPU in N$ 159 141 125 102 90 54
Source: MTC Annual ReportsSource: MTC Annual ReportsSource: MTC Annual ReportsSource: MTC Annual ReportsSource: MTC Annual ReportsSource: MTC Annual Reports
Figure 2.1 shows the cost of OECD usage bundles for the cheapest postpaid or prepaid product of MTC for 2005 to 2011. The prices for Tango Prepaid per second were slashed by more than half in December 2009, and a new substantially cheaper postpaid product was introduced in early 2010 (Connect 50 lite), effectively reducing MTC prices again. Following the retail price cap in March 2011 that does not allow mobile operators to discriminate in their prices against other networks, prices dropped even further giving Namibia some of the cheapest prepaid mobile prices in Africa see Figure 2.2.
Universal Service Baseline Study 3

Figure 2.1: MTC cheapest product for OECD usage baskets -2006 definition(calculated based on advertised products)
Figure 2.2: Ten cheapest countries in Africa in terms of prepaid mobile for OECD lower user basket in US$ compared to South Africa, June 2011 (Source Research ICT Africa)
Telecom Namibia’s revenues have increased slowly but steadily over the past 15 years. Company profits, return on equity (ROE) and profit margins have fluctuated and are much lower than they used to be in 2003 to 2005. The results for Telecom Namibia are based on company not group results and exclude investments in South Africa and Angola. On a group level Telecom Namibia made losses of 122 and 87 million in 2010 and 2009 respectively.
Sep-05 Dec-08 May-10 Mar-11 Mar-11 (in Sep 2005 prices)
0
75
150
225
300
Low User Medium User High User
68
3535
97
5050
146
5050
179
119
79
296
174
83
Egypt
Sudan
Kenya
Algeria
Tanzania
Mauritius
Ethiopia
Namibia
Ghana
Uganda
South Africa 10.55
2.94
2.87
2.81
2.61
2.39
2.21
2.09
1.90
1.89
1.54
Universal Service Baseline Study 4

Table 2.3: Telecom Namibia (company): Key Financial IndicatorsTable 2.3: Telecom Namibia (company): Key Financial IndicatorsTable 2.3: Telecom Namibia (company): Key Financial IndicatorsTable 2.3: Telecom Namibia (company): Key Financial IndicatorsTable 2.3: Telecom Namibia (company): Key Financial IndicatorsTable 2.3: Telecom Namibia (company): Key Financial IndicatorsTable 2.3: Telecom Namibia (company): Key Financial Indicators
2005 2006 2007 2008 2009 2010
Revenue N$ million 1,055 1,058 1,061 1,081 1,130 1,161Taxation N$ million 48.1 61.8 27.9 33.1 9.2 18Net profit after tax (N$ million 84.6 112.3 23.2 80.1 25.6 69.7Total assets N$ million 1,267 1,781 2,040 2,231 2,325 2,534Shareholders’ Equity N$ million 627 980 1,015 1,062 1,088 1,158Dividend N$ million 24 17 0 0 0 0Asset Turnover 1.20 1.68 1.92 2.06 2.06 2.18Return on Equity 13.5% 11.5% 2.3% 7.5% 2.4% 6.0%Financial Leverage 2.02 1.82 2.01 2.10 2.14 2.19Profit Margin 8.0% 10.6% 2.2% 7.4% 2.3% 6.0%DELs in 1000 incl. public phones 139.0 136.2 138.2 145.4 148.7 157.1No of Public Phones 4930 6086 4,200 3,860 3,726 2,949Full-time Staff 1,463 1,306 1,069 1,025 1093 1073
Source: Telecom Namibia Annual ReportsSource: Telecom Namibia Annual ReportsSource: Telecom Namibia Annual ReportsSource: Telecom Namibia Annual ReportsSource: Telecom Namibia Annual ReportsSource: Telecom Namibia Annual ReportsSource: Telecom Namibia Annual Reports
The results for Namibia, the telecom sector and consumers have been spectacular. Lower prices through competition have led to an expansion of the market and everyone has benefited, consumers, operators and the Namibian economy in general.International bandwidth capacity will be increased dramatically in 2012 through the landing of two competing submarine data cables, the West Africa Cable System (WACS) and Africa Coast to Europe (ACE). Faster and cheaper Internet access will shift the communication behaviour of Namibians.Key challenges for the years ahead include building the institutional capacity of CRAN and creating a market structure that creates access opportunities for all Namibians at affordable costs. Efficient spectrum management is another challenge with entails great potential for universal service.
Universal Service Baseline Study 5

Universal Service Baseline Study 6
Table 2.2: Time LineTable 2.2: Time Line
Year Events
1992
Post and Telecoms Act passed with MWTC as line ministryNamibia Post and Telecoms Holdings (NPTH) establishedTelecom Namibia establishedBo Eklöf appointed MD of Telecom NamibiaNamibian Communications Commission established under MIB
1995 Mobile Telecommunications (MTC) established with Swedish technical partners Telia and SwedfundPer Eriksson appointed MD of MTC
1996 Theo Mberirua appointed MD of Telecom Namibia
1998 Bertil Guve replaces Per Eriksson as MD of MTC
1999 Telecommunications Policy and Regulatory Framework adopted envisaging liberalisation by 2004 and second mobile operatorMTC introduces Tango prepaid service
2000 NCC nominated to coordinate second cellular licence
2001 Bengt Strenge appointed MD of MTC
2002 Draft Communications Bill introduced to make way for Communications Authority of Namibia (CAN)
2002 Frans Ndoroma appointed MD of Telecom Namibia
2003 Deadline for granting second cellular licence missed
2004
Namibia Communications Commission Amendment Act passedTelia Overseas AB and Swedfund International AB sell 49% of MTC to NPTH for approximately N$500 millionGranting of second cellular licence delayedTelecom Namibia enters agreement with Mundo Startel of Angola
2005 Deadline for second fixed-line licence missedTelecom Namibia signs agreement with VSNL/Tata for the Second National Operator in South Africa
2006
Portugal Telecom buys 34% of MTC for N$1.02 billionPowerCom (Leo) awarded second cellular licence and announces SIM cards will be out by end of the yearMac Allman appointed MD of LeoJosé Ferreira replaces Bengt Strenge as MD of MTCTelecom Namibia introduces Switch fixed-wireless serviceMTC launches 3G broadband service
2007Leo officially launches serviceLars-Christian Luel appointed MD of LeoMiguel Geraldes appointed MD of MTC
2008Ministry of Information and Broadcasting changed to Ministry of Information and Communication TechnologyJoel Kaapanda appointed MinisterTelecom launches bond programme
2009
Orascom buys LeoSoban Pasha appointed MD of LeoCabinet lifts restrictions on SwitchNCC regulates interconnection chargesLeo tenders for BEE partnersCellOne renamed LeoMTC and Leo awarded international voice licencesTelecom granted credit rating by Fitch RatingsCommunications Act passedCommunications Regulatory Authority of Namibia (CRAN) board appointed
2010 June: Minister seeks help from ITU to fine tune Communications ActJuly: Gerhard May appointed MD of Leo
2011 March: NCC enforces a retail price up for mobile prices, requiring off-net prices and fixed-line prices to be equal to on-net pricesMay: Communications Act 8 of 2009 commences, establishing the new regulator CRAN
Note: MWTC (Ministry of Works, Transport and Communication) MIB (Ministry of Information and Broadcasting) Timeline expanded from Sherbourne & Stork (2010)
Note: MWTC (Ministry of Works, Transport and Communication) MIB (Ministry of Information and Broadcasting) Timeline expanded from Sherbourne & Stork (2010)
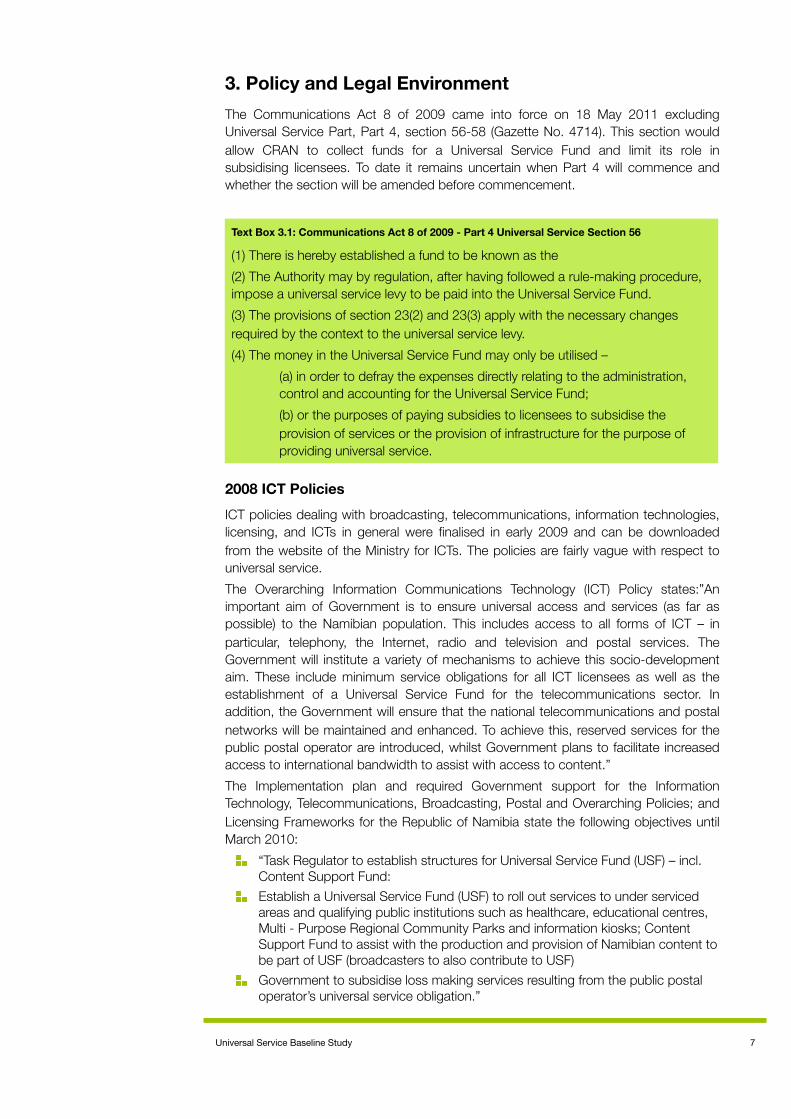
3. Policy and Legal EnvironmentThe Communications Act 8 of 2009 came into force on 18 May 2011 excluding Universal Service Part, Part 4, section 56-58 (Gazette No. 4714). This section would allow CRAN to collect funds for a Universal Service Fund and limit its role in subsidising licensees. To date it remains uncertain when Part 4 will commence and whether the section will be amended before commencement.
2008 ICT PoliciesICT policies dealing with broadcasting, telecommunications, information technologies, licensing, and ICTs in general were finalised in early 2009 and can be downloaded from the website of the Ministry for ICTs. The policies are fairly vague with respect to universal service.The Overarching Information Communications Technology (ICT) Policy states:”An important aim of Government is to ensure universal access and services (as far as possible) to the Namibian population. This includes access to all forms of ICT – in particular, telephony, the Internet, radio and television and postal services. The Government will institute a variety of mechanisms to achieve this socio-development aim. These include minimum service obligations for all ICT licensees as well as the establishment of a Universal Service Fund for the telecommunications sector. In addition, the Government will ensure that the national telecommunications and postal networks will be maintained and enhanced. To achieve this, reserved services for the public postal operator are introduced, whilst Government plans to facilitate increased access to international bandwidth to assist with access to content.”The Implementation plan and required Government support for the Information Technology, Telecommunications, Broadcasting, Postal and Overarching Policies; and Licensing Frameworks for the Republic of Namibia state the following objectives until March 2010:
“Task Regulator to establish structures for Universal Service Fund (USF) – incl. Content Support Fund:Establish a Universal Service Fund (USF) to roll out services to under serviced areas and qualifying public institutions such as healthcare, educational centres, Multi - Purpose Regional Community Parks and information kiosks; Content Support Fund to assist with the production and provision of Namibian content to be part of USF (broadcasters to also contribute to USF)Government to subsidise loss making services resulting from the public postal operator’s universal service obligation.”
Text Box 3.1: Communications Act 8 of 2009 - Part 4 Universal Service Section 56
(1) There is hereby established a fund to be known as the(2) The Authority may by regulation, after having followed a rule-making procedure, impose a universal service levy to be paid into the Universal Service Fund.(3) The provisions of section 23(2) and 23(3) apply with the necessary changes required by the context to the universal service levy.(4) The money in the Universal Service Fund may only be utilised – (a) in order to defray the expenses directly relating to the administration, control and accounting for the Universal Service Fund; (b) or the purposes of paying subsidies to licensees to subsidise the provision of services or the provision of infrastructure for the purpose of providing universal service.
Universal Service Baseline Study 7

Table 3.1: Universal Service Related Policy Statements Table 3.1: Universal Service Related Policy Statements
Broadcasting Policy
Telecommunication Policy
Telecommunication Policy
Telecommunication Policy
Telecommunication Policy
Postal PolicyPostal PolicyPostal PolicyPostal Policy
The Government will establish a Universal Service Fund (USF) to, inter alia, assist with content production by local broadcasters in Namibia. The Regulatory Authority is mandated to manage the USF. All Namibian – licensed broadcasters are obliged to contribute to the USF. In turn, all local broadcasters may apply for financial support from the USF for local content production support grants.All telecommunications providers are required to contribute to the provision of universal service to achieve the Namibian Government’s developmental goals. A minimum set of services should be made available by licensees. Other contributions, whether financial or not, may also be required from licensees.The Government will establish a Universal Service Fund (USF) to fund the provision of services to unprofitable areas. The USF will be funded by a special levy on all telecommunications licensees. The USF will be administered by the Regulatory Authority who will promote universal service throughout areas of need in Namibia; promote and support schemes which themselves promote and support universal service in Namibia; make recommendations to the Minister of I&CT in relation to sector policy on universal service; conduct research into the international and regional development of electronic communications; set and evaluate annually the achievement of universal service goals in accordance with the funding policy; and advise the Regulatory Authority on any matter related to universal service. All licensed carriers can receive money from the USF if the carrier offers the universal services.Operators are encouraged to roll out services to high cost areas and qualifying public institutions such as healthcare, educational centres (for example schools, libraries), Multi - Purpose Regional Community Parks and information kiosks.The Government leads initiatives to increase broadband penetration to provide Internet access in Namibia. The regulatory framework must provide a licensing mechanism that will expand broadband access in underserved and marginalised areas.The Government has a fundamental obligation to ensure that a universal postal service, particularly within the rural areas, exist - even though these services may not be commercially viable.
The Regulatory Authority will issue a licence to the designated postal operator with set terms on which a Universal Service Obligation (USO) is imposed.The Government will subsidise loss making services resulting from the designated postal operator’s universal service obligation. The Government will analyse the cost of the universal service obligation and review the subsidy if it is satisfied that the designated postal operator has achieved internal efficiencies and diversified its services into new, more lucrative ICT services.The Government promotes more effective utilisation of postal infrastructure to serve as points of access to the global information society and will utilise this infrastructure post offices as Multi-Purpose Community Centres for ICT services where deemed necessary.
National Development Plan (NDP3)
The third National Development Plan has a chapter on the telecommunication sector and formulates the objectives summarised in the Table below. While the first objective was achieved by 2011, the latter two still require considerable attention and effort.
Table 3.2 ICT indicators of NDP3Table 3.2 ICT indicators of NDP3Table 3.2 ICT indicators of NDP3
Outcome Output Key Activities
Increased telecommunications service penetration
Expanded (i) mobile networks(ii) fixed and fixed wireless networks(iii) national backbone network
Increase penetration of cell phones from 31% to 50%Increased telecommunications service penetration
Expanded (i) mobile networks(ii) fixed and fixed wireless networks(iii) national backbone network
Increase cell phone population coverage from 95% to 99%Increased telecommunications service penetration
Expanded (i) mobile networks(ii) fixed and fixed wireless networks(iii) national backbone network
Increase DEL penetration (# of fixed telephone lines/100 people) from 6.8% to 10%
Vision 2030Vision 2030 blamed lack of competition, lack of international bandwidth and high cost of communication for Namibia’s poor ICT sector performance. Vision 2030 stressed the importance of the Telecommunication sector for Namibia but did not formulate concrete universal access or service targets.
Universal Service Baseline Study 8
Competition was introduced in 2006 and the cost of communication has decreased by up to 80% since Vision 2030 was formulated. International bandwidth capacity will be increased dramatically in 2012 through the West Africa Cable System (WACS) and Africa Coast to Europe (ACE) submarine cables landing in Namibia.
Millennium Development Goals
MDG GOAL 8 – DEVELOP A GLOBAL PARTNERSHIP FOR DEVELOPMENT (MDG, 2008) includes references to Namibia’s ICT infrastructure: “An indicator for the global partnership is the extent to which the population of a country is able to communicate internationally. Currently, 4.8% of the Namibian population are Internet users, compared to 1% to 2% in most other African countries. However, in the neighbouring countries of Botswana and South Africa the rates are 4.3% and 11.6%, respectively. Cellular phone subscribers (16 years and older) account for 49% of the population though there is a considerable urban/rural divide. Around a third of all households currently possess a fixed telephone line.” Objectives regarding ICT indicators are not formulated.
ICT Policy for EducationThe overall policy goals of the ICT Policy for Education (Gov 2005) are to:
“Produce ICT literate citizens; Produce people capable of working and participating in the new economies and societies arising from ICT and related developments; Leverage ICT to assist and facilitate learning for the benefit of all learners and teachers across the curriculum; Improve the efficiency of educational administration and management at every levelfrom the classroom, school library, through the school and on to the sector as a whole; Broaden access to quality educational services for learners at all levels of the education system; and to Set specific criteria and targets to help classify and categorise the different development levels of using ICT in education.”
Concrete policy objectives for ICT access at schools are formulated at five levels: a school at level 1 has at least a small computer room, and level 5 is a school with ICT focus. The policy states that all primary schools should be at least at level 2; an objective that has clearly not been achieved by 2011 given that some primary schools today still lack even electricity.
Regional Policy Co-ordination
Telecommunications Regulatory Association of Southern Africa (TRASA), Communications Regulatory Association of Southern Africa’s (CRASA) predecessor, issued universal access and service guidelines for SADC countries in 2002 (SADC 2002). The guidelines distinguish between universal access and universal service policies. CRASA is in the process of finalising a universal Access and Service tool kit called the “SADC Toolkit on Universal Access Funding and Universal Service Fund Implementation”. The project is supported by HIPSA: Harmonisation of ICT Policies in Sub-Sahara Africa. At the Same time HIPSA supports updated USA guidelines for SADC. It discusses licensing, regulatory reform, spectrum issues and Innovative supply-side strategies to achieve universal access and service. The draft guideline is comprehensive and is valuable for policy formulation by SADC ICT ministries.
Universal Service Baseline Study 9

Table 3.3: Universal Access and Service objectives (SADC 2002)Table 3.3: Universal Access and Service objectives (SADC 2002)
Universal Access Policy Universal Service Policy
To achieve affordable and equitable access to the information and communications network, applications and services at community level.
Achieve higher tele-density in both urban and rural areas.
To mobilise available resources in policy, regulation and funding to provide telecommunications access to the community.To increase expansion of learning opportunities, the acquisition and the provision and sharing of information.To achieve increased access to the information and communications network by all people in SADC in a way that enhances economic inclusion, participation, and regional and international dialogue.
Rollout obligations of Leo and MTC
Table 3.4: is part of the appendix of LEO’s licence (Government Gazette 11 August 2006 No. 3676) and details the share of population that LEO needs to cover in 2011 and in 2016. LEO also has obligations enshrined in its licence for geographical coverage with base stations and road coverage for the period 1-6 years after starting operation. 2012 will be the sixth year.
Table 3.4: LEO’s rollout obligationsTable 3.4: LEO’s rollout obligationsTable 3.4: LEO’s rollout obligationsTable 3.4: LEO’s rollout obligations
Region Population (as per 2001 Census)
% Population covered after 5 years
% Population covered after 10 years
Caprivi 79,852 20 32Erongo 107,629 60 82Hardap 67,998 70 71Karas 69,677 70 70Kavango 201,093 30 46Khomas 250,305 80 94Kunene 68,224 25 37Ohangwena 227,728 60 68Omaheke 67,496 25 27Omusati 228,364 50 86Oshana 161,977 40 80Oshikoto 160,788 30 55Otjozondjupa 135,723 55 69Total 1,826,854 36 68
MTC’s licence (Government Gazette 29 March 2007 No. 3815) merely mentions that: “The minimum coverage shall at all times be equivalent to the coverage as on the date of issue of this licence unless agreed in writing by the Authority.” This means that MTC is required to maintain its 95% population coverage it had in 2007. It has, however, pushed it to 98% without requirement to do so.
Conclusions
A comprehensive universal access and service policy is needed that sets concrete targets for CRAN to achieve. The policies from 2008/9 are vague and do not provide enough guidance for CRAN and or the Universal Service fund once established. The policies can only guide CRAN once part four of the Communications Act 8 of 2009 has commenced. The draft guidelines for the SADC region and the USA toolkit can provide a valuable input for policy formulation by the MICT.
Universal Service Baseline Study 10

4. Fixed-Line Based on the figures presented in the annual report of Telecom Namibia for the financial year ending September 2010; the number of installed fixed-lines in Namibia increased since 2006. Figure 4.1 displays Direct exchange lines (DELs) including public phones (which have been on the decline).
Figure 4.1: DELs including public Phones (Source:TN 2011)
The declining waiting list may be a good or a bad sign. It may represent a lack of interest in fixed lines or an increased ability of Telecom Namibia to meet demand. The 9000 new lines, the largest increase in the past 6 years, suggest the latter.
Figure 4.2: Waiting List (Source:TN 2011)
Based on survey results, about two-thirds of installed DELs were business DELs. The survey results show that residential fixed-lines are rapidly decreasing. Only 11.5% of Namibian households had a fixed-line in August 2011 and 9.2% of those that did not have one had previously had one. Nearly 33,000 households without a fixed-line phone had one previously.
Table 4.1: Household Fixed-line access (RIA 2011 survey)Table 4.1: Household Fixed-line access (RIA 2011 survey)Table 4.1: Household Fixed-line access (RIA 2011 survey)Table 4.1: Household Fixed-line access (RIA 2011 survey)
Namibia Urban Rural
Households with working fixed-line phoneHouseholds with working fixed-line phone
Prepaid
Post-paid
Households without a fixed-line phone that previously had a oneHouseholds without a fixed-line phone that previously had a one
Average Monthly Expenditure in N$
Total residential annual calls volume in million N$
46,586 39,764 6,822
11.5% 24.6% 2.8%
28.1% 23.2% 37.9%
71.9% 76.8% 62.1%
32,587 20,184 12,403
9.2% 17.0% 5.2%
269 291 121
154.2 145.5 8.7
The increase stated in the annual report of Telecom Namibia could be explained by growth in fixed-line connections to businesses. Fixed-lines remain important for
2005 2006 2007 2008 2009 2010
157,063148,672145,360138,171136,163138,997
2005 2006 2007 2008 2009 2010629
1,410
2,8293,1003,8443,521
Universal Service Baseline Study 11

business as a point of contact, for sending and receiving faxes, telephone calls and for broadband Internet access. In urban areas 24.6% of households had a working fixed-line, whilst only 2.8% had one in rural areas. The majority of those fixed-line connections were post-paid (72% on national level). This is in stark contrast to mobile phones where the vast majority of active SIM cards are prepaid (92%).The pre-paid product offered by Telecom Namibia lacks a key characteristic in comparison to mobile prepaid products. A poor person may have a pre-paid mobile since no mandatory payments are required, while a poor household may still not be able to afford a prepaid fixed-line phone since Telecom Namibia requires regular top-ups or cuts the line. Non-income barriers further contribute to its low adoption rate. Telecom Namibia requires for a residential fixed-line or ADSL application the following documents:
Identity Card or PassportDeed of Sale / Rental AgreementMarriage CertificateProof of income / financial statementsSecurity deposit
Businesses additionally are required to provide company registration and a declaration of joint liability. These non-income barriers make it difficult for the majority of Namibians to get access to fixed-voice and fixed-broadband services. Few Namibians have bank accounts and many live without rental agreements or ownership of the land they occupy. True prepaid fixed voice and broadband products would overcome this bottleneck.Households without a fixed-line phone were asked what the reasons were why they didn’t have one and 75% stated that the household uses mobiles instead, 35% indicated that fixed-line phones were not available where they live and 54% stated that they cannot afford to have one.
Figure 4.3 : Reasons why a household does not have a fixed-line phone in % (RIA 2011 survey)
AffordabilityWhen asked how households would adjust to a reduction in call rates, 23% stated that they would make more calls, 30% would use the savings for something else, and 39% would both make more calls and use some of the savings for something else. This indicates that fixed-line prices may be inelastic, i.e. a 1% decrease in call rates may lead to less than a 1% increase in call volume.
We use mobile phones
Fixed phones are not available where I live
No regular income
Cannot afford one
Too long wait for a fixed line 22.1%
53.5%
45.6%
34.9%
75.1%
Universal Service Baseline Study 12

Figure 4.4: How households would respond to cheaper calls (RIA 2011 survey)
Household Internet AccessTelecom Namibia3 had 13,274 ADSL customers at the end of the 2010 financial year. The late reselling of ADSL through ISPs and low margins offered by Telecom Namibia to ISPs are to blame for the slow uptake.
Table 4.2: Broadband statsTable 4.2: Broadband statsTable 4.2: Broadband stats
Financial year ending 2010
Telecom Namibia (TN 2011)Number of connected ADSL ports
Telecom Namibia (TN 2011)Total number of ADSL Ports
MTC (MTC2011a)Wireless access via computer
MTC (MTC2011a)Wireless access via mobile phone
13,274
22,657
more than 50,000
more than 250,000
ADSL is mostly used by high income households due to its high cost and it being postpaid. Also ADSL based Internet access is usually used with laptop or computer which adds another barrier to household use. A USB modem is the direct competitor to ADSL, allowing computer or laptop based Internet access. MTC states in its 2010 Annual report (MTC 2011a) that it has more than 50,000 subscribers for its wireless broadband product Netman. These are USB dongle products that are being used with laptops or computers. The household survey showed that out of 47,764 households with a working fixed-line connection in 2011, 28,561 used a 3G USB modem. This could have been from Leo, Telecom Namibia or MTC. The difference between the household figure and MTCs annual report could be explained through business use of wireless 3G modems.
Gap AnalysisThe gap analysis addresses access and usage gaps. 149,353 households without a fixed-line phone would be interested in getting one. These households are on average willing and able to spend N$103 per month, leading to an untapped market of N$15.4 million. The largest chunk, N$8 million per month, of this untapped market sits in rural areas and N$7.2 million in urban areas. This means that 53,028 additional households could be connected to fixed-lines if product offerings were more attractive. The other 96,000 households that would be willing and able to spend on average N$85 in a month but are located in rural areas could most likely not be served profitably.
make more calls use the saved money for something else both do not know
8%
39%
30%
23%
Universal Service Baseline Study 13
3 Telecom Namibia is the only fixed-line provider in Namibia and therefore the only operator offering ADSL.
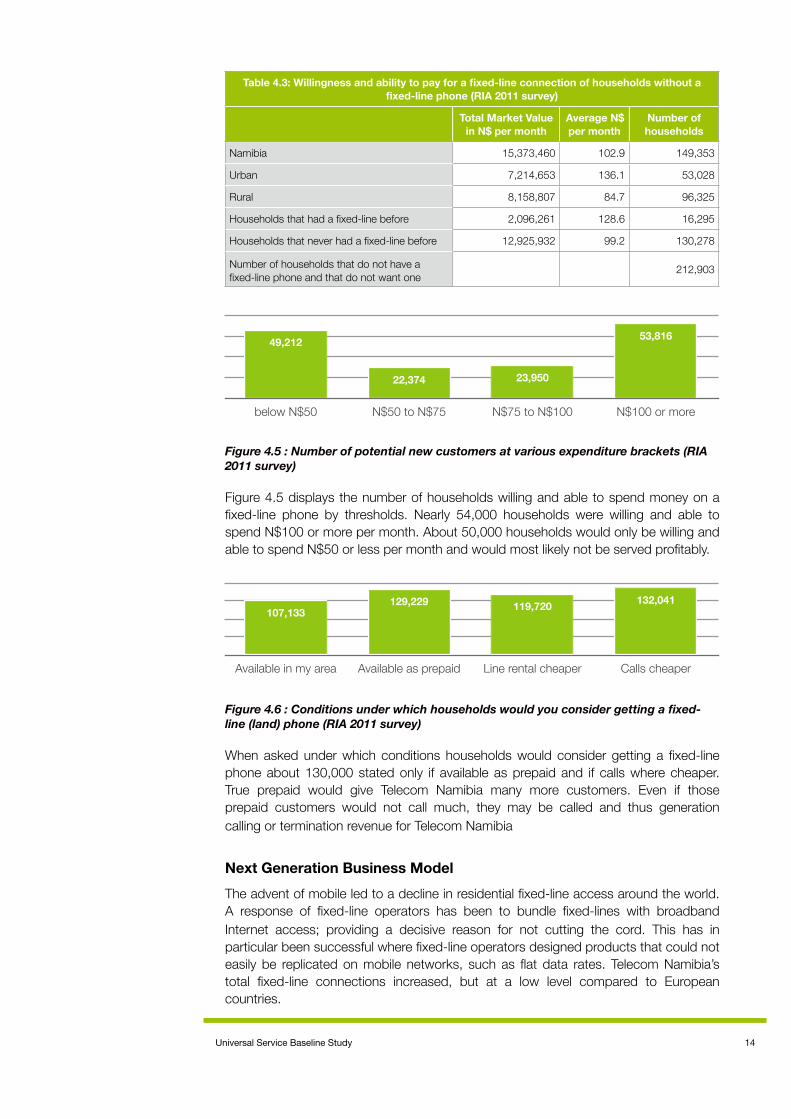
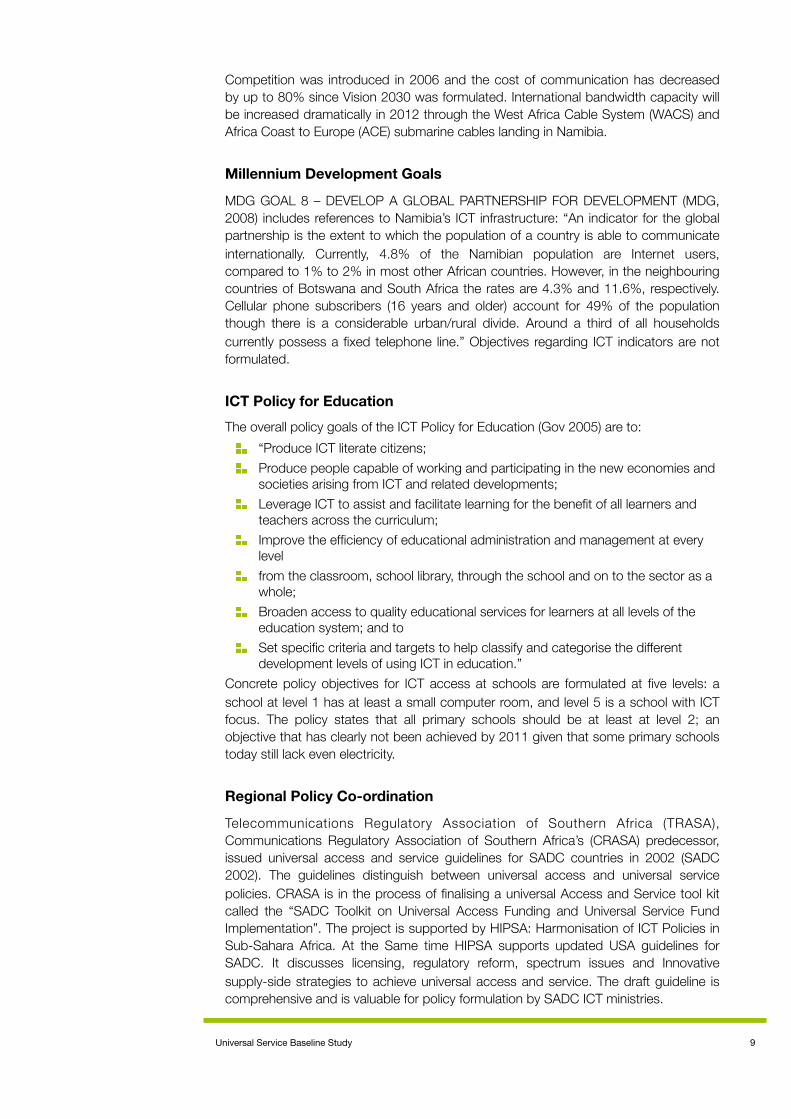
Table 4.3: Willingness and ability to pay for a fixed-line connection of households without a fixed-line phone (RIA 2011 survey)
Table 4.3: Willingness and ability to pay for a fixed-line connection of households without a fixed-line phone (RIA 2011 survey)
Table 4.3: Willingness and ability to pay for a fixed-line connection of households without a fixed-line phone (RIA 2011 survey)
Table 4.3: Willingness and ability to pay for a fixed-line connection of households without a fixed-line phone (RIA 2011 survey)
Total Market Value in N$ per month
Average N$ per month
Number of households
Namibia
Urban
Rural
Households that had a fixed-line before
Households that never had a fixed-line before
Number of households that do not have a fixed-line phone and that do not want one
15,373,460 102.9 149,353
7,214,653 136.1 53,028
8,158,807 84.7 96,325
2,096,261 128.6 16,295
12,925,932 99.2 130,278
212,903
Figure 4.5 : Number of potential new customers at various expenditure brackets (RIA 2011 survey)
Figure 4.5 displays the number of households willing and able to spend money on a fixed-line phone by thresholds. Nearly 54,000 households were willing and able to spend N$100 or more per month. About 50,000 households would only be willing and able to spend N$50 or less per month and would most likely not be served profitably.
Figure 4.6 : Conditions under which households would you consider getting a fixed-line (land) phone (RIA 2011 survey)
When asked under which conditions households would consider getting a fixed-line phone about 130,000 stated only if available as prepaid and if calls where cheaper. True prepaid would give Telecom Namibia many more customers. Even if those prepaid customers would not call much, they may be called and thus generation calling or termination revenue for Telecom Namibia
Next Generation Business ModelThe advent of mobile led to a decline in residential fixed-line access around the world. A response of fixed-line operators has been to bundle fixed-lines with broadband Internet access; providing a decisive reason for not cutting the cord. This has in particular been successful where fixed-line operators designed products that could not easily be replicated on mobile networks, such as flat data rates. Telecom Namibia’s total fixed-line connections increased, but at a low level compared to European countries.
below N$50 N$50 to N$75 N$75 to N$100 N$100 or more
53,816
23,95022,374
49,212
Available in my area Available as prepaid Line rental cheaper Calls cheaper
132,041119,720129,229107,133
Universal Service Baseline Study 14
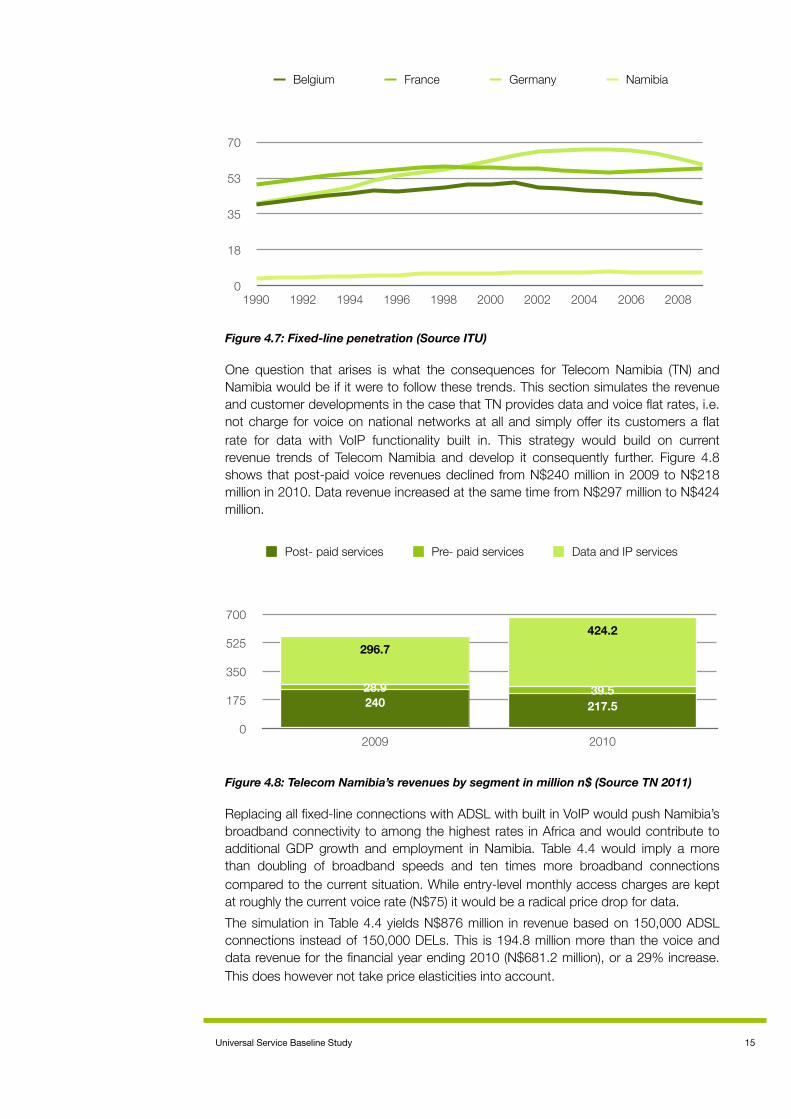
Figure 4.7: Fixed-line penetration (Source ITU)
One question that arises is what the consequences for Telecom Namibia (TN) and Namibia would be if it were to follow these trends. This section simulates the revenue and customer developments in the case that TN provides data and voice flat rates, i.e. not charge for voice on national networks at all and simply offer its customers a flat rate for data with VoIP functionality built in. This strategy would build on current revenue trends of Telecom Namibia and develop it consequently further. Figure 4.8 shows that post-paid voice revenues declined from N$240 million in 2009 to N$218 million in 2010. Data revenue increased at the same time from N$297 million to N$424 million.
Figure 4.8: Telecom Namibia’s revenues by segment in million n$ (Source TN 2011)
Replacing all fixed-line connections with ADSL with built in VoIP would push Namibia’s broadband connectivity to among the highest rates in Africa and would contribute to additional GDP growth and employment in Namibia. Table 4.4 would imply a more than doubling of broadband speeds and ten times more broadband connections compared to the current situation. While entry-level monthly access charges are kept at roughly the current voice rate (N$75) it would be a radical price drop for data.The simulation in Table 4.4 yields N$876 million in revenue based on 150,000 ADSL connections instead of 150,000 DELs. This is 194.8 million more than the voice and data revenue for the financial year ending 2010 (N$681.2 million), or a 29% increase. This does however not take price elasticities into account.
Belgium France Germany Namibia
0
18
35
53
70
1990 1992 1994 1996 1998 2000 2002 2004 2006 2008
Post- paid services Pre- paid services Data and IP services
0
175
350
525
700
2009 2010
424.2296.7
39.528.9217.5240
Universal Service Baseline Study 15

Table 4.4: Data and Voice Flat
Technology
Table 4.4: Data and Voice FlatTable 4.4: Data and Voice FlatTable 4.4: Data and Voice FlatTable 4.4: Data and Voice FlatTable 4.4: Data and Voice Flat
Current prices N$ 24 months
New Price N$ Price drop Lines New revenue in
million N$
Residential Flat Rate 512k
Residential Flat Rate 1MB
Residential Flat Rate 4 MB
Residential Flat Rate 20MB*
Corporate Lines 20 MB*
Total per month
Total per Year
699 75 89% 20,000 1.5
999 150 85% 10,000 1.5
4,749 350 93% 10,000 3.5
10,599 650 94% 10,000 6.5
10,599 600 94% 100,000 60
73
876
* Based on10240k product of TN* Based on10240k product of TN* Based on10240k product of TN* Based on10240k product of TN* Based on10240k product of TN
With free VoIP calls between fixed-lines and VoIP international calls in addition to unlimited data download at faster than current speeds for about 90% less than current ADSL lines the demand for such fixed connectivity is likely to increase considerably. A 512k ADSL connection currently costs N$899 on a 12 month contract and N$699 on a 24 month contract. In the simulation on Table 4.4 the cost is N$75 without contractual obligation. Contractual obligations would only be required in order to subsidise hardware, not to retain customers since the service offering would be very competitive. This equals a price drop of 89%. Table 4.5 shows the results assuming price elasticity, i.e. an 89% drop in access prices results in an 89% increase in subscribers. Price elasticity is supported by additional benefits like free unlimited voice calls to the national network. The current revenue would more than double in this scenario. TN would have 290,000 instead of 150,000 customers as a result.
Table 4.5: Data and Voice Flat assuming price elasticity
Technology
Table 4.5: Data and Voice Flat assuming price elasticityTable 4.5: Data and Voice Flat assuming price elasticityTable 4.5: Data and Voice Flat assuming price elasticityTable 4.5: Data and Voice Flat assuming price elasticityTable 4.5: Data and Voice Flat assuming price elasticity
Current prices N$ 24 months
New Price N$
Price change Lines Revenue in
million N$
Residential Flat Rate 512k
Residential Flat Rate 1MB
Residential Flat Rate 4 MB
Residential Flat Rate 20MB*
Corporate Lines 20 MB*
Total per month
Total per Year
699 75 89% 37,854 2.8
999 150 85% 18,498 2.8
4,749 350 93% 19,263 6.7
10,599 650 94% 19,387 12.6
10,599 600 94% 194,339 117
142
1,699
* based on10240k product of TN* based on10240k product of TN* based on10240k product of TN* based on10240k product of TN* based on10240k product of TN
The simulation deals only with revenues and not the cost of providing 150,000 ADSL lines. Such a strategy could however prove to be more profitable for TN than defending the fixed-voice market, a battle that is already lost. A data only approach and a fast roll-out of ADSL to 150,000 households would yield a significant economic impetus and help Namibia gain international competitive advantage.
Conclusions
Closing the fixed-line gap in Namibia would not require policy change or subsidies but a change in the business strategy of Telecom Namibia. Telecom Namibia could serve Namibia better while becoming more profitable by adopting a next generation business model. Telecom Namibia’s copper cables to homes are highly under-utilised national assets.
Universal Service Baseline Study 16

5. Mobile PhoneMTC announced in its latest annual report (MTC 2011a) that it had 1.5 million subscribers. In its media release from July 2011 it reported over 1.6 million active subscribers (MTC 2011b). Leo and Telecom Namibia do not publish their subscriber numbers. Leo states that it has 15% market share, of 1.6 million mobile phone users; that would be about 225,000 customers. Operators can however only report on active SIM cards and not on actual users. It is worth noting that significant amounts of people may have more than one SIM card. The operator figures would otherwise suggest a penetration in Namibia of nearly 100% of the population. This while the household survey reveals that only 56% of Namibians 15 years or older owned a mobile phone. The survey figures underestimate the number of users by limiting the numbers to Namibians 15 years or older, while qualitative research shows that mobile phone use is also prevalent in younger age groups.
Figure 5.1: MTC Active SIM cards in 1000 (MTC 2011a )
Prepaid is still by far the most popular payment type with 92% of all mobile owners using it. Among those living in rural areas and among the Bottom of the Pyramid (BOP4) it is 98.6%.Mobile Internet is popular in Namibia and is on the way to become the dominant form of accessing the Internet. 23% of Namibians with a mobile phone used it to browse the Internet and 17% for using social networking applications, i.e. about 180,000 mobile Internet users above the age of 15. MTC claims to have more than 250,000 mobile subscribers that access the Internet (MTC 2011a). The difference to the survey figures may lie in those under 15 years old using mobile Internet and / or duplicated SIM cards of mobile Internet users. Mobile communication via social networks such as Facebook is more popular compared to sending and receiving emails.Even 19.6% of the BOP used their mobiles to surf the Internet and 12.4% for social networking. Comparing the BOP to rural residence indicates that the BOP own and use ICTs more than rural dwellers, who are mostly BOP as well.
2000 2001 2002 2003 2004 2005 2006 2007 2008 2009 2010
15351284
1009744
556404344
22414310771
Universal Service Baseline Study 17
4 BOP is explained in the appendix.

Table 5.1: Mobile Phone Owners 2011 (RIA 2011 survey)Table 5.1: Mobile Phone Owners 2011 (RIA 2011 survey)Table 5.1: Mobile Phone Owners 2011 (RIA 2011 survey)Table 5.1: Mobile Phone Owners 2011 (RIA 2011 survey)Table 5.1: Mobile Phone Owners 2011 (RIA 2011 survey)Table 5.1: Mobile Phone Owners 2011 (RIA 2011 survey)Table 5.1: Mobile Phone Owners 2011 (RIA 2011 survey)Table 5.1: Mobile Phone Owners 2011 (RIA 2011 survey)Table 5.1: Mobile Phone Owners 2011 (RIA 2011 survey)
NamibiaNamibia RuralRural UrbanUrban BOPBOP
% N % N % N % N
15 years or older with a mobile phone
With a handset that capable of browsing the Internet
Share of mobile phone owners with prepaid SIM card
15 years or older with more than one SIM card
Share of mobile phone owners that use their mobile for browsing the Internet
Share of mobile phone owners that use their mobile to read and write emails
Using mobile for accessing social networking applications such as Facebook, Twitter, Mixit or others
Namibians 15 years or older that would change their provider if they could keep their number
Aggregated monthly mobile expenditure N$
Aggregated annual mobile expenditure N$
56.2% 792,012 46.1% 437,463 76.7% 354,549 46.5% 324,145
26% 203,685 10.7% 46,917 45.0% 156,768 19.6% 63,062
91.8% 722,853 98.9% 432,815 82.9% 290,038 98.6% 320,312
7.2% 56,854 4.4% 18,943 10.8% 37,911 6.1% 19,883
22.7% 178,288 10.1% 43,975 38.6% 134,312 19.6% 21,405
12.3% 96,246 3.2% 13961 23.7% 82,285 6.6% 16,252
17.3% 135,951 4.9% 21,403 32.8% 114,548 12.4% 40,334
9.6% 74,997 7% 29,443 13.1% 45,554 10.4% 33,318
98,385,78798,385,787 29,672,96529,672,965 68,712,82268,712,822 20,833,30820,833,308
1,180,629,4441,180,629,444 356,075,580356,075,580 824,553,864824,553,864 249,999,696249,999,696
Duplicated Sim CardsSeveral reasons may lead to someone wanting to have more than one active SIM card. First, postpaid MTC subscribers cannot transfer airtime to prepaid subscribers due to the VAT that is charged on prepaid airtime and the complexity involved in this. Sending airtime to family members and friends would require a postpaid subscriber to purchase a prepaid card as well. A second reason is the number of different promotions run by operators. Namibians may not only hold prepaid SIM cards from different operators but even multiple SIM cards from the same operator to utilise promotions.In the past off-net on-net price differentials were another reason to hold multiple SIM cards – in order to always be able to call on-net. The NCC capped retail prices to on-net rates in March 2011 (NCC 2011). Not allowing operators to discriminate in their retail prices against other networks removed that reason for duplicated SIM cards. As a result only 57,000 Namibians 15 years or older held more than one SIM card in July 2011.
Universal Service Baseline Study 18

CoverageMTC claims it covers 98% of Namibia’s population with more than 650 base stations (MTC 2011b). The map below displays MTC’s network coverage as corrected in 2009. Telecom Namibia has 178 towers, nearly as many as Leo, which has about 200 base stations.
Figure 5.2: MTC Coverage5
Figure 5.3: LEO’s coverage Map6
Universal Service Baseline Study 19
5 http://www.mtc.com.na/images/coverage/A4_Coverage%20Map.jpg6 http://www.leo.na/About%20Us/presence.htm

Telecom Namibia Limited Annual Report 2009/106
Telecom Namibia Network Map
Figure 5.4: Telecom Namibia’s Network Infrastructure
Figures 5.2 and 5.3 show that Leo and Telecom Namibia cover most urban areas with their networks and reach into populous rural areas close to urban areas also.In terms of voice coverage Namibia can be considered as having achieved universal access with a prepaid mobile coverage of 98% of the population, i.e. network availability and a product suitable for the poor (prepaid). The infrastructure challenges facing universal service might therefore be in data.Not all base stations installed in Namibia maybe ideal for data use. 3G services are, for example, mainly available in urban centres. Though EDGE is usually fast enough for basic mobile Internet use.
AffordabilityThe majority of Namibia’s mobile phone owners would make more calls but also use some of the saving for something else if calls become cheaper (49%). A quarter (26%) would just call more, thus indicating that they cannot afford to make as many calls at present as they wish. Another quarter would make the same amount of calls as they currently do and use the money saved for something else.
Universal Service Baseline Study 20

Figure 5.6: How owners of mobile phones will react to cheaper calls (RIA 2011 survey)
When asked how concretely they would change their calling behaviour if call prices were halved, 48% of Namibian would slightly increase their usage, 30% would double it and 9% would more than double it.
Figure 5.7: How owners of mobile phones will react halved calling prices (RIA 2011 survey)
The response to prices doubling is more dramatic with 21% of Namibians stating that they would reduce usage by more than half and 31% decrease it by half. Only 11% would not change their usage.
make more calls use the saved money for something else both
49%
24%
26%
unchanged phone usage slight increasedouble my phone usage more than double my phone usage
9%
30%
48%
13%
Universal Service Baseline Study 21

Figure 5.8: How owners of mobile phones will react to doubling of calling prices (RIA 2011 survey)
Figure 5.9 shows the cost of OECD usage bundles for the cheapest postpaid or prepaid MTC product. The prices for Tango Prepaid per second were slashed by more than half in December 2009, and a new, substantially cheaper postpaid product was introduced in early 2010, effectively reducing MTC prices again. MTC’s and Leo’s 38 cents campaigns are not reflected in this comparison. The comparison shows that prices of MTC have consistently decreased with increased competition from Leo and Telecom Namibia.
Figure 5.9: MTC cheapest product for OECD usage baskets - 2006 definition
unchanged phone usage slight decreasereduce phone usage by half reduce my phone usage by more than half
21%
31%
37%
11%
Sep-05 Dec-08 May-10 Mar-11 Mar-11 (in Sep 2005 prices)
0
75
150
225
300
Low User Medium User High User
683535
97
5050
146
5050
179
11979
296
174
83
Universal Service Baseline Study 22

Gap AnalysisOf Namibians without a mobile phone, 41% had used one in the past three months and 28% owned an active SIM card. Among the BOP those that used a mobile in the past three months was even 48.5%. During the first half of 2012 133,000 Namibians without a mobile phone planned to get one. Another 125,000 plan to get one later in 2012. The figures show that mobile phones are used widely, even by those that cannot afford their own mobile handset.
Table 5.2: Namibians 15 years or older that do not own a mobile handset in 2011 (RIA 2011 survey)
Table 5.2: Namibians 15 years or older that do not own a mobile handset in 2011 (RIA 2011 survey)
Table 5.2: Namibians 15 years or older that do not own a mobile handset in 2011 (RIA 2011 survey)
Table 5.2: Namibians 15 years or older that do not own a mobile handset in 2011 (RIA 2011 survey)
Table 5.2: Namibians 15 years or older that do not own a mobile handset in 2011 (RIA 2011 survey)
Table 5.2: Namibians 15 years or older that do not own a mobile handset in 2011 (RIA 2011 survey)
Table 5.2: Namibians 15 years or older that do not own a mobile handset in 2011 (RIA 2011 survey)
Table 5.2: Namibians 15 years or older that do not own a mobile handset in 2011 (RIA 2011 survey)
Table 5.2: Namibians 15 years or older that do not own a mobile handset in 2011 (RIA 2011 survey)
Table 5.2: Namibians 15 years or older that do not own a mobile handset in 2011 (RIA 2011 survey)
NamibiaNamibia RuralRural UrbanUrban BOPBOP
% N % N % N % N
Namibians 15 years or older without a mobile phone but with an active SIM card
Namibians 15 years or older without a mobile phone but with an active SIM cardNamibians 15 years or older without a mobile phone that used a mobile in the past three months
Namibians 15 years or older without a mobile phone that used a mobile in the past three months
Reasons for not having a mobile phone
I cannot afford it
Reasons for not having a mobile phone
No mobile coverage where I live
Reasons for not having a mobile phone
No electricity at home to charge the mobile phone
Reasons for not having a mobile phone
I don't have anyone to call
Reasons for not having a mobile phone
My phone in broken
Reasons for not having a mobile phone
My phone got stolen
Namibians 15 years or older intending to buy a mobile phone
Within the next 6 months
Namibians 15 years or older intending to buy a mobile phone
Within the next year
Namibians 15 years or older intending to buy a mobile phone
Within the next 2 years
28.4% 147,595 11.7% 111,411 7.8% 36,184 31.5% 97,600
41.4% 255,931 37.1% 189,687 61.9% 66,244 48.2% 179,312
71.9% 443,377 75.0% 381,906 57.2% 61,471 80.7% 299,025
15.3% 94,767 18.3% 93,233 0% 0 15.1% 56,114
73.2% 452,250 81.8% 417,849 32.0% 34,401 78.1% 290,677
17.7% 109,670 18.3% 93,583 15.0% 16,087 16.4% 60,957
16.8% 103,387 15.3% 77,841 23.8% 25,546 14.6% 54,306
10.1% 61,474 7.3% 36,333 23.7% 25,141 8.2% 29,534
21.5% 133,399 18.2% 93,623 37.4% 39,776 18.5% 68,616
20.1% 124,629 21.3% 109,145 14.6% 15,483 28.9% 107,391
12.5% 77,621 12.4% 63,887 12.9% 13,735 17.0% 63,079
Several reasons were mentioned by Namibians 15 years or older for not having a mobile phone at the time of the survey. 72% stated that they cannot afford one, 15.3% that there was no coverage in the area where they live, 74% because of not having electricity at home, 17% said their mobile was broken and 10% because the mobile got stolen.Table 5.3 displays the willingness and ability to pay for mobile handsets and monthly mobile usage of Namibians 15 years or older that do not currently own a mobile handset. Namibians without a handset are on average prepared to spend N$140 for a handset and spend N$30 a month. Those that used a handset in the past three month are willing and able to spend more than average on a handset as well as on usage. Those that did not use a mobile in last three month are below average. The untapped market for mobile handsets is about N$87 million and for monthly usage about N$19 million.The willingness and ability to pay of Namibians that stated they cannot afford a mobile phone was on average N$114 for the handset and N$26 for monthly use.
Universal Service Baseline Study 23

Table 5.3: Willingness and ability to pay for a mobile handset and mobile usage of Namibians without a mobile (RIA 2011 survey)
Table 5.3: Willingness and ability to pay for a mobile handset and mobile usage of Namibians without a mobile (RIA 2011 survey)
Table 5.3: Willingness and ability to pay for a mobile handset and mobile usage of Namibians without a mobile (RIA 2011 survey)
Table 5.3: Willingness and ability to pay for a mobile handset and mobile usage of Namibians without a mobile (RIA 2011 survey)
Table 5.3: Willingness and ability to pay for a mobile handset and mobile usage of Namibians without a mobile (RIA 2011 survey)
Total Market Value in N$ Average N$ Number of
individuals
AllWTP mobile handset
AllWTP mobile monthly usage
Did not use a mobile in past three months
WTP mobile handsetDid not use a mobile in past three months WTP mobile monthly usage
Used a mobile in past three month
WTP mobile handsetUsed a mobile in past three month WTP mobile monthly usage
UrbanWTP mobile handset
UrbanWTP mobile monthly usage
RuralWTP mobile handset
RuralWTP mobile monthly usage
BOPWTP mobile handset
BOPWTP mobile monthly usage
Namibians that stated they could not afford one
WTP mobile handsetNamibians that stated they could not afford one WTP mobile monthly usage
86,841,448 140.36618,705
18,976,642 30.67618,705
26,224,278 72.94359,530
6,629,664 18.44359,530
60,412,309 236.05255,931
12,319,603 48.14255,931
30,435,862 281.38108,165
5,711,733 52.81108,165
56,405,586 110.48510,540
13,264,909 25.98510,540
54,625,006 146.78372,168
11,976,661 32.18372,168
50,419,557 113.53444,103
11,714,678 26.38444,103
Figure 5.10 displays the number of Namibians wiling able to pay thresholds for a handsets. The somewhat puzzling result is that above 200,000 Namibians would be willing and able to spend above N$150 for and handset. Namibian operators offer a basic handset for N$149 and it should hence be possible to cater for this segment. Possible reasons for the unmet demand could be that cheap handsets do not reach everywhere in Namibia and that they are not everywhere available. Namibians in remote parts of the country may also not be aware of these offers.
Figure 5.10 : Number of potential hand-set owners at various handset prices (RIA 2011 survey)
Another factor explaining the N$150+ segment is that not everyone among those without a mobile phone belongs to the bottom of the pyramid. About 25% had a mobile before for example and may safe up for a new phone with better specifications than the basic N$149 handset.
do not want a mobile below N$50 N$50 to N$100 N$100 to N$150 above N$150
213,315
91,288
40,40012,149
261,553
Universal Service Baseline Study 24
Figure 5.11 : Number of potential mobile subscribers at various monthly calling budgets (RIA 2011 survey)
Of all Namibians without a handset, 113,000 would be willing and able to spend between N$50 and N$100 a month and 13,000 even more than N$100.
Figure 5.12: Namibians asked whether they plan to get a mobile in future (RIA 2011 survey)
More than half of Namibians without a mobile phone are planning to get one soon, 133,000 within the next 6 months, 125,000 within the next year and 78,000 within the next 2 years.
Conclusions
The voice gap has mostly been closed in Namibia through prepaid mobile, both in terms of network infrastructure and affordability. Those without a handset plan to get one in future and handsets are globally available at prices that Namibians without a handset are willing and able to spend. Challenges remain with respect to the data gap. Only a quarter of mobile phone users own a handset that is cable of browsing the Internet. Among the BOP it is just below a quarter.
do not want a mobile below N50 N50 to N100 N100+
13,281
113,034
207,588
284,802
no within next 6 months within next year within next 2 years
77,621
124,629
133,399
284,205
Universal Service Baseline Study 25

6. Public Phone Access & UsageTelecom Namibia’s network of public phones has been in decline since 2006. In 2010 only 3000 public phones were in operation compared to more than 6000 in 2006.
Figure 6.1: Number of public phones operated by Telecom Namibia (Source TN 2010)
The proliferation of mobile phones in Namibia implies a reduced demand for public phones due to increasing individual access. Only 1.3%; barely 18,000 Namibians 15 years or older used public phones in the second half of 2011. The main reason for not using public phones was the use of one’s own mobile. Among rural users public phone usage was less and among the BOP more at 0.5% and 1.6% respectively.
Table 6.1: Public Phone use (RIA 2011 survey)Table 6.1: Public Phone use (RIA 2011 survey)Table 6.1: Public Phone use (RIA 2011 survey)Table 6.1: Public Phone use (RIA 2011 survey)Table 6.1: Public Phone use (RIA 2011 survey)Table 6.1: Public Phone use (RIA 2011 survey)Table 6.1: Public Phone use (RIA 2011 survey)Table 6.1: Public Phone use (RIA 2011 survey)Table 6.1: Public Phone use (RIA 2011 survey)Table 6.1: Public Phone use (RIA 2011 survey)
NamibiaNamibia RuralRural UrbanUrban BOPBOP
N % N % N % N %
Namibians 15 years or older that used public phones during the past three months
Namibians 15 years or older that used public phones during the past three months
Reasons for not using Public Phones
too inconvenient to use
Reasons for not using Public Phones
not safe to use at night
Reasons for not using Public Phones
too expensiveReasons for not using Public Phones
lack of privacy
Reasons for not using Public Phones I prefer to use
the household phone
Reasons for not using Public Phones
I prefer to use my mobile
17,748 1.3% 4,979 0.5% 12,769 2.8% 7,968 1.6%
763,880 54.8% 472,813 50.1% 291,067 64.5% 273,905 56.0%
906,813 65.1% 552,139 58.7% 354,674 78.4% 299,292 61.5%
770,883 55.3% 519,580 55.1% 251,303 55.6% 279,454 57.2%
879,785 63.2% 532,423 56.5% 347,361 77.2% 300,167 61.4%
306,304 22.0% 151,461 16.1% 154,843 34.4% 109,316 22.4%
909,078 65.5% 549,383 58.5% 359,695 80.2% 318,630 65.2%
2005 2006 2007 2008 2009 2010
2,949
3,7263,8604,200
6,086
4,930
Universal Service Baseline Study 26

Figure 6.2: Frequency of public phones use (RIA 2011 survey)
Worst is that those that use public phones do this mostly irregularly; at least one a month (68%). Only 6% used it daily and 16% at least once a week. Mostly public phones were used that were less than 10 minutes away from home (54%).
Figure 6.3: Distance to home of public phone used (RIA 2011 survey)
Main reasons for use of public phones were lack of a household phone (17%) or mobile phone (51%). Some used public phones in addition to having a mobile because of difficulties recharging the mobile with either power or airtime.
More than once a day Every day or almost every dayAt least once a week At least once a monthLess than once a month
10%68%
16%
4%2%
less than 10 minutes 10 to 20 minutes 20 to 30 minute30 to 60 minutes to far to walk
6%2%
3%
35%
54%
Universal Service Baseline Study 27

Figure 6.4: Main reason for using public phones (RIA 2011 survey)
Public phones providing voice only services are clearly on the way out. This does not mean that they currently do not serve a purpose. They are used by those that cannot afford an alternative form of communication.
do not have a fixed line phone at homedo not have a mobile phoneuse it because it is cheapereasier than having to recharge airtime mobiledifficulties charging the battery of mobile
7%
22%4%
51%17%
Universal Service Baseline Study 28

7. Individual Internet Access & UsageAbout 13% of Namibians who are 15 years or older used the Internet in 2011. Among the BOP is was 9.4% and among Namibians living in rural areas 3.3%.As much as 37% of Internet users started using the Internet first on a mobile phone and 56% of all mobile phone owners accessed the Internet on a mobile phone, reflecting an increasing reliance on mobile phones to access the Internet. The ratio for the BOP is the reverse with 63.2% first having used the Internet on a mobile phone. For Internet users living in rural areas it was even 73.9%.One of the primary uses of the Internet is to access social media and 81% of Internet users had an account with a social network application. 17% of mobile phone owners used their mobile phones to access social networking applications such as Facebook. The increasing reliance on the mobile phone and applications that lend themselves to the mobile platform – such as social media - indicate that the mobile phone is a key entry point for Internet adoption in Namibia. The mobile phone is thus not only narrowing the voice gap in Namibia but is also increasingly closing the data gap from a pure access point of view, if not bandwidth.
Table 7.1: Individual Internet use in Namibia (RIA 2011 survey)Table 7.1: Individual Internet use in Namibia (RIA 2011 survey)Table 7.1: Individual Internet use in Namibia (RIA 2011 survey)Table 7.1: Individual Internet use in Namibia (RIA 2011 survey)Table 7.1: Individual Internet use in Namibia (RIA 2011 survey)Table 7.1: Individual Internet use in Namibia (RIA 2011 survey)Table 7.1: Individual Internet use in Namibia (RIA 2011 survey)Table 7.1: Individual Internet use in Namibia (RIA 2011 survey)Table 7.1: Individual Internet use in Namibia (RIA 2011 survey)Table 7.1: Individual Internet use in Namibia (RIA 2011 survey)
NamibiaNamibia RuralRural UrbanUrban BOPBOP
% N % N % N % N
Namibians 15 years or older using the InternetNamibians 15 years or older using the InternetShare of Internet users that used the Internet first on a computer or laptop
Share of Internet users that used the Internet first on a computer or laptopShare of Internet users that used the Internet first on a mobile phone
Share of Internet users that used the Internet first on a mobile phone
Share of Internet users that are signed up for a social networkShare of Internet users that are signed up for a social network
Share of Internet users that access the Internet at various locations
using a mobile phone
Share of Internet users that access the Internet at various locations
work
Share of Internet users that access the Internet at various locations
place of education (school or university)
Share of Internet users that access the Internet at various locations
community Internet access facility
Share of Internet users that access the Internet at various locations
Internet café
Share of Internet users that access the Internet at various locations
Any place via another mobile access devices
Factors limiting the usefulness of the Internet
Internet is very slowFactors limiting
the usefulness of the Internet too expensive
to use
13.4% 188,658 3.3% 30,913 34.1% 157,745 9.4% 46,613
62.1% 114,319 26,1% 7,860 69.2% 106,459 36.8% 16,874
37.9% 69,676 73.9% 22,219 30.8% 47,457 63.2% 28,940
80.6% 141,002 85% 21,975 79.8% 119,027 81.5% 33,690
55.7% 99,286 57.8% 14,928 55.6% 84,359 43.8% 18,104
48.4% 86,258 34.8% 9,001 50.7% 77,257 6.0% 2,486
36% 64,094 18.7% 4,834 38.9% 59,261 42.0% 17,368
20.9% 37,141 0% 0 24.5% 37,141 27.6% 11,412
22.8% 39,970 0% 0 26.8% 39,970 23.4% 9,661
43.7% 72,977 57% 10,839 42% 62138 53.4% 17608
38.2% 66,413 3.7% 967 44.3% 65,447 27.3% 11,300
46.6% 81,841 53.5% 13,815 45.4% 68,026 68.6% 28,371
Universal Service Baseline Study 29

Gap AnalysisThe main reason that Namibians that did not use the Internet gave is that they do not know how to use it (88.1%) and also do not have access to a computer and or Internet connection (90.7%).
Table 7.2: Namibians 15 years or older that never used the Internet (RIA 2011 survey)Table 7.2: Namibians 15 years or older that never used the Internet (RIA 2011 survey)Table 7.2: Namibians 15 years or older that never used the Internet (RIA 2011 survey)Table 7.2: Namibians 15 years or older that never used the Internet (RIA 2011 survey)Table 7.2: Namibians 15 years or older that never used the Internet (RIA 2011 survey)Table 7.2: Namibians 15 years or older that never used the Internet (RIA 2011 survey)Table 7.2: Namibians 15 years or older that never used the Internet (RIA 2011 survey)Table 7.2: Namibians 15 years or older that never used the Internet (RIA 2011 survey)Table 7.2: Namibians 15 years or older that never used the Internet (RIA 2011 survey)Table 7.2: Namibians 15 years or older that never used the Internet (RIA 2011 survey)
NamibiaNamibia RuralRural UrbanUrban BOPBOP
% N % N % N % N
Reasons for not using the Internet
No interest / not useful
Reasons for not using the Internet
I don’t know how to use itReasons for
not using the Internet No computer /
Internet connection
Reasons for not using the Internet
Too expensive
Namibians that never used the Internet but that would be interested in using it if it were available close to where they live (Internet Cafe
Namibians that never used the Internet but that would be interested in using it if it were available close to where they live (Internet Cafe
59.1% 714,591 62.1% 565,403 49.8% 149,188 60.1% 264,880
88.1% 1,065,56094.3% 858,010 69.3% 207,551 73.4% 324,028
90.7% 1,097,99793.8% 853,415 81,3% 244,582 94.0% 415,069
78.4% 948,412 80.4% 730,175 72.6% 218,237 77.1% 340,329
36.1% 438,416 31.0% 283,849 51.4% 154,567 39.4% 175,953
Namibians 15 years or older (40% of the BOP and 31% of rural dwellers) would want to use the Internet if it were available close to where they live.
Conclusions
The mobile phone is a key entry point for Internet adoption in Namibia. The mobile phone is thus not only narrowing the voice gap in Namibia but is also increasingly closing the access to data gap. There is however still a potential role to play for public Internet access and for high speed always on bandwidth required to optimise Internet usage under particular circumstances.
Universal Service Baseline Study 30

8. Market Access Gap vs True Access GapThe infoDev ICT Regulatory Toolkit distinguishes between a market efficiency gap, a smart subsidy gap and a true access gap with respect to household penetration and geographic spread.
The market efficiency gap: Difference between the share of households reached in a fully liberalised and efficient market and what is actually achieved under existing conditions.The smart subsidy zone: Households that can only be reached by a once off subsidy.The true access gap: Households that can only be reached by providing a permanent subsidy or continuous support (e.g. monthly).
The access gap concept is a theoretical concept which is useful in pointing out what objectives can be reached by the private sector by establishing fair competition through policy and regulation and what objectives require a once-off or permanent subsidy in order to be fulfilled. It has however several practical disadvantages:
Full liberalisation would mean no market access restriction. Not a single country with a functional government has fully liberalised its telecommunication sector. A fully liberalised telecom sector may also provide less households or people with a service compared to a sector with restricted market access but fair competition.Subsidies that do not distort the market do not exist. Subsidising entry level handsets would obviously distort the handset market, for example. At the same time limited market access is also a distortion. Subsidies maybe seen as correcting market distortions caused by market access restrictions or other regulatory intervention.The concept ignores all those that do not want a service because they use alternatives. It also ignores all the factors other than cost and revenue that prevents households and people from using a service like skills, lack of electricity, lack of awareness of usefulness etc.For several UAS intervention the one or other gap may not be relevant. Handset wholesale and retail is not regulated and there is hence no market efficiency gap. ICT skills shortages are best addressed through education, none of the gaps would be applicable for curriculum matters. The concepts does not work well with converged service and technologically neutral universal service targets as suggested by this study. Data access could be provided through various technologies and the underlying business model to evaluate the gaps would be different for each.
Universal Service Baseline Study 31

Figure 8.1: Access Gap7
The concept can however be used to categorise intervention to promote universal service with slightly modified definitions. Table 11.3 provides examples for three levels of mobile telephony: coverage, access and usage.
Table 8.1: Redefining Access GapsTable 8.1: Redefining Access GapsTable 8.1: Redefining Access GapsTable 8.1: Redefining Access GapsTable 8.1: Redefining Access Gaps
Modified DefinitionExample interventionsExample interventionsExample interventions
Modified Definition Mobile network coverage Mobile handset Mobile usage
The market efficiency
gap
The smart subsidy
zone
The true access gap
Access and usage that can be reached commercially feasible by fair competition among operators.
None: 98% population coverage is among the highest in the world
None: handset import and manufacturing is not restricted
None: Namibia 8th cheapest country in Africa for prepaid mobile
Access that can be reached commercially feasible after a once-off subsidy
Reverse subsidy for road coverage along the Caprivi strip which currently has some gaps
VAT exemption on handsets not applicable
Access cannot be reached commercially and requires permanent subsidy
None not applicable
Social transfers to increase disposable income of the extremely poor
Namibia’s mobile telecommunication market can be seen as efficient based on 98% population coverage and among the cheapest mobile prepaid prices in Africa. Market liberalisation was followed by termination and retail price regulation to establish fair competition. Full liberalisation is unlikely to yield any improvement, but greater competition may. Fair competition can however further be enhanced by, for example, licence conversion into service and technological neutral licences, introduction of number portability, improved spectrum management and local loop unbundling. These efforts need to be pursued independently of UAS initiatives.
Universal Service Baseline Study 32
7 http://www.ictregulationtoolkit.org/en/Section.3144.html, Source: Initial concept in “Telecommunications & Information services for the Poor. Towards a Strategy for Universal Access”, by J. Navas-Sabater, A. Dymond, N. Juntunen, 2002. Modified by Intelecon.
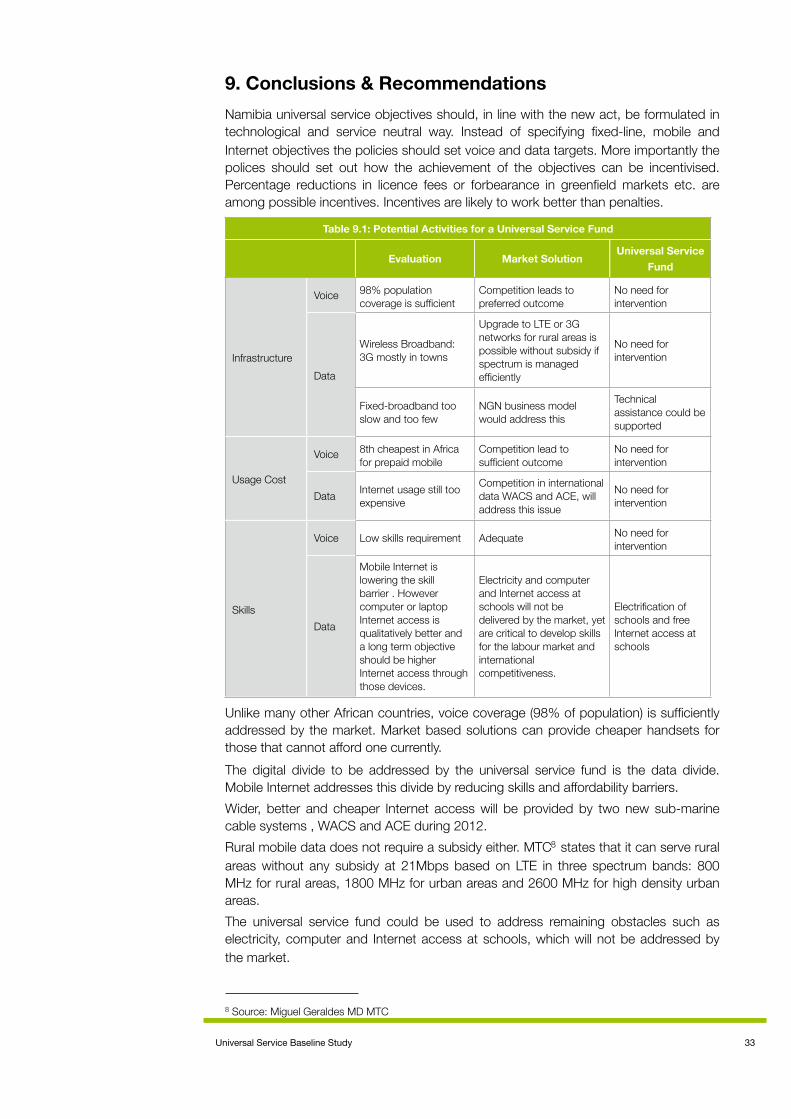
9. Conclusions & RecommendationsNamibia universal service objectives should, in line with the new act, be formulated in technological and service neutral way. Instead of specifying fixed-line, mobile and Internet objectives the policies should set voice and data targets. More importantly the polices should set out how the achievement of the objectives can be incentivised. Percentage reductions in licence fees or forbearance in greenfield markets etc. are among possible incentives. Incentives are likely to work better than penalties.
Table 9.1: Potential Activities for a Universal Service FundTable 9.1: Potential Activities for a Universal Service FundTable 9.1: Potential Activities for a Universal Service FundTable 9.1: Potential Activities for a Universal Service FundTable 9.1: Potential Activities for a Universal Service Fund
Evaluation Market SolutionUniversal Service
Fund
Infrastructure
Voice
InfrastructureData
InfrastructureData
Usage Cost
Voice
Usage CostData
Skills
Voice
SkillsData
98% population coverage is sufficient
Competition leads to preferred outcome
No need for intervention
Wireless Broadband: 3G mostly in towns
Upgrade to LTE or 3G networks for rural areas is possible without subsidy if spectrum is managed efficiently
No need for intervention
Fixed-broadband too slow and too few
NGN business model would address this
Technical assistance could be supported
8th cheapest in Africa for prepaid mobile
Competition lead to sufficient outcome
No need for intervention
Internet usage still too expensive
Competition in international data WACS and ACE, will address this issue
No need for intervention
Low skills requirement Adequate No need for intervention
Mobile Internet is lowering the skill barrier . However computer or laptop Internet access is qualitatively better and a long term objective should be higher Internet access through those devices.
Electricity and computer and Internet access at schools will not be delivered by the market, yet are critical to develop skills for the labour market and international competitiveness.
Electrification of schools and free Internet access at schools
Unlike many other African countries, voice coverage (98% of population) is sufficiently addressed by the market. Market based solutions can provide cheaper handsets for those that cannot afford one currently.The digital divide to be addressed by the universal service fund is the data divide. Mobile Internet addresses this divide by reducing skills and affordability barriers. Wider, better and cheaper Internet access will be provided by two new sub-marine cable systems , WACS and ACE during 2012.Rural mobile data does not require a subsidy either. MTC8 states that it can serve rural areas without any subsidy at 21Mbps based on LTE in three spectrum bands: 800 MHz for rural areas, 1800 MHz for urban areas and 2600 MHz for high density urban areas.The universal service fund could be used to address remaining obstacles such as electricity, computer and Internet access at schools, which will not be addressed by the market.
Universal Service Baseline Study 33
8 Source: Miguel Geraldes MD MTC

10. ReferencesAdamowicz W. & Louviere J. & Williams (1994): Combining Revealed and Stated Preference Methods for Valuing Environmental Amenities. Journal of Environmental Economics and Management, Vol. 26, pp.271-292.Bann C. (1999): A Contingent Valuation of the Mangroves of Benut. Forestry, Department, Peninsular Malaysia, Danish Co-operation for Environment and Development and the Johor State. www.soc.uoc.gr/calendar/2000EAERE/papers/PDF/A6-Bann.pdf.Bateman I., Carson R., Day B., Hanemann M., Hanley N., Hett T., Jones-Lee M., Loomes G., Mourato S., Ozdemiroglu E., Pearce D., Sugden R., Swanson J. (2002): Economic Valuation with Stated Preference Techniques – A Manual. Edward Elgar, Cheltham, UK, ISBN: 1-84064-919-4. Communications Act 2009, Act No. 8 of 2009.ITU (2009a): Measuring the Information Society- The ICT Development Index, Geneva.ITU (2009b): MANUAL for Measuring ICT Access and Use by Households and Individuals, Geneva.Lwanga, S.and Lemeshow, S. (1991): Sample Size Determination in Health Studies – A Practical Manual, World Health Organisation, Geneva.MDG (2008): 2nd Millennium Development Goals 2008, Progress at Mid-term September 2008, http://www.undp.org.na/SharedFiles/Download.aspx?pageid=9&fileid=60&mid=72.Mitchell R. & Carson R. (1984): A Contingent Valuation Estimate of National Freshwater Benefits – Technical Report to the US Environmental Protection Agency. Resources for Future, Washington D.C. MTC (2011a): MTC annual report for financial year ending in September 2010.MTC 2011b: State of the MTC Nation, Media Release, Windhoek, 19 July 2011.NCC (1992): Namibian Communications Commission Act (Act No. 4 of 1992).NCC (1995): Namibian Communications Commission Amendment Act (Act No. 1 of 1995).NCC (2004): Namibian Communications Commission Amendment Act (Act No. 4 of 2004).NCC (2011): Namibian Communications Commission, Amendment of Tariffs for Mobile Operators, Government Gazette 4669, 15 March 2011.Posts and Telecommunications Act (Act No. 19 of 1992).Posts and Telecommunications Companies Establishment Act (Act No. 17 of 1992).Rea, L. and Parker, R. (1997): Designing and Conducting Survey Research – A Comprehensive Guide, Jossey-Bass Publishers, San Francisco.Row R. & Schulze W. & Breffle W. (1996): A Test for Payment Card Biases. Journal of Environmental Economics and Management, Vol. 31, pp. 178-185.SADC (2002): Policy Guidelines on Universal Access / Service for Telecommunications Services in SADC, Telecommunications Regulatory Association of Southern Africa (TRASA), February 2002.Schmidt P. and Stork, C. (2008): Towards evidence-based ICT policy and regulation: e-Skills, Volume 1, Policy Paper 3, ISSN 2073-0845.Sherbourne, R. and Stork, C. (2010): Namibian Telecommunication Sector Performance Review, Volume 2, Policy Paper 7, ISSN 2073-0845.Stork, C. and Deen-Swarray, M. (2007): Switch to Competition, NEPRU Policy Brief, Issue 18, ISSN 1860-659X. Stork, C. and Esselaar, S. (2006): Telecommunication Sector Reform for Development, NEPRU Policy Brief, Issue 17, ISSN 1860-659X.
Universal Service Baseline Study 34
Telecommunications Policies for SADC, June 1998.Telecommunications Policy and Regulatory Framework for Namibia (1999): Ministry of Information and Broadcasting, 1999.Thompson, S. (2002): Sampling, Second Edition, Wiley Series in Probability and Statistics.TN (2009): Telecom Namibia Annual Report 2007/08.TN (2010): Telecom Namibia Annual Report 2008/09.TN (2011): Telecom Namibia Annual Report 2009/10.UNSD (2005): Designing Household Survey Samples: Practical Guidelines, United Nations, New York.
Universal Service Baseline Study 35

11. GlossaryACE Africa Coast to Europe (Submarine Cable)CAPEX Capital expendituresCDMA Code Division Multiple AccessCRASA Communications Regulatory Association of Southern Africa CRAN Communications Regulatory Authority of NamibiaDSL Digital subscriber lineFTTH Fibre to the home GSM Global System for Mobile CommunicationsHIPSSA Harmonisation of ICT Policies in Sub-Sahara AfricaICTs Information and Communications TechnologiesICT4D ICT for developmentICT4E ICT for educationIAP Internet Access PointIP Internet protocolISP Internet Service ProviderISDN Integrated Services Digital NetworkITU International Telecommunication UnionLLU Local loop unbundling LTE Long Term EvolutionMDGs Millennium Development Goals MoU Minutes of UseMTC Mobile Telecommunication LimitedNCC Namibian Communications Commission NRA National Regulatory AuthorityNGN Next-generation Network(s)OPEX Operational expenditurePoP Point of PresenceQoS Quality of service SADC Southern Africa Development CommunitySAFE South Africa Far East undersea cable SMEs Small and Medium EnterprisesSMMEs Small Medium and Micro EnterprisesTCM Total Cost ManagementTCO Total Cost of OwnershipTN Telecom NamibiaTRASA Telecommunications Regulatory Association of Southern AfricaUA Universal access UAS Universal access and serviceUS Universal serviceUSA Universal Service Agency (USA) USF Universal Service FundUSO(s) Universal service obligation(s)VANS Value-added network servicesVoIP Voice over Internet ProtocolVSAT Very Small Aperture TerminalWACS West Africa Cable System
Universal Service Baseline Study 36

12. Survey MethodologyThe RIA e-Access & Usage survey conducted in Namibia delivers nationally representative results for households, individuals and businesses. Using Enumerator Areas (EA) of national census sample frames as primary sampling units and sampling households and business from created listings simultaneously allows RIA to survey three very different users groups during a single survey at a minimal cost.
Sampling
The random sampling was performed in four steps for households and businesses, and five steps for individuals.
Step 1: The national census sample frames was split into urban and rural Enumerator areas (EAs). Step 2: EAs were sampled for each stratum using probability proportional to size (PPS). Step 3: For each EA two listings were compiled, one for households and one for businesses. The listings served as sample frame for the simple random sections.Step 4: 24 Households and 10 businesses were sampled using simple random samples for each selected EA.Step 5: From all household members 15 years or older or visitor staying the night at the house one was randomly selected based on simple random sampling.
Sample SizeThe desired level of accuracy for the survey was set to a confidence level of 95% and an absolute precision (relative margin of error) of 5%. The population proportion P was set conservatively to 0.5 which yields the largest sample size (Lwanga & Lemeshow, 1991). The minimum sample size was determined by the following equation (Rea & Parker, 1997):
n =Z
ap(1 − p)
Cp
⎛
⎝⎜⎞
⎠⎟
2
=1.96 0.5(1 − 0.5)
0.05
⎛
⎝⎜⎞
⎠⎟
2
= 384
Inserting the parameters for the survey yields the minimum sample size for simple random sampling. Due to the sampling method chosen for the survey the minimum sample size has to be multiplied by the design effect variable (Lwanga & Lemeshow, 1991). In the absence of empirical data from previous surveys that would have suggested a different value, the default value of two was chosen for the design effect (UNSD, 2005). This yields then a minimum sample size of 768 per country for households and individuals. The actual sample size for countries is slightly larger than the minimum requirement to compensate for clustering effects and have a wide enough spread of EAs throughout a country. For the businesses a design effect of 1 is assumed leading to a minimum sample of 384 businesses for each country.
Universal Service Baseline Study 37

Table 12.1: Survey summaryTable 12.1: Survey summaryTable 12.1: Survey summary
Survey Characteristics Household & Individuals Businesses
Target Population All households and all Individuals 15 years or older. all businessesDomains 1 = national level1 = national levelTabulation groups Urban, Rural national levelOversampling Urban 60% Rural 40%Urban 60% Rural 40%Clustering Enumerator Areas (EA) national Census Enumerator Areas (EA) national Census None Response Random substitutionRandom substitutionSample Frame Census sample from NSOCensus sample from NSOConfidence Level 95% 95%Design Factor 2 1Absolute precision 5% 5%Population Proportion 0.5, for maximum sample size0.5, for maximum sample sizeMinimum Sample Size 768 384
Weighting
Four weights will be constructed, for households, individuals, small businesses and public institutions. The weights are based on the inverse selection probabilities 9 and gross up the data to national level when applied.
Household weight: HHw = DW1
PHH *PEA
Individual weight: INDw = DW1
PHH *PEA *PI
Business Weight: Busw = DW1
PBus *PEAI
Household Selection Probability: PHHw =n
HHEA
EA Selection Probability: PEAw = mHHEA
HHSTRATA
Individual selection Probability: PI =1
HHm15+
Business Selection Probability: PBusw =q
BusEA
DW = design weight compensation for over-sampling of major urban and other urban EAs and under-sampling of rural EAs;HHEA = number of households in selected EA based on information of last census or updated listing by field team;HHSTRATA =number of households in strata (major urban, other urban, rural);
Universal Service Baseline Study 38
9 See UNSD (2005) page 119 for a detailed discussion on sampling weights.

HHm15+ =number of household members or visitors 15 years or older;
m = target number of EAs for each strata, (major urban, other urban, rural);n = target number of households in EA;q = target number of SMEs in EA;i=number of household members interviewed.The target number of households in each EA varied from country to country. Usually 24 households were to be selected from each EA. Some countries, like Tanzania, preferred to reduce it to 15 households in order to increase the spread of EAs across the country.
Table 12.2: Survey DefinitionsTable 12.2: Survey Definitions
HouseholdConstitutes a person or group of persons, irrespective of whether related or not, who normally live together in the same housing unit or group of housing units and have common cooking arrangements.
Head of household
A head of a household is a person who economically supports or manages the household or, for reasons of age or respect, is considered as head by members of the household, or declares himself as head of a household. The head of a household could be male or female.
Member of a household
All persons who lived and ate with the household for at least six months including those who were not within the household at the time of the survey and were expected to be absent from the household for less than six months.All guests and visitors who ate and stayed with the household for six months and more.Housemaids, guards, baby-sitters, etc. who lived and ate with the household even for less than six months.
Businesses Any business with a physical presence in the EA, the intent to make profit
Table 12.3 displays the Census figures for Namibia for 2011 and estimates based on medium projections for 2011.
Table 12.3: Population characteristics Census 2001 and medium projections for 2011 Table 12.3: Population characteristics Census 2001 and medium projections for 2011 Table 12.3: Population characteristics Census 2001 and medium projections for 2011 Table 12.3: Population characteristics Census 2001 and medium projections for 2011
2001 Census Estimates based on medium forecast
Population
Total
Population RuralPopulation
Urban
Households
Total
Households RuralHouseholds
Urban
Enumerator Areas
TotalEnumerator
Areas RuralEnumerator
AreasUrban
1,826,895 2,184,091
1,228,143 1,468,271
598,752 715,820
346,253 413,953
209,386 250,325
136,867 163,627
4,0734,073
2,6622,662
1,4111,411
Universal Service Baseline Study 39

Stated and Revealed PreferencesThe RIA household survey collected information from mobile users about their monthly expenditure, but also from non-users about their willingness and ability (WTP) to spend on mobile telephony. The first is known as revealed and the latter as stated preferences. WTP measures are widely used to provide information to policy makers regarding the economic value of non-market, non-pecuniary or environmental goods. For stated preferences, no behavioural changes can be observed; the individuals only state that they intend to behave in that particular fashion (Adamowicz et al, 1994). The payment ladder method with exponentially distributed amounts was used to infer the willingness and ability to pay for mobile services of non-users. The payment card was first used by Mitchell & Carson (1984). The payment ladder is a kind of payment card which lists WTP values from low to high. Enumerators read the values to the respondent, starting at the top of the list and moving down. They asked until the first three values were answered with no. If the respondents were almost certain about their willingness and ability to pay a monetary value then a tick () was placed in the space next to that amount. If the respondents were not sure about an amount then it was simply left blank. If the respondents were almost certain that an amount was too high then a cross (x) was placed next to the amount. Three crosses (NOs) were required to complete the question to assure that no intransitivities occurred. The highest amount the respondent was willing and able to pay and the lowest amount the respondent was not willing and able to pay was captured. The difference between these two values is the range of uncertainty (Bann, 1999). Having two points increases the chance of eliciting the respondents’ actual willingness to pay. The payment ladder avoids starting point bias and reduces the number of outliers (Bateman, 2002). To avoid range and centring biases 10the payment ladder was based on exponential value increment, as suggested by Row et al (1996). This approach has three mayor advantages.First, the scale is consistent with the hypothesis of increasing measurement error with increasing value. For instance, a person might value a cup of coffee in a café at $2 plus minus $0.20, but a vacation at $2,000 plus minus $200. Second, according to Row et al (1996) there exists evidence that measurement errors in values obtained in contingent valuation studies have a log-normal distribution and that a logarithmic transformation of the WTP data addresses the increasing measurement error in hypothetical WTP data. Therefore the exponential payment ladder can be seen as consistent with the error distribution of WTP values. The third argument Row et al (1996) put forward refers to the concept of “just noticeable” differences, and they use the example of light sources to explain this. A source of light has a brightness B. The differences between two of such sources is “just noticeable” if the difference can be detected 75% of the time. When bringing these sources in a sequence arranged in order of increasing brightness B1, B2, …, Bn, so that the brightness of each source is “just noticeably” greater than the preceding one, then the relationship to each other is given by Weber’s law:
Bn − Bn−1 = k * Bn−1
where k is a positive constant. Hence the “just noticeable” differences are increasing proportionally to the sequence of sources and can also be written by exponential function:
Bn = B1 * (1+ k)n−1
Universal Service Baseline Study 40
10 See Venkatachalam (2004) and Row et al (1996).

The value of k can be seen as a percentage increase between adjacent scale values. The survey used 28 values, starting with a zero (not interested at all) and ending with an empty cell for amounts higher than listed. Equation (2) was used to compute the 2nd to 27th amounts. K was selected so that (1 + k)n-1 equals the highest value on the list.11
Table 12.4: Willingness to Pay TABLE Payment Ladder South Africa / Namibia (N$) Table 12.4: Willingness to Pay TABLE Payment Ladder South Africa / Namibia (N$) Table 12.4: Willingness to Pay TABLE Payment Ladder South Africa / Namibia (N$) Table 12.4: Willingness to Pay TABLE Payment Ladder South Africa / Namibia (N$)
Starting at the top of the list and moving down. Ask until the first three values are answered with no. If the respondent is almost certain about a monetary value then place a
tick (√) in the space next to the amount. If the respondent is not sure about an amount then simply leave it blank. If the respondent is almost certain that the amount is too high then place a cross (x) next to the amount. Enter the highest amount the respondent was willing and able to pay into the PDA Enter the lowest amount the respondent was NOT
willing and able to pay into the PDA
N$
F.19 & F.20 NM.12 NM.13
N$How much would the household be willing and able to spend monthly on a Household phone (calls and line rental)
How much would you be willing and able to spend on a mobile phone handset?
How much would you be willing and able to spend monthly on a mobile phone for calls and SMS etc?
0
35 44 54 68 85
106 133 166 208 260 325 406 507 634 792 990
1,238 1,548 1,935 2,418 3,023 3,778 4,723 5,904 7,380 9,225
Ask for amount if highest value
still yes:
Universal Service Baseline Study 41
11 For example with n = 24 cells which have to be computed and $1000 the highest value, the equation would be given by 1000 = (1 + 0,35)23

Bottom of the PyramidThe Bottom of the Pyramid is defined in this study in line with the poverty line used b the Worldbank or individuals having less than US$2.5 a day or US$75 a month12 in terms of implied PPP conversion rates of 2011 of N$5.993.13 This implies less than N$450 per month.
Table 12.5: BOP in Namibia - 15 years or olderTable 12.5: BOP in Namibia - 15 years or olderTable 12.5: BOP in Namibia - 15 years or older
% N
Namibia
Rural
Urban
49.4% 1,410,179
55.9% 948,003
36.1% 462,176
35% of Namibians15 years or older have to live with less then US$2.5 a day at implied PPP conversion rates. In rural areas it is nearly 40%.
Universal Service Baseline Study 42
12 See for example: http://www.globalissues.org/article/26/poverty-facts-and-stats13 World Economic Outlook database: http://www.imf.org/external/ns/cs.aspx?id=28, September 2011