Nam Sai Farms Tilapia Strains comparison trial 2007 … Comparison-web2.pdfNam Sai Farms Tilapia...
42
© © Nam Sai Farms Co. Ltd 2008 Nam Sai Farms Co. Ltd 2008 1 1 Nam Nam Sai Sai Farms Farms Tilapia Strains comparison Tilapia Strains comparison trial 2007 trial 2007 - - 2008 2008
Transcript of Nam Sai Farms Tilapia Strains comparison trial 2007 … Comparison-web2.pdfNam Sai Farms Tilapia...

©© Nam Sai Farms Co. Ltd 2008Nam Sai Farms Co. Ltd 2008 11
Nam Nam SaiSai Farms Farms Tilapia Strains comparison Tilapia Strains comparison
trial 2007trial 2007--20082008
©© Nam Sai Farms Co. Ltd 2008Nam Sai Farms Co. Ltd 2008 22
ObjectiveObjective
To compare the growTo compare the grow--out performance of tilapia strains out performance of tilapia strains produced by Nam produced by Nam SaiSai Farms and those of two other Farms and those of two other
leading Thai hatcheries.leading Thai hatcheries.

©© Nam Sai Farms Co. Ltd 2008Nam Sai Farms Co. Ltd 2008 33
Customer RequirementsCustomer RequirementsFrom a production point of view there are three main, linked, From a production point of view there are three main, linked,
quality factors that customers are looking for.quality factors that customers are looking for.
Customer Satisfaction
Health Growth
Good FCR

©© Nam Sai Farms Co. Ltd 2008Nam Sai Farms Co. Ltd 2008 44
TrialTrial DesignDesignStrainStrain ColourColour ReplicatesReplicates
ChitraladaChitralada BlackBlack 33GIFTGIFT BlackBlack 33Big Nin Big Nin BlackBlack 33Nam Nam SaiSai 1 (hybrid)1 (hybrid) BlackBlack 22Thai redThai red RedRed 33Taiwanese redTaiwanese red RedRed 33Red hybridRed hybrid RedRed 33Farm AFarm A BlackBlack 33Farm BFarm B BlackBlack 11
Note: Only 1 rep of Farm B used due to high mortalityNote: Only 1 rep of Farm B used due to high mortality1 rep of the Nam 1 rep of the Nam SaiSai 1 escaped, hence only 2 reps1 escaped, hence only 2 reps

©© Nam Sai Farms Co. Ltd 2008Nam Sai Farms Co. Ltd 2008 55
MethodMethod3 batches/replicates of 1 inch 3 batches/replicates of 1 inch monosexmonosex fry from each strain fry from each strain were stocked once per week over a three week period. were stocked once per week over a three week period.
Nursery: Nursery: HapasHapas pond 22 Nam pond 22 Nam SaiSai2828--JulJul--07 to 22 07 to 22 ––SepSep--07 07 42 days42 days
GrowGrow--out: out: Cages reservoir R2 Nam Cages reservoir R2 Nam SaiSai2626--SepSep--07 to 1507 to 15--0303--08 08 171 days171 days
Note: GrowNote: Grow--out in cold season (mean monthly temperature 25out in cold season (mean monthly temperature 25--30oC)30oC)

©© Nam Sai Farms Co. Ltd 2008Nam Sai Farms Co. Ltd 2008 66
Nursery MethodNursery MethodFish:Fish: 1 inch (0.25g) 1 inch (0.25g) monosexmonosex fry fry
Stocking:Stocking: 1,200 fry in 20 m1,200 fry in 20 m²² (0.9m deep) (0.9m deep) hapahapa (60 fry/m(60 fry/m²²))
Pond:Pond: Pond 23 Pond 23 –– earthen, earthen, ““greengreen--waterwater””, 1.2 m deep, water level , 1.2 m deep, water level maintained by rain maintained by rain
Time Period:Time Period: 6 weeks6 weeksFeeding:Feeding: 11stst 2 weeks 2 weeks –– 32% crude protein powder, 20% 32% crude protein powder, 20% bwbw/day/day
22ndnd 2 weeks 2 weeks –– powder + small pellets, to satiationpowder + small pellets, to satiation33rdrd 3 weeks 3 weeks –– 32% crude protein floating pellets, to satiation32% crude protein floating pellets, to satiation3 feeds per day 3 feeds per day
Important:Important: There was an outbreak of There was an outbreak of StreptococcosisStreptococcosis in the nursery pond in the nursery pond causing heavy mortality.causing heavy mortality.
©© Nam Sai Farms Co. Ltd 2008Nam Sai Farms Co. Ltd 2008 77
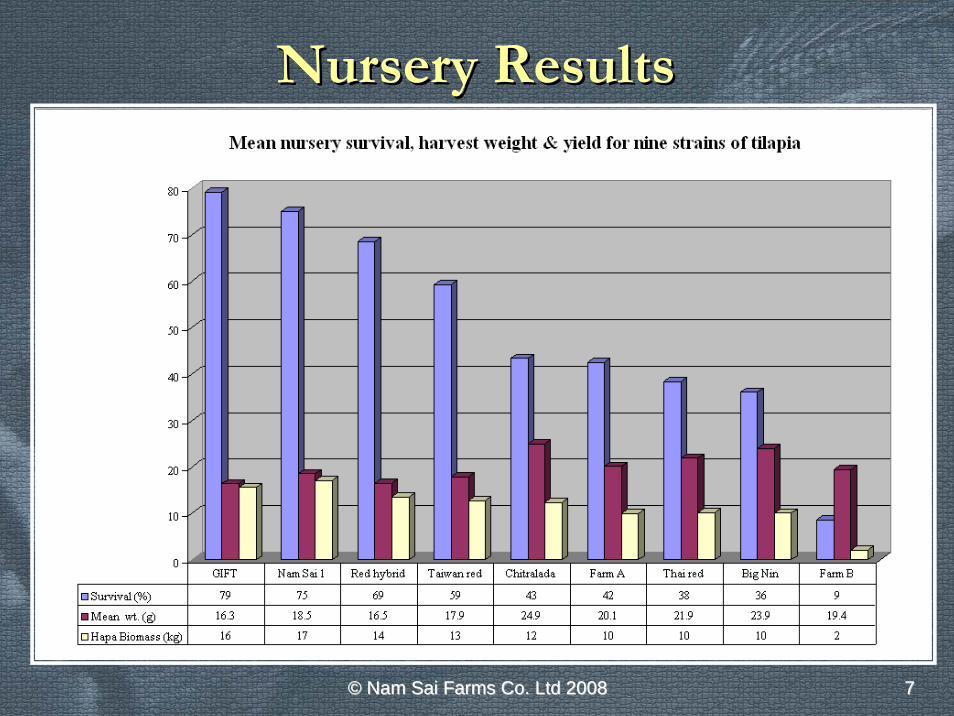
Nursery ResultsNursery Results

©© Nam Sai Farms Co. Ltd 2008Nam Sai Farms Co. Ltd 2008 88
Nursery ConclusionsNursery ConclusionsSurvivalSurvival♣♣ Survival was best for GIFT, Nam Survival was best for GIFT, Nam SaiSai 1 (GIFT x 1 (GIFT x ChitraladaChitralada hybrid) and the hybrid) and the
Red Hybrid strains respectively.Red Hybrid strains respectively.
♣♣ GIFT and Nam GIFT and Nam SaiSai 1 were more resistant to 1 were more resistant to StreptococcosisStreptococcosis than Big Nin and than Big Nin and ChitraladaChitralada, the other two Nam , the other two Nam SaiSai Nile tilapia strains.Nile tilapia strains.
♣♣ Tilapia from Farm B had very little resistance to Tilapia from Farm B had very little resistance to StreptococcosisStreptococcosis..
♣♣ Taiwan Red had significantly higher survival than Thai red.Taiwan Red had significantly higher survival than Thai red.
♣♣ Red Hybrid (Thai x Taiwan) had higher survival than both parentsRed Hybrid (Thai x Taiwan) had higher survival than both parents..
GrowthGrowth
♣♣ Growth was inversely related to survival, as mortality reduces sGrowth was inversely related to survival, as mortality reduces stocking tocking density and increases growth rate of remaining fish.density and increases growth rate of remaining fish.
♣♣ Yields varied between 0.5 and 0.85 kg/m2 Yields varied between 0.5 and 0.85 kg/m2 hapahapa, generally increasing with , generally increasing with increasing survival.increasing survival.
♣♣ Daily weight gains varied between 5.2 and 8.8 g/m2 Daily weight gains varied between 5.2 and 8.8 g/m2 hapahapa/day./day.

©© Nam Sai Farms Co. Ltd 2008Nam Sai Farms Co. Ltd 2008 99
Nursery ReturnsNursery Returns
Nam Nam SaiSai 1 gave best return due to good survival & large fingerlings1 gave best return due to good survival & large fingerlings
Size (g) Baht/fish
16 1.93
18 2.05
20 2.23
22 2.38
24 2.52

©© Nam Sai Farms Co. Ltd 2008Nam Sai Farms Co. Ltd 2008 1010
Nursery Returns contd.Nursery Returns contd.
♣♣ Typically fry and feed costs are about 55% of total costs Typically fry and feed costs are about 55% of total costs in tilapia nursery operations in Thailand. in tilapia nursery operations in Thailand.
♣♣ A mean fixed operating cost was calculate for the other A mean fixed operating cost was calculate for the other 45% & the same figure applied for all strains.45% & the same figure applied for all strains.
♣♣ From this we can model the production cost and likely From this we can model the production cost and likely return on investment by a nursery operator for each of the return on investment by a nursery operator for each of the strains tested.strains tested.

©© Nam Sai Farms Co. Ltd 2008Nam Sai Farms Co. Ltd 2008 1111
Production Cost per FingerlingProduction Cost per Fingerling

©© Nam Sai Farms Co. Ltd 2008Nam Sai Farms Co. Ltd 2008 1212
Nursery Net Returns Nursery Net Returns

©© Nam Sai Farms Co. Ltd 2008Nam Sai Farms Co. Ltd 2008 1313
Nursery Returns ConclusionsNursery Returns Conclusions
♣♣ Under the natural challenge of Under the natural challenge of StrepStrepttococcus ococcus outbreak the outbreak the breakeven point for nursery survival was in the range 40breakeven point for nursery survival was in the range 40--50%.50%.
♣♣ GIFT, Nam GIFT, Nam SaiSai 1 & Red Hybrid strains all gave good positive 1 & Red Hybrid strains all gave good positive returns in nursery. returns in nursery.
♣♣ Taiwan Red and Taiwan Red and ChitraladaChitralada strains gave only small positive strains gave only small positive returns.returns.
♣♣ Thai Red, Big Nin, Farms A & B all gave negative returns.Thai Red, Big Nin, Farms A & B all gave negative returns.

©© Nam Sai Farms Co. Ltd 2008Nam Sai Farms Co. Ltd 2008 1414
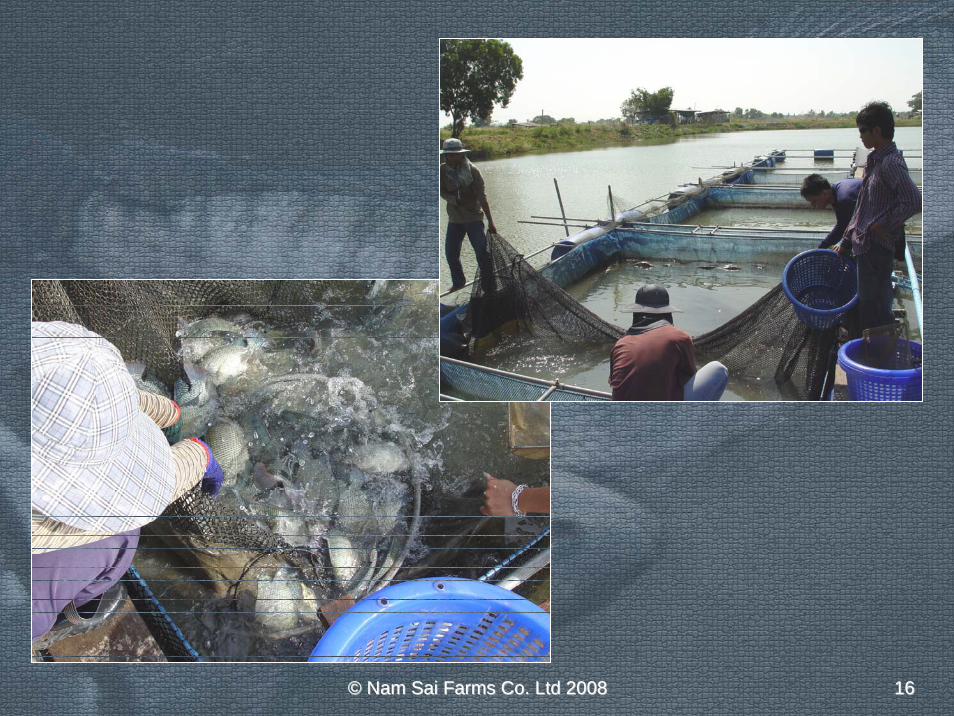
♣♣ 300 medium sized fish from each nursery 300 medium sized fish from each nursery hapahapa (3 replicates maintained) (3 replicates maintained) were stocked in cages in reservoir R1 Nam were stocked in cages in reservoir R1 Nam SaiSai. There were insufficient . There were insufficient Farm B fish to be included.Farm B fish to be included.
♣♣ A red strain and a Nile strain from the National Aquatic GeneticA red strain and a Nile strain from the National Aquatic Genetics s Research Institute were included (2 reps of each from same batchResearch Institute were included (2 reps of each from same batch of of fish), but were stocked 22 days later than all other strains.fish), but were stocked 22 days later than all other strains.
♣♣ Cages were 4m x 3m x 1.2m deep; 2.5 cm PE knotless net; Cages were 4m x 3m x 1.2m deep; 2.5 cm PE knotless net; approximately 25 fish/mapproximately 25 fish/m³³..
♣♣ Each cage had a large Each cage had a large airstoneairstone used from 10:00 pm to 8:30 am.used from 10:00 pm to 8:30 am.
♣♣ Feeding Feeding ““ad ad libitumlibitum”” 3 times daily with 30% crude protein floating 3 times daily with 30% crude protein floating pellet.pellet.
♣♣ Grow out for 6 months during coolest period of the year (Sept Grow out for 6 months during coolest period of the year (Sept –– March), March), hence slow growth.hence slow growth.
GrowGrow--out Methodout Method

©© Nam Sai Farms Co. Ltd 2008Nam Sai Farms Co. Ltd 2008 1515
©© Nam Sai Farms Co. Ltd 2008Nam Sai Farms Co. Ltd 2008 1616
©© Nam Sai Farms Co. Ltd 2008Nam Sai Farms Co. Ltd 2008 1717
Survival Survival & & F.C.R.F.C.R.

©© Nam Sai Farms Co. Ltd 2008Nam Sai Farms Co. Ltd 2008 1818
F. C. R.F. C. R.
©© Nam Sai Farms Co. Ltd 2008Nam Sai Farms Co. Ltd 2008 1919
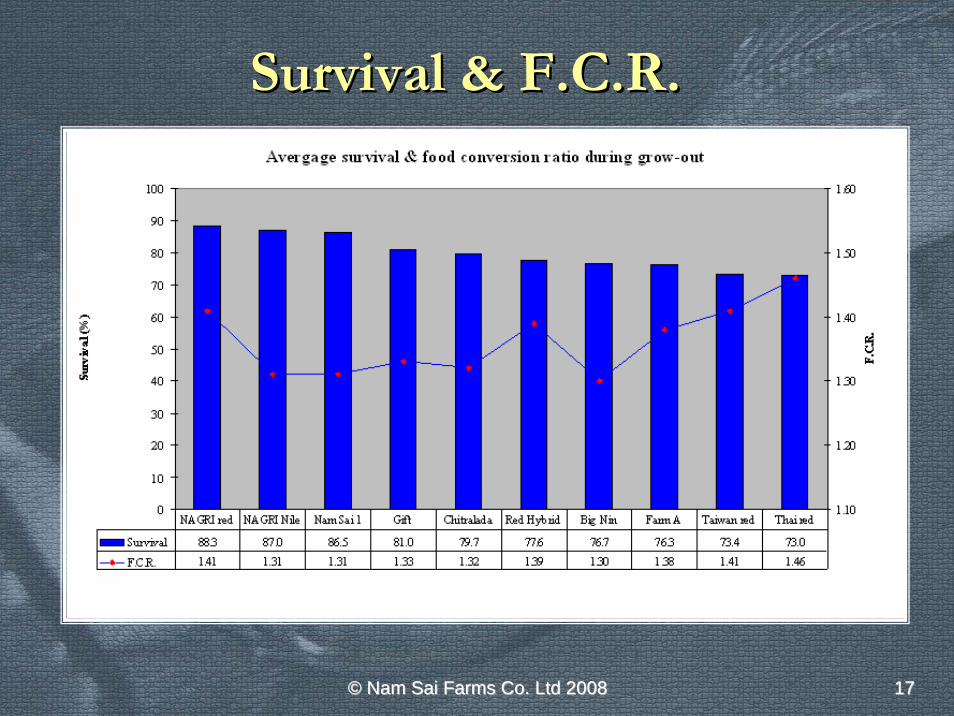
Survival Survival && F.C.R. ConclusionsF.C.R. Conclusions♣♣ Survival was generally good in the growSurvival was generally good in the grow--out. The weather was out. The weather was
cool and mortality due to cool and mortality due to StreptococcosisStreptococcosis is absent at this time of is absent at this time of year. Most mortality occurred within the first few weeks of year. Most mortality occurred within the first few weeks of stocking. stocking.
♣♣ F.C.R. was between 1.3 to 1.46 for all strains. There was F.C.R. was between 1.3 to 1.46 for all strains. There was generally an increase in F.C.R. as the fish got larger. F.C.R. generally an increase in F.C.R. as the fish got larger. F.C.R. was was lower during periods of cold weather possibly due to poor lower during periods of cold weather possibly due to poor appetite and wastage of food.appetite and wastage of food.
♣♣ There was a positive correlation between F.C.R. and survival. There was a positive correlation between F.C.R. and survival. As survival increased, F.C.R. decreased. As survival increased, F.C.R. decreased.
♣♣ Big Nin was an exception in that despite low survival Big Nin was an exception in that despite low survival F.C.R. was also low. This may be explained by the fact most morF.C.R. was also low. This may be explained by the fact most mortality tality for this strain occurred within the first 2 weeks. for this strain occurred within the first 2 weeks.
♣♣ NAGRI Red was the other exception. Survival was NAGRI Red was the other exception. Survival was highest in this strain, but F.C.R. was equal second lowest.highest in this strain, but F.C.R. was equal second lowest.

©© Nam Sai Farms Co. Ltd 2008Nam Sai Farms Co. Ltd 2008 2020
Cumulative SurvivalCumulative Survival♣♣ Looking at the additive effect of mortality during both nursery Looking at the additive effect of mortality during both nursery and growand grow--
out gives a picture of the possible impact on farmers who buy smout gives a picture of the possible impact on farmers who buy small fry and all fry and do their own nursing.do their own nursing.

©© Nam Sai Farms Co. Ltd 2008Nam Sai Farms Co. Ltd 2008 2121
Nile Tilapia GrowthNile Tilapia Growth

©© Nam Sai Farms Co. Ltd 2008Nam Sai Farms Co. Ltd 2008 2222
Nile Tilapia YieldNile Tilapia Yield
©© Nam Sai Farms Co. Ltd 2008Nam Sai Farms Co. Ltd 2008 2323
Nile Tilapia Growth ConclusionsNile Tilapia Growth Conclusions♣♣ Big Nin & Nam Big Nin & Nam SaiSai 1 grew faster than the other Nile tilapia 1 grew faster than the other Nile tilapia
strains, but Nam strains, but Nam SaiSai 1 gave a higher yield due to higher 1 gave a higher yield due to higher survival.survival.
♣♣ NAGRI Nile gave better yield than Big Nin despite growing NAGRI Nile gave better yield than Big Nin despite growing slower, as survival was very high in this strain. This could slower, as survival was very high in this strain. This could have been partly due starting later when have been partly due starting later when StreptococcusStreptococcusinfection had disappeared.infection had disappeared.
♣♣ ChitrlaladaChitrlalada was marginally better than GIFT in terms of was marginally better than GIFT in terms of growth and yield.growth and yield.
♣♣ Farm A tilapia were significantly lower in terms of growth Farm A tilapia were significantly lower in terms of growth rate and yield than all the other strains.rate and yield than all the other strains.
♣♣ General growth appeared to accelerate in g/day, but this was General growth appeared to accelerate in g/day, but this was most likely because the weather was warming up towards the most likely because the weather was warming up towards the end of the trial.end of the trial.

©© Nam Sai Farms Co. Ltd 2008Nam Sai Farms Co. Ltd 2008 2424
Red Tilapia GrowthRed Tilapia Growth

©© Nam Sai Farms Co. Ltd 2008Nam Sai Farms Co. Ltd 2008 2525
Red Tilapia YieldRed Tilapia Yield

©© Nam Sai Farms Co. Ltd 2008Nam Sai Farms Co. Ltd 2008 2626
Red Tilapia Growth ConclusionsRed Tilapia Growth Conclusions♣♣ There was very little difference in growth rate There was very little difference in growth rate
between all the red tilapia strains. However, NAGRI between all the red tilapia strains. However, NAGRI Red gave a much higher yield per cage, as survival Red gave a much higher yield per cage, as survival was higher in this strain. was higher in this strain. It is quite possible that this It is quite possible that this was because nursery and growwas because nursery and grow--out of this strain started out of this strain started later than the others when later than the others when StreptococcusStreptococcus infection has infection has disappeared.disappeared.
♣♣ Of the Nam Of the Nam SaiSai red tilapia strains, the Red Hybrid red tilapia strains, the Red Hybrid outperformed the pure Thai and Taiwan strains. outperformed the pure Thai and Taiwan strains. This This could be interpreted as hybrid vigour, as this strain is an could be interpreted as hybrid vigour, as this strain is an F1 hybrid of the two pure strains.F1 hybrid of the two pure strains.
©© Nam Sai Farms Co. Ltd 2008Nam Sai Farms Co. Ltd 2008 2727
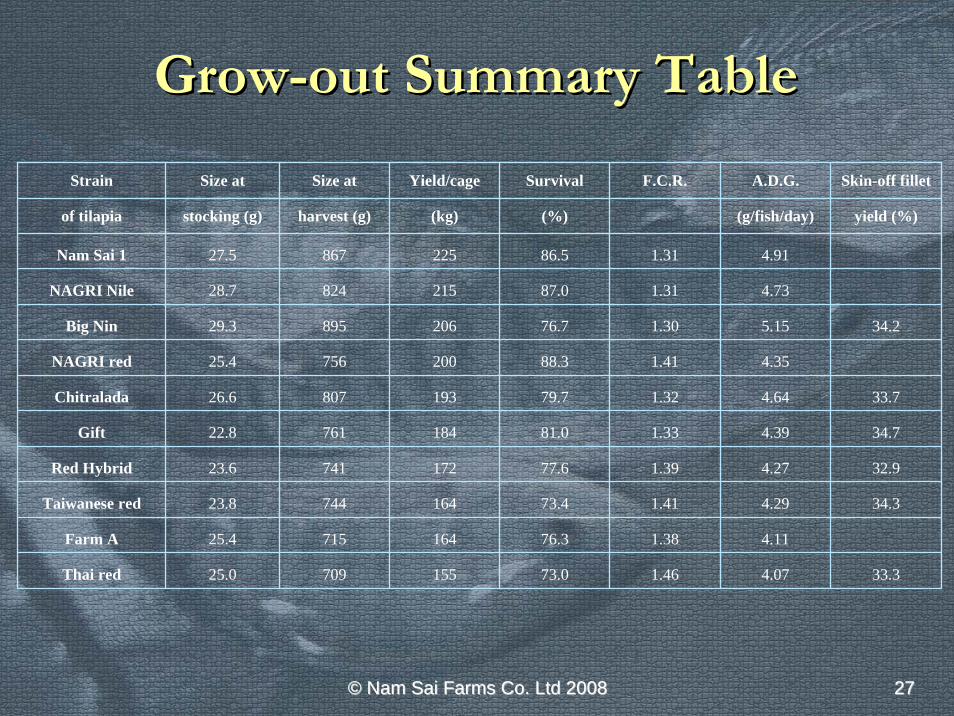
GrowGrow--out Summary Tableout Summary Table
Strain Size at Size at Yield/cage Survival F.C.R. A.D.G. Skin-off fillet
of tilapia stocking (g) harvest (g) (kg) (%) (g/fish/day) yield (%)
Nam Sai 1 27.5 867 225 86.5 1.31 4.91
NAGRI Nile 28.7 824 215 87.0 1.31 4.73
Big Nin 29.3 895 206 76.7 1.30 5.15 34.2
NAGRI red 25.4 756 200 88.3 1.41 4.35
Chitralada 26.6 807 193 79.7 1.32 4.64 33.7
Gift 22.8 761 184 81.0 1.33 4.39 34.7
Red Hybrid 23.6 741 172 77.6 1.39 4.27 32.9
Taiwanese red 23.8 744 164 73.4 1.41 4.29 34.3
Farm A 25.4 715 164 76.3 1.38 4.11
Thai red 25.0 709 155 73.0 1.46 4.07 33.3
©© Nam Sai Farms Co. Ltd 2008Nam Sai Farms Co. Ltd 2008 2828
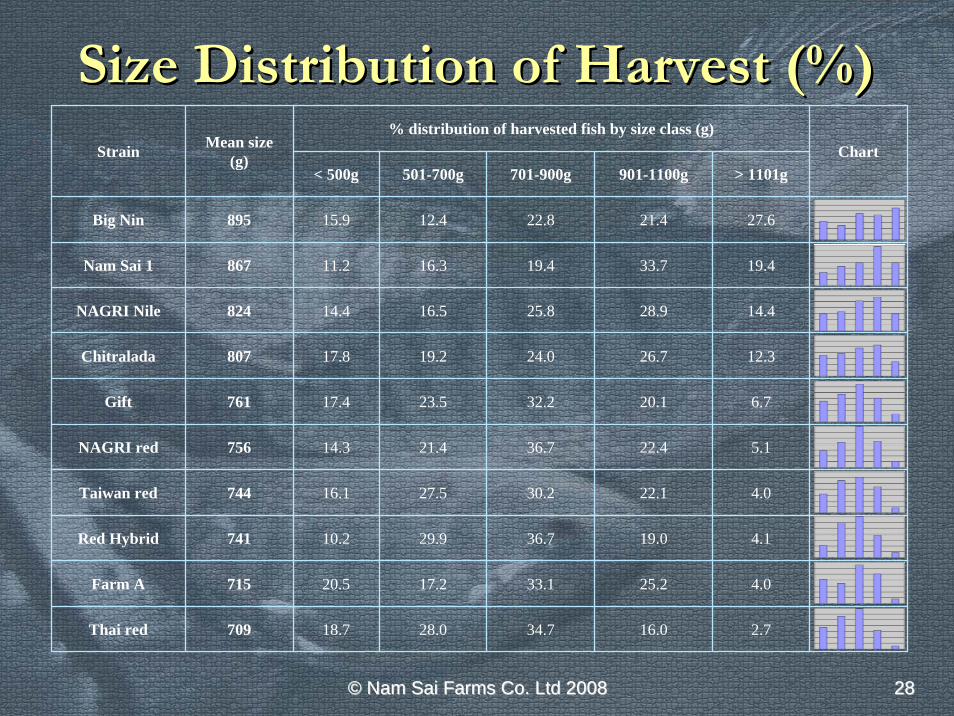
Size Distribution of Harvest (%)Size Distribution of Harvest (%)% distribution of harvested fish by size class (g)
Strain Mean size (g)
< 500g 501-700g 701-900g 901-1100g > 1101g
Big Nin 895 15.9 12.4 22.8 21.4 27.6
Nam Sai 1 867 11.2 16.3 19.4 33.7 19.4
NAGRI Nile 824 14.4 16.5 25.8 28.9 14.4
Chitralada 807 17.8 19.2 24.0 26.7 12.3
Gift 761 17.4 23.5 32.2 20.1 6.7
NAGRI red 756 14.3 21.4 36.7 22.4 5.1
Taiwan red 744 16.1 27.5 30.2 22.1 4.0
Red Hybrid 741 10.2 29.9 36.7 19.0 4.1
Farm A 715 20.5 17.2 33.1 25.2 4.0
Thai red 709 18.7 28.0 34.7 16.0 2.7
Chart
©© Nam Sai Farms Co. Ltd 2008Nam Sai Farms Co. Ltd 2008 2929
Size Distribution ConclusionsSize Distribution Conclusions
♣♣ Big Nin had a high proportion of smaller fish Big Nin had a high proportion of smaller fish despite having the largest mean size.despite having the largest mean size.
♣♣ Farm A also had an unusually high number of Farm A also had an unusually high number of smaller stunted fish.smaller stunted fish.
♣♣ Big Nin had the largest population size variation Big Nin had the largest population size variation which included a high proportion of fish over which included a high proportion of fish over 1.1 kg (27.6%).1.1 kg (27.6%).
♣♣ Nam Nam SaiSai 1 and Red Hybrid had less stunted fish.1 and Red Hybrid had less stunted fish.
©© Nam Sai Farms Co. Ltd 2008Nam Sai Farms Co. Ltd 2008 3030
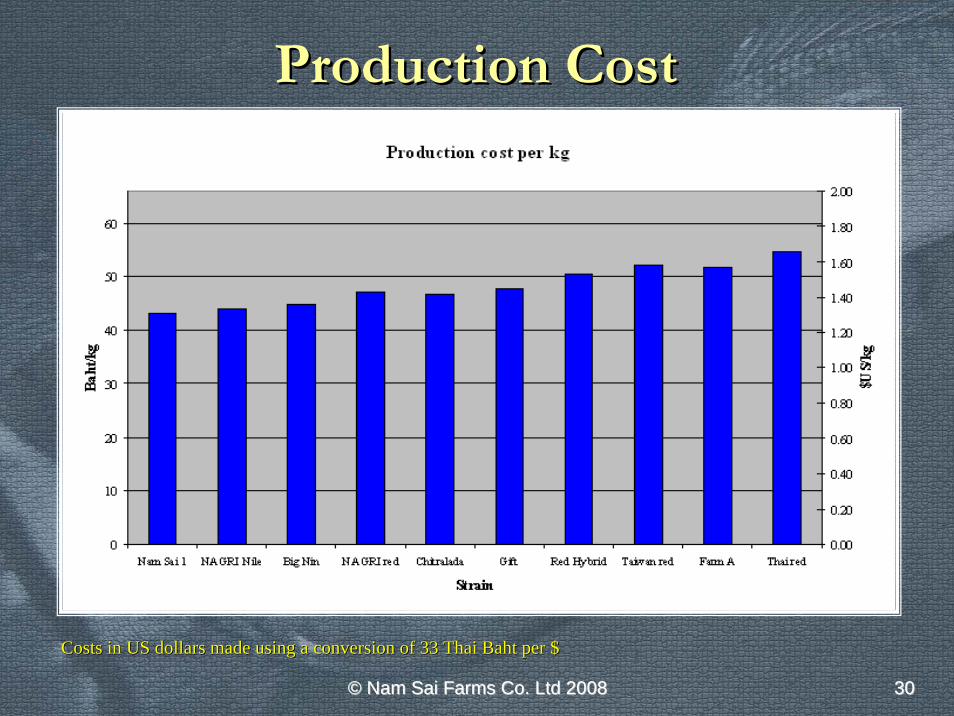
Production CostProduction Cost
Costs in US dollars made using a conversion of 33 Thai Baht per Costs in US dollars made using a conversion of 33 Thai Baht per $$
©© Nam Sai Farms Co. Ltd 2008Nam Sai Farms Co. Ltd 2008 3131
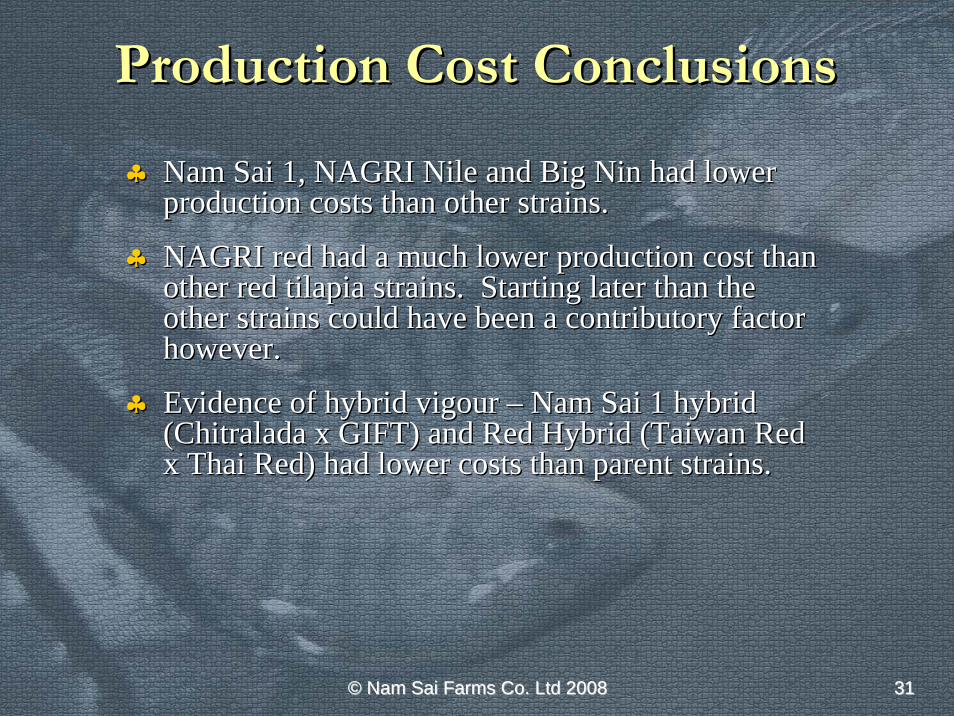
Production Cost ConclusionsProduction Cost Conclusions
♣♣ Nam Nam SaiSai 1, NAGRI Nile and Big Nin had lower 1, NAGRI Nile and Big Nin had lower production costs than other strains.production costs than other strains.
♣♣ NAGRI red had a much lower production cost than NAGRI red had a much lower production cost than other red tilapia strains. Starting later than the other red tilapia strains. Starting later than the other strains could have been a contributory factor other strains could have been a contributory factor however.however.
♣♣ Evidence of hybrid vigour Evidence of hybrid vigour –– Nam Nam SaiSai 1 hybrid 1 hybrid ((ChitraladaChitralada x GIFT) and Red Hybrid (Taiwan Red x GIFT) and Red Hybrid (Taiwan Red x Thai Red) had lower costs than parent strains.x Thai Red) had lower costs than parent strains.

©© Nam Sai Farms Co. Ltd 2008Nam Sai Farms Co. Ltd 2008 3232
Overall ConclusionsOverall Conclusions
♣♣ Nam Nam SaiSai 1 1 –– High survival and good growth makes this the best High survival and good growth makes this the best of the strains tested.of the strains tested.
♣♣ GIFT GIFT –– The most disease resistant strain, growth was moderate.The most disease resistant strain, growth was moderate.
♣♣ Big Nin Big Nin –– Low in terms of disease resistance, but very good Low in terms of disease resistance, but very good growth. Nursery survival was very poor and so fingerling growth. Nursery survival was very poor and so fingerling production costs very high.production costs very high.
♣♣ ChitraladaChitralada –– Low disease resistance and only moderate growth.Low disease resistance and only moderate growth.
♣♣ Red Hybrid Red Hybrid –– High disease resistance and moderate growth High disease resistance and moderate growth makes this Nam makes this Nam SaiSai’’ss best red strain.best red strain.
♣♣ Taiwan Red Taiwan Red –– Decent disease resistance and moderate growth.Decent disease resistance and moderate growth.
♣♣ Thai Red Thai Red –– Low disease resistance and poor growthLow disease resistance and poor growth

©© Nam Sai Farms Co. Ltd 2008Nam Sai Farms Co. Ltd 2008 3333
Overall Conclusions cont.Overall Conclusions cont.
♣♣ NAGRI Nile NAGRI Nile –– Good survival and growth makes this a Good survival and growth makes this a good candidate for future culture.good candidate for future culture.
♣♣ NAGRI Red NAGRI Red –– Survival was good and growth marginally Survival was good and growth marginally better than current Nam better than current Nam SaiSai red tilapia strains.red tilapia strains.
♣♣ Farm A Farm A –– Low resistance to disease and poor growth.Low resistance to disease and poor growth.
♣♣ Farm B Farm B –– Almost no resistance to Almost no resistance to StreptococcosisStreptococcosis and and insufficient fish remaining to gain any information about insufficient fish remaining to gain any information about growgrow--out performance.out performance.
©© Nam Sai Farms Co. Ltd 2008Nam Sai Farms Co. Ltd 2008 3434
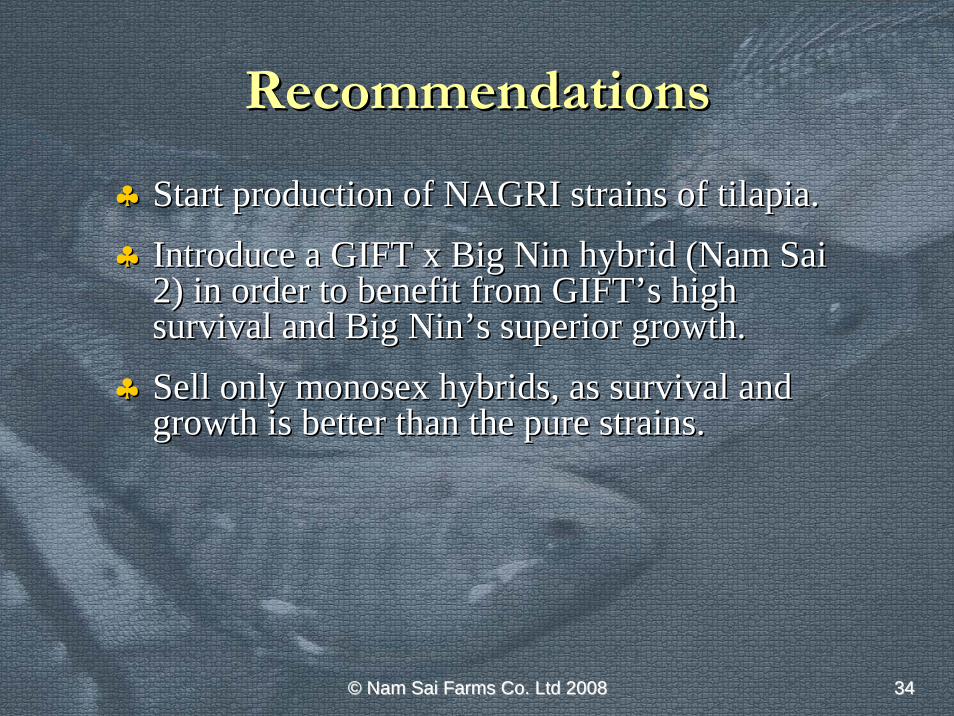
RecommendationsRecommendations
♣♣ Start production of NAGRI strains of tilapia.Start production of NAGRI strains of tilapia.
♣♣ Introduce a GIFT x Big Nin hybrid (Nam Introduce a GIFT x Big Nin hybrid (Nam SaiSai2) in order to benefit from 2) in order to benefit from GIFTGIFT’’ss high high survival and Big Ninsurvival and Big Nin’’s superior growth.s superior growth.
♣♣ Sell only Sell only monosexmonosex hybrids, as survival and hybrids, as survival and growth is better than the pure strains.growth is better than the pure strains.

©© Nam Sai Farms Co. Ltd 2008Nam Sai Farms Co. Ltd 2008 3535
Appendix Appendix –– Raw DataRaw Data
©© Nam Sai Farms Co. Ltd 2008Nam Sai Farms Co. Ltd 2008 3636
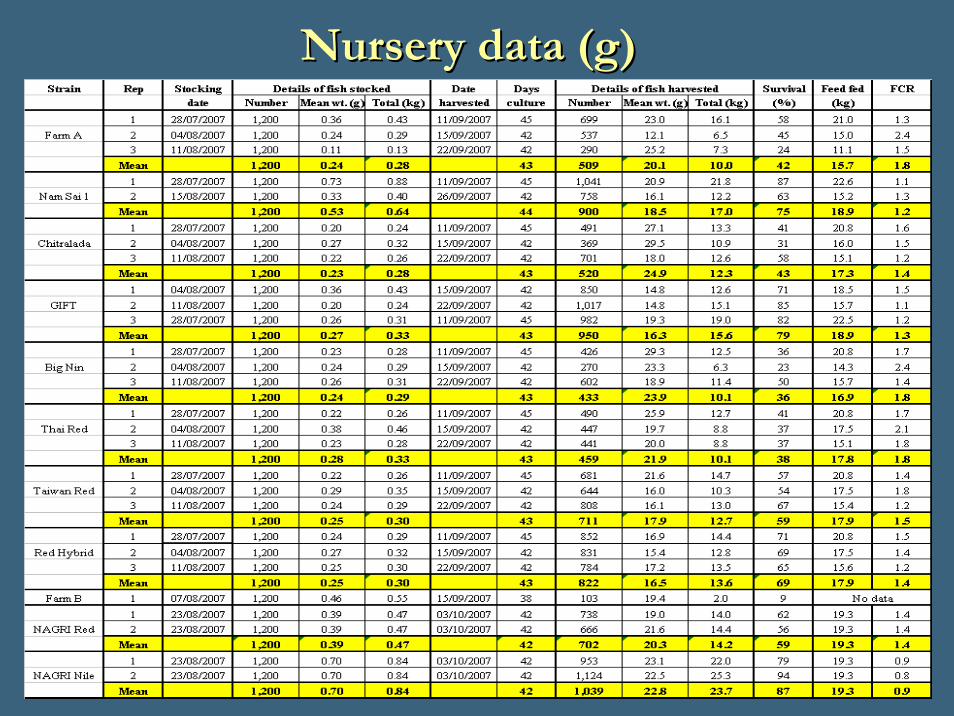
Nursery data (g)Nursery data (g)
©© Nam Sai Farms Co. Ltd 2008Nam Sai Farms Co. Ltd 2008 3737
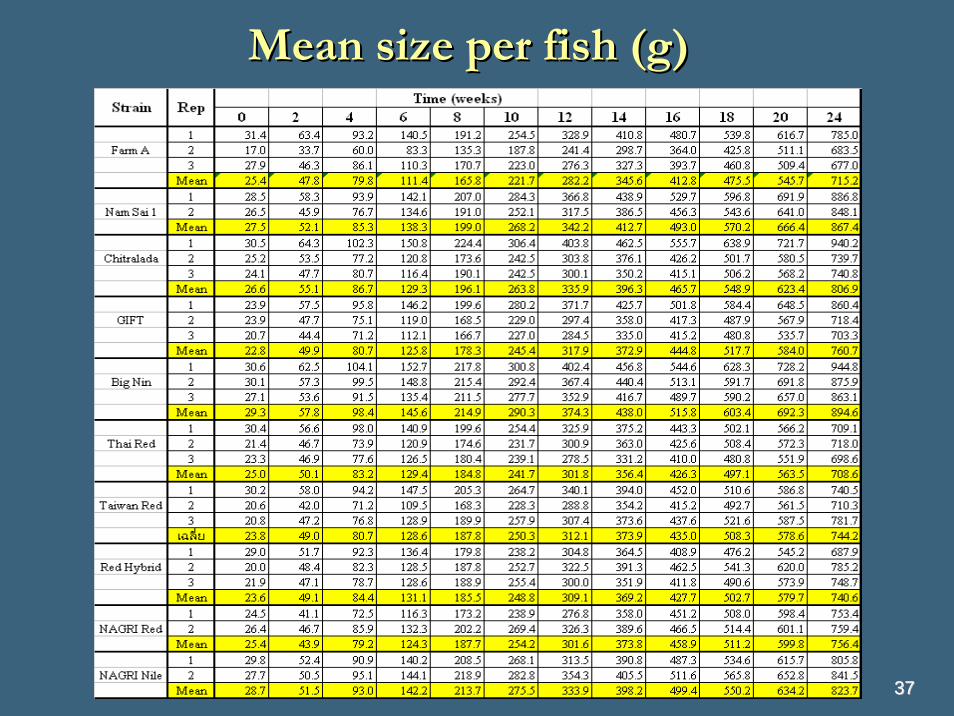
Mean size per fish (g)Mean size per fish (g)

©© Nam Sai Farms Co. Ltd 2008Nam Sai Farms Co. Ltd 2008 3838
Fish remaining per cageFish remaining per cage

©© Nam Sai Farms Co. Ltd 2008Nam Sai Farms Co. Ltd 2008 3939
Biomass per cage (kg)Biomass per cage (kg)

©© Nam Sai Farms Co. Ltd 2008Nam Sai Farms Co. Ltd 2008 4040
Food Conversion RatioFood Conversion Ratio

©© Nam Sai Farms Co. Ltd 2008Nam Sai Farms Co. Ltd 2008 4141
Average Daily Gain (g/fish/day)Average Daily Gain (g/fish/day)
©© Nam Sai Farms Co. Ltd 2008Nam Sai Farms Co. Ltd 2008 4242
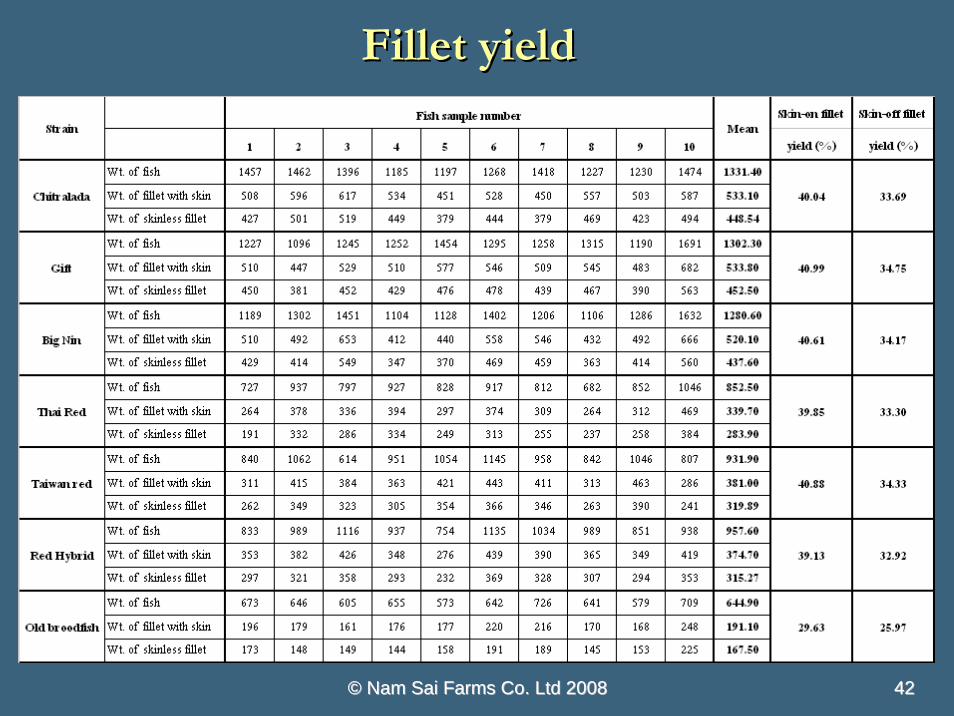
Fillet yieldFillet yield