Nam Et and Phou Loei National Biodiversity...
28
Field Study: Lao PDR Nam Et and Phou Loei National Biodiversity Conservation Areas
Transcript of Nam Et and Phou Loei National Biodiversity...

Field Study: Lao PDR
Nam Et and Phou Loei NationalBiodiversity Conservation Areas

Field Study: Lao PDR
Section 1 Introduction .......................................................................................................................................43
Section 2 Background to the NBCAs ...........................................................................................................442.1 The Protected Areas ............................................................................................................442.2 Socio-economic conditions in surrounding provinces ............................................... 452.3 Land and resource use in the NBCAs ............................................................................47
Section 3 Economic and development connections .............................................................................. 493.1 NBCA economic values .................................................................................................... 49
Direct values .................................................................................................................... 49Indirect values ................................................................................................................. 50Option values ....................................................................................................................51
3.2 Protected areas and development ...................................................................................51
Section 4 Economic benefits to villages and districts............................................................................. 524.1 Population and livelihoods ............................................................................................... 534.2 Contribution of NBCA resources to household income ............................................554.3 Contribution of NBCA resources to subsistence .........................................................554.4 Total value of NBCA resources for Viengthong District households ...................... 57
Section 5 Provincial, national and global economic benefits ............................................................... 605.1 Watershed catchment protection values for Houaphan Province ......................... 605.2 Future economic options for NBCA goods and services ......................................... 61
Ecotourism options ........................................................................................................ 61Options for the downstream use of water resources ........................................... 62Options for the commercial development of wild species ................................. 62
5.3 Global economic benefits ..................................................................................................... 63
Section 6 Conclusions and recommendations......................................................................................... 64Institutional reform ......................................................................................................................... 64
Poverty alleviation .......................................................................................................... 64National development programs ............................................................................... 64
Section 7 References and selected reading.............................................................................................. 66Annex Data derivation and sources, Figures 1 and 4 ........................................................................ 68
Figure 1 Location of Nam Et and Phou Loei NBCAs .............................................................................44Figure 2 NEPL’s economic values .............................................................................................................. 49Figure 3 NEPL and the surrounding economy ......................................................................................... 51Figure 4 Poverty and Viengthong District NBCA villages .................................................................... 52Figure 5 Contribution of NBCA resources to household cash income.............................................55Figure 6 Annual household consumption of forest products by weight .......................................... 56
Table 1 Provincial and district boundaries in NEPL NBCAs............................................................... 45Table 2 Population in Houaphan, Luang Prabang and Xieng Khouang provinces ..................... 45Table 3 Land use in Houaphan, Luang Prabang and Xieng Khouang provinces ....................... 46Table 4 Agricultural assets and land-use practices ............................................................................. 46Table 5 Poverty indicators in Houaphan, Luang Prabang and Xieng Khouang provinces ........ 47Table 6 Government and donor expenditures ....................................................................................... 47Table 7 Villages inside and adjacent to NEPL NBCAs ........................................................................48Table 8 NBCA population, Viengthong District ..................................................................................... 53Table 9 Socio-economic characteristics of Viengthong District NBCA villages........................... 54Table 10 Opium production and income in selected NBCA villages, Viengthong District ...........55Table 11 Value of NBCA resources for home consumption ................................................................ 56Table 12 Total value of NBCA resources for Viengthong District households................................. 57Table 13 Comparison of forest value: NEPL and other areas of Lao PDR ...................................... 58Table 14 Difference in NBCA forest product value according to agricultural assets .................... 58Table 15 Difference in NBCA value according to household cash income .................................... 59Table 16 Catchments in NEPL NBCAs...................................................................................................... 60Table 17 Value of production in Houaphan Province supported by NEPL watersheds ................ 61

43
Section 1Introduction
This field study investigates the economic benefits provided by two adjoiningNational Biodiversity Conservation Areas (NBCAs): Nam Et and Phou Loei(NEPL). These NBCAs were selected by the Department of Forest ResourceConservation for the field study for the following reasons:
• they comprise a single protected area complex;• they form an upland area typical of northern Lao PDR, containing a mix of
montane forest and shifting cultivation;• they contain biodiversity of national, regional and global importance;• they include natural resources of critical importance to local, provincial
and national development; and• there is an existing support project for management of the protected areas.
The study investigated the contribution of these two protected areas to economic activities in surroundingprovinces, districts and villages. To define the scope and content of the study, the various economicbenefits of NEPL were described and assessed. Selected benefits were chosen for detailed analysis,according to the following criteria:
• diverse, representative and generally relevant and generated for different groups and at different levelsof scale;
• issues regarded by political, economic and protected area planners as being of critical significance todevelopment goals; and
• practicable and achievable data collection, methodology and analysis needs within the limited timeframe, resources and capacity of the field study.
In line with these criteria, the following economic relationships were selected as detailed case studies:
• the household value of forest products from the NBCAs in Vienthong District;• the downstream value of forest watershed catchment protection to energy and agriculture sectors in
Houaphan Province;• the economic potential of future options for developing and using NBCA goods and services; and• the value of forest carbon sequestration and climate services.

44 Field Study: Lao PDR
Section 2Background to the NBCAs
2.1 The Protected Areas
Nam Et and Phou Loei NBCAs are located in the northeastern part of Lao PDR(Figure 1). Since they form a contiguous area and share a common boundaryalong a 30-km stretch, they can be treated as a single ecological and manage-ment unit. The Vietnam border bounds Nam Et NBCA on the north side; Route 1,the main highway in northern Lao PDR, bisects the upper part of Phou LoeiNBCA. Originally gazetted to cover an area of just over 4,200 sq. km, the NBCAsare being extended to 5,500 sq. km.
Most of the land in NEPL is hilly or mountainous (over 60 per cent of the combined area is over 1 ,000metres ASL). Nam Et contains a mosaic of secondary mixed deciduous forest, with areas of bamboo andshrubland indicating extensive slash and burn agricultural practices in the past (MAF and IUCN 1998).Phou Loei has significant old growth mixed deciduous forest, with montane evergreen forest dominatingthe higher altitudes.
Figure 1. Location of Nam Et and Phou Loei NBCAs

Section 2: Background to the NBCAs 45
NEPL has a high conservation value, with some of the highest faunal biodiver-sity of any protected area in northern Lao PDR (MAF and IUCN 1998, WCS1998). It supports a tiger population of international importance, as well as atleast 17 other key large mammal species of conservation concern. There aresizeable numbers of Gaur (Bos gaurus), Banteng (Bos javanicus), the goat-likeblack muntjac (a species new to science), various medium-size cats such asGolden cat (Catopuma temmincki) and Clouded Leopard (Neofelis nebulosa),two species of bears including Asiatic black bear (Ursus thibetanus), at leastsix species of primate, including the White-cheeked gibbon (Hylobatesleucogenys), at least three bat species previously unrecorded in Lao PDR andone species of bat unrecorded anywhere else. Nearly 300 bird species havebeen recorded, 35 of which are key species of conservation concern.
2.2 Socio-economic conditions in surrounding provinces
Almost two thirds of the land area of NEPL is situated within Viengthong District of Houaphan Province(Table 1). The NBCA also includes smaller parts of Houamueang, Xam Neua and Et districts of HouaphanProvince, Viengkham and Phonsai districts of Luang Prabang Province, and Phukoodt District of XiengKhouang District.
Table 1. Provincial and district boundaries in NEPL NBCAs
Province District area (km2) % of total NBCA area
Houaphan Vienthong 2,800 66.2
Xam Neua 609 14.4
Et 193 4.5
Houameuang 118 2.8
Luang Prabang Vienkham and Phonsai 424 10.0
Xieng Khouang Phukoodt 86 2.0
Total 4,230 100.00
From MAF and IUCN 2001a, b
In 2000, the combined population of the three provinces surrounding Nam Et and Phou Loei NBCAs(Houaphan, Luang Prabang and Xieng Khouang) was some 924,000 people (Table 2). This represents justless than one fifth of the total population of the country. With a predominantly rural demographic, popula-tion densities in Houaphan and Xieng Khouang provinces are well below the national average, at 14–17persons per sq. km. The population density in Luang Prabang is more than 1.5 times higher than that.
Table 2. Population in Houaphan, Luang Prabang and Xieng Khouang provinces
Province area districts villages households no. people pop. density % rural*(km2) (per km2)
Houaphan 16,500 8 854 36,000 282,214 17 94
Luang Prabang 16,875 11 1,162 64,000 420,847 25 89
Xieng Khouang 15,880 7 507 37,000 231,422 15 93
Lao PDR 236,800 141 11,251 800,000 5,277,073 22 83
*From MAF 2000; all others from UNDP 2002

46 Field Study: Lao PDR
Farming is the major rural land use and livelihood in all three provinces; agricultural landholdings accountfor approximately 177,000 ha (Table 3). Farmland comprises a relatively small proportion of the total landarea (two per cent of Houaphan and Xieng Khouang and six per cent of Luang Prabang). From 90–95 percent of agricultural land is used for rice and other arable crops. Most land is cultivated under rainfedproduction techniques. Irrigated fields account for a very small proportion: five per cent in Houaphan andXieng Khouang, and 11 per cent in Luang Prabang, far lower than the national average of 22 per cent.
Table 3. Land use in Houaphan, Luang Prabang and Xieng Khouang provinces
No. agricultural landholdings Arable land Irrigated Planted ricelandholdings (000 ha) (000 ha) area (ha) area (000 ha
per season)
Houaphan 36,900 40.2 38.0 1,800 12.5
Luang Prabang 55,700 98.1 87.5 9,320 11.5
Xieng Khouang 28,100 38.7 34.9 1,270 14.5
Lao PDR 668,000 1,048.0 877.0 197,200 500.0
From UNDP 2002
Between 90 and 98 per cent of households have access to agricultural land (Table 4). The average land-holding size is smallest in Houaphan (1.09 ha per household), slightly larger in Xieng Khouang (1.38 ha)and larger again in Luang Prabang Province (1.76 ha per household). This notwithstanding, a higherproportion (over half) of households in Houaphan and Xieng Khouang have access to irrigated land, andown cattle and buffalo. The incidence of slash and burn agriculture is significantly higher than the nationalaverage in Houaphan (76 per cent of villages) and Luang Prabang (89 per cent of villages).
Table 4. Agricultural assets and land-use practices
access to average access to own large villages usingfarmland landholding irr igated land livestock slash and
(% hh) (ha) (% hh) (% hh) burn (%)
Houaphan 98 1.09 59 80 76
Luang Prabang 90 1.76 25 48 89
Xieng Khouang 94 1.38 62 79 46
Lao PDR 86 1.57 25 61 45
From UNDP 2002
Poverty, measured in terms of household access tothe basic food and non food items deemed neces-sary for a minimum standard of living, is widespreadthroughout Houaphan, Luang Prabang and XiengKhouang provinces. The Northern Region is thepoorest part of Lao PDR (UNDP 2002); poverty ishighest in Houaphan Province, where three quartersof the population were classified as poor in 1998, andwhere there has been little reduction in poverty overrecent years (Table 5). Per capita GDP is below thenational mean in all three provinces, and is only just

Section 2: Background to the NBCAs 47
over half of the average for Lao PDR in Houaphan. Other socio-economic indicators — such as infantmortality rate and access to safe water and medical facilities — underline the lack of basic services andinfrastructure.
Table 5. Poverty indicators in Houaphan, Luang Prabang and Xieng Khouang provinces
GDP per % poor decline in infant access to hospital morecapita index* 1998* poverty rate mortality safe water than 8 hrs
1992–98** rate* (% hh)* away (% hh)**
Houaphan 56 74.6 1.0 125 1.8 36
Luang Prabang 79 49.4 4.8 132 10.4 3
Xieng Khouang 92 34.9 9.9 121 1.8 8
Lao PDR 100 38.6 3.1 104 15.1 8
*From GOL 2000; **from UNDP 2002
Government expenditures are also low in Houaphan, Luang Prabang and Xieng Khouang provinces (Table6), as little as 79,000 Kip per capita per year in Luang Prabang Province, and 220,000–240,000 Kip percapita in Xieng Khouang and Houaphan provinces (less than half the national average). With foreign aid aswell as national public expenditures included, Houaphan and Luang Prabang province show low percapita expenditures of only 300,000–350,000 Kip per capita per year, compared to a national average ofmore than 837,000 Kip.
Table 6. Government and donor expenditures in Houaphan, Luang Prabang and Xieng Khouang
National % national Per capita nat’l Per capita nat’l
expenditure (Kmill) expenditures expenditure expen. (K000)
(K000) incl. foreign aid
Houaphan 65.53 8 240.94 302.4
Luang Prabang 31.93 4 78.65 349.9
Xieng Khouang 49.10 6 220.18 1,231.4
Lao PDR *848,530.00 *31 545.73 837.7
From UNDP 2002; *regions only
2.3 Land and resource use in the NBCAs
At least 160 villages are located in or beside NEPL, more than 100 of which are partially or wholly inside theNBCA boundaries (Table 7). Viengthong District has the largest proportion of NBCA land area as well asthe majority of the NCBA population (an estimated 70 per cent of NBCA resident and boundary villages,and up to 78 per cent of NBCA adjacent villages).

48 Field Study: Lao PDR
Table 7. Villages inside and adjacent to NEPL NBCAs
Province District villages inside or villages
on boundary of NBCA adjacent to NBCA
Houaphan Vienthong * 52 * 29
Xam Neua * 8 * 6
Et > 8 not known
Houameuang 5 7
Luang Prabang Vienkham and Phonsai * 27 * 12
Xieng Khouang Phukoodt 4 not known
Total > 104 > 54
From MAF and IUCN 2001b; *updated from Viengthong District survey data 2001
More than 80 per cent of the residents of NBCA villages farm as their primary occupation. While farming isdominated by upland subsistence cropping under slash-and-burn practices (MAF and IUCN 2001b), somecommunities also cultivate paddy. An average of 0.54 ha of land per family is given over to rice production,with more than half of farmers cultivating only upland rice, a third combining paddy and upland rice, andjust 13 per cent of families cultivating paddy only.
Although cash-crop farming is limited, due to low-quality produce, poor access to markets and small profitmargins, this is gradually changing as extension services advance and infrastructure improves. Non-ricecrops are grown in 60 per cent of NBCA villages, with an average cumulative cropped area of 0.64 ha perhousehold. This is mostly given over to maize but also includes peanuts, soybeans, sesame and vegeta-bles. Just under half of villages cultivate tree crops and fruits, including mango, tamarind, plums andbananas. Livestock is an important source of cash income and wealth in 80 per cent of villages. All vil-lages with livestock keep poultry and pigs, 94 per cent keep buffalo and half keep cattle. Average annualcash income is 3.5 million Kip per family, half of which is contributed by sales of crop and livestock pro-duce. Almost all households earn money from forest products, including NTFP and wildlife; they contributebetween a fif th and a quarter of annual cash income.
All of the villages in the area influence the NBCAs in some way, mainly through crop farming and forestproducts collection. Large areas of bamboo land indicate that slash and burn techniques were used forcrop cultivation in Nam Et in the past. Phou Loei NBCA appears to be less affected by swidden agriculture.
There is not enough data to gauge the impacts of local use of forest products, although it is known thatsome harvesting practices are destructive (orchid collection, for example, often involves felling whole
trees), and that certain products (i.e. eaglewood, rattan,Dioscera spp. and orchids) are collected at unsustainablelevels. Hunting, both for subsistence and to supply thewildlife trade, has been identified as a major threat tobiodiversity (MAF and IUCN 2001b). There is a highcommercial demand for wildlife (including bears, tigers,otters, deer, golden cats, pangolins and turtles) andwildlife parts. There is little evidence of large-scale log-ging, and roads and other infrastructure have had only aminor impact on the NBCA (WCS 1998).

Section 3: Economic and development connections 49
Section 3Economic and development connections
3.1 NBCA economic values
Unlike many other forest areas in Lao PDR, NEPL does not support a wide rangeof industrial and commercial sectors such as large-scale hydro-electric genera-tion, logging or tourism. Its main value lies in subsistence-level forest productharvesting, non-marketed ecological services, potential for support future eco-nomic activities, uses and markets, and intrinsic or non-use economic values.NEPL also yields a wide range of economic values (Figure 2). These encompassmore than cash income, and include the following:
• physical goods that can be consumed directly (direct values);• environmental and ecological services that support life (indirect values);• resources and landscapes that allow for future economic uses and services (option values); and• intrinsic economic significance, regardless of use (existence values).
Figure 2. NEPL’s economic values
Firewood
Wild foods
Medicines
Handicrafts
Housing materials
Grazing & fodder
Human habitation
Wildlife habitat
Catchment protection
Erosion control
Carbon sequestration
Future economic options:
Industrial, agricultural,
pharmaceutical, recreational
applications of wild species, genes
and landscapes
Landscape
Aesthetic
Heritage
Bequest
Cultural
Global biodiversity
Direct
Values
Direct
Values
Indirect
Values
Indirect
Values
Opt ion
Values
Option
Values
Existenc e
Values
Existenc e
Values
Direct values
Plant-based forest products are widely used for household subsistence and income by NBCA villages, andare also par t of district, provincial, national and cross-border trade and commerce. Almost 200 differentforest products are harvested by NBCA villagers; they are used for construction, handicraft production,wild foods, medicines, fodder, forage and domestic energy (MAF and IUCN 2001b). Some of the mostcommercially important forest products are orchid stems, paper mulberry, eaglewood, rattan, Diosceraspp., bamboo shoots and cardamom.
Wildlife is consumed by families living in and around the NBCA, including birds, snakes, frogs, porcupine,barking deer and wild pig. Various wildlife products collected in NEPL are also traded illegally, includingtiger bone, gaur parts, bears, pangolins and reptiles. Although data are limited, it appears that fish providean important source of protein to villagers (WCS 1998).

50 Field Study: Lao PDR
Fuelwood is used for cooking and heating by all thefamilies living in and around the NBCA, and is alsoused in the preparation of animal feed and distillingalcohol. Handicrafts, including musical instruments,weapons, baskets, mats and hats, incorporate rawmaterials from NBCA plants and animals.
Grazing, forage and fodder resources from NEPL areused by almost all the villages in and around theNBCA for buffalo, cattle, goats and pigs. Construc-tion materials, including timber, poles and roofing
materials, are used by almost all families living inside and around the NBCA. Commercial logging didoccur in the past, and there are several small privately-owned sawmills located around NEPL.
Indirect values
Rivers rising in NEPL, including the Nam Et (which flows into Et and Sop Bao districts), the Am Xeng(which flows into Viengkham District), the Nam Neun (which flows into Vietnam) and the Nam Khan andNam Xuang (which flow into Luang Prabang) provide supplementary dry season water for Xam Neua,Luang Prabang and other towns.
Hydro-electric facilities utilise water from streams that rise in the NBCA. These facilities supply villages inand around the NBCA as well as downstream urban settlements. A 60-kW scheme on the Nam Et nearXon Neua supplies nine villages, and a 250-kW dam on the Nam Sat supplies Viengthong District centreand ten villages (MAF and IUCN 1998). A medium-scale hydro-electric scheme on the Nam Peun has aninstalled capacity of 36 kW. At least 1,000 households villages in Houaphan Province rely on more than850 micro-hydro units which utilise watercourses originating in Nam Et and Phou Loei.
Irrigation projects utilise water resources rising in the NBCA, both for individual households and for small-holder schemes in areas downstream of the NBCAs. The development on the Nam Et near Xon Neua canirrigate 180 ha (MAF and IUCN 1998); a weir on the Nam Khan near Meuang Hiam can irrigate 45 ha; and aweir at Muang Peu irrigates 30 ha (MAF and IUCN 1998). Various other small weirs and irrigation systemswere built by the Lao-America Crop Control and Development Project and various other donors. Approxi-
mately 1,000 ha of irrigated paddy in Houaphan Province, including twolarge-scale schemes, rely on rivers originating in NEPL.
Water mills that utilise water resources rising in the NBCA are commonlyused to grind rice and animal feed. River travel takes place along water-courses rising from the NBCA, especially the Nam Et, Nam Khan, NamXeuang, Nam Xeng and Nam Neun.
Forests and grasslands in the NBCA provide atmospheric regulationservices, including carbon sequestration, oxygen release and micro-climate stabilisation.
NBCA land supports more than 100 villages. It also provides habitat for awide range of birds, mammals and reptiles, many of which are threat-ened or have conservation significance.
Section 3: Economic and development connections 51
Option values
The NBCA supports future options for economicactivities, such as the development of tourist andrecreational activities, water resources developmentand the use of wild species and genetic resources forvillage and commercial-level domestication andimprovement as well as pharmaceutical and industrialuses.
3.2 Protected areas and development
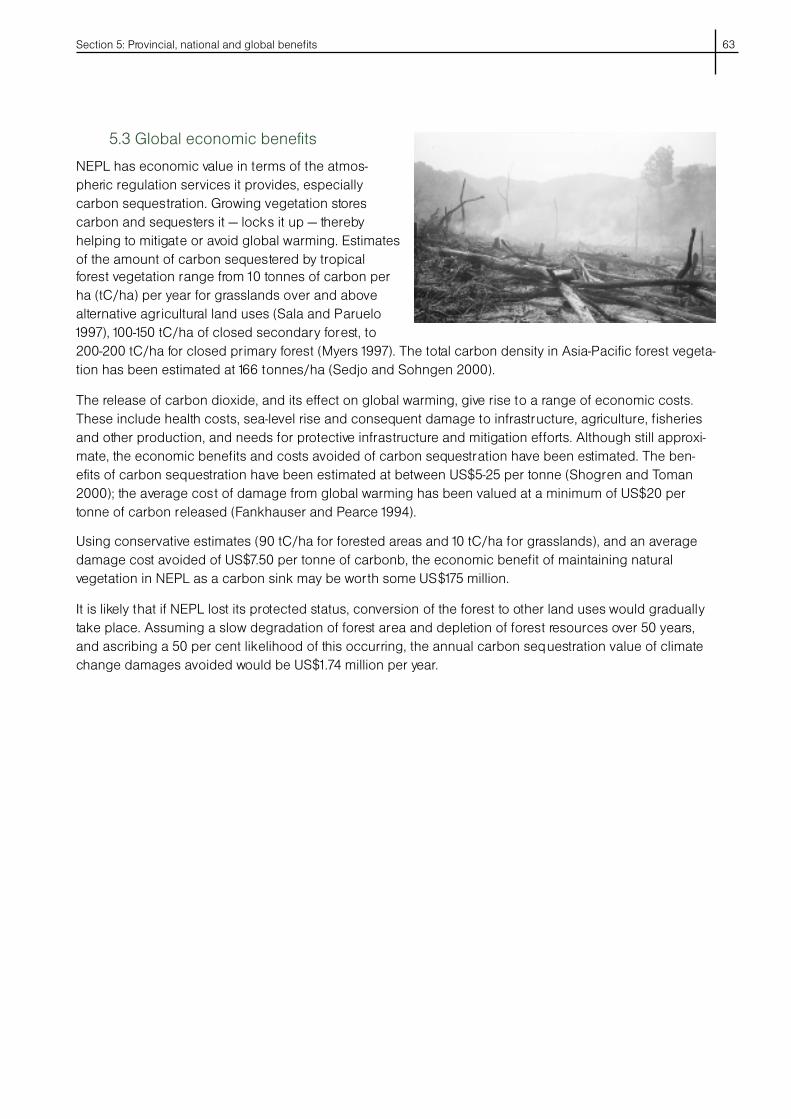
The goods and services described in section 3.1underpin economic activities at the village, district,provincial and even national level. They are closely linked to local, regional and national developmentprocesses, providing raw materials, services and other products which support economic production andconsumption. They can be grouped into four major levels, according to the types of values they generate,and the different groups, sectors and levels they benefit (Figure 3):
• NBCA forest land and resources contribute raw materials to household subsistence and income forcommunities living in and around the NBCAs;
• NBCA watershed catchment protection services ensure clean and regular water supplies for economicconsumption and production for local and downstream human populations, and support both small-scale and commercial production in the agricultural, energy and industrial sectors;
• NBCA option values help ensure local, regional, national and international economic growth andprosperity in the future, through such aspects as tourism development, commercial applications of wildspecies and gene pools, and water resources development.
• the value of forest carbon sequestration and climate services. NBCA atmospheric regulation servicesgenerate benefits that accrue at the global level to the international community, primarily throughmitigating the effects of global warming.
Figure 3. NEPL and the surrounding economy
GlobalVillage District Province National
DIR
EC
T
VA
LUE
SIN
DIR
EC
TV
ALU
ES
OP
TIO
N
VA
LUE
S
NTFPs:household livelihoodscommercial trade
Watershed services:hydro-electricirrigationurban water supplies
Climate services:global climate
Future options:tourismgenetic resources
Nam Et and Phou LoeiNBCAs

52 Field Study: Lao PDR
Section 4Economic benefits to villages and districts
Two thirds of the land area of NEPL (2,800 sq. km), and up to three quarters ofNBCA villages are situated in Vienthong District. The district is located inHouaphan Province, in the Northern Region of Lao PDR. The Northern Region isthe poorest part of Lao PDR; poor households comprise more than half thepopulation (Figure 4). Houaphan Province has the highest incidence of poverty(75 per cent) in the Northern Region and in the country as a whole (UNDP 2002).
The villages in and around NEPL in Viengthong District contain some of theprovince’s most vulnerable and remote households. The vast majority of peoplehave insufficient access to the basic food and non-food items deemed neces-
sary for a minimum standard of living and little cash income. They also suffer high infant mortality ratesand a lack of medical care, education, social services and other essential infrastructure. As described inthe recent Participatory Poverty Assessment (NSC and ADB 2001), they live in upland forested areas,practising slash and burn agriculture to produce upland rice and other crops for domestic consumption,and relying on forest products collection for home use and sale in order to compensate for rice shortages.
Figure 4. Poverty and Viengthong District NBCA villages

Section 4: Economic benefits to villages and districts 53
In this context of limited and insecure livelihoods, andof widespread rural poverty, the natural resources ofNEPL provide essential economic support to house-hold subsistence and income for the villages ofViengthong District.
4.1 Population and livelihoods
Almost all of the 80 or so villages in ViengthongDistrict are in or near NEPL (Table 8), with a residentor semi-resident population of almost 14,000 persons(58 per cent of the total district population). Accord-ing to Schlemmer (2001), the major ethnic groups in the NBCA population are Hmong and Yao/Mien (29per cent), Khm’u (27 per cent) Phu Tai (22 per cent) and Tai Lao (10 per cent).
Table 8. NBCA population, Viengthong District
villages households persons % district pop.
Type I Enclave villages 18 745 6,025 25
(entirely inside NBCA boundary)
Type II Straddle villages 33 1,255 7,926 33
(on boundaries, with land inside NBCA)
Type III Adjacent villages 11 659 4,207 17
(bordering NBCA)
Type IV External villages 18 1,032 6,209 25
(outside, but affecting, NBCA)
Viengthong District 81 3,691 24,367
Houaphan Province 847 39,357 267,152
NBCA village type definitions from Southammakhot 2000. From MAF and IUCN 2001b;*updated from Viengthong District survey data 2001.
Most households in Viengthong District have a similar livelihood strategy that combines farming, keepinglivestock, hunting and NTFP collection, although there are clear differences in access to productive assetsand income. Villages located in and on the border of the NBCA have less access to productive assets andincome-earning opportunities than those in other parts of the district (Table 9).
While there is little variation in cropped area and area planted with rice, households living outside theNBCA engage in a greater range of rice farming activities. The majority of NBCA residents rely on uplandrice only; villages outside the NBCA combine upland rice with rainfed and irrigated paddy production.Villagers living inside the NBCA tend to have more livestock, but also have markedly lower rice yields andper capita rice production. Noticeably fewer NBCA villages cultivate other cash and tree crops. While themajority of families in the district farm as their primary occupation, households living outside the NBCAalso engage in other occupations, such as trade and paid employment. The average household, agricul-tural and non-farm cash income is also significantly lower for NBCA resident villages.

54 Field Study: Lao PDR
Table 9. Socio-economic characteristics of Viengthong District NBCA villages
Viengthong Inside NBCA NBCA bound. NBCA AdjacentDistrict (Type I) (Type II) (Types III + IV)
Agriculture
Cumulative cropped area (ha/hh)* 0.64 0.69 0.68 0.57
Rice area (ha/hh) 0.58 0.59 0.61 0.54
Upland rice yield (kg/ha) 2,600 2,400 2,600 2,700
Rice production (kg/capita) 249 177 290 247
% planting wet season/rainfed paddy 70 44 74 83
% planting dry season/irrigated paddy 14 0 6 31
% planting upland rice 98 94 97 100
% planting cash crops 67 56 62 67
% planting tree crops 44 33 44 52
Livestock ownership (TLU/household) 2.22 3.37 2.27 1.46
Primary occupation
% farming 93 99 98 85
% trade 3 0 0 6
% employed 3 0 1 6
% none/other 2 1 1 3
Cash income
Total income (Kip mill/hh/yr) 4.41 3.49 4.44 4.95
Agricultural income (Kip mill/hh/yr)* 2.04 1.84 2.20 1.97
Non-farm income (Kip mill/hh/yr) 2.37 1.64 2.24 2.98
*Excludes opium. Calculated from Viengthong District survey data 2001;TLU: Tropical Livestock Unit (1 TLU = 250 kg live body weight)
Opium cultivation has a long history in Viengthong District, and the district was thought to have one of thecountry’s highest rates of opium production during the 1980s. Opium production, which requires a coldclimate, high altitude and limited sunlight, is particularly widespread in northern parts of the district. Pro-duction reportedly declined during the implementation of the Lao-American Project in the late 1980s andearly 1990s, but has risen with the completion of the project (Schlemmer 2001). It is difficult to gauge theoverall contribution of opium to local economies in Viengthong District, although it clearly provides anextremely important income source in some areas. Data from selected NBCA villages show a great varia-tion in the extent and economic importance of opium in different villages around NEPL (Table 10).

Section 4: Economic benefits to villages and districts 55
Table 10. Opium production and income in selected NBCA villages, Viengthong District
Village % of total Harvest Value Cash income % of villagefarmers (kg/yr) (Kip mill/yr) (Kip mill/yr) agric. income
Buamphat (inside NBCA) 98 21.5 34.62 27.29 22.6
Ponexong (inside NBCA) 9 0.4 0.62 0.31 0.3
Long Ngua Pa (inside NBCA) 100 51.0 82.07 70.04 33.9
Nam Neun (inside NBCA) 100 28.4 45.71 40.03 36.7
Xay (NBCA boundary) 52 2.1 3.35 0.74 0.5
Data on opium production from Schlemmer 2001, data on other agricultural income calculated from ViengthongDistrict survey data 2001
4.2 Contribution of NBCA resources to household income
In all villages in the district, forest resources (mainly NTFP and wildlife products) provide a major source ofhousehold cash income: 57 per cent of household cash income for villages located inside and on theboundary of the NBCA, and 19 per cent for NBCA adjacent households (Figures 5a and 5b, Table 18).
Figures 5a and 5b. Contribution of NBCA resources to household cash income
4%: NBCA wood
41%: agriculture
20%: other
20%: services
6%: other forest
13%: NBCA(forest products)
16%: NBCANTFP
2%: NBCA wildlife
33%: NBCA agriculture
45%: non-NBCA(includes forest products, agricultural and non-farm income)
5a. Inside and bordering NBCA: 4.1 mil Kip/hh/yr 5b. Adjacent and external to NBCA: 5.0 mil Kip/hh/yr
Calculated from Viengthong District survey data 2001.
The cash income contribution of NBCA resources is high for all households,averaging 38 per cent of total income or 1.7 million Kip/hh/yr across thedistrict. It ranges between 56 per cent of household income (2.28 million Kip)for villages inside or bordering the NCBA to 13 per cent of household income(0.66 million Kip) for NBCA-adjacent villages.
4.3 Contribution of NBCA resources to subsistence
NBCA resources also meet a range of household subsistence needs, includ-ing forest land for crop cultivation, food, medicine, fodder, and constructionand handicraft materials. More than 40 species of trees, 15 bamboos, 34 wildvegetables, 6 palms, 7 grasses, 4 vines, 12 wild fruits, 56 medicinal plants and13 mushrooms (many harvested from the NBCA) are used by villagers in thedistrict (MAF and IUCN 2001b). NBCA households consume an average of165 kg of wild plant products and 141 kg of wild meat (Figures 6a and 6b).

56 Field Study: Lao PDR
Figures 6a and 6b. Annual household consumption of forest products by weight
5%: frogs
55%: bamboo shoots
38%: vegetables
2%: fruit
5%: mushrooms
12%: insects, molluscs and crustaceans
4%: birds
14%: othermammals and reptiles
20%: deer and wild pig
45%: fish
6a. Wild meat: 141 kg/yr 6b. Wild plants: 165 kg/yr
Calculated from Schlemmer 2001
Valuing these home-consumed items at local market prices results in a total subsistence value of NBCAresources for Vienthong District households from between 1.9 million Kip (for NBCA-adjacent villages) and4.6 million (for villages inside the NBCA), with an average household value of 3.1 million a year in thedistrict (Table 11).
Table 11. Value of NBCA resources for home consumption
Value (Kip 000 per household per year)
Viengthong Inside NBCA NBCA boundary Adjacent to NBCA
District (Type I) (Type II) (Types III + IV)
Housing materials 159 183 165 138
Firewood 707 992 680 560
Bamboo shoots 64 74 66 55
Wild vegetables 32 37 33 28
Mushrooms 26 30 27 23
Wild fruits 3 3 3 2
Deer and wild pigs 304 350 315 263
Other mammals and reptiles 174 200 180 150
Birds 99 114 103 86
Fish 575 662 596 497
Insects and molluscs 72 83 75 62
Frogs 92 107 96 80
Agricultural home consumption 789 1,794 935 —
Total home consumption 3,096 4,628 3,274 1,942

Section 4: Economic benefits to villages and districts 57
4.4 Total value of NBCA resources for Viengthong District households
The local use of forest land and resources from NBCA and non-NBCA areas in and around NEPL is worthmore than 16.5 billion Kip a year for households in the district (Table 12). Annual NBCA values are 2.7million Kip for households outside the NBCA, 5.4 million Kip for those bordering the NBCA, and almost 7.3million Kip for villages in the NBCA. Subsistence use of NBCA resources comprises the bulk of annualvalue for all households, although NBCA-based income is highest within the protected areas.
Table 12. Total value of NBCA resources for Viengthong District households
Kip million/household/year Kip billion/year
Inside Boundary Adjacent District
Home consumption
wood products 1.18 0.85 0.70 3.12
wild plants 0.14 0.13 0.11 0.45
wild meat and fish 1.52 1.36 1.14 4.76
agriculture 1.79 0.94 — 2.51
total home consumption 4.63 3.27 1.94 10.84
% home consumption 64.00 61.00 73.00 65.00
cash income
NTFP 0.55 0.69 0.51 2.13
wood products 0.16 0.20 0.14 0.61
wildlife 0.08 0.10 0.07 0.30
agriculture 1.84 1.10 — 2.75
Total cash income 2.64 2.09 0.72 5.80
% cash income 36.00 39.00 27.00 35.00
Total NBCA value 7.27 5.36 2.67 16.64
Calculated from Viengthong District survey data 2001 and Schlemmer 2001.
These estimates — which average around US$300 per household per year for forest foods, firewood andNTFPs — are broadly comparable with data collected in other parts of the country (Table 13).

58 Field Study: Lao PDR
Table 13. Comparison of forest value: NEPL and other areas of Lao PDR
Note: data exclude some Nam Et and Phou Loei values, such as income from crops and livestock in NBCA areas.No data are available for medicinal plants, bamboo and rattan (“other NTFPs” include housing materials).
NEPL Other areas of Lao PDR
(US$/household/year)* (US$/household/year)**
Forest foods 168 200
Firewood 61 40
Other NTFPs 14 40
Subtotal 243 280
NTFP cash income 51 39
Total 294 319
*Based on all forest products, calculated for average household, figure adjusted to family of five persons (averageNEPL family size 6.7) to be comparable with data from other areas of Lao PDR. **From various sources, cited inFoppes and Ketphanh 2000; includes income from wood products and from crops grown/livestock grazed in NBCA,averaged across NBCA resident, border, adjacent and external households.
Table 14. Difference in NBCA forest product value according to agricultural assets
NBCA forest product value NBCA forest products
(Kip mill/hhold/year) as % of agricultural value
Viengthong District 3.16 82
NBCA resident villages 3.43 88
NBCA adjacent villages 2.67 73
Per capita rice production
Rice surplus households (>350 kg) 3.64 69
Rice balanced households (250-350 kg) 3.02 70
Rice deficit households (150-250 kg) 2.94 80
Severe rice deficit households (< 150 kg) 3.43 136
Cumulative cropped area
Highest cropped area (>1 ha) 4.77 72
High cropped area (0.75-1.0 ha) 3.06 71
Average cropped area (0.5-1.0 ha) 3.06 73
Lower cropped area (0.25-0.5 ha) 2.77 95
Lowest cropped area (< 0.25 ha) 3.35 193
Livestock
Most livestock (> 3 TLU) 3.99 74
Least livestock (1.5-3 TLU) 3.02 76
Average livestock (0.5-1.5 TLU) 2.71 91
Little or no livestock (< 0.5 TLU) 3.72 131
Forest value includes wood and NTFPs; total agricultural value includes production for subsistence and income fromboth NBCA and non-NBCA land. Calculated from Viengthong District survey data 2001.

Section 4: Economic benefits to villages and districts 59
The economic importance of NEPL resources varies for different types of households in the district. NBCAforest resource values are highest in cash terms for families with either the most or the fewest agriculturalassets, measured in terms of per capita rice production, cumulative cropped area and livestock ownership(Table 14). These indicators reflect those emphasised in the 2001 Poverty Reduction Strategy Paper (GOL2001), which sees degree of rice self-sufficiency as the primary determinant of poverty, lack of arable landas a secondary condition of poverty, and livestock ownership as the primary indicator of wealth.
Richer households generate the highest overall income from NBCA forest products, possibly due tohigher-value commodities. For the poorest households, high levels of such income likely reflect theirreliance on sales of wildlife and NTFP due to the absence of alternative sources of income. These house-holds also rely heavily on NBCA forest products, reflected in the very high value of such products relativeto agricultural income. For the households with the fewest agricultural assets, the annual value of forestconsumption is consistently higher than the value of agricultural production.
Both cash income and total value, measured in total and agricultural income obtained from NEPL, arehigher for high-income households (Table 15). The contribution of NBCA resources to the householdeconomy is, however, much higher for cash-poor households (contributing nearly half of cash income, andalmost two thirds of subsistence)
Table 15. Difference in NBCA value according to household cash income
Household cash income Total household value
(Kip mill/year) as % of total (Kip mill/year) as % of total
Viengthong District 1.69 38 4.81 54
NBCA resident villages 2.28 56 6.03 70
NBCA adjacent villages 0.66 13 2.67 29
Total household income
Higher income (>5.0 mill Kip/year) 3.38 34 6.50 44
Average income (2.5-5.0 mill Kip/year) 1.61 43 4.82 59
Lower income (<2.5 mill Kip/year) 0.78 45 3.69 62
NBCA products include both forest and agricultural items from NBCAs; total household value includes farm, NBCAand non-farm items from within and outside of NBCAs. Calculated from Viengthong District survey data 2001.

60 Field Study: Lao PDR
Section 5Provincial, national and global economic benefits
As well as making a direct contribution to household income and subsistence,NEPL generates many other economic benefits to the economies of the sur-rounding district and province, and at national and global levels. These benefitsinclude the provision of ecological services that underpin production and con-sumption and those vital life-support functions that enable broader economicactivities to occur. These benefits are for the most part non-marketed; theyaccrue indirectly.
5.1 Watershed catchment protection values for Houaphan Province
Numerous permanent and semi-permanent streams and rivers form an important watershed catchmentarea for both Lao PDR and Vietnam (Figure 8). NEPL cover a large part of the catchment for at least fourmajor river systems: the Nam Et, Nam Khan, Nam Neun and Nam Xuang (Table 16).
The Nam Et and Nam Neun rise in Nam Et NBCA, draining east to Vietnam and ultimately into the TonkinGulf. The Nam Khan and Nam Xuang rise in Phou Loei NBCA, flowing southwest and draining into theMekong River near Luang Prabang.
Table 16. Catchments in NEPL NBCAs
Catchment Location area (km2) % of total area
Nam Et Northern part of NBCA 2,194 52
Nam Khan South and southeastern part of NBCA 797 19
Nam Nern Eastern part of NBCA 780 18
Nam Xuang Southwestern part of NBCA 465 11
From IUCN 2001b
The water sources originating in NEPL have a wide range of domestic, agricultural and industrial eco-nomic uses, including hydro-electric generation and irrigation. In Houaphan Province alone, NEPL riversand their tributaries are known to support the following:
• at least three medium-scale hydro-electric schemes, with a combined capacity of more than 360kW anda total investment cost of more than US$2 million. An 80-kW scheme on the Nam Et supplies power toat least nine villages, a 250-kW scheme on the Nam Sat supplies power to Viengthong District Centre
and at least ten villages, and a 36-kW scheme on theNam Peun supplies power to at least five villages;• more than 850 micro-hydro units, serving more
than 1,000 households; and• at least 1,000 ha of irrigated rice production,
including two large-scale schemes that utiliseweirs, gabions, pumps and wooden water wheels.

Section 5: Provincial, national and global benefits 61
The combined gross value of those economic activities in Houaphan Province that depend on NEPLwatersheds is almost 6 billion Kip a year (Table 17). The economic contribution of NEPL extends beyondthe fact that the rivers upon which these activities depend rise there. The existence of the NBCA helpsensure the maintenance of forest cover and environmental quality in the rivers’ upper catchments. Thismaintains the quality and supply of water supplies, regulates the seasonal flow and reduces the amount ofdownstream silt and sediment. If forest cover was not protected in these upper catchments, the next mostlikely land use — clearance for agriculture — would undoubtedly have negative effects on water flow andquality, reducing the economic output and value of downstream hydro-electric generation and irrigation.
Table 17. Value of production in Houaphan Province supported by NEPL watersheds
Economic activity Direct beneficiary population Gross value of output (Kip million/yr)
Medium hydro 24 villages, one district centre 235 (traded value of electricity*)
Micro hydro > 1,000 households 410
Irr igated agriculture 1,000 ha of paddy rice 5,130 (gross returns to production)
Total 5,775
*Although this power is currently provided without charge, or at minimal cost, electricity originating in other parts ofthe country is traded domestically and exported. Power is impor ted to the country from Thailand and Vietnam at acost of three and six cents per kWh respectively. This traded value is used to determine the cost avoided of provid-ing electricity from imported sources.
5.2 Future economic options for NBCA goods and services
Very little of NEPL’s potential economic value is realised in cash terms. The area is relatively remote, andalmost no commercial or large-scale development of its resources has occurred. In conservation termsthere is undoubtedly an advantage to this isolation, one which may account for the relatively high levels ofbiodiversity, forest cover and ecological integrity. There are, however, clear opportunities to increase thesustainable economic values captured from the NBCA if it continued to be managed as a conservationarea. This could support socio-economic development in the future. Although some of these possiblefuture uses and economic options cannot be known now, others are listed below.
Ecotourism options
Lao PDR opened its doors to international tourists in 1990. Since then the tourism industry has developedrapidly to become one of the country’s largest earners of foreign currency; tourist arrivals increased fromless than 7,000 in 1990 to more than 720,000 in 2000 (ADB 2001). Up to 70 per cent of the country’stourists express an interest in nature (Robichaud et al. 2001), and the government has established broadguidelines for ecotourism development (Yamauchi and Lee 1999).
The National Tourism Authority has already established several ecotourism projects in cooperation withinternational and regional partners. Dong Houa Sao, Nam Kan/Nam Nga, Nam Ha, Phou Hin Poun, PhouKhao Khoay, Phou Xang He and Xe Piane NBCAs are being developed as nature tourism or ecotourismdestinations. Although these initiatives are in the early stage of development, they show that nature tourismcan be an important source of revenues for both government and local communities, and it can havesignificant multiplier effects on provincial and national economies. In Nam Ha NBCA, for example, tourismin the first quar ter of 2001 generated income of US$1,600 for local villages, more than US$3,000 for localfood sellers, guides and transporters, almost US$400 for the NBCA authority and over US$300 for theprovincial tourism office (calculated from data presented in Robichaud et al. 2001).
62 Field Study: Lao PDR
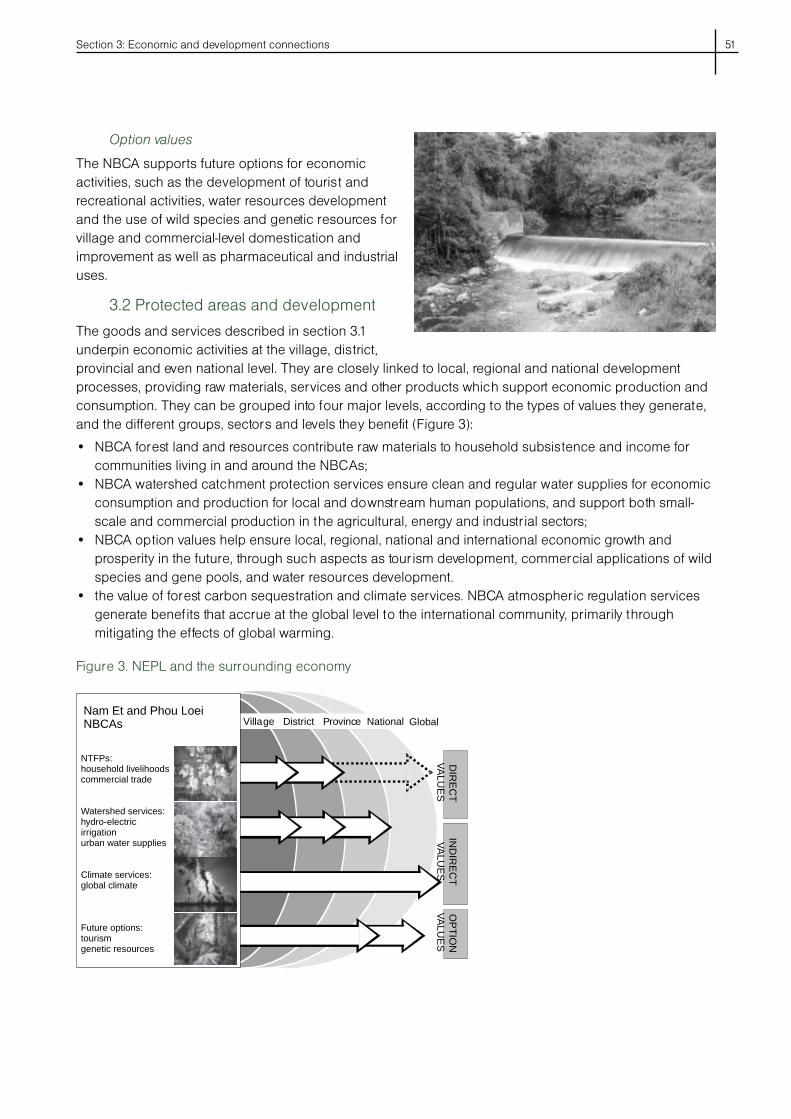
Tourism is virtually unknown in NEPL, althoughseveral sites exist in and around the NBCAwith potential interest for tourists and recrea-tional visitors, including hiking trails, culturaland historical sites, caves, waterfalls, hotsprings, wildlife and birdwatching, densetropical forest and local ethnic groups. NEPLcould be incorporated into the Luang Prabang-Xieng Khouang tourism circuit, and may proveespecially attractive once the nearby bordercrossing to Vietnam is opened.
Options for the downstream use of water resources
Lao PDR has an ambitious program to develop hydro-electric potential, which is envisaged as a means ofgenerating export and foreign exchange earnings and serving the country’s rapidly developing rural,urban and industrial sectors. At least three of the hydro-electric facilities proposed for future developmentdepend on rivers rising in NEPL: Nam Khan 1 (planned installed capacity of 115 MW and annual generationof 582 GWh), Nam Khan 2 (145 MW/726 GWh) and Nam Khan 3 (95 MW/474 GWh).
These developments have the potential to contribute to the costs of NBCA conservation, and to providethose economic benefits associated with increased power generation. Increasingly, other hydro-electricdevelopments in Lao PDR are recognising, and paying for, the watershed services provided by NBCAsand protected forest catchments. Nam Leuk Dam, for example, allocates 1 per cent of gross revenues toElectricité du Lao for conservation in Phou Khao Khoay NBCA, and the proposed Nam Theun 2 damplans to return US$1 million a year to watershed management in and around Nakai-Nam Theun NBCA.
Options for the commercial development of wild species
NEPL has a high biodiversity and is an important gene pool and in-situ repository of wild species, some ofwhich are globally unique, rare or endangered. These plant and animal resources have potential commer-cial values for a range of domestic, industrial, agricultural and pharmaceutical applications. It is importantto emphasise, though, that such values are highly speculative, are frequently overestimated, and will notincrease either incentives or funding for biodiversity conservation (Simpson 1997).
NEPL’s wild species may have future options for medicinal and pharmaceutical applications — a broadrange of medicines obtained from forest products is already used among local communities. In the devel-oped world 25 per cent of all medical drugs are based on plants or plant derivatives; in developing coun-tries the figure is 75 per cent (Pearce and Moran 1994). Recent research indicates that the higher plants ofthe world’s tropical forests contain about 375 potential pharmaceuticals, approximately one in eight ofwhich have already been discovered. A complete collection and screening of all tropical plant speciesshould be worth about US$3-4 billion to a private pharmaceutical company, and as much as US$147 billionto society as a whole (Balick and Mendelsohn 1995).
Although data are not available for Lao PDR, various studies have looked at the pharmaceutical value oftropical rainforest species in other countries and protected areas. It has been estimated, for example, thatthe minimum expected genetic value arising from medicinal applications of wild plants in Korup NationalPark, Cameroon, is US$7 per ha (Ruitenbeek 1989). In Belize, the sustainable harvesting of rainforestplants for medicinal purposes is thought to have a overall net present value of $3,327 per ha at localmarket prices (Balick and Mendelsohn 1992).
Section 5: Provincial, national and global benefits 63
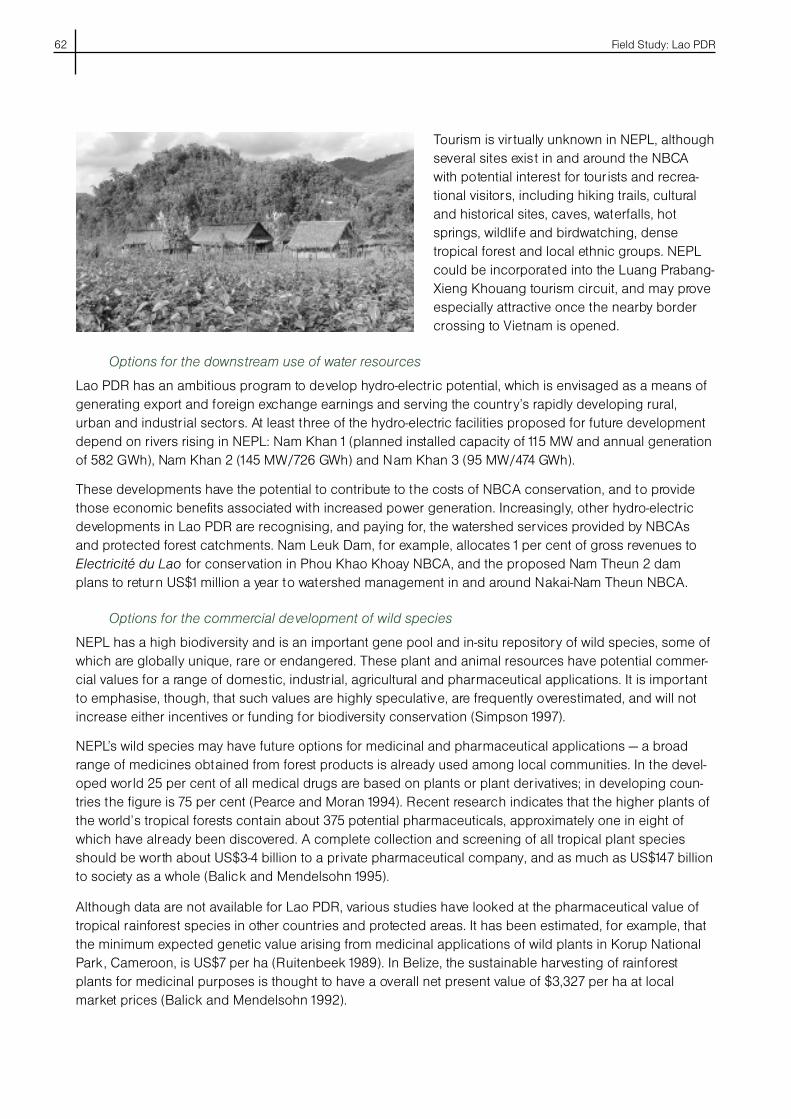
5.3 Global economic benefits
NEPL has economic value in terms of the atmos-pheric regulation services it provides, especiallycarbon sequestration. Growing vegetation storescarbon and sequesters it — locks it up — therebyhelping to mitigate or avoid global warming. Estimatesof the amount of carbon sequestered by tropicalforest vegetation range from 10 tonnes of carbon perha (tC/ha) per year for grasslands over and abovealternative agricultural land uses (Sala and Paruelo1997), 100-150 tC/ha of closed secondary forest, to200-200 tC/ha for closed primary forest (Myers 1997). The total carbon density in Asia-Pacific forest vegeta-tion has been estimated at 166 tonnes/ha (Sedjo and Sohngen 2000).
The release of carbon dioxide, and its effect on global warming, give rise to a range of economic costs.These include health costs, sea-level rise and consequent damage to infrastructure, agriculture, fisheriesand other production, and needs for protective infrastructure and mitigation efforts. Although still approxi-mate, the economic benefits and costs avoided of carbon sequestration have been estimated. The ben-efits of carbon sequestration have been estimated at between US$5-25 per tonne (Shogren and Toman2000); the average cost of damage from global warming has been valued at a minimum of US$20 pertonne of carbon released (Fankhauser and Pearce 1994).
Using conservative estimates (90 tC/ha for forested areas and 10 tC/ha for grasslands), and an averagedamage cost avoided of US$7.50 per tonne of carbonb, the economic benefit of maintaining naturalvegetation in NEPL as a carbon sink may be worth some US$175 million.
It is likely that if NEPL lost its protected status, conversion of the forest to other land uses would graduallytake place. Assuming a slow degradation of forest area and depletion of forest resources over 50 years,and ascribing a 50 per cent likelihood of this occurring, the annual carbon sequestration value of climatechange damages avoided would be US$1.74 million per year.

64 Field Study: Lao PDR
Section 6Conclusions and recommendations
Protected areas are often considered to have little or no economic value, and tohave little relevance to development. They are typically seen as an non-economicuse of land and resources, an obstacle to growth, and a drain on scarce publicfunds. The example of Nam Et-Phou Loei shows that this is clearly not the case.NBCAs have a demonstrably high economic value, for many groups and sectors.
This includes fuel, medicines, foods, construction materials, crop land andpasture. NEPL contributes subsistence goods worth up to 4.6 million Kip perhousehold per year (11 billion Kip total for the district).
NEPL provides income through the sale of various plant and animal products. NEPL generates householdcash income worth up to 2.6 million Kip per household per year (6 billion Kip in total for the district).
Inputs and raw materials include water for irrigation and hydro-electric generation, and basic services andamenities such as clean and regular water supplies and flood control. NEPL enables energy and agricul-tural sector output in Houaphan Province worth almost 6 billion a year.
NEPL is the source of future economic growth and prosperity, locally, provincially and nationally. It has thepotential to support future tourism activities, water developments, and commercial applications of wildspecies.
Institutional reform
NBCAs also underpin national development goals, priority program areas and ongoing institutional re-forms in Lao PDR.
Poverty alleviation
Poverty alleviation is the major focus of the national development strategy for Lao PDR, as defined in theSeventh Party Congress. The government aims to reduce poverty by half by the year 2005, and to eradi-cate it completely by 2010. Most of NEPL is in Houaphan Province, the poorest province in the country,with a poverty rate of 75 per cent. The per capita GDP for Lao PDR is predicted to be $374 in 2002 (ADB2001), the GDP for Houaphan Province GDP is estimated at 56 per cent of this, or $204 (UNDP 2002).
The average direct value of NBCA resources for some of the country’s poorest villages in HouaphanProvince is $486 per household per year, over one third of per capita GDP. For villages inside the NBCA,which are among the most vulnerable in the province, this rises to $734 per household, over half of percapita GDP.
For the poorest households — who suffer rice deficits, own little or no livestock, have limited access tocropland and have few sources of income — NBCA resources comprise up to half of household cashearnings and contribute nearly two thirds of the total household economy.
National development programs
Eight high-priority national development programs have been defined for Lao PDR, including food produc-tion, commercial production, infrastructure development and rural development. NBCA resources are avital food source, providing up to 141 kg of protein and 165 kg of wild plants per family per year. This isworth an average of almost 1.5 million Kip per household per year.

Section 6: Conclusions and recommendations 65
The NBCA also supports district and provincial commerce and infrastructure, including trade in NTFPs,agriculture and the energy sector. If used sustainably, existing and potential developments and applica-tions of NBCA landscapes, goods and services can contribute significantly to future rural developmentand generate economic benefits at local, district, provincial and national levels.
In 2000 decentralisation became a key strategy for future public sector operations, with provinces definedas strategic units, districts as planning and budgeting units and villages as implementing units. Increas-ingly, provinces are being charged with generating and collecting revenues which will go towards expendi-tures for development and maintenance.
NEPL already provides substantial support to provincial revenues and earnings, minimises public expendi-tures through the provision of essential goods and services, and contributes to village, district and provin-cial economies:
• the annual worth of NBCA resource use for Viengthong villages is over 16 billion Kip, equal to the totalgross product for the district in 2000;
• total government expenditures, of 240,900 Kip per capita, are more than matched by income earnedfrom NBCA resources in Houaphan Province; and
• the equivalent traded value of power generated from the Nam Sat in the Viengthong District portion ofthe NBCA is worth almost twice as much as the entire annual district revenues for Viengthong District(83.6 million Kip).
These high values provide important and much-needed support for investment in NBCAs. The economicvalues associated with NBCAs, such as these outlined for Nam Et-Phou Loei, must be factored into plan-ning and decision-making. Until there is a clear understanding of the economic connections betweenNBCAs and surrounding development processes, NBCAs will continue to be seen as economic liabilitiesrather than economic assets by both development and conservation planners.
There is a real danger that as long as NBCA conservation concerns are omitted from development andbudgeting decisions, and economic concerns are marginalised in NBCA planning and management, theireconomic value will remain largely unappreciated and uncaptured. This field study makes it clear thatNBCAs already make a substantial contribution to village, district, provincial, national and even globaleconomic processes, and have the potential to play an important role in future development and growth.Inadequate investment in NBCAs, and the resulting degradation and loss, can give rise to immense eco-nomic and development losses to the Lao economy. Neither the population nor the government can affordto bear these costs, now or in the future.

66 Field Study: Lao PDR
Section 7References and selected reading
ADB. 2001. Lao PDR: Country Economic Review. CER: LAO 2001-11. Asian Development Bank, Vientiane.42 pp.
Balick, M. and R. Mendelsohn. 1995. “The value of undiscovered pharmaceuticals in tropical forests.”Economic Botany 49 (2): 223-228.
Balick, M. and R. Mendelsohn. 1992. “Assessing the Economic Value of Traditional Medicines from TropicalRainforests.” Conservation Biology 6 (1).
Fankhauser, S. and D. Pearce. 1994. The social costs of greenhouse gas emissions. In The Economics ofClimate Change. OECD, Paris.
Foppes, J. and S. Ketphanh. 2000. No more timber, no more non-timber? Discussion Paper. IUCN Non-Timber Forest Products Project in Lao PDR. IUCN – The World Conservation Union, Vientiane. 9 pp.
GOL (Government of Lao PDR). 2001. Interim Poverty Reduction Strategy Paper. Government PaperPrepared for the Executive Boards of the International Monetary Fund and the World Bank, Vientiane. 62pp.
GOL (Government of Lao PDR). 2000. State of the Environment Report 2000. Vientiane. 86 pp.
IRAP. 1998. District Accessibility Profile: Muang Viengkham. Province of Luang Prabang Integrated RuralAccessibility Planning with Rural Development Committee, MCTPC/SIDA/UNDP Project LAO/95/001,Vientiane.
IUCN. 1998. Project Proposal: Biodiversity Conservation and Integrated Community Development in NamEt and Phou Loei NBCAs, Lao PDR. IUCN – The World Conservation Union, Vientiane. 31 pp.
MAF. 2000. Agricultural Statistics 1975–2000. Ministry of Agriculture and Forestry, Vientiane. 172 pp.
MAF and IUCN. 2001a. Inception Report: Integrated Biodiversity and Conservation and CommunityDevelopment in Nam Et – Phou Loei NBCAs, Lao PDR. Ministry of Agriculture and Forestry and IUCN –The World Conservation Union, Vientiane. 23 pp. + appendices.
MAF and IUCN. 2001b. Progress Report: Integrated Biodiversity and Conservation and Community Devel-opment in Nam Et – Phou Loei NBCAs, Lao PDR. Ministry of Agriculture and Forestry and IUCN – TheWorld Conservation Union, Vientiane. 28 pp. + appendices.
MAF and IUCN. 1998. Project Document: Integrated Biodiversity Conservation and Community Develop-ment in Nam Et-Phou Loei National Biodiversity Conservation Areas, Lao PDR. Ministry of Agriculture andForestry and IUCN – The World Conservation Union, Vientiane. 22 pp. + appendices.
Myers. N. 1997. The world’s forests and their ecosystem services. In Daily, G. (ed.). Nature’s Services:Societal Dependence on Natural Ecosystems. Island Press, Washington, D.C.
NSC and ADB. 2001. Participatory Poverty Assessment. State Planning Committee National StatisticsCentre and Asian Development Bank, Vientiane.
Pearce, D. and D. Moran. 1994. The Economic Value of Biodiversity. Earthscan Publications Ltd, London.172 pp.
Section 7: References and selected reading 67
Pham, C. 1994. Economic Development in Lao PDR: Horizon 2000. Committee for Planning and Coopera-tion, Vientiane. 322 pp.
Robichaud, W., C. Marsh, S. Southammakoth and S. Khounthikoummane. 2001. Review of the NationalProtected Area System of Lao PDR. Lao-Swedish Forestry Program, Division of Forest Resources Conser-vation and IUCN – The World Conservation Union, Vientiane. 112 pp.
Ruitenbeek, H. 1989. Social Cost Benefit Analysis of the Korup Project, Cameroon. Report prepared forthe World Wide Fund for Nature, London.
Sala, O. and J. Paruelo. 1997. Ecosystem services in grasslands. In Daily, G. (ed.). Nature’s Services:Societal Dependence on Natural Ecosystems. Island Press, Washington, D.C.
Schlemmer, G. 2001. Integrated Biodiversity and Conservation and Community Development in Nam Et –Phou Loei NBCAs, Lao PDR: Community Livelihoods Analysis. Ministry of Agriculture and Forestry andIUCN — The World Conservation Union, Vientiane. 112 pp.
Sedjo, R. and B. Sohngen. 2000. Forestry Sequestration of CO2 and Markets for Timber. Discussion
Paper 00–35. Resources for the Future, Washington D.C.
Shogren, J. and M. Toman. 2000. How Much Climate Change is Too Much? An Economics Perspective.Climate Change Issues Brief No. 25, Resources for the Future, Washington, D.C.
Simpson, D. 1997. “Biodiversity Prospecting: Shopping the wilds is not the key to conservation.” Resources126, Resources for the Future, Washington, D.C.
Southammakhot, S. 2000. The protected area system in Lao PDR: Country Status Report 1999. In Galt, A.,Sigaty, T. and M. Vinton (eds.). The World Commission on Protected Areas 2nd Southeast Asia RegionalForum, Pakse, Lao PDR, 6-11 December 1999: Volume II. IUCN – The World Conservation Union,Vientiane.
UNDP. 2002. Lao PDR Human Development Report 2001: Advancing Rural Development. United NationsDevelopment Program, Vientiane.
WCS. 1998. A Wildlife and Habitat Survey of Nam Et and Phou Louey National Biodiversity ConservationAreas, Houaphanh Province, Lao PDR. Centre for Protected Areas and Watershed Management(CPAWN)/Wildlife Conservation Society (WCS) Cooperative Program, Department of Forestry, Ministry ofAgriculture and Forestry, Vientiane. 149 pp.
Yamauchi, S. and D. Lee. 1999. Tourism Development in the Lao People’s Democratic Republic. DESADiscussion Paper No. 9, Division for Sustainable Development, United Nations Department of Economicand Social Affairs. New York. 11 pp.

68 Field Study: Lao PDR
Annex: Data derivation and sources, Figures 1 and 4Protected Areas Ministry of Agriculture and Forestry (2002)Proposed PAs ICEM (2002). Digitised by ICEM from Duckworth J.W., Salter R.E. and Khounboline K. compilers (1999).
Wildlife in Lao PDR 1999: Status report. IUCN, WCS and CPAWM Centre for Protected Areas andWatershed Management.
Cities UNEP (1999)Roads Ministry of Agriculture and Forestry (2002)Rivers Ministry of Agriculture and Forestry (2002)Land use Ministry of Agriculture and Forestry (1997)Population Ministry of Agriculture and Forestry (2002)Poverty UNEP (1999)Provinces Ministry of Agriculture and Forestry (2002)Villages Ministry of Agriculture and Forestry (2002)5-km buffer ICEM (2002)
Land use
Land use categories for each countr y have been generalised to achieve cross-country land use categories, as detailed below:
Old land use New land useAgricultural hill fields AgricultureAgricultural land AgricultureAgricultural plantation AgricultureAgricultural wetland rice AgricultureBamboo Other vegetationBarren BarrenBarren land BarrenCloud UnclassifiedConiferous forest ForestCropping mosaic, cropping area <30% AgricultureCropping mosaic, cropping area >30% AgricultureDeciduous ForestDeciduous forest ForestDeciduous mosaic ForestDry dipterocarp ForestEvergreen forest ForestEvergreen mosaic ForestEvergreen, high cover density ForestEvergreen, medium-low cover density ForestForest plantation PlantationGrassland Other vegetationHabitat mosaic Other vegetationIndustrial crops AgricultureInundated WetlandInundated mosaic WetlandLimestone forest ForestLimestone karst without forest BarrenLower mixed deciduous forest ForestLower-dry evergreen forest ForestMangrove WetlandMangrove plantation PlantationMelaleuca forest ForestMixed (evergreen and deciduous)medium-low cover density ForestMixed (evergreen and deciduous),high cover density Forest
Old land use New land useMixed broadleaf and coniferous forest ForestMixed mosaic Other vegetationMixed timber and bamboo Other vegetationNatural mangrove WetlandNatural regenerating forest ForestOther UnclassifiedOther agriculture AgriculturePlantation forest PlantationPlantations PlantationPure bamboo Other vegetationRegrowth Other vegetationRegrowth, inundated WetlandRice paddy AgricultureRocks BarrenSand dunes BarrenSavannah Other vegetationScrub Other vegetationScrub with scattered trees Other vegetationSeasonally inundated grassland WetlandSemi-deciduous forest ForestSemi-natural melaleuca ForestSwamp WetlandUnclassified UnclassifiedUnstocked forest ForestUpland agriculture AgricultureUpper mixed deciduous forest ForestUrban Urban/industrialUrban or built-over area Urban/industrialUrban/industrial Urban/industrialWater WaterWater body WaterWetland WetlandWood- and shrubland, dry Other vegetationWood- and shrubland, evergreen Other vegetationWood- and shrubland, inundated Wetland
UNEP poverty indices
Poverty indices data was supplied by UNEP based on work performed by the Stockholm Environment Institute. Indices weredeveloped at district level using “consumption-based” poverty measures. Refer to the SEI report for further details: StrategicEnvironmental Framework for the Greater Mekong Subregion. PP57 Volume 1. SEI, ADB. March 2002.