
nal Jou R Body Composition Research
58
International Journal of Body Composition Research: 2013 Volume 11 Numbers 3 & 4 pages 67–116 IJBCR 2013: 11, Numbers 3 & 4: 35–66 ISSN 1479–456X 2013 Volume 11 Numbers 3 & 4 International Journal of Body Composition Research Editor Anja Bosy-Westphal, Stuttgart Editorial board www.ijbcr.co Published by Smith-Gordon Steven B. Heymsfield, Baton Rouge Tim R. Nagy, Birmingham AL Kristina Norman, Berlin Angelo Pietrobelli, Verona Guy Plasqui, Maastricht Leanne Redman, Baton Rouge Wei Shen, New York Analiza Monica Silva, Lisbon Marjolein Visser, Amsterdam ZiMiang Wang, New York
Transcript of nal Jou R Body Composition Research
International Journal of Body Composition Research Volume 11, Numbers 3 & 4, 2013 [67–118]
Generation of normal ranges for measures of body composition in adults based on bioelectrical impedance analysis using the seca mBCA S PEINE, S KNABE, I CARRERO, M BRUNDERT, J WILHELM, A EWERT, U DENZER, B JENSEN and P LILBURN 67
Waist circumference cannot be improved as an index of abdominal visceral fatness by combining it with correlates of abdominal subcutaneous fat or non-fat tissue RICHARD F BURTON and MICHAEL E J LEAN 77
Anthropometric indices as measures of body fat assessed by DXA in relation to cardiovascular risk factors in children and adolescents: NHANES 1999-2004 ZHAOHUI CUI, KIMBERLY P TRUESDALE, JIANWEN CAI, MICHAELA B KOONTZ andJUNE STEVENS 85
Comparison between prone and supine DXA measurements in men with chronic spinal cord injury CHRISTOPHER R HARNISH, JONATHAN A DANIELS, ROY T SABO and TIMOTHY LAVIS 97
Four-compartment model: effect of biological aging and gender differences L P NOVAK 105
Serum lipids and bone mineral density in hispanics with type-2 diabetes W LAWRENCE BEESON, EMMANUEL A OJO, IHUOMA CHUKWUEKE, ELOY SCHULZ, ANTHONY FIREK, MARINO DE LEON and ZAIDA CORDERO-MACINTYRE 113
ISSN: 1479–456XSMITH-GORDON
www.ijbcr.co
Intern
ational Jo
urn
al of B
ody C
om
positio
n R
esearch: 2013
Volu
me 11 N
um
bers 3 &
4 pages 67–116
IJBCR 2013: 11, Numbers 3 & 4: 35–66 ISSN 1479–456X
2013 Volume 11 Numbers 3 & 4
International Journal of
Body Composition Research
EditorAnja Bosy-Westphal, Stuttgart
Editorial board
www.ijbcr.co
Published bySmith-Gordon
Steven B. Heymsfield, Baton RougeTim R. Nagy, Birmingham ALKristina Norman, BerlinAngelo Pietrobelli, VeronaGuy Plasqui, Maastricht
Leanne Redman, Baton RougeWei Shen, New York
Analiza Monica Silva, LisbonMarjolein Visser, AmsterdamZiMiang Wang, New York
IJBCR 11.3 & 4_Cover_IJBCR 11.3 & 4_Cover.qxd 02/01/2014 13:00 Page 1


International Journal of
Body Composition ResearchIJBCR is the offical journal of the International Society
for Body Composition Research
Editor:
Dr. Anja Bosy-Westphal, Editor, International Journal of Body Composition Research, Universität Hohenheim,Institut für Ernährungsmedizin (180c), Fg. Angewandte Ernährungswissenschaft/Diätetik Fruwirthstraße 12, 70599Stuttgart. Tel: +49 (0)711/459-24690. Fax: +49 (0)711/459-24699; email: [email protected] is the address to which submitted articles should be sent electronically.
Editorial Board:
Steven B Heymsfield MD, Executive Director, Pennington Biomedical Research Center, 6400 Perkins Road,Baton Rouge, LA 70808, USA. Tel: +1 225-763-2513; email [email protected] R. Nagy PhD, Department of Nutrition Sciences, The University of Alabama at Birmingham, BirminghamWebb Bldg. 419,1530 3rd Avenue South, Birmingham, AL 35294-3360. Tel: +1 205-934-4088. Fax: +1 205-934-7050;email: [email protected] Norman, Fachbereich Gastroenterologie, Hepatologie und Endokrinologie der Charité – Universitäts-medizin Berlin, Campus Charité Mitte, Charitéplatz 1, 10117 Berlin, Germany. Email: [email protected] Pietrobelli MD, Pediatric Unit, Verona University Medical School, Policlinico GB Rossi, Via delleMenegone 10, 37134 Verona, Italy. Tel: +39 045 8074390. Fax +39 045 8074746; email: [email protected] Plasqui, Department of Human Biology, Maastricht University Medical Centre+ (MUMC+), PO Box 616,6200 MD Maastricht, The Netherlands. Email: [email protected] Redman, Reproductive Endocrinology and Women’s Health Lab, Pennington Biomedical ResearchCenter, 6400 Perkins Road, Baton Rouge, Louisiana 70808, USA. Email: [email protected] Shen, New York Obesity Nutrition Research Center, St. Luke’s-Roosevelt Hospital, 1090 Amsterdam Ave.,14H, New York, NY 10025, USA. Email: [email protected] Mónica Silva, Faculdade de Motricidade Humana, Estrada da Costa, 1495-688 Cruz Quebrada, Portugal.Email: [email protected] Visser PhD, Department of Nutrition and Health, Faculty of Earth and Life Sciences, Vrije Universiteit,De Boelelaan 1085, 1081 HV Amsterdam, The Netherlands. Tel: +31 20 4449282. Fax: +31 20 4446940; email: [email protected] Wang PhD, Weight Control Unit, St.Luke’s-Roosevelt Hospital, Columbia University, 1090 AmsterdamAvenue, 14th Floor, New York, NY 10025, USA. Tel: +1 212-5233562. Fax: +1 212-5233571; email: [email protected]
www.ijbcr.co
IJBCR 11.3 & 4_inners_IJBCR 11.3 & 4_inners.qxd 02/01/2014 12:59 Page 1

The publisher of International Journal of Body Composition Research gratefully acknowledges thecontribution of the Founding Sponsors. The donors listed here are committed to support the journalwith educational grants towards its expenses in the first three years of publication.
Bodystat Ltdwww.bodystat.com
Life Measurement Incwww.bodpod.com
Maltron International Ltdwww.maltron.int.com
Groupe SEB – Tefalwww.tefal.com
Groupe SEB – Rowentawww.rowenta.com
Tanita UK Ltdwww.tanita.co.uk
ImpediMed Limitedwww.impedimed.com
Founding Sponsors receive no benefits other than this acknowledgement.
IJBCR 11.3 & 4_inners_IJBCR 11.3 & 4_inners.qxd 02/01/2014 12:59 Page 2
Introduction
BIA has long been used in clinical settings as well asfor research purposes. Clinical trials have clearlyshown the use of BIA as a non-invasive diagnostictool to examine fat and lean mass, total body water(TBW), extracellular water (ECW) and to determinethe prognosis of patients [1-3].The seca medical Body Composition Analyzer
514/515 (seca gmbh & co. kg, Hamburg) is a medicaldevice that has been validated against respective goldstandard reference methods in a multiethnic popula-tion [4]. To determine normal ranges of outcomeparameters it is necessary to collect data from ahealthy population. The aim of this study was to establish a reference
data base to generate normal ranges for phase angle(PA), bioelectrical impedance vector analysis (BIVA),the body composition chart (BCC), skeletal musclemass (SMM), total body water (TBW), extracellularwater (ECW) and fat mass (FM) by measuring a rep-resentative population of healthy subjects using bio-
electrical impedance with the seca medical BodyComposition Analyzer 514/515.
Subjects and methods
A total of 1.050 subjects (532 men and 518 women)aged 18-65 years were recruited at the blood transfu-sion service of the Institute for Transfusion Medicineat the University Medical Centre Hamburg-Eppendorf, Germany. All adult blood donors underthe age of 65 years were generally eligible for thestudy. Blood donors were recruited throughout thecomplete opening hours of the donation service bystudent personnel.Subjects were included in the study if they qualified
as blood donors according to the German guidelines
International Journal of Body Composition Research 2013 Vol. 11 No. 3 & 4: 67–76. © Smith-Gordon ISSN 1479-456X
Submitted 1 September 2013 accepted 15 November 2013
Generation of normal ranges for measures of body composition in adults based on bioelectrical
impedance analysis using the seca mBCA
S Peine1, S Knabe1, I Carrero1, M Brundert1, J Wilhelm1, A Ewert1, U Denzer1, B Jensen2 and P Lilburn2
1Institute for Transfusion Medicine, Centre for Diagnostics, University Medical Centre Hamburg-Eppendorf, Germany;
2seca gmbh & co. kg, Hamburg, Germany.
Background/objectives: A validated body composition analyzer using eight-electrode segmental multi-frequency bioelectrical impedance analysis (BIA) enables a fast and accurate measurement of body compartments. For interpretation of measurement results normal ranges are needed.Methods: In a cross-sectional study, reference values for phase angle (PA), bioelectrical impedance vectoranalysis (BIVA), the body composition chart (BCC), skeletal muscle mass (SMM), total body water (TBW),extracellular water (ECW) and fat mass (FM) were generated stratified according to gender, age and BMIusing the seca mBCA 514/515. Results: 1050 healthy blood donors (532 men and 518 women, BMI 18.2 - 42.6 kg/m²) were examinedbefore blood donation. When compared with data from the German National Nutrition Survey II, therecruited population is a representative sample. Reference percentiles (5., 10., 50., 90. and 95. percentile)were generated for all parameters. Conclusion: The developed reference percentiles can be used for diagnostic purposes and to monitor out-comes of treatments in patients.
Keywords: body composition analysis, bioelectrical impedance analysis, normal ranges, fat mass, totalbody water, extracellular water, skeletal muscle mass, phase angle, bioelectrical impedance vector analysis,body composition chart
Address for correspondence: Sven Peine, Transfusion Medicine,Centre for Diagnostics, University Medical Centre Hamburg-Eppendorf, Martinistraße 52, 20246 Hamburg, Germany. Tel: +49 40 7410 54871Email: [email protected]
IJBCR 11.3 & 4_inners_IJBCR 11.3 & 4_inners.qxd 02/01/2014 12:59 Page 67
S Peine et al68
for blood donors (‘Hämotherapie-Richtlinien §§ 12 aand 18 TFG’, chapter 2.1.4 ‘Untersuchung zurEignung als Spender und zur Feststellung derSpendetauglichkeit’). This inclusion criterion wasdefined as ‘healthy’ in the clinical investigation planand approved by to the responsible EthicalCommittee (Ethikkommission der ÄrztekammerHamburg). All BIA measurements had to be per-formed before blood donation to avoid fluid shifts.The following exclusion criteria were applied: acuteand chronic diseases, amputation of limbs, electricalimplant as cardiac pacemaker, insulin pumps, artifi-cial joints, metallic implants (except tooth implants,pregnancy or breastfeeding period, subjects whocannot provide an informed consent form by them-selves, subjects who might be dependent from thesponsor or the investigation site, extensive tattoos atarms or legs. Ankle edema were excluded by inspec-tion. All subjects provided their fully informed andwritten consent before participation.
AnthropometricsBody height was obtained with the stadiometer seca231 to the nearest mm with an accuracy of ± 5 mm.Waist circumference was measured by means of anon-stretchable measurement tape (seca 201).
Bioelectrical impedance analysisBIA measurements were taken with the seca mBCA.Impedance was measured at frequencies of 1, 1.5, 2,3, 5, 7.5, 10, 15, 20, 30, 50, 75, 100, 150, 200, 300,500, 750 and 1,000 kHz. All 19 frequencies were usedfor verification purposes by means of the Cole-Cole-Plot. For the calculation of all normal range valuesfrequencies at 5 kHz and 50 kHz were used. In addi-tion, the measurement was done segmentally as fol-lows: right arm, left arm, right leg, left leg, trunk, rightbody side and left body side. In total, Impedance (Z)and phase angle (PA) were measured 19 x 7 = 133times (19 above-mentioned frequencies x 7 above-mentioned body segments) for each subject.
Statistics for the development of normal ranges Data analyses were performed using R software, version 3.0.1 (R Foundation, Vienna, Austria). Inorder to determine the reference values of PA at50kHz a normal distribution of the data was verifiedby using a normal quantile plot. The percentiles ofPA were calculated by using the mean value of theright and left body side and the standard deviationfor both genders.Tolerance ellipses of bivariate Z-Scores (RXc-score
graph) for BIVA were calculated according toAntonio Piccoli from the University of Padova, Italy[5]. For Z transformation the mean value and the stan-dard deviation of the resistance (R) and reactance(Xc) divided by the height (ht) of the patient werecalculated. The Z Transformation is performed by the following
formulas:
and
For the BCC, FM and fat free mass (FFM) weredivided by height squared (ht²) to generate the twoindices fat mass index (FMI, kg/m²) and fat free massindex (FFMI, kg/m²). For these indices, the meanvalue and the standard deviation are calculated for Ztransformation. The tolerance ellipses were calculatedanalogous to the BIVA ellipses.For determination of normal values for FM the FMI
was correlated with the Body Mass Index (BMI). Thefunction resulting from this correlation allows to cal-culate the corresponding FMI cut-offs from the BMIcut-offs used by the World Health Organization(WHO). TBW and ECW were related to body weight con-
sidering a fixed density of 0.99371 kg/ l. The result-ing values were then correlated with 1/BMI. Thefunction resulting from this correlation was used tocalculate the mean value for the respective variable,which resembles the 50th percentile. Percentiles 5%,50% and 95% were calculated from the standard errorof estimation (SEE) from this regression. For skeletal muscle mass (SMM) normal ranges
were developed for every segment (right arm, leftarm, torso, right leg, left leg) as well as for the com-plete body. Mean values and standard deviationswere calculated after normalizing all values by ht².This normalisation by ht² allows a height independentinterpretation of SMM. Percentiles 5% and 95% areused for classifying the upper and lower normalranges. Since SMM divided by ht² was not normallydistributed, a Box-Cox transformation according toformula (1) in Cole and Green (1992) [7] was per-formed to calculate the percentiles.While PA and BIVA are calculated directly by the
BIA raw data (R and Xc) all other parameters werevalidated against respective reference methods [4].FM was validated against the 4-compartment modelby Fuller et al. 1992 including body volume (by airdisplacement plethysmography), TBW (by deuteriumdilution) and bone mineral content (by DXA).Deuterium dilution was used as reference for TBW,sodium bromide dilution for ECW and whole bodyMRI for SMM.
Results
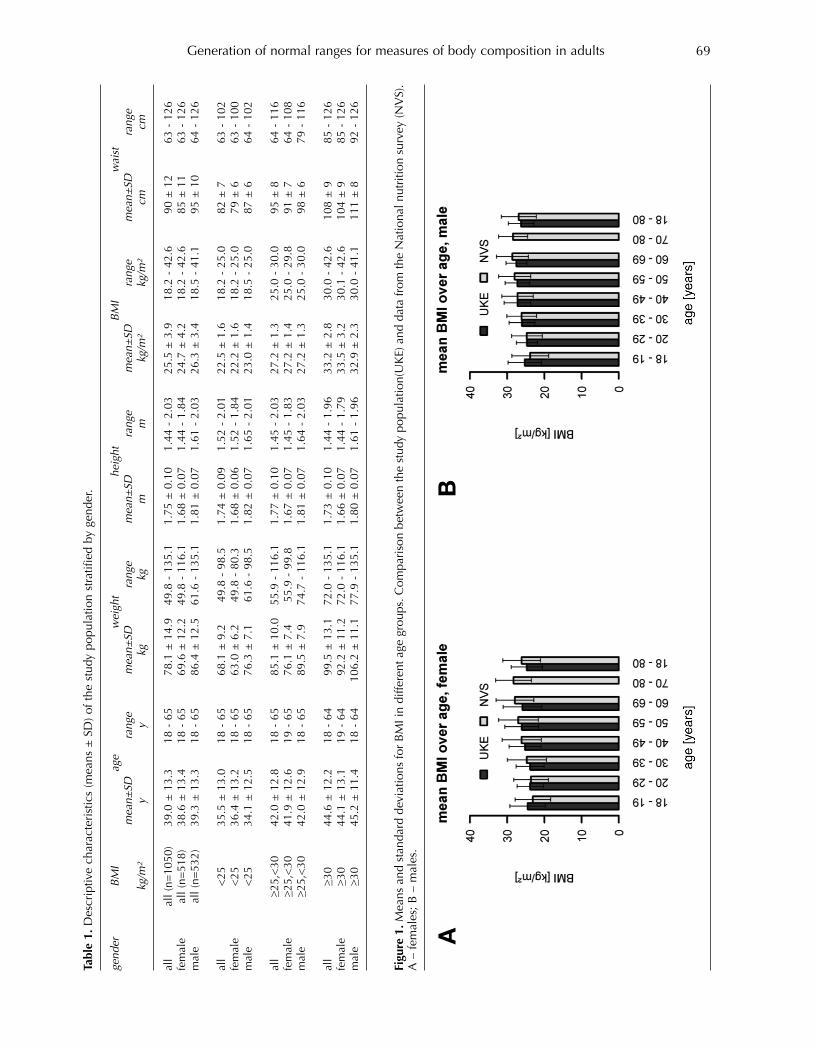
The study examined 1.050 healthy individuals, 532man and 518 women in the age of 18 to 65 years.BMI ranged from 18.2 to 42.6 kg/m², waist circumfer-ence from 63 to 126 cm. Basic characteristics of thestudy population stratified by gender are given inTable 1. In order to evaluate representivness of thestudy population the distribution of BMI was com-pared to characteristics of the Nationale VerzehrsstudieII (National Nutrition Survey II) which investigated a
IJBCR 11.3 & 4_inners_IJBCR 11.3 & 4_inners.qxd 02/01/2014 12:59 Page 68
Generation of normal ranges for measures of body composition in adults 69
Figu
re 1. M
eans
and
sta
ndar
d de
viat
ions
for
BM
I in
diffe
rent
age
gro
ups.
Com
pari
son
betw
een
the
stud
y po
pula
tion(
UK
E) a
nd d
ata
from
the
Nat
iona
l nut
ritio
n su
rvey
(NV
S).
A –
fem
ales
; B –
mal
es.
AB
Table 1. D
escr
iptiv
e ch
arac
teri
stic
s (m
eans
± S
D) o
f the
stu
dy p
opul
atio
n st
ratif
ied
by g
ende
r.
gender
BMI
age
weight
height
BMI
waist
mean±
SDrange
mean±
SDrange
mean±
SDrange
mean±
SDrange
mean±
SDrange
kg/m²
yy
kgkg
mm
kg/m²
kg/m²
cmcm
all
all (
n=10
50)
39.0
± 1
3.3
18 -
65
78.1
± 1
4.9
49.8
- 1
35.1
1.75
± 0
.10
1.44
- 2
.03
25.5
± 3
.918
.2 -
42.
690
± 1
263
- 1
26fe
mal
eal
l (n=
518)
38
.6 ±
13.
418
- 6
569
.6 ±
12.
249
.8 -
116
.11.
68 ±
0.0
71.
44 -
1.8
424
.7 ±
4.2
18.2
- 4
2.6
85 ±
11
63 -
126
mal
eal
l (n=
532)
39.3
± 1
3.3
18 -
65
86.4
± 1
2.5
61.6
- 1
35.1
1.81
± 0
.07
1.61
- 2
.03
26.3
± 3
.418
.5 -
41.
195
± 1
064
- 1
26
all
<25
35.5
± 1
3.0
18 -
65
68.1
± 9
.249
.8 -
98.
51.
74 ±
0.0
91.
52 -
2.0
122
.5 ±
1.6
18.2
- 2
5.0
82 ±
763
- 1
02fe
mal
e<
2536
.4 ±
13.
218
- 6
563
.0 ±
6.2
49.8
- 8
0.3
1.68
± 0
.06
1.52
- 1
.84
22.2
± 1
.618
.2 -
25.
079
± 6
63 -
100
mal
e<
2534
.1 ±
12.
518
- 6
576
.3 ±
7.1
61.6
- 9
8.5
1.82
± 0
.07
1.65
- 2
.01
23.0
± 1
.418
.5 -
25.
087
± 6
64 -
102
all
≥25,
<30
42.0
± 1
2.8
18 -
65
85.1
± 1
0.0
55.9
- 1
16.1
1.77
± 0
.10
1.45
- 2
.03
27.2
± 1
.325
.0 -
30.
095
± 8
64 -
116
fem
ale
≥25,
<30
41.9
± 1
2.6
19 -
65
76.1
± 7
.455
.9 -
99.
81.
67 ±
0.0
71.
45 -
1.8
327
.2 ±
1.4
25.0
- 2
9.8
91 ±
764
- 1
08m
ale
≥25,
<30
42.0
± 1
2.9
18 -
65
89.5
± 7
.974
.7 -
116
.11.
81 ±
0.0
71.
64 -
2.0
327
.2 ±
1.3
25.0
- 3
0.0
98 ±
679
- 1
16
all
≥30
44.6
± 1
2.2
18 -
64
99.5
± 1
3.1
72.0
- 1
35.1
1.73
± 0
.10
1.44
- 1
.96
33.2
± 2
.830
.0 -
42.
610
8 ±
985
- 1
26fe
mal
e≥3
044
.1 ±
13.
119
- 6
492
.2 ±
11.
272
.0 -
116
.11.
66 ±
0.0
71.
44 -
1.7
933
.5 ±
3.2
30.1
- 4
2.6
104
± 9
85 -
126
mal
e≥3
045
.2 ±
11.
418
- 6
410
6.2
± 1
1.1
77.9
- 1
35.1
1.80
± 0
.07
1.61
- 1
.96
32.9
± 2
.330
.0 -
41.
111
1 ±
892
- 1
26
IJBCR 11.3 & 4_inners_IJBCR 11.3 & 4_inners.qxd 02/01/2014 12:59 Page 69
S Peine et al70
Table 2. Percentiles for phase angle (PA), resistance (R) and reactance (Xc) at 50 kHz calculated according to Piccoli et al.2002 [5].
variable unit gender BMI mean ± SD p5% p50% p95%
phase angle ° female all 5.05 ± 0.47 4.28 5.05 5.82<25 5.00 ± 0.45 4.26 5.00 5.74≥25<30 5.14 ± 0.49 4.34 5.14 5.94≥30 5.13 ± 0.49 4.32 5.13 5.93
male all 5.88 ± 0.51 5.03 5.88 6.73<25 5.87 ± 0.49 5.06 5.87 6.69≥25<30 5.89 ± 0.54 5.00 5.89 6.78≥30 5.87 ± 0.47 5.10 5.87 6.64
R50kHz / ht Ω/cm female all 3.937 ± 0.400 3.278 3.937 4.596<25 4.072 ± 0.363 3.475 4.072 4.670≥25<30 3.787 ± 0.333 3.240 3.787 4.335≥30 3.513 ± 0.320 2.986 3.513 4.040
male all 3.023 ± 0.323 2.491 3.023 3.554<25 3.223 ± 0.297 2.735 3.223 3.711≥25,<30 2.946 ± 0.253 2.530 2.946 3.362≥30 2.693 ± 0.254 2.276 2.693 3.111
Xc50kHz / ht Ω/cm female all 0.348 ± 0.046 0.272 0.348 0.423<25 0.356 ± 0.045 0.282 0.356 0.430≥25<30 0.340 ± 0.042 0.271 0.340 0.410≥30 0.315 ± 0.042 0.246 0.315 0.384
male all 0.312 ± 0.045 0.237 0.312 0.386<25 0.332 ± 0.045 0.258 0.332 0.406≥25<30 0.304 ± 0.041 0.237 0.304 0.371≥30 0.277 ± 0.034 0.220 0.277 0.333
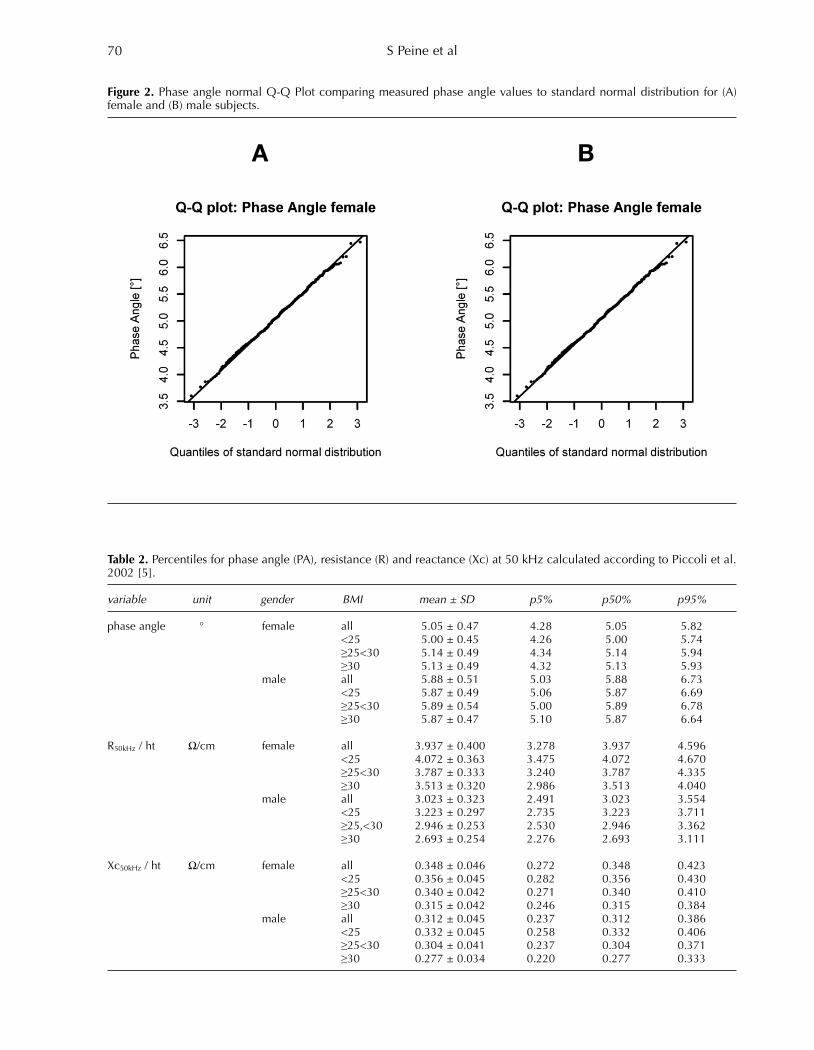
Figure 2. Phase angle normal Q-Q Plot comparing measured phase angle values to standard normal distribution for (A)female and (B) male subjects.
A B
IJBCR 11.3 & 4_inners_IJBCR 11.3 & 4_inners.qxd 02/01/2014 12:59 Page 70
Generation of normal ranges for measures of body composition in adults 71
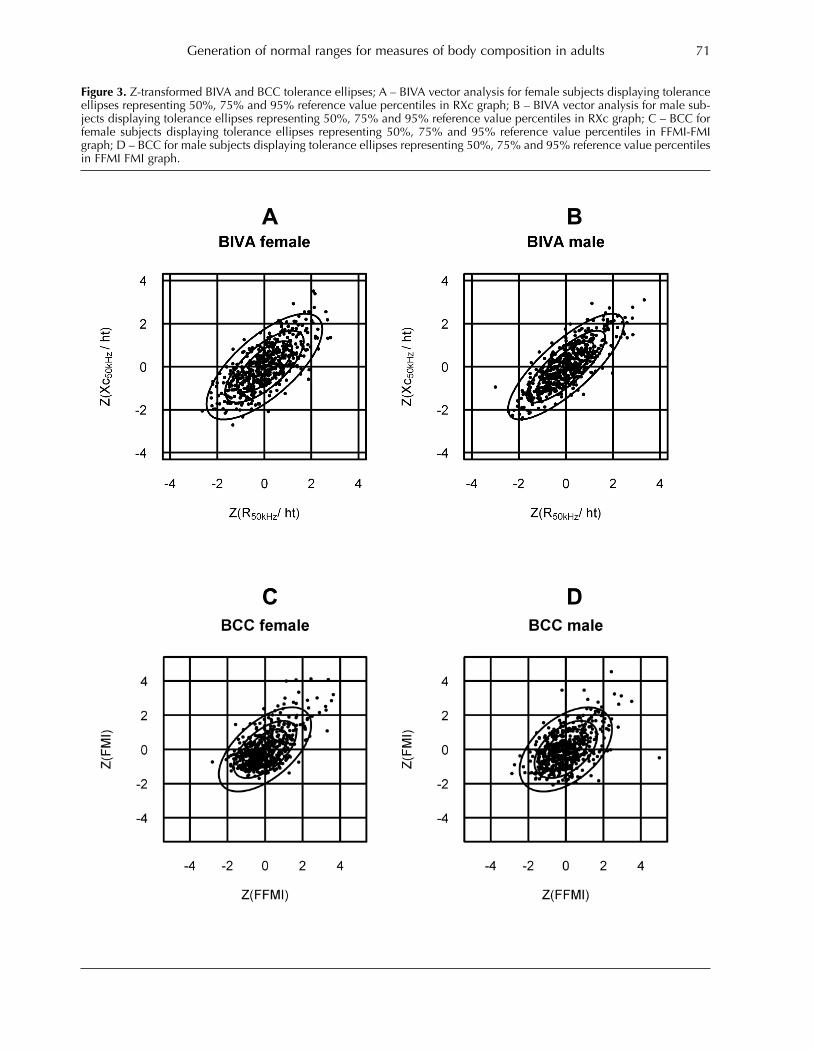
Figure 3. Z-transformed BIVA and BCC tolerance ellipses; A – BIVA vector analysis for female subjects displaying toleranceellipses representing 50%, 75% and 95% reference value percentiles in RXc graph; B – BIVA vector analysis for male sub-jects displaying tolerance ellipses representing 50%, 75% and 95% reference value percentiles in RXc graph; C – BCC forfemale subjects displaying tolerance ellipses representing 50%, 75% and 95% reference value percentiles in FFMI-FMIgraph; D – BCC for male subjects displaying tolerance ellipses representing 50%, 75% and 95% reference value percentilesin FFMI FMI graph.
A B
C D
A B
C D
IJBCR 11.3 & 4_inners_IJBCR 11.3 & 4_inners.qxd 02/01/2014 12:59 Page 71

S Peine et al72
total of 20.000 subjects [6]. Figure 1 shows that meanBMI ranges were nearly identical for all listed ageranges. The standard deviation was higher for all agegroups in the Nationale Verzehrsstudie II. The normal distribution of PA values can be veri-
fied according to the quantile-quantile plots for maleand female subjects shown in Figure 2. Mean valuesfor PA in Table 2 show significantly higher PA valuesin men when compared to women.BIVA results reveal a normal distribution with only
a small cluster of measurements with a combinedhigh Z(R50kHz/ ht) and Z(Xc50kHz/ ht) for womenand men (Figure 3). The percentiles for the genderspecific resistances are listed in Table 2.The BCC shows a normal distribution for females as
well as for males with only a small cluster of measur-ing points with a combined high FMI and FFMI forboth genders (Figure 3). Table 3 provides an overviewof FMI and FFMI percentiles for men and women. Because there was a close correlation between FMI
and BMI (Figure 4) the cut-off points for FMI (calcu-lated from WHO BMI cut-offs by linear regression)allow an interpretation of a subject’s individual fatmass. Due to the good correlation of TBW divided by
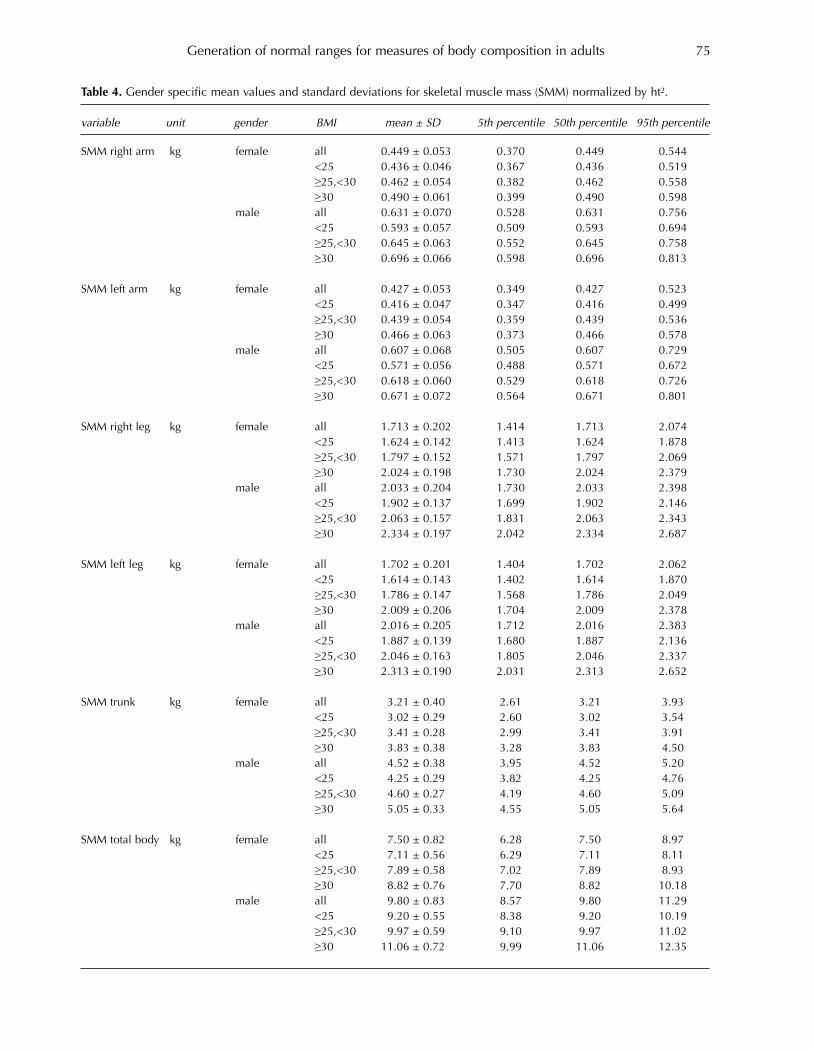
weight (%TBW) to 1/BMI and ECW divided byweight (%ECW) to 1/ BMI, the percentiles for %TBWand %ECW were calculated from this regression andplotted vs BMI (Figure 5).The normal values for SMM/ht² show that men
have significantly higher muscle mass than women inall body segments (Table 4).
Discussion
Reference values were developed for all parametersof body composition derived from BIA. These can beused to evaluate individual measurement resultscompared to a healthy population.
The BCC is based on the principle of the Hattori-Chart introduced by Komei Hattori from the IbarakiUniversity, Japan [1991], plotting FMI over FFMI andillustrating the wide variability in fatness for a givenBMI. The visual presentation of the chart may help topractically better assess changes in body compositionduring weight management over time. It may help todetect hidden obesity or sarcopenic obesity with onlyone data set. The original approach by Hattori wasalso used by Yves Schutz from the University inLausanne, Switzerland [9] who generated and estab-lished FMI and FFMI percentiles in a Swiss popula-tion to determine age and gender specific normalranges. The work by Schutz was the basis for theBCC used in the seca mBCA. The limitations of theBCC lay in the overestimation of muscle mass inpatients with fluid overloads as these only contribute tothe FFM and thus FFMI. In these cases other calculatedresults may help to explain this overestimation.Normal values for TBW and ECW are innovative and
may allow evaluating normal hydration. Until today noofficial normal ranges are available for body water.The literature generally lists percentage body water(%BW) ranges for men and women. In summary mengenerally have more %BW than women, obesity con-tributes to lower relative body water values andincreasing age contributes to continuously decreasingvalues [10, 11, 12]. The biggest effect on %BW inadults can be explained by the BMI which could beshown in this study (Figure 5).Fluid overloads mainly accumulate in the extracel-
lular space [13] which is why mainly ECW/TBW andICW/ECW are used to assess fluid status [14, 15]. Thisapproach has limitations though for example directlyafter dialysis treatment as extracellular fluid is slowlyrefilled during the inter-dialytic period [16]. A meas-urement directly after treatment – when the patient isstill available for a BIA measurement – thus is notable to give an appropriate answer, whereas using
Table 3. FMI and FFMI percentiles for BCC tolerance ellipse calculation according to Piccoli et. al. 2002 [5].
variable unit gender BMI mean ± SD p5% p50% p95%
FFMI kg/m² female all 16.27 ± 1.36 14.04 16.27 18.49<25 15.63 ± 0.92 14.11 15.63 17.14≥25,<30 16.88 ± 0.93 15.35 16.88 18.41≥30 18.48 ± 1.27 16.39 18.48 20.57
male all 19.83 ± 1.47 17.42 19.83 22.24<25 18.81 ± 1.03 17.11 18.81 20.51≥25,<30 20.08 ± 1.03 18.40 20.08 21.77≥30 22.09 ± 1.24 20.05 22.09 24.12
FMI kg/m² female all 8.46 ± 3.24 3.13 8.46 13.78<25 6.55 ± 1.39 4.27 6.55 8.84≥25,<30 10.30 ± 1.34 8.09 10.30 12.50≥30 15.04 ± 2.65 10.68 15.04 19.41
male all 6.42 ± 2.49 2.33 6.42 10.51<25 4.23 ± 1.22 2.21 4.23 6.24≥25,<30 7.08 ± 1.28 4.97 7.08 9.19≥30 10.79 ± 1.99 7.52 10.79 14.06
IJBCR 11.3 & 4_inners_IJBCR 11.3 & 4_inners.qxd 02/01/2014 12:59 Page 72

Generation of normal ranges for measures of body composition in adults 73
Figure 4. Regression of FMI vs. BMI for female (A) and male subjects (B); Fat mass vs. height for female (C) and male subjects(D) including BMI cut-off lines converted to FMI values by means of FMI vs BMI regression.
A B
C D
A B
C D
IJBCR 11.3 & 4_inners_IJBCR 11.3 & 4_inners.qxd 02/01/2014 12:59 Page 73

S Peine et al74
Figure 5. Percentiles for %TBW and %ECW stratified by BMI and gender. %TBW vs. 1/BMI regression for (A) female and(B) for male subjects; %ECW vs. 1/BMI regression (C) for female and (D) for male subjects; Percentile curves calculatedfrom 1/BMI regression for (E) %TBW in female subjects, (F) %TBW in male subjects, (G) %ECW in female subjects and (H)for %ECW in male subjects.
A B
C D
E F
G H
IJBCR 11.3 & 4_inners_IJBCR 11.3 & 4_inners.qxd 02/01/2014 12:59 Page 74
Generation of normal ranges for measures of body composition in adults 75
Table 4. Gender specific mean values and standard deviations for skeletal muscle mass (SMM) normalized by ht².
variable unit gender BMI mean ± SD 5th percentile 50th percentile 95th percentile
SMM right arm kg female all 0.449 ± 0.053 0.370 0.449 0.544<25 0.436 ± 0.046 0.367 0.436 0.519≥25,<30 0.462 ± 0.054 0.382 0.462 0.558≥30 0.490 ± 0.061 0.399 0.490 0.598
male all 0.631 ± 0.070 0.528 0.631 0.756<25 0.593 ± 0.057 0.509 0.593 0.694≥25,<30 0.645 ± 0.063 0.552 0.645 0.758≥30 0.696 ± 0.066 0.598 0.696 0.813
SMM left arm kg female all 0.427 ± 0.053 0.349 0.427 0.523<25 0.416 ± 0.047 0.347 0.416 0.499≥25,<30 0.439 ± 0.054 0.359 0.439 0.536≥30 0.466 ± 0.063 0.373 0.466 0.578
male all 0.607 ± 0.068 0.505 0.607 0.729<25 0.571 ± 0.056 0.488 0.571 0.672≥25,<30 0.618 ± 0.060 0.529 0.618 0.726≥30 0.671 ± 0.072 0.564 0.671 0.801
SMM right leg kg female all 1.713 ± 0.202 1.414 1.713 2.074<25 1.624 ± 0.142 1.413 1.624 1.878≥25,<30 1.797 ± 0.152 1.571 1.797 2.069≥30 2.024 ± 0.198 1.730 2.024 2.379
male all 2.033 ± 0.204 1.730 2.033 2.398<25 1.902 ± 0.137 1.699 1.902 2.146≥25,<30 2.063 ± 0.157 1.831 2.063 2.343≥30 2.334 ± 0.197 2.042 2.334 2.687
SMM left leg kg female all 1.702 ± 0.201 1.404 1.702 2.062<25 1.614 ± 0.143 1.402 1.614 1.870≥25,<30 1.786 ± 0.147 1.568 1.786 2.049≥30 2.009 ± 0.206 1.704 2.009 2.378
male all 2.016 ± 0.205 1.712 2.016 2.383<25 1.887 ± 0.139 1.680 1.887 2.136≥25,<30 2.046 ± 0.163 1.805 2.046 2.337≥30 2.313 ± 0.190 2.031 2.313 2.652
SMM trunk kg female all 3.21 ± 0.40 2.61 3.21 3.93<25 3.02 ± 0.29 2.60 3.02 3.54≥25,<30 3.41 ± 0.28 2.99 3.41 3.91≥30 3.83 ± 0.38 3.28 3.83 4.50
male all 4.52 ± 0.38 3.95 4.52 5.20<25 4.25 ± 0.29 3.82 4.25 4.76≥25,<30 4.60 ± 0.27 4.19 4.60 5.09≥30 5.05 ± 0.33 4.55 5.05 5.64
SMM total body kg female all 7.50 ± 0.82 6.28 7.50 8.97<25 7.11 ± 0.56 6.29 7.11 8.11≥25,<30 7.89 ± 0.58 7.02 7.89 8.93≥30 8.82 ± 0.76 7.70 8.82 10.18
male all 9.80 ± 0.83 8.57 9.80 11.29<25 9.20 ± 0.55 8.38 9.20 10.19≥25,<30 9.97 ± 0.59 9.10 9.97 11.02≥30 11.06 ± 0.72 9.99 11.06 12.35
IJBCR 11.3 & 4_inners_IJBCR 11.3 & 4_inners.qxd 02/01/2014 12:59 Page 75

the TBW normal range approach in combination withBIVA may better assess this.
Conflict of interest – BJ and PL are employees of secagmbh & co. kg, Hamburg, Germany. The remainingauthors declare no conflict of interest.
Acknowledgements – The research funding for thisstudy was provided by seca gmbh & co. kg, Hamburg,Germany.
References
1. Kyle UG, Bosaeus I, De Lorenzo AD, Deurenberg P,Elia M, Gómez JM, Heitmann BL, Kent-Smith L,Melchior JC, Pirlich M, Scharfetter H, Schols AMWJ,Pichard C. Bioelectrical impedance analysis – part I:review of principles and methods. Clin Nutr. 2004; 23:1226–1243. doi: 10.1016/j.clnu.2004.06.004.
2. Kyle UG, Bosaeus I, De Lorenzo AD, Deurenberg P,Elia M, Gómez JM, Heitmann BL, Kent-Smith L,Melchior JC, Pirlich M, Scharfetter H, Schols AMWJ,Pichard C. Bioelectrical impedance analysis-part II: utilization in clinical practice. Clin Nutr. 2004; 23:1430–1453. doi: 10.1016/j.clnu.2004.09.012.
3. Barbosa-Silva MC, Barros AJ. Bioelectrical impedanceanalysis in clinical practice: a new perspective on itsuse beyond body composition equations. Curr OpinClin Nutr Metab Care. 2005; 8: 311–317.
4. Bosy-Westphal A, Schautz B, Later W. Kehayias JJ,Gallagher D, Müller MJ. What makes a BIA equationunique? Validity of eight-electrode multifrequency BIAto estimate body composition in a healthy adult popu-lation. Eur J Clin Nutr 2013; 67: 14-21; doi: 10.1038/ejcn.2012.160.
5. Piccoli A, Pastori G: BIVA software. Department ofMedical and Surgical Sciences, University of Padova,Padova, Italy, 2002 (available at Email: [email protected]).
6. Nationale Verzehrsstudie II, Part 1, Veröffentlichungdes Bundesministeriums für Ernährung, Landwirtschaftund Verbraucherschutz (Publication of the GermanFederal Ministry of Nutrition, Agriculture andConsumer Protection), 2008.
7. Cole T J, Green P J: Smoothing reference centilecurves: The LMS method and penalized likelihood.Statistics in medicine 1992; 11: 1305-1319.
8. Hattori K. Body Composition and Lean Body MassIndex for Japanese College Students. J. Anthrop. Soc.Nippon 1991; 99(2): 141-148, ISSN:0003-5505.
9. Schutz Y, Kyle UUG, Pichard C. Fat-free mass indexand fat mass index percentiles in Caucasians aged 18– 98 y. International Journal of Obesity 2002; 26: 953 –960. doi: 10.1038=sj.ijo.0802037.
10. Guyton, Arthur C. Textbook of Medical Physiology (5thed.) 1976; Philadelphia: W.B. Saunders. p. 424.
11. Guyton, Arthur C. Textbook of Medical Physiology (8thed.) 1991: Philadelphia: W.B. Saunders. p.274.
12. Schoeller DA. Hydrometry. In: Heymsfield SB,Lohmann TG, Wang Z, Going SB, editors. HumanBody Composition. 2 ed. Champaign, IL: HumanKinetics; 2005; p.35.
13. Oe B, De Fijter CW, Geers TB, Vos PF, de Vries PM.Hemodialysis (HD) versus peritoneal dialysis (PD):latent overhydration in PD patients? Int J Artif Organs2002; 25: 838–43.
14. Domoto DT, Weindel ME. Bioimpedance analysis offluid compartments in female CAPD patients. Adv PeritDial 1998; 14: 220–2.
15. Plum J, Schoenicke G, Kleophas W, Kulas W, SteffensF, Azem A, et al. Comparison of body fluid distributionbetween chronic haemodialysis and peritoneal dialysispatients as assessed by biophysical and biochemicalmethods. Nephrol Dial Transplant 2001; 16: 2378–85.
16. Jain AK, Lindsay RM. Intra and extra cellular fluid shiftsduring the inter dialytic period in conventional anddaily hemodialysis patients. ASAIO J. 2008 Jan-Feb;54(1): 100-3. doi: 10.1097/MAT.0b013e318162c404.
S Peine et al76
IJBCR 11.3 & 4_inners_IJBCR 11.3 & 4_inners.qxd 02/01/2014 12:59 Page 76
Introduction
The intra-abdominal visceral fat (V-fat) mass relatesto nutritional status and correlates with health risksand associated biochemical and cardiovascularparameters [1-4]. Waist circumference (WC) correlateswith V-fat both in men and in women [3, 5-18].Nevertheless, it is an unreliable indicator of V-fat,partly because WC also varies with abdominal subcu-taneous fat (S-fat) and that usually exceeds the V-fat,especially in women [3 ,4, 6-10, 12-15, 17, 19, 20].However, this difficulty is partially offset by the factthat the amounts of each are strongly correlated witheach other [3, 6, 9, 10, 15, 20]. This is why, amongstindividuals of widely varying adiposity, V-fat corre-lates usefully with WC. Reducing the correlationbetween WC and V-fat, but generally ignored, is thevariation in the non-fat content of the abdomen. The present study explores whether WC can be
combined with other simple measurements in orderto improve predictions of V-fat. Possibilities includehip circumference (HC), BMI, abdominal skinfoldthicknesses which correlate strongly with abdominalS-fat areas [21], age and body height. The principalhypothesis tested is that the V-fat area in a transverseabdominal scan can be better predicted from the WCif either the S-fat area or the fat-free area (F-F area)is estimated from some other measurement. An eco-nomical initial approach to this hypothesis is not totry out all plausible predictors of S-fat area or F-Farea, but to test whether exact knowledge of eitherone of the latter allows better estimation of V-fat area
International Journal of Body Composition Research 2013 Vol. 11 No. 3 & 4: 77–84. © Smith-Gordon ISSN 1479-456X
Submitted 9 July 2013 accepted 29 July 2013
Waist circumference cannot be improved as an index ofabdominal visceral fatness by combining it with correlates
of abdominal subcutaneous fat or non-fat tissue
Richard F Burton1 and Michael E J Lean2
1School of Life Sciences, College of Medical, Veterinary and Life Sciences, University of Glasgow; 2School of Medicine, College of Medical,
Veterinary and Life Sciences, University of Glasgow.
Objective: Waist circumference (WC), a good predictor of health risks, correlates moderately well withabdominal visceral fat (V-fat), but also with abdominal subcutaneous fat (S-fat). The aim was to investigatewhether the predictive power of WC as an index of V-fat could be improved by knowledge of the contri-bution of S-fat or fat-free mass to transverse trunk area.Methods:The approach involved statistical analysis of relationships among WC, V-fat, S-fat and hip circum-ference (HC) in seventy-three men and thirty-six women using data obtained in previous studies. Areas ofV-fat and S-fat were obtained from transverse abdominal CT scans at L4-L5 level. Total scan areas approx-imate to 0.07WC2. Data scatter due to discrepancies in the positions of CT scans and measuring tapes andto the variable disposition of abdominal contents was obviated accordingly by taking WC as {(total scanarea)/0.07}0.5. Conclusions were drawn from previously published correlation coefficients. Results: V-fat areas cannot be better predicted from WCs even by combining the latter with exact knowl-edge of associated areas either of S-fat or of fat-free tissue. The waist-to-hip ratio proved inferior to WC asa predictor of V-fat area, as did other functions of WC and HC.Discussion: Effort should not be expended on trying to improve on WC as an index of V-fat by incorporat-ing anthropometric predictors of these other abdominal components. As already established, the V-fat/S-fat ratio tends to rise with age, affecting relationships between V-fat and WC.
Keywords: Waist circumference; Abdominal visceral fat;Waist-to-hip ratio
Abbreviations: BMI, body mass index; WC, waist circumference; WC*, WC calculated from total scanarea; V-fat, visceral fat; S-fat, subcutaneous fat; F-F, fat-free; HC, hip circumference; WHR, waist-to-hipratio; r, correlation coefficient; R, multiple correlation coefficient; SD, standard deviation
Address for correspondence: Richard Burton, West Medical Building,University of Glasgow, Glasgow G12 8QQ, UK.Telephone: +44 (0) 141 330 5270Fax: +44 (0) 141 330 5481Email: [email protected]
IJBCR 11.3 & 4_inners_IJBCR 11.3 & 4_inners.qxd 02/01/2014 12:59 Page 77
from WC. If it is established that it cannot do so, thenfuture research on that point may be spared. Regardless of this argument, the waist-to-hip ratio
(WHR = WC/HC) does need to be considered,because it is sometimes regarded as a better guide tothe body’s content of V-fat than WC alone. Somestudies have found V-fat to be better correlated withWHR than with WC and some have found the oppo-site [5-7, 9-12, 15, 22-24]. It might be expected that V-fat, S-fat and F-F areas
should all tend to correlate positively with height – asis true of WC [25]. The possible influence of heighton the relationship between V-fat and WC has previ-ously been investigated in regard both to the data setused here and to twenty healthy premenopausalwomen [11]. It was concluded that height is not animportant influence on V-fat and it is only consideredfurther here in relation to F-F area. The influence of age has also been investigated
already using the same data set [11, 21], but needs tobe taken into account in the present analysis. Variousstudies have shown that the body’s content of V-fat,and also the V-fat/S-fat ratio, both tend to increasewith age in adults [3, 5-7, 11, 16, 18, 19, 21, 23].
Methods
The raw data used (73 men and 36 women) are thoseof Seidell et al. [21] and Han et al. [11] who give tech-nical details. Cross-sectional areas of fat at L4-L5 level(V-fat and S-fat) were measured by computerizedtomography together with total scan areas and fat-freeareas (F-F areas). WCs at the level of the umbilicusand HCs at the widest level were both measured bytape. Measurement units are cm and kg. The proce-dures accorded with the ethical standards of theCommittee on Human Experimentation of theInstitute of Radiodiagnostics of the University hospitalin Nijmegen [21].Correlations between scan areas and WCs are
inevitably reduced by any mismatches between theplacing of the measuring tape and the level of the
scan, and also by changes between the two proce-dures in the disposition of tissues within theabdomen. The associated errors are obviated if WC isnot taken as that measured by tape in the conven-tional manner, but is estimated from the outline ofthe total scan area. Here the resulting values, denot-ed WC*, are taken as {(total scan area)/0.07)}0.5. Thisis best used as its square, with WC*2 calculated as(total scan area)/0.07. The rationale for this novelapproach is as follows. For any given shape, the total transverse cross-
sectional area at the level of a WC measurement isproportional to WC2. It should average αWC2, whereα is slightly below 1/4π (= 0.080), the value for a cir-cle. For ellipses with axes in the ratio 0.60:1, a is0.07, which is probably typical for human abdomens[25]. Data on transverse and sagittal abdominal diam-eters [8] suggest that most values of a would lie in therange 0.067-0.077 if the transverse cross sections aretreated as ellipses. Further evidence on this is pre-sented below. Pearson correlation coefficients for the pairs of
variables specified below were taken from the litera-ture [3, 5, 6, 9-12, 14, 22-24]. Of these some for V-fatwith WC were compared graphically with others forV-fat with WHR. Others, namely for V-fat area with S-fat area, S-fat area with WC, and V-fat area with WC[3, 9, 14], were used together in the calculation ofcoefficients of multiple correlation (R). Given sets ofcorrelation coefficients rYX1 and rYX2 and rX1X2 for vari-ables Y, X1 and X2, coefficients of multiple correla-tion (RY.X1X2) were calculated according to the follow-ing formula [26].
RY.X1X2 = {(r2YX1 + r2YX2 – 2.rYX1.rYX2.rX1X2)/(1 – r 2X1X2)}0.5.(1)
Other relationships are expressed as multiple regres-sion equations.Calculations were carried out using Excel 2003
(Microsoft Corporation, USA). All quoted probabilitiesare two-tailed.
Richard F Burton and Michael E J Lean78
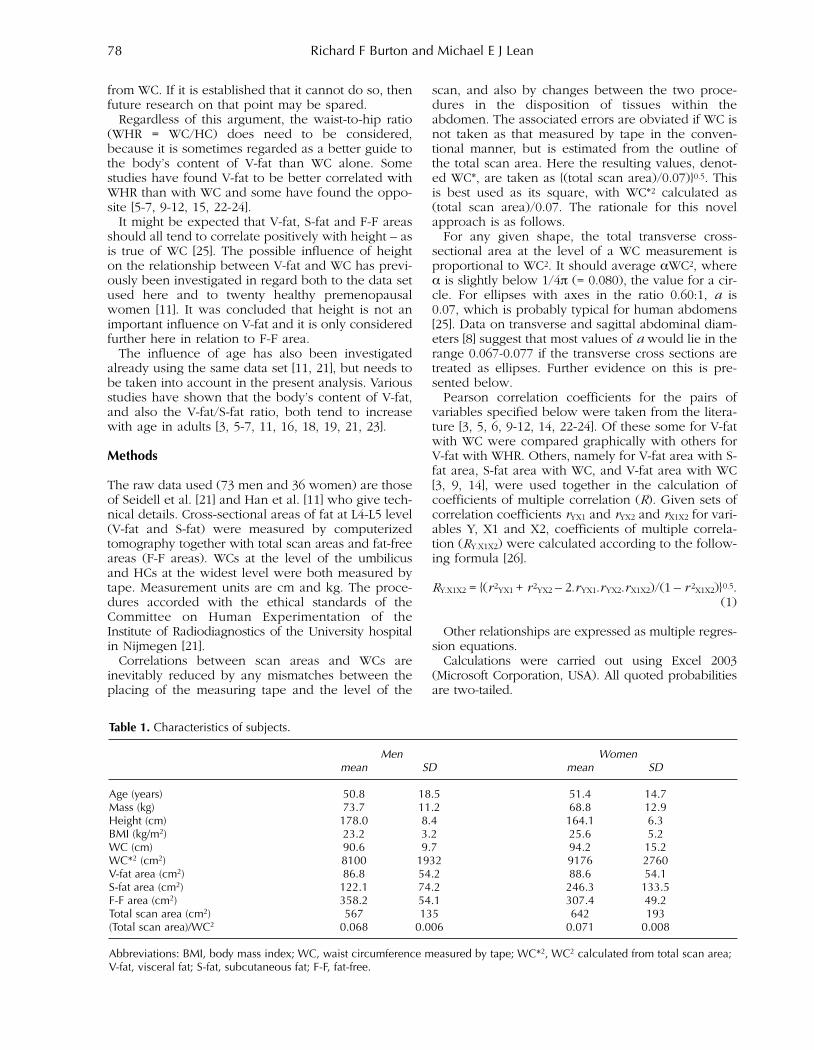
Table 1. Characteristics of subjects.
Men Womenmean SD mean SD
Age (years) 50.8 18.5 51.4 14.7Mass (kg) 73.7 11.2 68.8 12.9Height (cm) 178.0 8.4 164.1 6.3BMI (kg/m2) 23.2 3.2 25.6 5.2WC (cm) 90.6 9.7 94.2 15.2WC*2 (cm2) 8100 1932 9176 2760V-fat area (cm2) 86.8 54.2 88.6 54.1S-fat area (cm2) 122.1 74.2 246.3 133.5F-F area (cm2) 358.2 54.1 307.4 49.2Total scan area (cm2) 567 135 642 193(Total scan area)/WC2 0.068 0.006 0.071 0.008
Abbreviations: BMI, body mass index; WC, waist circumference measured by tape; WC*2, WC2 calculated from total scan area;V-fat, visceral fat; S-fat, subcutaneous fat; F-F, fat-free.
IJBCR 11.3 & 4_inners_IJBCR 11.3 & 4_inners.qxd 02/01/2014 12:59 Page 78

Results
Characteristics of the sample populations are presentedin Table 1. Figure 1 shows total scan area (left-handaxis) plotted against WC2 calculated from tape meas-urements. The diagonal line corresponds to a ratio of0.07, a value confirmed as appropriate by referenceto the means of 0.068 and 0.071 shown in Table 1 formen and women respectively. The right-hand axis ofFigure 1 shows the values of WC*2 calculated as (totalscan area)/0.07 with the diagonal line then corre-
sponding to equality of WC*2 and WC2. Table 2 showscorrelation coefficients (r) for a number of pairs ofvariables. Multiple regression of V-fat area on WC*2 and S-fat
area produced the following equations.
For men: V-fat area = –110 + 0.025WC*2 – 0.33(S-fat area). (2)
For women: V-fat area = –113 + 0.030WC*2 – 0.28(S-fat area). (3)
Waist circumference and abdominal fat 79
Figure 1. Relationship between total area of transverseabdominal scan and WC2. The line through the origin cor-responds to an elliptical area with axes in the ratio 0.60:1,for which the ratio area/WC2 (α) is 0.07. The right-hand axisshows the values of WC*2 calculated as (total scan area)/0.07. Symbols: × males; ● females.
Figure 2. Comparison of published correlation coefficientsfor V-fat and WC (r VF.WC) and for V-fat and WHR (r VF.WHR) [5,6, 9-12, 22-24]. The diagonal line corresponds to equality.Symbols: ○ males; ● females; □ both sexes; ∆ obesemales; ▲ obese females.
Table 2. Pearson correlation coefficients for pairs of variables. The variables are shown in the left-hand column and in thelist of abbreviations below.
WC Total scan area V-fat S-fat F-F area V-fat/ age HC WHRand WC*2 area area S-fat
Total scan area and WC*2 men 0.93***
women 0.93***V-fat area men 0.83*** 0.85***
women 0.81*** 0.87***S-fat area men 0.84*** 0.85*** 0.71***
women 0.88*** 0.92*** 0.70***F-F area men 0.35** 0.48*** 0.14 0.05
women 0.37* 0.47** 0.42** 0.14V-fat/S-fat men –0.03 –0.14 0.14 –0.36** 0.00
women 0.12 0.05 0.47** –0.17 0.14Age men 0.19 0.20 0.44*** 0.04 0.00 0.41***
women 0.60*** 0.53*** 0.58*** 0.39* 0.39* 0.36*HC men 0.88*** 0.82*** 0.70*** 0.77*** 0.29* –0.08 0.17
women 0.88*** 0.94*** 0.75*** 0.88*** 0.49** –0.03 0.54***WHR men 0.89*** 0.82*** 0.76*** 0.71*** 0.32** 0.03 0.18 0.56***
women 0.77*** 0.56*** 0.60*** 0.53*** 0.07 0.30 0.45** 0.56***Body mass men 0.74*** 0.72*** 0.43*** 0.73*** 0.38*** –0.26* –0.33** 0.78*** 0.53***
women 0.85*** 0.91*** 0.76*** 0.80*** 0.59*** –0.02 0.41* 0.90*** 0.45**
Abbreviations: WC, waist circumference measured by tape; WC*2, WC2 calculated from total scan area; V-fat, visceral fat; S-fat,subcutaneous fat; F-F, fat-free; HC, hip circumference; WHR, waist-to-hip ratio. *P<0.05; **P<0.01; ***P<0.001.
IJBCR 11.3 & 4_inners_IJBCR 11.3 & 4_inners.qxd 02/01/2014 12:59 Page 79
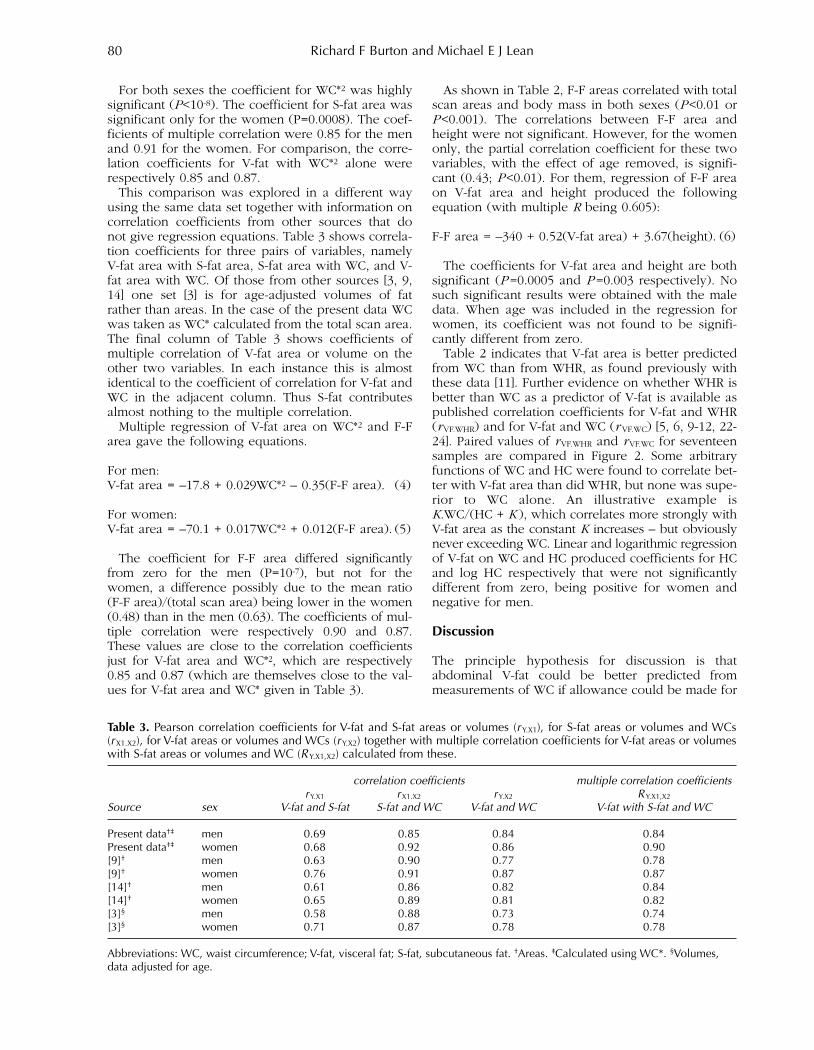
For both sexes the coefficient for WC*2 was highlysignificant (P<10-8). The coefficient for S-fat area wassignificant only for the women (P=0.0008). The coef-ficients of multiple correlation were 0.85 for the menand 0.91 for the women. For comparison, the corre-lation coefficients for V-fat with WC*2 alone wererespectively 0.85 and 0.87. This comparison was explored in a different way
using the same data set together with information oncorrelation coefficients from other sources that donot give regression equations. Table 3 shows correla-tion coefficients for three pairs of variables, namelyV-fat area with S-fat area, S-fat area with WC, and V-fat area with WC. Of those from other sources [3, 9,14] one set [3] is for age-adjusted volumes of fatrather than areas. In the case of the present data WCwas taken as WC* calculated from the total scan area.The final column of Table 3 shows coefficients ofmultiple correlation of V-fat area or volume on theother two variables. In each instance this is almostidentical to the coefficient of correlation for V-fat andWC in the adjacent column. Thus S-fat contributesalmost nothing to the multiple correlation. Multiple regression of V-fat area on WC*2 and F-F
area gave the following equations.
For men:V-fat area = –17.8 + 0.029WC*2 – 0.35(F-F area). (4)
For women:V-fat area = –70.1 + 0.017WC*2 + 0.012(F-F area). (5)
The coefficient for F-F area differed significantlyfrom zero for the men (P=10-7), but not for thewomen, a difference possibly due to the mean ratio(F-F area)/(total scan area) being lower in the women(0.48) than in the men (0.63). The coefficients of mul-tiple correlation were respectively 0.90 and 0.87.These values are close to the correlation coefficientsjust for V-fat area and WC*2, which are respectively0.85 and 0.87 (which are themselves close to the val-ues for V-fat area and WC* given in Table 3).
As shown in Table 2, F-F areas correlated with totalscan areas and body mass in both sexes (P<0.01 orP<0.001). The correlations between F-F area andheight were not significant. However, for the womenonly, the partial correlation coefficient for these twovariables, with the effect of age removed, is signifi-cant (0.43; P<0.01). For them, regression of F-F areaon V-fat area and height produced the followingequation (with multiple R being 0.605):
F-F area = –340 + 0.52(V-fat area) + 3.67(height). (6)
The coefficients for V-fat area and height are bothsignificant (P=0.0005 and P=0.003 respectively). Nosuch significant results were obtained with the maledata. When age was included in the regression forwomen, its coefficient was not found to be signifi-cantly different from zero. Table 2 indicates that V-fat area is better predicted
from WC than from WHR, as found previously withthese data [11]. Further evidence on whether WHR isbetter than WC as a predictor of V-fat is available aspublished correlation coefficients for V-fat and WHR(rVF.WHR) and for V-fat and WC (r VF.WC) [5, 6, 9-12, 22-24]. Paired values of rVF.WHR and rVF.WC for seventeensamples are compared in Figure 2. Some arbitraryfunctions of WC and HC were found to correlate bet-ter with V-fat area than did WHR, but none was supe-rior to WC alone. An illustrative example isK.WC/(HC + K ), which correlates more strongly withV-fat area as the constant K increases – but obviouslynever exceeding WC. Linear and logarithmic regressionof V-fat on WC and HC produced coefficients for HCand log HC respectively that were not significantlydifferent from zero, being positive for women andnegative for men.
Discussion
The principle hypothesis for discussion is thatabdominal V-fat could be better predicted frommeasurements of WC if allowance could be made for
Richard F Burton and Michael E J Lean80
Table 3. Pearson correlation coefficients for V-fat and S-fat areas or volumes (rY.X1), for S-fat areas or volumes and WCs(rX1.X2), for V-fat areas or volumes and WCs (rY.X2) together with multiple correlation coefficients for V-fat areas or volumeswith S-fat areas or volumes and WC (RY.X1,X2) calculated from these.
correlation coefficients multiple correlation coefficientsrY.X1 rX1.X2 rY.X2 RY.X1,X2
Source sex V-fat and S-fat S-fat and WC V-fat and WC V-fat with S-fat and WC
Present data†‡ men 0.69 0.85 0.84 0.84 Present data†‡ women 0.68 0.92 0.86 0.90[9]† men 0.63 0.90 0.77 0.78 [9]† women 0.76 0.91 0.87 0.87[14]† men 0.61 0.86 0.82 0.84 [14]† women 0.65 0.89 0.81 0.82[3]§ men 0.58 0.88 0.73 0.74 [3]§ women 0.71 0.87 0.78 0.78
Abbreviations: WC, waist circumference; V-fat, visceral fat; S-fat, subcutaneous fat. †Areas. ‡Calculated using WC*. §Volumes,data adjusted for age.
IJBCR 11.3 & 4_inners_IJBCR 11.3 & 4_inners.qxd 02/01/2014 12:59 Page 80

variations in one of the two other components of theabdomen, namely S-fat and fat-free content. Evidenceon relationships between WCs and areas within trans-verse abdominal scans obtained by computerizedtomography is ordinarily subject to scatter resultingfrom discrepancies in the levels and timing of scan-ning and of measuring with tape. The novelapproach to eliminating this scatter is discussed firstand then the principle hypothesis. The effect of ageis discussed next and, finally, the topic is consideredin the wider context of the clinical assessment ofhealth risks. Figure 1 shows that total scan area is approximately
proportional to WC2, with the constant of proportion-ality (α) being close to 0.07 as used in the calculationof WC*2 as (total scan area)/0.07. The scatter aroundthe line may partly be due to measurement error, but,more importantly, it must reflect discrepancies inplane of measurement and variations in the disposi-tion of abdominal contents between measurements.Use of WC*2 makes those discrepancies irrelevant,because it is obtained from the scans themselves.Nevertheless, some scatter would result from varia-tions in the shape of the scan area. As shown inTable 2, the V-fat and S-fat areas and F-F area all cor-relate slightly more strongly with WC*2 than with WCas measured by tape. This is unsurprising, since WC*2is exactly proportional to total scan area, ie the sumof the V-fat and S-fat areas and of F-F area. That thesuperiority of using WC* is not apparent in the con-text of some other correlations coefficients, as forexample in the case of WC and WHR, is also unsur-prising, because neither WC* nor WC measured bytape is intrinsically more valid than the other (witheach one corresponding to a slightly different leveland timing). Note that WC* is only relevant to scien-tific studies, as here, and can never be relevant inclinical settings; when the scan measurements neededfor its calculation are available, they would providedirect evidence on V-fat anyway. Whether or not WCis squared is of minor consequence here inasmuch asWC2 is almost linearly related to WC within normalranges. In clinical settings, there may therefore be lit-tle point to the extra trouble of squaring measure-ments of WC. It was postulated that V-fat might in principle be
better predicted from WC if accurate allowancescould be made for variations in abdominal S-fat. Thatthe WC on its own is in any case a moderately reliableindex of V-fat area is largely due to the strong corre-lation between areas of abdominal V-fat and S-fat.Nevertheless, if a separate measure of S-fat area wereavailable, multiple regression of V-fat area both onthat measure and on either WC or WC2 might beexpected to produce a better prediction equationthan one relating V-fat area solely to WC.Unfortunately, it is shown here that such a procedureadds nothing. Thus the coefficients of multiple corre-lation of V-fat area on WC and S-fat area for all eightdata sets of Table 3 turn out to be barely higher thanthe coefficients of correlation between V-fat area and
WC. Therefore V-fat areas are as accurately estimatedfrom WCs alone as from WCs and S-fat areas together.It follows that, when S-fat areas are not known, as isusual, it cannot help to utilize in their place estimatesof S-fat area derived, for example, from estimates ofgeneral body fatness. That this conclusion appliesover a wide range of adiposity is shown by the factthat, in two of the studies [9, 14], the SDs of WC andBMI were substantially greater than in Table 1.Indeed, in one case [14] the SDs for WC were 16.3 cmfor men and 17.9 cm for women with those for BMIbeing respectively 6.0 and 8.0 kg/m2. In accordancewith this conclusion, taking BMI into accountimproves the prediction of visceral fat from WC by atmost 2% [26, 27]. Any residual optimism should bedispelled by the realization that no indirect estimateof S-fat area is likely to be perfectly accurate.These examples, including equations 2-5, illustrate
a general statistical point that is not always recog-nized – that a significant term in a multiple regressionequation may have physical or biological meaningwhile contributing little or nothing to predictivepower.Though disappointing, it is an important conclu-
sion that indices of abdominal S-fat cannot be com-bined with WC to make WC a better predictor of V-fat, as this should save research effort. As for combin-ing WC with HC, most evidence is against WHRbeing better than WC as a predictor of V-fat. This isillustrated by the relevant correlation coefficients ofTable 2, but is shown more conclusively by Figure 2in which most points lie below the line of equality.Whether any of the paired values of rVF.WHR and rVF.WCdiffer significantly was not recorded. The rationalefor combining HC with WC as a simple ratio (WHR)is in any case unclear, though HC correlates with S-fat as expected (Table 2). The possibility of finding abetter function of WC and HC for predicting V-fatwas examined, but none was found. WHR does correlate with health risks [29-30], but it
does so mainly in cross-sectional studies, where it islikely to be increased by recent or impending illness(eg recent onset of coronary heart disease) throughloss of gluteal muscle mass. Moreover, because WHR,like WC, correlates with abdominal S-fat [5, 6, 8-10,14, 15, 21] as well as being affected by muscle mass,it cannot be assumed that correlations between WHRand health outcomes or biomarkers necessarily relatespecifically to V-fat or even to variations in body fat.HC has a role in the WHR independent of fatness inthat there is an adverse effect of small hip size on cardiovascular disease factors [14, 31]. The F-F area is a large part of the total scan area
(Table 1) and, more relevant, its standard deviationsin this study were similar to those of the V-fat areas.Multiple regression of V-fat area on WC*2 and F-Farea (equations 4 and 5) showed that even exactknowledge of F-F areas could improve estimates ofV-fat from WC only marginally in men and not at allin women. Indirect estimates of F-F area could in anycase be only very approximate, but some other find-
Waist circumference and abdominal fat 81
IJBCR 11.3 & 4_inners_IJBCR 11.3 & 4_inners.qxd 02/01/2014 12:59 Page 81

ings regarding F-F areas may be noted. Thus theycorrelated with total body mass in both sexes (Table2), perhaps because of their expected, but untested,correlation with lean body mass. In women only,there appears to be a positive link between F-F areaand V-fat (equation 6). It may therefore be that thenon-fat components of the abdomen are increased bythe presence of V-fat much as total lean body masstends to increase with fat mass [32]. That equation 6also indicates a correlation between F-F area andheight in women is unsurprising in that both arereflections of body size. These minor points, includingthe difference between the sexes, should be checkedwith larger samples. As already noted, the volume and transverse scan
areas of V-fat tend to increase with age [3, 5-7, 11, 16,18, 19, 21, 23] together with general adiposity.However, more relevant here is the fact that theytend to do so more than those of S-fat, so that the V-fat/S-fat ratio tends to rise with age [6, 7, 19, 21]. Thisaccords with the finding that the V-fat area or massfor a given WC tends to be higher after the age of 50years than before, this effect being clearer in malesand in individuals with larger WCs [11, 18]. It thusseems that age might usefully be combined with WCas an index predictive of V-fat. However, judgedvisually from plotted regression lines [16], the ageeffect seems small in Japanese men and women.Regression of V-fat area on WC together with age for110 Canadian men [5] produced partial correlationcoefficients of 0.82 for WC and 0.26 for age and amultiple correlation coefficient of 0.86, which isslightly above the coefficient of 0.82 for WC alone.Independently of age, the menopause tends to raiseV-fat mass for a given WC [18].
Conclusion
WC is a convenient and useful guide to abdominalvisceral fat mass. It might seem that a better indexcould be found that allows for variations in theabdominal content of either subcutaneous fat or non-fat tissue, but the data indicate that this cannot beachieved. Nevertheless, allowance for age can mod-estly increase the predictive power of the WC. TheWHR is less satisfactory than the WC as an index ofabdominal visceral fat.
Acknowledgements – The authors acknowledge thework of the co-authors of the papers which form thesource material for the present analysis, in particularProf Jaap Seidell and Dr Thang Han. This researchreceived no specific grant from any funding agencyin the public, commercial or not�for�profit sectors.
Disclosures – No conflicts of interest, financial or oth-erwise, are declared by the authors.
References
1. Després J-P, Lemieux I. Abdominal obesity and meta-bolic syndrome. Nature 2006; 444: 881-887.
2. Després J-P. Is visceral obesity the cause of the meta-bolic syndrome? Ann Med 2006; 38: 52-63.
3. Fox CS, Massaro JM, Hoffmann U et al. Abdominal vis-ceral and subcutaneous adipose tissue compartments.Association with metabolic risk factors in theFramingham heart study. Circulation 2007; 116: 39-48.
4. Hayashi T, Boyko EJ, McNeely MJ et al. Visceral adiposity, not abdominal subcutaneous fat area, isassociated with an increase in future insulin resistancein Japanese Americans. Diabetes 2008; 57: 1209-1275.
5. Després J-P, Prud’homme D, Pouliot M-C et al.Estimation of deep abdominal adipose-tissue accumu-lation from simple anthropometric measurements inmen. Am J Clin Nutr 1991; 54: 471-477.
6. Ross R, Léger L, Morris D et al. Quantification of adi-pose tissue by MRI: relationship with anthropometricvariables. J Appl Physiol 1992; 72: 787-795.
7. Van der Kooy K, Leenen R, Seidell JC et al. Waist-hipratio is a poor predictor of changes in visceral fat. AmJ Clin Nutr 1993; 57: 327-333.
8. Van der Kooy K, Leenen R, Seidell JC et al. Abdominaldiameters as indicators of visceral fat: comparisonbetween magnetic resonance imaging and anthropom-etry. Brit J Nutr 1993; 70: 47-58.
9. Pouliot M-C, Després J-P, Lemieux S et al. Waist circum-ference and abdominal sagittal diameter: best simpleanthropometric indexes of abdominal visceral adiposetissue accumulation and related cardiovascular risk inmen and women. Am J Cardiol 1994; 73: 460-468.
10. Schreiner PJ, Terry JG, Evans GW et al. Sex-specificassociations of magnetic resonance imaging-derivedintra-abdominal and subcutaneous fat areas with con-ventional anthropometric indices. Am J Epidemiol1996; 144: 335-345.
11. Han TS, McNeill G, Seidell JC et al. Predicting intra-abdominal fatness from anthropometric measures: theinfluence of stature. Int J Obes 1997; 21: 587-593.
12. Kamel EG, McNeill G, Han TS et al. Measurement ofabdominal fat by magnetic resonance imaging, dualenergy X-ray absorptiometry and anthropometry innon-obese men and women. Int J Obes 1999; 23: 686-692.
13. Kullberg J, von Below C, Lönn L et al. Practical approachfor estimation of subcutaneous and visceral adipose tissue. Clin Physiol Funct Imag 2007; 27: 148-153.
14. Seidell JC, Pérusse L, Després J-P et al. Waist and hipcircumferences have independent and opposite effectson cardiovascular disease risk factors: the QuebecFamily Study. Am J Clin Nutr 2001; 74: 315-321.
15. Furukawa K, Katabami T, Nakajima Y et al. Evaluationof whole-abdominal fat volume by 700-slice CT scan-ning and comparison with the umbilical fat areaanthropometric indices. Obes Res Clin Pract 2010; 24:e111-e117.
16. Hiuge-Shimizu A, Kishida K, Funahashi T et al. Absolutevalue of visceral fat area measured on computed tomog-raphy scans and obesity-related cardiovascular risk factors in large-scale Japanese general population (theVACATION-J study). Ann Med 2012; 44: 82-92.
17. Camhi SM, Bray GA, Bouchard C et al. The relationshipof waist circumference and BMI to visceral, subcuta-neous, and total body fat: sex and race differences.Obesity (Silver Spring) 2011; 19: 402-408.
Richard F Burton and Michael E J Lean82
IJBCR 11.3 & 4_inners_IJBCR 11.3 & 4_inners.qxd 02/01/2014 12:59 Page 82
18. Kuk JL, Lee S, Heymsfield SB et al. Waist circumferenceand abdominal adipose tissue distribution: influence ofage and sex. Am J Clin Nutr 2005; 81: 1330-1334.
19. Enzi G, Gasparo M, Biondetti PR et al. Subcutaneousand visceral fat distribution according to sex, age, andoverweight, evaluated by computed tomography. Am JClin Nutr 1986; 44: 739-746.
20. Kvist H, Chowdhury B, Grangård U et al. Total and vis-ceral adipose-tissue volumes derived from measure-ments with computed tomography in adult men andwomen: predictive equations. Am J Clin Nutr 1988; 48:1351-1361.
21. Seidell JC, Oosterlee A, Thijssen MAO et al.Assessment of intra-abdominal and subcutaneousabdominal fat: relation between anthropometry andcomputed tomography. Am J Clin Nutr 1987; 45: 7-13.
22. Kaul S, Rothney MP, Peters DM et al. Dual-energy X-ray absorptiometry for quantification of visceral fat.Obesity (Silver Spring) 2012; 20: 1313-1318.
23. Lemieux S, Prud’homme D, Bouchard C et al. A singlethreshold value of waist girth identifies normal-weightand overweight subjects with excess visceral adiposetissue. Am J Clin Nutr 1996; 64: 685-693.
24. Savgan-Gurol E, Bredella M, Russell M et al. Waist tohip ratio and trunk to extremity fat (DXA) are bettersurrogates for IMCL and for visceral fat respectivelythan for subcutaneous fat in adolescent girls. NutrMetab 2010; 7: 86-93.
25. Burton RF. Waist circumference as an indicator of adi-posity and the relevance of body height. Med Hypoth2010; 75: 115-119.
26. Spiegel MR, Stephens LJ. Schaum’s outline of statistics.4th edition. USA: McGraw-Hill Companies Inc. 2011.
27. Janssen I, Heymsfield SB, Allison DB et al. Body massindex and waist circumference independently con-tribute to the prediction of nonabdominal, abdominalsubcutaneous, and visceral fat. Am J Clin Nutr 2001; 75:683–688.
28. Berentzen TL, Ängquist L, Kotronen A et al. Waist cir-cumference adjusted for body mass index and intra-abdominal fat mass. PLoS ONE 2012; 7(2) e32213.doi:10.1371/journal.pone.0032213.
29. Price GM, Uauy R, Breeze E et al. Weight, shape, andmortality risk in older persons: elevated waist-hip ratio,not high body mass index, is associated with a greaterrisk of death. Amer J Clin Nutr 2006; 84: 449-460.
30. Vazquez G, Duval S, Jacobs DR et al. Comparison ofbody mass index, waist circumference, and waist/hipratio in predicting incident diabetes: a meta-analysis.Epidemiol Rev 2007; 29: 115-128.
31. Heitmann BL, Lissner L. Hip Hip Hurrah! Hip sizeinversely related to heart disease and total mortality.Obes Rev 2010; 12: 478-481.
32. Burton RF. The influence of fat mass on fat-free massin healthy adults. Int J Body Comp Res 2010; 8: 109-116.
Waist circumference and abdominal fat 83
IJBCR 11.3 & 4_inners_IJBCR 11.3 & 4_inners.qxd 02/01/2014 12:59 Page 83

84
IJBCR 11.3 & 4_inners_IJBCR 11.3 & 4_inners.qxd 02/01/2014 12:59 Page 84
Introduction
As the prevalence of childhood obesity has increased[1], concerns about the impact of excess adiposity onthe early appearance of cardiovascular risk factorshave deepened. Anthropometric indices such asbody mass index (BMI) and waist circumference(WC) provide simple and inexpensive indicators ofbody fat and body fat distribution for these studies,however, these indices cannot distinguish fat mass(FM) from fat-free mass (FFM). Previous studies inyouth have documented that BMI and DXA-assessedtotal body fat are strongly correlated [2-8] and thatboth indices are associated with cardiovascular risk
factors [5-7, 9-11]. It remains unclear whether anthro-pometric indices are equivalent predictors of cardio-vascular risk when compared with measures of adi-posity by DXA. Recently, Sun et al. [12] presented a study comparing
the validity of DXA measurements and severalanthropometric indices with respect to their correla-
International Journal of Body Composition Research 2013 Vol. 11 No. 3 & 4: 85–96. © Smith-Gordon ISSN 1479-456X
Submitted 21 August 2013 accepted 5 October 2013
Anthropometric indices as measures of body fat assessedby DXA in relation to cardiovascular risk factors in children and adolescents: NHANES 1999-2004
Zhaohui Cui1, Kimberly P Truesdale1, Jianwen Cai2, Michaela B Koontz3 and June Stevens1,4
1Department of Nutrition, Gillings School of Global Public Health,University of North Carolina, Chapel Hill, NC; 2Department of Biostatistics,
Gillings School of Global Public Health, University of North Carolina,Chapel Hill, NC; 3Department of Pediatrics, Rainbow Babies and Children's
Hospital, Case Western Reserve University, Cleveland, Ohio; 4Department of Epidemiology, Gillings School of Global Public Health,
University of North Carolina, Chapel Hill, NC, USA.
Objective: Anthropometrics are commonly used indices of total and central adiposity. No study has com-pared anthropometris measurements to dual-energy X-ray absorptiometry (DXA) measurements as correlatesof cardiovascular risks in a nationally representative sample of youth. We aimed to evaluate the validity ofanthropometrics compared to DXA-assessed adiposity in relation to cardiovascular risks in youth aged 8-19 years. Methods: Data were from the National Health and Nutrition Examination Survey 1999-2004 (n=7013). Weexamined the correlations between anthropometric and DXA measures of adiposity (i.e., body mass index(BMI) versus percent fat mass (%FM) and fat mass index, and waist circumference (WC) and waist-to-heightratio (WHtR) versus percent trunk fat mass (%TFM)) with nine cardiovascular risks, stratified by sex andage, or race-ethnicity. Results: Anthropometric and DXA adiposity measures were significantly correlated with insulin (r: 0.48 to0.66), C-reactive protein (r: 0.47 to 0.58), triglycerides (r: 0.15 to 0.41), high-density lipoprotein choles-terol (HDL-C, r: -0.44 to -0.22), systolic blood pressure (SBP, r: 0.10 to 0.31), low-density lipoprotein cho-lesterol (r: 0.09 to 0.30), total cholesterol (TC, r: 0.01 to 0.29) and glucose (r: 0.05 to 0.20). Only in allyouth, BMI was more strongly correlated with SBP (0.22 vs. 0.12, P<0.0001) and HDL-C (-0.34 vs. -0.25,P<0.0001) than %FM; WC but not WHtR was more strongly correlated with HDL-C (-0.37 vs. -0.30,P<0.0001) but less strongly associated with TC (0.12 vs. 0.21, P<0.0001) than %TFM.Conclusions: DXA adiposity measures do not produce stronger associations with cardiovascular risk factorsin youth than BMI or WC.
Keywords: body mass index, waist circumference, waist-to-height ratio, trunk fat
Address for correspondence (Reprints not available): June Stevens,2207 McGavran-Greenberg Hall, Department of Nutrition, CB 7461,Gillings School of Global Public Health, University of North Carolinaat Chapel Hill, Chapel Hill, NC 27599-7461, USA. Telephone: 919-966-7218Fax: 919-966-7215Email: [email protected]
IJBCR 11.3 & 4_inners_IJBCR 11.3 & 4_inners.qxd 02/01/2014 12:59 Page 85
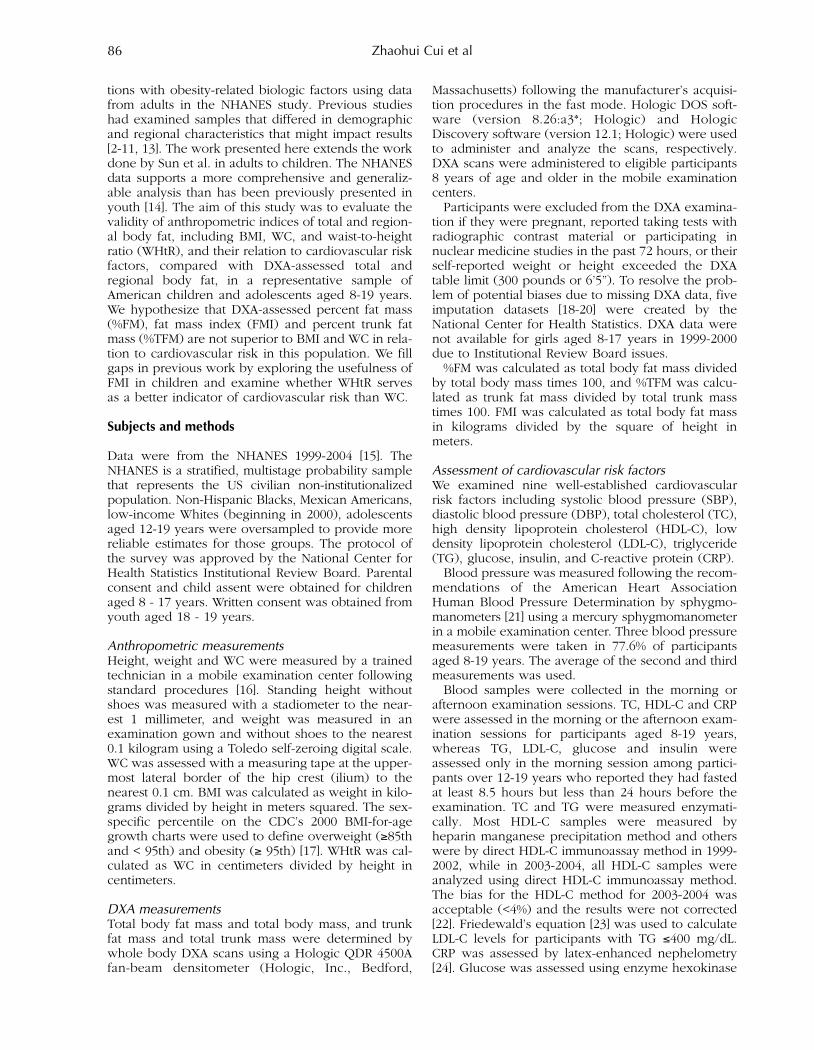
tions with obesity-related biologic factors using datafrom adults in the NHANES study. Previous studieshad examined samples that differed in demographicand regional characteristics that might impact results[2-11, 13]. The work presented here extends the workdone by Sun et al. in adults to children. The NHANESdata supports a more comprehensive and generaliz-able analysis than has been previously presented inyouth [14]. The aim of this study was to evaluate thevalidity of anthropometric indices of total and region-al body fat, including BMI, WC, and waist-to-heightratio (WHtR), and their relation to cardiovascular riskfactors, compared with DXA-assessed total andregional body fat, in a representative sample ofAmerican children and adolescents aged 8-19 years.We hypothesize that DXA-assessed percent fat mass(%FM), fat mass index (FMI) and percent trunk fatmass (%TFM) are not superior to BMI and WC in rela-tion to cardiovascular risk in this population. We fillgaps in previous work by exploring the usefulness ofFMI in children and examine whether WHtR servesas a better indicator of cardiovascular risk than WC.
Subjects and methods
Data were from the NHANES 1999-2004 [15]. TheNHANES is a stratified, multistage probability samplethat represents the US civilian non-institutionalizedpopulation. Non-Hispanic Blacks, Mexican Americans,low-income Whites (beginning in 2000), adolescentsaged 12-19 years were oversampled to provide morereliable estimates for those groups. The protocol ofthe survey was approved by the National Center forHealth Statistics Institutional Review Board. Parentalconsent and child assent were obtained for childrenaged 8 - 17 years. Written consent was obtained fromyouth aged 18 - 19 years.
Anthropometric measurementsHeight, weight and WC were measured by a trainedtechnician in a mobile examination center followingstandard procedures [16]. Standing height withoutshoes was measured with a stadiometer to the near-est 1 millimeter, and weight was measured in anexamination gown and without shoes to the nearest0.1 kilogram using a Toledo self-zeroing digital scale.WC was assessed with a measuring tape at the upper-most lateral border of the hip crest (ilium) to thenearest 0.1 cm. BMI was calculated as weight in kilo-grams divided by height in meters squared. The sex-specific percentile on the CDC’s 2000 BMI-for-agegrowth charts were used to define overweight (≥85thand < 95th) and obesity (≥ 95th) [17]. WHtR was cal-culated as WC in centimeters divided by height incentimeters.
DXA measurementsTotal body fat mass and total body mass, and trunkfat mass and total trunk mass were determined bywhole body DXA scans using a Hologic QDR 4500Afan-beam densitometer (Hologic, Inc., Bedford,
Massachusetts) following the manufacturer’s acquisi-tion procedures in the fast mode. Hologic DOS soft-ware (version 8.26:a3*; Hologic) and HologicDiscovery software (version 12.1; Hologic) were usedto administer and analyze the scans, respectively.DXA scans were administered to eligible participants8 years of age and older in the mobile examinationcenters.Participants were excluded from the DXA examina-
tion if they were pregnant, reported taking tests withradiographic contrast material or participating innuclear medicine studies in the past 72 hours, or theirself-reported weight or height exceeded the DXAtable limit (300 pounds or 6’5”). To resolve the prob-lem of potential biases due to missing DXA data, fiveimputation datasets [18-20] were created by theNational Center for Health Statistics. DXA data werenot available for girls aged 8-17 years in 1999-2000due to Institutional Review Board issues. %FM was calculated as total body fat mass divided
by total body mass times 100, and %TFM was calcu-lated as trunk fat mass divided by total trunk masstimes 100. FMI was calculated as total body fat massin kilograms divided by the square of height inmeters.
Assessment of cardiovascular risk factorsWe examined nine well-established cardiovascularrisk factors including systolic blood pressure (SBP),diastolic blood pressure (DBP), total cholesterol (TC),high density lipoprotein cholesterol (HDL-C), lowdensity lipoprotein cholesterol (LDL-C), triglyceride(TG), glucose, insulin, and C-reactive protein (CRP).Blood pressure was measured following the recom-
mendations of the American Heart AssociationHuman Blood Pressure Determination by sphygmo-manometers [21] using a mercury sphygmomanometerin a mobile examination center. Three blood pressuremeasurements were taken in 77.6% of participantsaged 8-19 years. The average of the second and thirdmeasurements was used.Blood samples were collected in the morning or
afternoon examination sessions. TC, HDL-C and CRPwere assessed in the morning or the afternoon exam-ination sessions for participants aged 8-19 years,whereas TG, LDL-C, glucose and insulin wereassessed only in the morning session among partici-pants over 12-19 years who reported they had fastedat least 8.5 hours but less than 24 hours before theexamination. TC and TG were measured enzymati-cally. Most HDL-C samples were measured byheparin manganese precipitation method and otherswere by direct HDL-C immunoassay method in 1999-2002, while in 2003-2004, all HDL-C samples wereanalyzed using direct HDL-C immunoassay method.The bias for the HDL-C method for 2003-2004 wasacceptable (<4%) and the results were not corrected[22]. Friedewald’s equation [23] was used to calculateLDL-C levels for participants with TG ≤400 mg/dL.CRP was assessed by latex-enhanced nephelometry[24]. Glucose was assessed using enzyme hexokinase
Zhaohui Cui et al86
IJBCR 11.3 & 4_inners_IJBCR 11.3 & 4_inners.qxd 02/01/2014 12:59 Page 86

and insulin was assessed using two-site immunoen-zymometric assay [25]. There were changes to theequipment and laboratory method in the assessmentof insulin in 2003-2004 [26].
Analysis sampleThe NHANES 1999-2004 sample consisted of 7862 par-ticipants aged 8-19 years who were interviewed andeligible for DXA assessments. Youth who did not havea fat mass estimate by DXA calculated or imputed (n= 215); were missing weight, height or WC (n = 137);were missing all cardiovascular risk factors (n = 211);or were using medication in the past month that mayinfluence blood pressure, blood lipids, glucose orbody weight (n = 286) were excluded from analyses.A total of 7013 participants were included. Of these
participants, DXA data were imputed for 606 (8.6%)participants. Among the 7013 participants, SBP andDBP were available for 5597 and TC, HDL-C and CRPwere available for 6549 children aged 8-19 years.Fasting TG, LDL-C, glucose and insulin were not meas-ured in children less than 12 years of age, and datawere available for 2227 adolescents aged 12-19 years.
Statistical analysisAll analyses were conducted using SAS (version 9.2;SAS institute, Cary, NC, USA). Sample characteristicswere described using mean and standard error afteradjusting for the complex sampling design. We exam-ined the partial Pearson correlations between BMIand %FM and FMI. WC and WHtR are both proxiesfor central fat, therefore, we examined correlations
Anthropometric indices as measures of body fat assessed by DXA 87
Table 1. Characteristics of the analytic sample of aged 8-19 years: National Health and Nutrition Examination Survey 1999– 2004a.
Boys Girlsnb Mean (SE)c nb Mean (SE)c
Age (years) 4209 13.6 (0.1) 2804 13.3 (0.1)Gender (%) 4209 52.4 (0.8) 2804 47.6 (0.8)Race-ethnicity (%)
Mexican Americans 1473 11.6 (1.3) 952 12.1 (1.6)Non-Hispanic Whites 1044 59.9 (2.2) 735 60.4 (2.7)Non-Hispanic Blacks 1373 15.1 (1.5) 897 15.1 (1.6)Others 319 13.4 (1.6) 220 12.4 (1.7)
Overweight (%) 4209 16.4 (0.8) 2804 16.8 (0.9)Obesity (%) 4209 17.9 (1.0) 2804 17.0 (1.2)%FM 4209 25.4 (0.2) 2804 32.9 (0.3)FMI (kg/m2) 4209 5.9 (0.1) 2804 7.6 (0.1)BMI (kg/m2) 4209 21.9 (0.1) 2804 22.0 (0.2)%TFMd 4209 22.2 (0.3) 2804 29.0 (0.3)WC (cm) 4209 77.0 (0.4) 2804 76.1 (0.5)WHtR 4209 0.479 (0.002) 2804 0.492 (0.003)Blood pressure
SBP (mmHg) 3336 112.1 (0.5) 2261 108.3 (0.8)DBP (mmHg) 3336 62.3 (0.4) 2261 63.3 (0.4)
Fasting and nonfasting blood CVD risk factorsTC (mg/dL) 3928 161.8 (0.9) 2621 164.5 (0.9)HDL-C (mg/dL) 3928 49.2 (0.4) 2621 52.8 (0.3)CRP (mg/dL) 3928 0.15 (0.01) 2621 0.15 (0.01)
Fasting blood CVD risk factors in 12-19 yearsTG (mg/dL) 1370 91.6 (2.3) 857 82.8 (2.6)LDL-C (mg/dL) 1370 92.6 (1.2) 857 91.8 (1.2)Glucose (mg/dL) 1370 93.3 (0.4) 857 90.0 (0.4)Insulin (µU/mL) 1370 11.8 (0.3) 857 12.1 (0.4)
a Abbreviations: SE for standard error, %FM for percent fat mass, FMI for fat mass index, BMI for body mass index, %TFM forpercent trunk fat mass, WC for waist circumference, WHtR for waist-to-height ratio, SBP for systolic blood pressure, DBP fordiastolic blood pressure, TC for total cholesterol, TG for triglycerides, HDL-C for high-density lipoprotein cholesterol, LDL-C forlow-density lipoprotein cholesterol, and CRP for C-reactive protein.b Analytic sample sizes (n) were unweighted. DXA data were not collected for girls aged 8-17 years in 1999-2000 due to unre-solved Institutional Review Board issues concerning the reporting pregnancy test results in minors.c Mean and standard error were adjusted for complex sampling design.d %TFM was calculated as total trunk fat mass divided by total trunk mass times 100.
IJBCR 11.3 & 4_inners_IJBCR 11.3 & 4_inners.qxd 02/01/2014 12:59 Page 87

between WC, WHtR and %TFM. In the partial corre-lation analyses of adiposity indices with cardiovascularrisk factors, all variables except SBP and DBP werelog-transformed to account for the skewed distribu-tion. All correlation analyses were stratified by genderand age (8-11 years and 12-19 years), race-ethnicity, orin all youth after adjusting for sampling weight, agein years, gender and race-ethnicity whenever appli-cable. Analysis stratified by race-ethnicity was limitedto Mexican Americans, non-Hispanic White and Blackbecause of small sample size in other race-ethnicgroups. The assessment methods for insulin weremodified in 2003, and therefore survey year (1999-2002 or 2003-2004) was also adjusted in analyses ofinsulin. We initially adjusted associations with riskfactors for physical activity and sedentary behavior(i.e., sitting and watching TV/videos, using computer),however, these adjustments did not appreciably alterour estimates. Therefore we did not include thosevariables in final models. For each cardiovascular risk factor, comparisons of
partial correlation coefficients were made betweenanthropometric and DXA measures of body fat (i.e.,BMI compared to %FM, BMI compared to FMI, WCcompared to %TFM, and WHtR compared to %TFM)within gender- and age-specific groups, withinrace/ethnicity-specific groups and within all youth.Comparisons were made by Wolfe’s method for com-paring dependent correlation coefficients estimated
in the same sample [27] after taking variance intro-duced by multiple imputations of DXA data intoaccount following the methods used by Sun et al. [12]Because multiple correlation coefficients were com-pared, we show Bonferroni-corrected P values (P <0.000195, corresponding to 0.05 divided by 256 com-parisons) and uncorrected P < 0.05 significance levels.
Results
In our study population the average age was 13.6years in boys and 13.3 years in girls (Table 1). Thesample included Mexican Americans, non-HispanicWhites, non-Hispanic Blacks and a combined categoryof other race-ethnicities. Around one-third of youthwere overweight or obese. The mean BMI (22.0kg/m2) was similar in boys and girls but boys had alower mean %FM compared to girls (25.4% vs.32.9%). Mean blood pressure, lipids, glucose andinsulin levels did not differ substantially by gender.Table 2 shows partial Pearson correlation coefficients
between DXA and anthropometric measures of bodyfat. Over all youth (8-19 year-olds), BMI was stronglycorrelated with %FM (r = 0.79) and FMI (r = 0.94).WC (r = 0.84) and WHtR (r = 0.90) were strongly cor-related with %TFM. Similar patterns were seen afterstratification by gender and age, or by race-ethnicity. Among all youth (Table 3), BMI was more strongly
correlated with SBP (r: 0.22 vs. 0.12) and HDL-C (r: -
Zhaohui Cui et al88
Table 2. Partial Pearson correlationsa of BMI to %FM and FMI and of WC and WHtR to %TFM b,c.
n d BMI WC WHtR%FM FMI %TFM
All youth 7013 0.79 0.94 0.84 0.90
Race-ethnicityMexican Americans 2425 0.80 0.95 0.85 0.89Non-Hispanic Whites 1779 0.80 0.94 0.85 0.90Non-Hispanic Blacks 2270 0.82 0.96 0.87 0.90
Boys8-19 years 4209 0.81 0.94 0.88 0.918-11 years 948 0.86 0.96 0.90 0.9112-19 years 3261 0.80 0.94 0.88 0.92
Girls8-19 years 2804 0.82 0.97 0.85 0.898-11 years 651 0.85 0.97 0.87 0.8912-19 years 2153 0.83 0.97 0.86 0.89
a Pearson correlation coefficients were adjusted for age in years, gender and race-ethnicity whenever applicable. Each correlationcoefficient is significantly different from 0 (P < 0.0001).b %TFM was calculated as total trunk fat mass divided by total trunk mass times 100.c Abbreviations: BMI for body mass index, %FM for percent fat mass, FMI for fat mass index, WC for waist circumference, WHtRfor waist-to-height ratio, %TFM for percent trunk fat mass.d Analytic sample sizes (n) were unweighted. DXA data were not collected for girls aged 8-17 years in 1999-2000 due to unre-solved Institutional Review Board issues concerning the reporting pregnancy test results in minors.
IJBCR 11.3 & 4_inners_IJBCR 11.3 & 4_inners.qxd 02/01/2014 12:59 Page 88
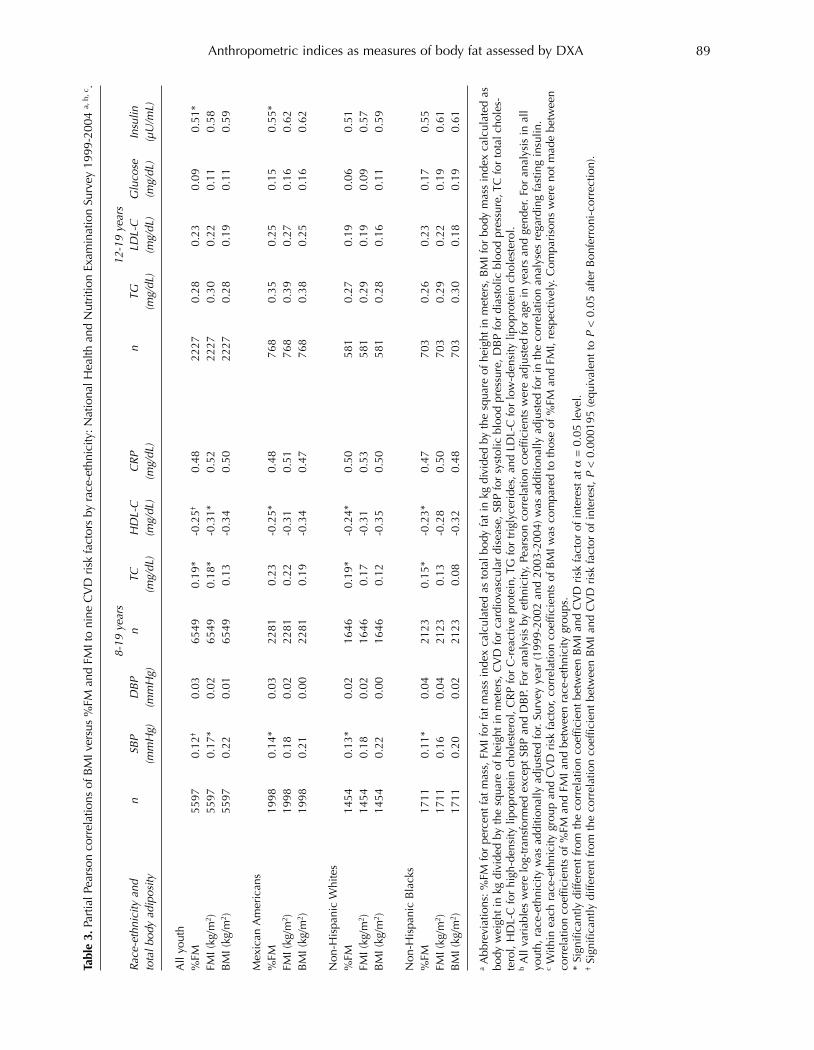
Anthropometric indices as measures of body fat assessed by DXA 89
Table 3. P
artia
l Pea
rson
cor
rela
tions
of B
MI v
ersu
s %
FM a
nd F
MI t
o ni
ne C
VD
ris
k fa
ctor
s by
rac
e-et
hnic
ity: N
atio
nal H
ealth
and
Nut
ritio
n Ex
amin
atio
n Su
rvey
199
9-20
04 a,
b, c
.
8-19 years
12-19 years
Race-ethnicity and
nSBP
DBP
nTC
HDL-C
CRP
nTG
LDL-C
Glucose
Insulin
total b
ody adiposity
(mmHg)
(mmHg)
(mg/dL)
(mg/dL)
(mg/dL)
(mg/dL)
(mg/dL)
(mg/dL)
(µU/mL)
All
yout
h%
FM55
970.
12†
0.03
6549
0.19
*-0
.25†
0.48
2227
0.28
0.23
0.09
0.51
*FM
I (kg
/m2 )
5597
0.17
*0.
0265
490.
18*
-0.3
1*0.
5222
270.
300.
220.
110.
58B
MI (
kg/m
2 )55
970.
220.
0165
490.
13-0
.34
0.50
2227
0.28
0.19
0.11
0.59
Mex
ican
Am
eric
ans
%FM
1998
0.14
*0.
0322
810.
23-0
.25*
0.48
768
0.35
0.25
0.15
0.55
*FM
I (kg
/m2 )
1998
0.18
0.02
2281
0.22
-0.3
10.
5176
80.
390.
270.
160.
62B
MI (
kg/m
2 )19
980.
210.
0022
810.
19-0
.34
0.47
768
0.38
0.25
0.16
0.62
Non
-His
pani
c W
hite
s%
FM14
540.
13*
0.02
1646
0.19
*-0
.24*
0.50
581
0.27
0.19
0.06
0.51
FMI (
kg/m
2 )14
540.
180.
0216
460.
17-0
.31
0.53
581
0.29
0.19
0.09
0.57
BM
I (kg
/m2 )
1454
0.22
0.00
1646
0.12
-0.3
50.
5058
10.
280.
160.
110.
59
Non
-His
pani
c B
lack
s%
FM17
110.
11*
0.04
2123
0.15
*-0
.23*
0.47
703
0.26
0.23
0.17
0.55
FMI (
kg/m
2 )17
110.
160.
0421
230.
13-0
.28
0.50
703
0.29
0.22
0.19
0.61
BM
I (kg
/m2 )
1711
0.20
0.02
2123
0.08
-0.3
20.
4870
30.
300.
180.
190.
61
aA
bbre
viat
ions
: %FM
for
perc
ent f
at m
ass,
FM
I for
fat m
ass
inde
x ca
lcul
ated
as
tota
l bod
y fa
t in
kg d
ivid
ed b
y th
e sq
uare
of h
eigh
t in
met
ers,
BM
I for
bod
y m
ass
inde
x ca
lcul
ated
as
body
wei
ght i
n kg
div
ided
by
the
squa
re o
f hei
ght i
n m
eter
s, C
VD
for
card
iova
scul
ar d
isea
se, S
BP
for
syst
olic
blo
od p
ress
ure,
DB
P fo
r di
asto
lic b
lood
pre
ssur
e, T
C fo
r to
tal c
hole
s-te
rol,
HD
L-C
for
high
-den
sity
lipo
prot
ein
chol
este
rol,
CR
P fo
r C
-rea
ctiv
e pr
otei
n, T
G fo
r tr
igly
ceri
des,
and
LD
L-C
for
low
-den
sity
lipo
prot
ein
chol
este
rol.
bA
ll va
riab
les
wer
e lo
g-tr
ansf
orm
ed e
xcep
t SB
P an
d D
BP.
For
ana
lysi
s by
eth
nici
ty, P
ears
on c
orre
latio
n co
effic
ient
s w
ere
adju
sted
for
age
in y
ears
and
gen
der.
For
anal
ysis
in a
llyo
uth,
rac
e-et
hnic
ity w
as a
dditi
onal
ly a
djus
ted
for.
Surv
ey y
ear
(199
9-20
02 a
nd 2
003-
2004
) was
add
ition
ally
adj
uste
d fo
r in
the
corr
elat
ion
anal
yses
reg
ardi
ng fa
stin
g in
sulin
.c
With
in e
ach
race
-eth
nici
ty g
roup
and
CV
D r
isk
fact
or, c
orre
latio
n co
effic
ient
s of
BM
I was
com
pare
d to
thos
e of
%FM
and
FM
I, re
spec
tivel
y. C
ompa
riso
ns w
ere
not m
ade
betw
een
corr
elat
ion
coef
ficie
nts
of %
FM a
nd F
MI a
nd b
etw
een
race
-eth
nici
ty g
roup
s.*
Sign
ifica
ntly
diff
eren
t fro
m th
e co
rrel
atio
n co
effic
ient
bet
wee
n B
MI a
nd C
VD
ris
k fa
ctor
of i
nter
est a
t α=
0.0
5 le
vel.
†Si
gnifi
cant
ly d
iffer
ent f
rom
the
corr
elat
ion
coef
ficie
nt b
etw
een
BM
I and
CV
D r
isk
fact
or o
f int
eres
t, P
< 0
.000
195
(equ
ival
ent t
o P
< 0
.05
afte
r B
onfe
rron
i-co
rrec
tion)
.
IJBCR 11.3 & 4_inners_IJBCR 11.3 & 4_inners.qxd 02/01/2014 12:59 Page 89
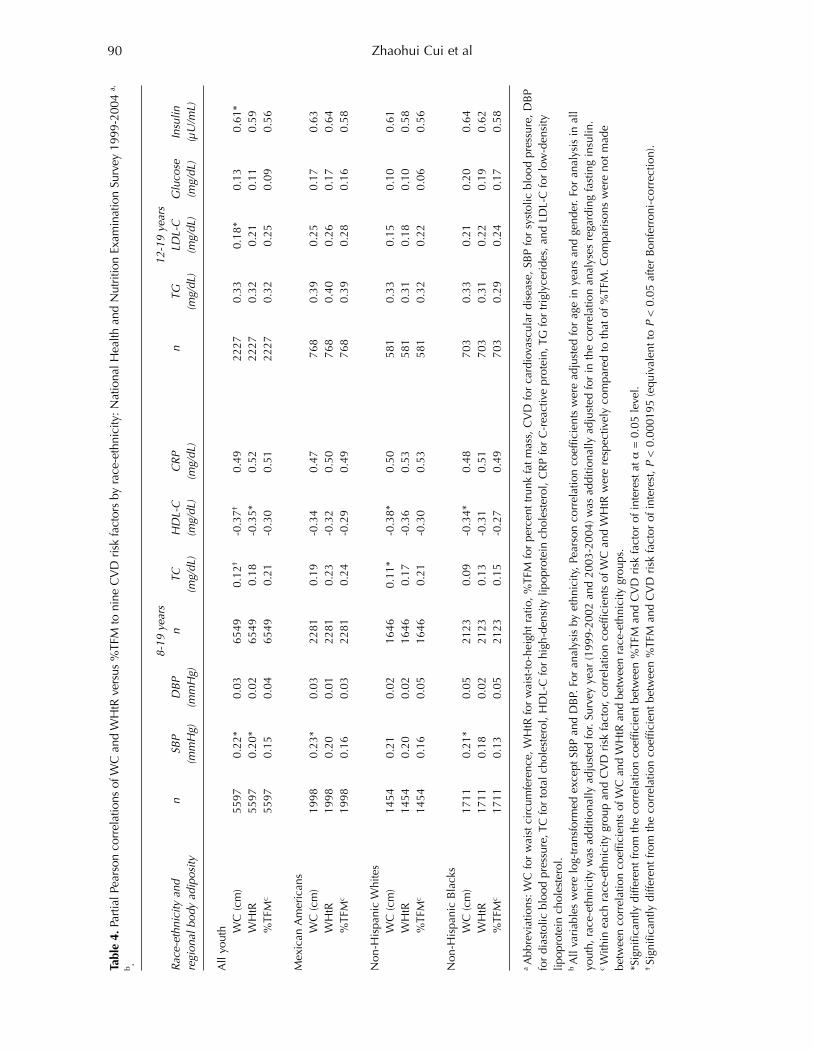
Zhaohui Cui et al90
Table 4. P
artia
l Pea
rson
cor
rela
tions
of W
C a
nd W
HtR
ver
sus
%TF
M to
nin
e C
VD
ris
k fa
ctor
s by
rac
e-et
hnic
ity: N
atio
nal H
ealth
and
Nut
ritio
n Ex
amin
atio
n Su
rvey
199
9-20
04 a,
b .
8-19 years
12-19 years
Race-ethnicity and
nSBP
DBP
nTC
HDL-C
CRP
nTG
LDL-C
Glucose
Insulin
regional body adiposity
(mmHg)
(mmHg)
(mg/dL)
(mg/dL)
(mg/dL)
(mg/dL)
(mg/dL)
(mg/dL)
(µU/mL)
All
yout
h WC
(cm
)55
970.
22*
0.03
6549
0.12
†-0
.37†
0.49
2227
0.33
0.18
*0.
130.
61*
WH
tR55
970.
20*
0.02
6549
0.18
-0.3
5*0.
5222
270.
320.
210.
110.
59%
TFM
c55
970.
150.
0465
490.
21-0
.30
0.51
2227
0.32
0.25
0.09
0.56
Mex
ican
Am
eric
ans
WC
(cm
)19
980.
23*
0.03
2281
0.19
-0.3
40.
4776
80.
390.
250.
170.
63W
HtR
1998
0.20
0.01
2281
0.23
-0.3
20.
5076
80.
400.
260.
170.
64%
TFM
c19
980.
160.
0322
810.
24-0
.29
0.49
768
0.39
0.28
0.16
0.58
Non
-His
pani
c W
hite
sW
C (c
m)
1454
0.21
0.02
1646
0.11
*-0
.38*
0.50
581
0.33
0.15
0.10
0.61
WH
tR14
540.
200.
0216
460.
17-0
.36
0.53
581
0.31
0.18
0.10
0.58
%TF
Mc
1454
0.16
0.05
1646
0.21
-0.3
00.
5358
10.
320.
220.
060.
56
Non
-His
pani
c B
lack
sW
C (c
m)
1711
0.21
*0.
0521
230.
09-0
.34*
0.48
703
0.33
0.21
0.20
0.64
WH
tR17
110.
180.
0221
230.
13-0
.31
0.51
703
0.31
0.22
0.19
0.62
%TF
Mc
1711
0.13
0.05
2123
0.15
-0.2
70.
4970
30.
290.
240.
170.
58
a A
bbre
viat
ions
: WC
for
wai
st c
ircu
mfe
renc
e, W
HtR
for
wai
st-t
o-he
ight
rat
io, %
TFM
for
perc
ent t
runk
fat m
ass,
CV
D fo
r ca
rdio
vasc
ular
dis
ease
, SB
P fo
r sy
stol
ic b
lood
pre
ssur
e, D
BP
for
dias
tolic
blo
od p
ress
ure,
TC
for
tota
l cho
lest
erol
, HD
L-C
for
high
-den
sity
lipo
prot
ein
chol
este
rol,
CR
P fo
r C
-rea
ctiv
e pr
otei
n, T
G fo
r tr
igly
ceri
des,
and
LD
L-C
for
low
-den
sity
lipop
rote
in c
hole
ster
ol.
b A
ll va
riab
les
wer
e lo
g-tr
ansf
orm
ed e
xcep
t SB
P an
d D
BP.
For
ana
lysi
s by
eth
nici
ty, P
ears
on c
orre
latio
n co
effic
ient
s w
ere
adju
sted
for
age
in y
ears
and
gen
der.
For
anal
ysis
in a
llyo
uth,
rac
e-et
hnic
ity w
as a
dditi
onal
ly a
djus
ted
for.
Surv
ey y
ear
(199
9-20
02 a
nd 2
003-
2004
) was
add
ition
ally
adj
uste
d fo
r in
the
corr
elat
ion
anal
yses
reg
ardi
ng fa
stin
g in
sulin
. c W
ithin
eac
h ra
ce-e
thni
city
gro
up a
nd C
VD
ris
k fa
ctor
, cor
rela
tion
coef
ficie
nts
of W
C a
nd W
HtR
wer
e re
spec
tivel
y co
mpa
red
to th
at o
f %TF
M. C
ompa
riso
ns w
ere
not m
ade
betw
een
corr
elat
ion
coef
ficie
nts
of W
C a
nd W
HtR
and
bet
wee
n ra
ce-e
thni
city
gro
ups.
*Sig
nific
antly
diff
eren
t fro
m th
e co
rrel
atio
n co
effic
ient
bet
wee
n %
TFM
and
CV
D r
isk
fact
or o
f int
eres
t at α
= 0
.05
leve
l.† Si
gnifi
cant
ly d
iffer
ent f
rom
the
corr
elat
ion
coef
ficie
nt b
etw
een
%TF
M a
nd C
VD
ris
k fa
ctor
of i
nter
est, P
< 0
.000
195
(equ
ival
ent t
o P
< 0
.05
afte
r B
onfe
rron
i-co
rrec
tion)
.
IJBCR 11.3 & 4_inners_IJBCR 11.3 & 4_inners.qxd 02/01/2014 12:59 Page 90
Anthropometric indices as measures of body fat assessed by DXA 91
Table 5. P
artia
l Pea
rson
cor
rela
tions
of B
MI v
ersu
s %
FM a
nd F
MI t
o ni
ne C
VD
ris
k fa
ctor
s by
gen
der
and
age:
Nat
iona
l Hea
lth a
nd N
utrit
ion
Exam
inat
ion
Surv
ey 1
999-
2004
a, b
,
c .
Blood pressure
Fasting and nonfasting blood CVD risk factors
Fasting blood CVD risk factors
Gender, age group
nSBP
DBP
nTC
HDL-C
CRP
nTG
LDL-C
Glucose
Insulin
and total b
ody fat
(mmHg)
(mmHg)
(mg/dL)
(mg/dL)
(mg/dL)
(mg/dL)
(mg/dL)
(mg/dL)
(µU/mL)
Boy
s8
- 11
yea
rs%
FM68
30.
210.
1985
90.
14-0
.32
0.57
--
--
-FM
I (kg
/m2 )
683
0.27
0.19
859
0.13
-0.3
30.
58-
--
--
BM
I (kg
/m2 )
683
0.31
0.18
859
0.12
-0.3
20.
56-
--
--
12 -
19
year
s%
FM26
530.
10*
-0.0
230
690.
27-0
.32*
0.47
1370
0.36
0.28
0.13
0.56
*FM
I (kg
/m2 )
2653
0.15
*-0
.03
3069
0.26
-0.3
70.
5013
700.
380.
280.
140.
62B
MI (
kg/m
2 )26
530.
20-0
.03
3069
0.22
-0.3
80.
4813
700.
370.
260.
150.
64
Gir
ls8
- 11
yea
rs%
FM47
90.
160.
0359
90.
08-0
.37
0.56
--
--
FMI (
kg/m
2 )47
90.
200.
0359
90.
05-0
.40
0.57
--
--
BM
I (kg
/m2 )
479
0.23
0.02
599
0.02
-0.4
00.
53-
--
-12
- 1
9 ye
ars
%FM
1782
0.18
-0.0
120
220.
14-0
.22
0.47
857
0.17
0.14
0.05
0.48
FMI (
kg/m
2 )17
820.
20-0
.02
2022
0.11
-0.2
50.
5285
70.
170.
130.
060.
54B
MI (
kg/m
2 )17
820.
20-0
.03
2022
0.08
-0.2
60.
5285
70.
150.
110.
060.
54
a A
bbre
viat
ions
: %FM
for
perc
ent f
at m
ass,
FM
I for
fat m
ass
inde
x ca
lcul
ated
as
tota
l bod
y fa
t in
kg d
ivid
ed b
y th
e sq
uare
of h
eigh
t in
met
ers,
BM
I for
bod
y m
ass
inde
x ca
lcul
ated
as
body
wei
ght i
n kg
div
ided
by
the
squa
re o
f hei
ght i
n m
eter
s, C
VD
for
card
iova
scul
ar d
isea
se, S
BP
for
syst
olic
blo
od p
ress
ure,
DB
P fo
r di
asto
lic b
lood
pre
ssur
e, T
C fo
r to
tal c
hole
s-te
rol,
HD
L-C
for
high
-den
sity
lipo
prot
ein
chol
este
rol,
CR
P fo
r C
-rea
ctiv
e pr
otei
n, T
G fo
r tr
igly
ceri
des,
and
LD
L-C
for
low
-den
sity
lipo
prot
ein
chol
este
rol.
b A
ll va
riab
les
wer
e lo
g-tr
ansf
orm
ed e
xcep
t SB
P an
d D
BP.
Pea
rson
cor
rela
tion
coef
ficie
nts
wer
e ad
just
ed fo
r ag
e in
yea
rs a
nd r
ace-
ethn
icity
. Sur
vey
year
(199
9-20
02 a
nd 2
003-
2004
)w
as a
dditi
onal
ly a
djus
ted
for
in th
e co
rrel
atio
n an
alys
es r
egar
ding
fast
ing
insu
lin.
c W
ithin
eac
h ge
nder
-age
gro
up a
nd C
VD
ris
k fa
ctor
, cor
rela
tion
coef
ficie
nt o
f BM
I was
com
pare
d to
thos
e of
%FM
and
FM
I, re
spec
tivel
y. C
ompa
riso
ns w
ere
not m
ade
betw
een
cor-
rela
tion
coef
ficie
nts
of %
FM a
nd F
MI a
nd b
etw
een
gend
er-a
ge g
roup
s.*S
igni
fican
tly d
iffer
ent f
rom
the
corr
elat
ion
coef
ficie
nt b
etw
een
BM
I and
CV
D r
isk
fact
or o
f int
eres
t at α
= 0
.05
leve
l.† Si
gnifi
cant
ly d
iffer
ent f
rom
the
corr
elat
ion
coef
ficie
nt b
etw
een
BM
I and
CV
D r
isk
fact
or o
f int
eres
t, P
< 0
.000
195
(equ
ival
ent t
o P
< 0
.05
afte
r B
onfe
rron
i-co
rrec
tion)
.
IJBCR 11.3 & 4_inners_IJBCR 11.3 & 4_inners.qxd 02/01/2014 12:59 Page 91
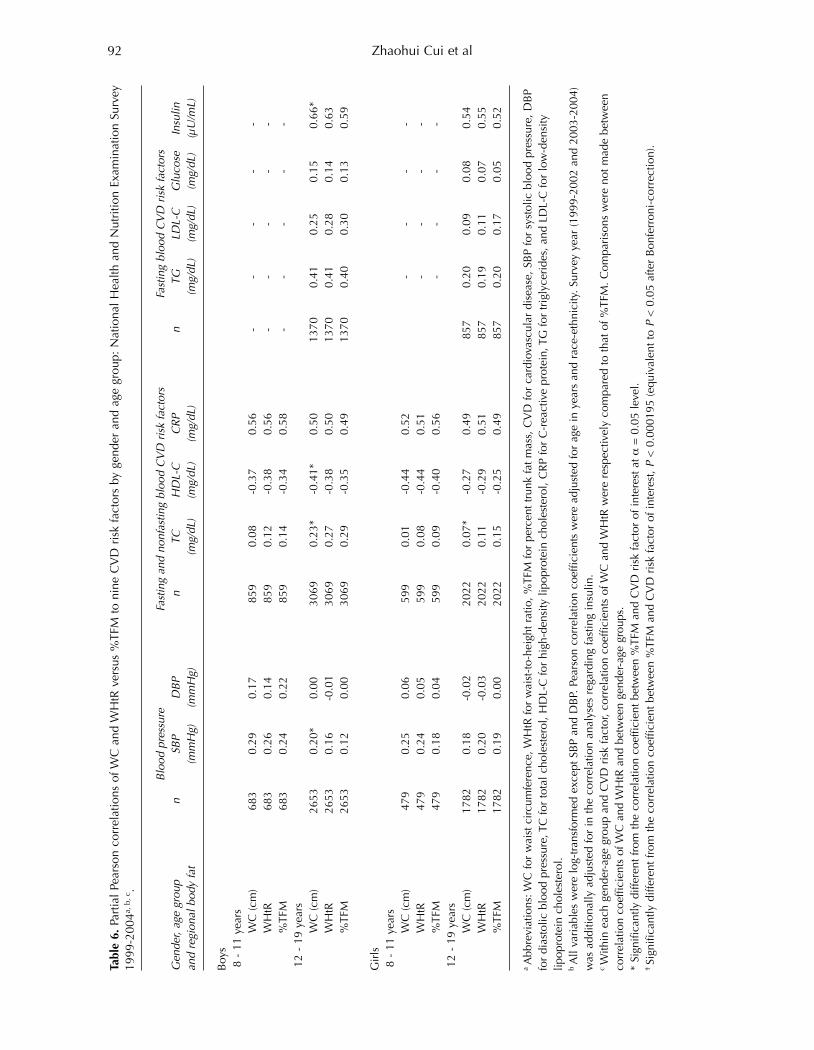
Zhaohui Cui et al92
Table 6. P
artia
l Pe
arso
n co
rrel
atio
ns o
f WC
and
WH
tR v
ersu
s %
TFM
to
nine
CV
D r
isk
fact
ors
by g
ende
r an
d ag
e gr
oup:
Nat
iona
l H
ealth
and
Nut
ritio
n Ex
amin
atio
n Su
rvey
1999
-200
4a, b
, c.
Blood pressure
Fasting and nonfasting blood CVD risk factors
Fasting blood CVD risk factors
Gender, age group
nSBP
DBP
nTC
HDL-C
CRP
nTG
LDL-C
Glucose
Insulin
and regional body fat
(mmHg)
(mmHg)
(mg/dL)
(mg/dL)
(mg/dL)
(mg/dL)
(mg/dL)
(mg/dL)
(µU/mL)
Boy
s8
- 11
yea
rsW
C (c
m)
683
0.29
0.17
859
0.08
-0.3
70.
56-
--
--
WH
tR68
30.
260.
1485
90.
12-0
.38
0.56
--
--
-%
TFM
683
0.24
0.22
859
0.14
-0.3
40.
58-
--
--
12 -
19
year
sW
C (c
m)
2653
0.20
*0.
0030
690.
23*
-0.4
1*0.
5013
700.
410.
250.
150.
66*
WH
tR26
530.
16-0
.01
3069
0.27
-0.3
80.
5013
700.
410.
280.
140.
63%
TFM
2653
0.12
0.00
3069
0.29
-0.3
50.
4913
700.
400.
300.
130.
59
Gir
ls8
- 11
yea
rsW
C (c
m)
479
0.25
0.06
599
0.01
-0.4
40.
52-
--
-W
HtR
479
0.24
0.05
599
0.08
-0.4
40.
51-
--
-%
TFM
479
0.18
0.04
599
0.09
-0.4
00.
56-
--
-12
- 1
9 ye
ars
WC
(cm
)17
820.
18-0
.02
2022
0.07
*-0
.27
0.49
857
0.20
0.09
0.08
0.54
WH
tR17
820.
20-0
.03
2022
0.11
-0.2
90.
5185
70.
190.
110.
070.
55%
TFM
1782
0.19
0.00
2022
0.15
-0.2
50.
4985
70.
200.
170.
050.
52
a A
bbre
viat
ions
: WC
for
wai
st c
ircu
mfe
renc
e, W
HtR
for
wai
st-t
o-he
ight
rat
io, %
TFM
for
perc
ent t
runk
fat m
ass,
CV
D fo
r ca
rdio
vasc
ular
dis
ease
, SB
P fo
r sy
stol
ic b
lood
pre
ssur
e, D
BP
for
dias
tolic
blo
od p
ress
ure,
TC
for
tota
l cho
lest
erol
, HD
L-C
for
high
-den
sity
lipo
prot
ein
chol
este
rol,
CR
P fo
r C
-rea
ctiv
e pr
otei
n, T
G fo
r tr
igly
ceri
des,
and
LD
L-C
for
low
-den
sity
lipop
rote
in c
hole
ster
ol.
b A
ll va
riab
les
wer
e lo
g-tr
ansf
orm
ed e
xcep
t SB
P an
d D
BP.
Pea
rson
cor
rela
tion
coef
ficie
nts
wer
e ad
just
ed fo
r ag
e in
yea
rs a
nd r
ace-
ethn
icity
. Sur
vey
year
(199
9-20
02 a
nd 2
003-
2004
)w
as a
dditi
onal
ly a
djus
ted
for
in th
e co
rrel
atio
n an
alys
es r
egar
ding
fast
ing
insu
lin.
c W
ithin
eac
h ge
nder
-age
gro
up a
nd C
VD
ris
k fa
ctor
, cor
rela
tion
coef
ficie
nts
of W
C a
nd W
HtR
wer
e re
spec
tivel
y co
mpa
red
to th
at o
f %TF
M. C
ompa
riso
ns w
ere
not m
ade
betw
een
corr
elat
ion
coef
ficie
nts
of W
C a
nd W
HtR
and
bet
wee
n ge
nder
-age
gro
ups.
* Si
gnifi
cant
ly d
iffer
ent f
rom
the
corr
elat
ion
coef
ficie
nt b
etw
een
%TF
M a
nd C
VD
ris
k fa
ctor
of i
nter
est a
t α=
0.0
5 le
vel.
† Si
gnifi
cant
ly d
iffer
ent f
rom
the
corr
elat
ion
coef
ficie
nt b
etw
een
%TF
M a
nd C
VD
ris
k fa
ctor
of i
nter
est, P
< 0
.000
195
(equ
ival
ent t
o P
< 0
.05
afte
r B
onfe
rron
i-co
rrec
tion)
.
IJBCR 11.3 & 4_inners_IJBCR 11.3 & 4_inners.qxd 02/01/2014 12:59 Page 92

0.34 vs. -0.25) than %FM. At the P < 0.05 level, BMIwas more strongly correlated with fasting insulinlevel (r: 0.59 vs. 0.51) but less strongly correlatedwith TC (r: 0.13 vs. 0.19) than %FM. Compared toFMI, BMI was more strongly correlated with SBP (r:0.22 vs. 0.17) and HDL-C (r: -0.34 vs. -0.31) but lessstrongly correlated with TC (r: 0.13 vs. 0.18). In thecomparisons of correlation of central fat variableswith cardiovascular risk factors (Table 4), WC wasmore strongly correlated with HDL-C (r: -0.37 vs. -0.30) but less strongly associated with TC (r: 0.12 vs.0.21) than %TFM. At P < 0.05 level, WC was morestrongly correlated with SBP (r: 0.22 vs. 0.15) andfasting insulin (r: 0.61 vs. 0.56) but less strongly cor-related to LDL-C (r: 0.18 vs. 0.25) than %TFM. WHtRwas more strongly correlated with SBP (r: 0.20 vs.0.15) and HDL-C (r: -0.35 vs. -0.30) than %TFM.Fewer significant differences were observed in the
race-ethnicity (i.e., Mexican American, non-HispanicWhite and Black) specific analyses than in all youthcombined analyses (Table 3 and Table 4). In thecomparisons of correlation of total body fat variableswith cardiovascular risk factors (Table 3), no signifi-cant differences were observed in each of the 3 race-ethnicities at the Bonferroni-corrected P level. At P <0.05 level, BMI was more strongly correlated withSBP and HDL-C in each of the 3 race-ethnicities.Furthermore, BMI was more strongly correlated withfasting insulin level in Mexican Americans (r: 0.62 vs.0.55) but less strongly correlated with TC in non-Hispanic Whites (r: 0.12 vs. 0.19) and Blacks (r: 0.08vs. 0.15) than %FM. In the comparisons of correlationof central fat variables with cardiovascular risk factors(Table 4), compared to %TFM, WC was more stronglycorrelated with SBP in Mexican American (r: 0.23 vs.0.16) and non-Hispanic Black (r: 0.21 vs. 0.13) youth,with HDL-C in non-Hispanic White (r: - 0.38 vs. -0.30) and Black (r: - 0.34 vs. – 0.27) youth but lessstrongly correlated with TC in non-Hispanic Whiteyouth (r: 0.11 vs. 0.21). Table 5 compares partial Pearson correlation coef-
ficients of total body fat variables (i.e., BMI vs. %FM,and BMI vs. FMI) with each of the nine cardiovascu-lar risk factors within gender- and age-specificgroups. No significant differences were observed atthe Bonferroni-corrected P level. At P < 0.05 level,significant differences were observed only in boysaged 12-19 years. Specifically, compared to %FM,BMI was more strongly correlated with SBP (r: 0.20vs. 0.10), HDL-C (r: -0.38 vs. -0.32) and fasting insulin(r: 0.64 vs. 0.56). Compared to FMI, BMI was morestrongly correlated with SBP (r: 0.20 vs 0.15). Similar patterns were seen in the comparison of the
correlations between central fat variables (i.e., WC vs.%TFM, and WHtR vs. %TFM) with cardiovascular riskfactors except for TC (Table 6). At the P < 0.05 level,WC was more strongly correlated with SBP (r: 0.20vs. 0.12), HDL-C (r: -0.41 vs. -0.35) and fasting insulin(r: 0.66 vs. 0.59) than %TFM in boys aged 12-19 yearsbut less strongly correlated with TC in youth aged 12-19 years across genders (r: 0.23 vs. 0.29 for boys and
0.07 vs. 0.15 for girls). No significant differences werefound between correlations of WHtR and %TFM tothe nine cardiovascular risk factors.
Discussion
We found that anthropometric (BMI) and DXA (%FMand FMI) measures of total body fat were stronglycorrelated, and were comparably associated with car-diovascular risk factors. Similar patterns wereobserved between anthropometric (WC and WHtR)and DXA (%TFM) measures of central fat. These rela-tionships were largely consistent across different age,gender and race-ethnicity groups.Our study confirms the strong correlations between
BMI and DXA-assessed %FM observed in previous,more limited studies of children and adolescents [2-8, 28], and adds to the growing evidence that BMIcan accurately distinguish lean individuals from thosewith higher body fat at the population level. Ourstudy is also consistent with previous studies thatfound that BMI was significantly correlated with car-diovascular risk factors in children and adolescents,and that these correlations were at least as strong asthe correlations between DXA-assessed %FM and car-diovascular risk factors in this age group [5-7, 9, 11]. We found that BMI and FMI were highly correlated
(r: 0.94-0.97), and that both BMI and FMI were simi-larly correlated with cardiovascular risk factors. Thisis consistent with a study in children in New Zealandwhich showed that addition of BMI into a basemodel including age, gender and ethnicity addition-ally explained similar proportions of variance in TCand HDL-C compared to addition of FMI into themodel [29]. However, in this study body fat wasassessed using bioimpedence analysis, which is asso-ciated with larger error than methods such as DXA[30].Since DXA cannot distinguish visceral fat from
abdominal subcutaneous fat, we could not examinethe validity of WC and WHtR in assessing distributionof fat between these compartments. However, DXA-assessed trunk FM has been shown to be stronglycorrelated with visceral abdominal tissue (r = 0.87)and subcutaneous abdominal adiposity tissue (r =0.96) assessed by CT in children [31]. The correlationbetween %TFM and WC in our study was similar tocorrelations between MRI- or CT-assessed visceralabdominal tissue and WC (r: 0.8 to 0.9) found in pre-vious studies [31-33]. No study has evaluated thevalidity of WC and WHtR as an indicator of central fatin relation to cardiovascular risk factors in youthcompared to MRI- or CT-measured central fat. Withbody fat measured by DXA, one study reported trunkFM, WC and WHtR were similarly correlated to bloodcholesterols in Portuguese children 10 to 15 years old[9]. This is consistent with our study, where the comparable correlations between WC and WHtR withcardiovascular risk factors suggest that WHtR was notsuperior to WC in relation to cardiovascular risk factors.This indicates that adjustment for height contributes
Anthropometric indices as measures of body fat assessed by DXA 93
IJBCR 11.3 & 4_inners_IJBCR 11.3 & 4_inners.qxd 02/01/2014 12:59 Page 93

little to the ability of WC to discriminate individualswith different levels of cardiovascular risk [34], andargues for the use of WC, which is a simpler indicatorof central fat than WHtR, in population-based studies.The only other study that used NHANES partici-
pants to examine the validity of anthropometricindices of body fat against DXA-assessed body fat inrelation to cardiovascular risk factors focused onadults [12]. Comparing their results with those shownhere in youth, the magnitudes of correlationsbetween body fat variables and cardiovascular riskfactors are similar [12]. It is notable that correlationsbetween body fat and cardiovascular risk factorswere weak to modest (the maximum correlationcoefficient is 0.66), suggesting that cardiovascular riskfactors are determined by other factors in addition tobody fat. For studies that aim to accurately predictlevels of cardiovascular risk factors or to screen thosewith abnormal levels of cardiovascular risk factors,other factors influencing cardiovascular risk shouldbe considered. A strength of our analysis include the large size and
the nationally representative nature of our sample. Toour knowledge, this is the first study to evaluate thevalidity of anthropometric measures of body fat asindicators of body fat and their correlations with cardiovascular risk factors in a large-scale nationallyrepresentative sample of American children and adolescents. Nevertheless, the cross-sectional natureof this work is a weakness. A recent study of over5,000 youth conducted in the United Kingdomreported that changes in z-scores of BMI, WC and FM(by DXA) from 9-12 years to 15-16 years were simi-larly associated with cardiovascular risk factors at 15-16 years of age [35]. Thus, that longitudinal work isconsistent with the cross-sectional analyses presentedhere. Another weakness of this work was that we assessed
trunk fat rather than directly measured visceral fat.Also, DXA data were imputed using multiple imputa-tion methods for 8.6% of participants. We could notexamine waist-to-hip ratio because hip circumferencewas not collected in NHANES 1999-2004. Finally, wecould not evaluate relations with metabolic syndromebecause of the lack of a well-accepted definition ofmetabolic syndrome in children and adolescents. The feasibility and reproducibility of measurement
of height and weight are generally high. Although theaccurate measurement of WC is more challenging [36]especially in those who are morbidly obese, carefulquality control can reduce measurement error. Thisstudy supports the continued use of BMI and WC assurrogates for body fat in cross-sectional epidemio-logic studies that aim to investigate the association ofexcess body fat with cardiovascular risk factors inchildren and adolescents.
Acknowledgement – The project described was sup-ported by Award Number 1U01HL103561 from theNational Heart, Lung, And Blood Institute, the EuniceKennedy Shriver National Institute of Child Health
and Development and the Office of Behavioral andSocial Sciences Research. The content is solely theresponsibility of the authors and does not necessarilyrepresent the official views of the National Heart,Lung, and Blood Institute or the National Institutes ofHealth.
Conflict of interest – The authors have no disclosureto make.
References
1. Ogden CL, Carroll MD, Kit BK, et al. Prevalence ofobesity and trends in body mass index among US chil-dren and adolescents, 1999-2010. JAMA 2012; 307: 483-490.
2. Pietrobelli A, Faith MS, Allison DB, et al. Body massindex as a measure of adiposity among children andadolescents: a validation study. J Pediatr 1998; 132:204-210.
3. Dencker M, Thorsson O, Linden C, et al. BMI andobjectively measured body fat and body fat distributionin prepubertal children. Clin Physiol Funct Imaging2007; 27: 12-16.
4. Goran MI, Driscoll P, Johnson R, Nagy TR, Hunter G.Cross-calibration of body-composition techniquesagainst dual-energy X-ray absorptiometry in youngchildren. Am J Clin Nutr 1996; 63: 299-305.
5. Lindsay RS, Hanson RL, Roumain J, et al. Body massindex as a measure of adiposity in children and ado-lescents: relationship to adiposity by dual energy x-rayabsorptiometry and to cardiovascular risk factors. J ClinEndocrinol Metab 2001; 86: 4061-4067.
6. Steinberger J, Jacobs DR, Raatz S,et al. Comparison ofbody fatness measurements by BMI and skinfolds vsdual energy X-ray absorptiometry and their relation tocardiovascular risk factors in adolescents. Int J Obes(Lond) 2005; 29: 1346-1352.
7. Falaschetti E, Hingorani AD, Jones A, et al. Adiposityand cardiovascular risk factors in a large contemporarypopulation of pre-pubertal children. Eur Heart J 2010;31: 3063-3072.
8. Goulding A, Gold E, Cannan R, et al. DEXA supportsthe use of BMI as a measure of fatness in young girls.Int J Obes Relat Metab Disord 1996; 20: 1014-1021.
9. Teixeira PJ, Sardinha LB, Going SB, et al. Total andregional fat and serum cardiovascular disease risk fac-tors in lean and obese children and adolescents. ObesRes 2001; 9: 432-442.
10. Daniels SR, Morrison JA, Sprecher DL, et al.Association of body fat distribution and cardiovascularrisk factors in children and adolescents. Circulation1999; 99: 541-545.
11. Parrett AL, Valentine RJ, Arngrimsson SA, et al.Adiposity and aerobic fitness are associated with meta-bolic disease risk in children. Appl Physiol Nutr Metab2011; 36: 72-79.
12. Sun Q, van Dam RM, Spiegelman D, et al. Comparisonof dual-energy x-ray absorptiometric and anthropomet-ric measures of adiposity in relation to adiposity-relat-ed biologic factors. Am J Epidemiol 2010; 172: 1442-1454.
13. Maynard LM, Wisemandle W, Roche AF, et al.Childhood body composition in relation to body massindex. Pediatrics 2001; 107: 344-350.
14. Lamb MM, Ogden CL, Carroll MD, et al. Association of
Zhaohui Cui et al94
IJBCR 11.3 & 4_inners_IJBCR 11.3 & 4_inners.qxd 02/01/2014 12:59 Page 94

body fat percentage with lipid concentrations in chil-dren and adolescents: United States, 1999-2004. Am JClin Nutr 2011; 94: 877-883.
15. National Center for Health Statistics. National Healthand Nutrition Examination Survey. Available from:http://www.cdc.gov/nchs/nhanes/nhanes_question-naires.htm (accessed 4 June 2012).
16. Lohman TG, Roche AF, Martorell R. Anthropometricstandardization reference manual, Champaign, Illinois:Human Kinetics Books, 1988.
17. Centers for Disease Control and Prevention. PercentileData Files with LMS Values. Available from:http://www.cdc.gov/growthcharts/percentile_data_files.htm (accessed 4 June 2012).
18. Rubin DB. Multiple imputation for nonresponse in sur-veys. Hoboken, NJ: Wiley Classics Library, 2004.
19. Raghunathan TE, Lepkowski JM, Van Hoewyk J, et al.A multivariate technique for multiply imputing missingvalues using a sequence of regression models. SurvMethodol 2001; 27: 85-95.
20. National Center for Health Statistics. National Healthand Nutrition Examination Survey: technical documen-tation for the 1999-2004 dual energy X-ray absorptiom-etry (DXA) multiple imputation data files. Availablefrom http://www.cdc.gov/nchs/data/nhanes/dxa/dxa_techdoc.pdf (cited September 25, 2012).
21. Perloff D, Grim C, Flack J, et al. Human blood pressuredetermination by sphygmomanometry. Circulation1993; 88: 2460-2470.
22. National Center for Health Statistics. National Healthand Nutrition Examination Survey. Available fromhttp://www.cdc.gov/nchs/nhanes/nhanes2003-2004/l13_c.htm (cited September 25, 2012).
23. Friedewald WT, Levy RI, Fredrickson DS. Estimation ofthe concentration of low-density lipoprotein choles-terol in plasma, without use of the preparative ultra-centrifuge. Clin Chem 1972; 18: 499-502.
24. National Center for Health Statistics. National Healthand Nutrition Examination Survey: C-reactive protein.Available from http://www.cdc.gov/nchs/nhanes/nhanes1999-2000/LAB11.htm (cited September 25,2012).
25. National Center for Health Statistics. National Healthand Nutrition Examination Survey. Available fromhttp://www.cdc.gov/nchs/nhanes/nhanes2003-2004/lab_methods_03_04.htm (accessed 25 September2012).
26. National Center for Health Statistics. National Healthand Nutrition Examination Survey. Available fromhttp://www.cdc.gov/nchs/nhanes/nhanes2003-2004/L10AM_C.htm (cited September 25, 2012).
27. Rosner B. Regression and correlation methods. In:Rosner B (ed). Fundmentals of Biostatistics. 6th.Duxbury Press: Pacific Grove, CA, 2006, pp. 464-556.
28. Daniels SR, Khoury PR, Morrison JA. The utility ofbody mass index as a measure of body fatness in chil-dren and adolescents: differences by race and gender.Pediatrics 1997; 99: 804-807.
29. Rush EC, Scragg R, Schaaf D, et al. Indices of fatnessand relationships with age, ethnicity and lipids in NewZealand European, Maori and Pacific children. Eur JClin Nutr 2009; 63: 627-633.
30. Lee SY, Gallagher D. Assessment methods in humanbody composition. Curr Opin Clin Nutr Metab Care2008; 11: 566-572.
31. Goran MI, Gower BA, Treuth M, et al. Prediction ofintra-abdominal and subcutaneous abdominal adiposetissue in healthy pre-pubertal children. Int J Obes RelatMetab Disord 1998; 22: 549-558.
32. Harrington DM, Staiano AE, Broyles ST, et al. Waist cir-cumference measurement site does not affect relation-ships with visceral adiposity and cardiometabolic riskfactors in children. Pediatr Obes 2012; 8: 199-206..
33. Brambilla P, Bedogni G, Moreno LA, et al.Crossvalidation of anthropometry against magnetic res-onance imaging for the assessment of visceral and sub-cutaneous adipose tissue in children. Int J Obes (Lond)2006; 30: 23-30.
34. Kawada T. Waist-height ratio, indicator of central obe-sity, is strongly related to waist circumference but thereis poor additional information regarding waist circum-ference. Circ J 2010; 74: 2501.
35. Lawlor DA, Benfield L, Logue J, et al. Associationbetween general and central adiposity in childhood,and change in these, with cardiovascular risk factors inadolescence: prospective cohort study. BMJ 2010; 341:c6224.
36. Ulijaszek SJ, Kerr DA. Anthropometric measurementerror and the assessment of nutritional status. Br J Nutr1999; 82: 165-177.
Anthropometric indices as measures of body fat assessed by DXA 95
IJBCR 11.3 & 4_inners_IJBCR 11.3 & 4_inners.qxd 02/01/2014 12:59 Page 95

96
IJBCR 11.3 & 4_inners_IJBCR 11.3 & 4_inners.qxd 02/01/2014 12:59 Page 96

Introduction
Originally developed as a means to assess bone min-eral density (BMD), Dual energy x-ray absorptiometry(DXA) is the gold standard for clinical assessment ofosteoporosis [1]. The dual comparison of bone andsoft tissue has also allowed DXA to be used as validand convenient means for assessing body composi-tion in a variety of populations [2]. While it has yet tobe validated in persons with spinal cord injury (SCI)as a body composition assessment tool, it is frequentlyused in many studies specific to this population andby many clinicians due to its apparent reliability,noninvasive design, and speed [3-5]. DXA is particu-larly useful in the long-term evaluation and treatmentof two significant problems among persons withspinal cord injury: the loss of bone and muscle mass
and the extensive increase in body fat followinginjury. The osteopenia seen in SCI is largely relatedto the loss of mechanical stress placed on the bonesand hormonal changes due to variations in parathy-roid hormone levels over time after SCI [6], ultimatelyresulting in bone resorption that often plateaus nearfracture level [7], leaving nearly 1 in 20 persons withSCI to eventually experience a fracture during theirlifetime. Therefore, longitudinal reassessment shouldbe an important component in long-term health careamong SCI populations.
International Journal of Body Composition Research 2013 Vol. 11 No. 3 & 4: 97–104. © Smith-Gordon ISSN 1479-456X
Submitted 19 August 2013 accepted 29 September 2013
Comparison between prone and supine DXA measurements in men with chronic spinal cord injury
Christopher R Harnish2, Jonathan A Daniels1, Roy T Sabo3 and Timothy Lavis1
1Hunter Holmes McGuire VAMC, Spinal Cord Injury & DisordersRichmond, Virginia; 2Department of Health & Human Performance,
Virginia Commonwealth University, Richmond, Virginia; 3Department ofBiostatistics, Virginia Commonwealth University, Richmond, Virginia, USA.
Objective: DXA is a reliable tool for bone assessment and body composition analysis in persons withspinal cord injury (SCI); however, specific SCI related limitations may prevent the use of the supine DXAposition, necessitating a prone position. Thus, the purpose of this study was to compare DXA scans in thesupine and prone positions among spinal cord injured men. Research Methods and Procedures: Forty T1-L5 ASIA A through D spinal cord injured men performed twosequential DXA tests, first in the supine, then in the prone position. Positional differences were assessedusing dependent two-sample t-tests. Pearson correlation coefficients were also calculated for each bodycomposition measurement in all patients. Results: With the exception of bone mineral content (BMC) and fat-free mass (FFM), prone measures weresignificantly lower (P < 0.05) than the same supine measures. There was a close relationship for DXA meas-urement variables, including significant positive correlations between fat mass (FM) and bone mineral density(P < 0.05), and both FM and FFM with BMC (P < 0.001). Significant correlations were seen between BMIand %BF for subjects measured in both prone position (r = 0.64, P < 0.0001) and supine position (r = 0.58,P = 0.0001). BMD (- 4.2%), FM (- 3.0%), and % Body Fat (- 3.1%) were lower, while T-score was 214.8%higher.Discussion:These data indicate that DXA measures are significantly lower in the prone position; however, therelationship between variables for either measure is maintained. Therefore, clinicians may use either theprone or supine position for longitudinal DXA testing, but should not alternate between the two.
Keywords: body composition, BMC, body fat
Abbreviations: SCI: spinal cord injury; DXA: dual x-ray absorptiometry; BMD: bone mineral density; BMC:bone mineral content; FM: fat mass; ROI: region of interest; MC: motor complete spinal cord injury; MI:motor incomplete spinal cord injury; FFM: fat free mass; BMI: body mass index
Address for correspondence: Chris Harnish, Dept. of Health andHuman Performance, 500 Academic Center, 1020 West Grace St.,Richmond, VA 23284, USA.Tel: 1-800-828-1120; Fax: 804.828.1946Email: [email protected] 804.828.1948
IJBCR 11.3 & 4_inners_IJBCR 11.3 & 4_inners.qxd 02/01/2014 12:59 Page 97
The use of DXA for body composition in SCI isequally valuable as its use in bone assessment.Persons with SCI experience a high prevalence ofobesity [5, 8-10], disordered carbohydrate metabolism[5, 11-14], hypertension [5, 11, 14], and, ultimately,cardiovascular disease [5, 14-16]. Given these compli-cations and DXA’s proficiency in tracking body fatchanges [17], such measures are invaluable for com-prehensive clinical assessments in this population.Due to design of the scanning beam and the potentialfor geometric distortion in measurement and analysisproper patient placement is essential for achievingaccurate measurements [18, 19]. However, in a numberof populations, including SCI, there are limitations ordisabilities that prevent measurement in the standardsupine position [18, 19]. For example, frontal planemuscle spasticity among SCI can limit or even preventone from achieving a fully supine position [20, 21],making prone positioning a useful option.Additionally, due to the prevalence of pressure ulcersin persons with SCI, the ability to scan in a supineposition could be potentially harmful, creating undueor unsustainable pressure on healing wounds oruntreated breakdowns, or increasing the risk of posi-tion dependent bouts of autonomic dysreflexia. Earlier work on altering DXA positioning in other
populations has shown mixed results. Lambrinoudakiet al. [2] has shown that prone positioning had smallbut significant reduction on bone mineral content(BMC) and fat mass (FM) and significantly increasedlean mass among healthy adults. Similar findingswere seen among children [18] and were further sup-ported by Lohman et al. [22], who also showed smallvariations in results from a DXA scan in the proneposition. Unfortunately, none of the studies offerguidance on longitudinal use of either position in aparticular population. While absolute results fromprone positions may differ from those gathered in asupine position, the relationships between variablesmay be similar, allowing for consistent, longitudinalbody composition and bone health tracking for anindividual. Given the potential for confounding vari-ables that would otherwise make standard supinescans impossible, there exists a potential need forprone positioning, thereby necessitating a comparisonof supine and prone DXA scans in an SCI population.In that spirit, the purpose of this study was to compareDXA scans in the supine and prone positions amongmen with spinal cord injuries.
Research methods and procedures
Subjects Forty male veterans with SCI were recruited from theoutpatient population at the Hunter Homes McGuireVAMC, aged between 18-65 years of age (mean age49.4 ± 10.9 years) with a T1-L5 spinal cord injury inexcess of 1 year post injury that were not undergoingtreatment for osteopenia/osteoporosis. Individuals witha sacral wound beyond grade II were not qualified toparticipate in the study. Each subject provided their
informed consent prior to participation, and the studywas approved by the McGuire VAMC institutionalreview board. Each participant was randomized intotwo groups based upon the initial position in whichthey would be scanned (prone or supine). The partic-ipants were scanned with a Lunar Prodigy Advancedensitometer (GE Lunar, Madison WI) utilizing a con-stant potential source at 76 kV105 and narrow fanbeam setting, delivering approximately 0.3 µSv of radi-ation over the course of a total body scan that lastedabout 8 minutes per scan. The body tissue would atten-uate the electromagnetic beam in ways unique to thetissue being scanned. Through the use of the unit’s twofrequencies, the resulting attenuation ratio determinesquantities of fat tissue, fat free tissue, and bone. Theattenuation ratio of the two forms of transmitted radia-tion is linearly related to the body’s distribution of fatfree and fat mass as well as the presence of bone [2].The Lunar Prodigy software (v13.4) provided analysisand interpretation of the participant’s fat free mass, fatmass, lean tissue, bone mineral content, and bone areathrough direct measurements and allowed for accuratequantification of each by volume and mass. After testing in the initial position, the participant was
turned and rescanned, with efforts made to ensure theparticipant was in proper scanning position, as pre-scribed by the Lunar Prodigy owner’s manual, and withtheir chin facing their right shoulder. In both prone andsupine positions, Velcro straps were placed around theparticipant’s ankles and knees to control any inadver-tent motion in their legs and retain proper placementwithin the scanning field. During assessment, attentionwas made to ensure the proper regions of interest(ROI) were set and the boundaries of the participants’body regions properly established, manually adjustingthe ROI if needed and ensuring that any implanteddevices, spinal fusion rods, or other indwelling objectwas identified as a foreign object and not consideredfor densitometry or body composition assessment inaccordance to instructions in the DXA user’s manual.All scans were performed by a trained and experiencedtechnologist and calibration of the scanner was doneeach day within 1 hour of the prescribed testing peri-od. Fat-free mass (FFM) = body mass – fat mass (FM);lean tissue = bone mineral content (BMC) + lean softtissue.
Statistical analysis Data are summarized with means and standarderrors. Differences between prone and supine bodycomposition measurements were assessed usingdependent two-sample t-tests, with such tests beingconducted separately for motor complete patients,motor incomplete patients, and all patients. Pearsoncorrelation coefficients were also calculated (sepa-rately for prone and supine positions) between allbody composition measurements in all patients.Body composition measurements consisted of bonemineral density, bone mineral content, t-score, fatmass, fat free mass, and % body fat. Comparisons ofcorrelations between motor complete and motor
Christopher R Harnish et al98
IJBCR 11.3 & 4_inners_IJBCR 11.3 & 4_inners.qxd 02/01/2014 12:59 Page 98

incomplete subjects were made using Fisher’s z-transformation [23]. The resulting P-values from allstatistical tests and estimated correlations are com-pared to a significance level of a = 0.05. All analyseswere conducted using the JMP statistical software(version 10.1, Cary, North Carolina, U.S.A.).
Results
A total of forty SCI men from thoracic level 1 to lum-bar 5 took part in this study, with 27 being classifiedas motor complete (MC), and 13 as motor incomplete(MI). MC participants on average were 47.8 ± 2.2 yrof age, 83.1 ± 3.5 kg, 177 ± 1.3 cm tall with a BMI of
26.6 + 1.1, while MI participants on average were52.2 ± 3.0 yr, 97.5 ± 4.9 kg, 178 ± 1.8 cm tall with aBMI 31.0 + 1.6. MI participants had significantly highermass (P = 0.0213) and BMI (P = 0.0279) than MC par-ticipants, which is likely accounted for by a signifi-cantly higher (P = 0.0003) FFM; MI 64.10 + 2.90 kgvs. MC 49.98 + 1.63 kg. The effect of position on DXAdata was analyzed for MC and MI combined, as well asindividually, and are summarized in Tables 1a and 1b. When MI and MC were assessed together, all
measures, except BMC and FFM, that were taken inthe prone position were significantly different thanthe same supine measures (1a), and these differenceswere maintained when separated by motor function.
Comparison between prone and supine DXA measurements in men with chronic spinal cord injury 99
Tables 1a & 1b. Summary of DXA data for the prone and supine position in spinal cord injured (SCI) men. Data in 1a com-pare prone vs supine among motor complete (n=27) and incomplete (n=13), and combined SCI groups, data in 1b com-pare motor complete vs incomplete SCI for prone or supine positions.
A) Motor Complete Motor Incomplete CombinedProne (SE) Supine (SE) P value Prone (SE) Supine (SE) P value Prone (SE) Supine (SE) P value
Bone Mineral 1.11 1.15 <0.001 1.24 1.29 <0.001 1.15 1.20 <0.001Density (g/cm3) (0.02) (0.02) (0.03) (0.03) (0.02) (0.02)
Bone Mineral 3.10 3.15 0.061 3.62 3.64 0.687 3.27 3.31 0.089Content (kg) (1.06) (1.06) (1.36) (1.36) (9.20) (9.20)
T-Score -1.34 -0.82 <0.001 0.06 0.88 <0.001 -0.85 -0.27 <0.001(0.25) (0.25) (0.39) (0.39) (0.25) (0.25)
Fat Mass (kg) 29.88 30.92 <0.001 31.08 32.60 0.013 30.51 31.44 <0.001(2.34) (2.34) (3.06) (3.06) (1.85) (1.85)
Fat Free Mass (kg) 52.50 49.98 0.132 64.57 64.10 0.181 56.48 54.63 0.101(1.63) (1.63) (2.90) (2.90) (1.71) (1.71)
% Body Fat 36.24 37.59 <0.001 33.44 34.18 0.098 35.43 36.55 <0.001(1.58) (1.58) (2.53) (2.53) (1.35) (1.35)
B) Prone SupineComplete (SE) Incomplete (SE) P value Complete (SE) Incomplete (SE) P value
Bone Mineral 1.11 1.24 0.002 1.15 1.29 0.002Density (g/cm3) (0.02) (0.03) (0.02) (0.03)
Bone Mineral 3.10 3.62 0.016 3.15 3.64 0.012Content (kg) (1.06) (1.36) (1.06) (1.36)
T-Score -1.34 0.06 0.002 -0.82 0.88 0.002(0.25) (0.39) (0.25) (0.39)
Fat Mass (kg) 29.88 31.08 0.634 30.92 32.60 0.573(2.34) (3.06) (2.34) (3.06)
Fat Free Mass (kg) 52.50 64.57 0.002 49.98 64.10 0.001(1.63) (2.90) (1.63) (2.90)
% Body Fat 36.24 33.44 0.305 37.59 34.18 0.209(1.58) (2.53) (1.58) (2.53)
* body composition measurements were assessed using dependent two-sample t-tests.
IJBCR 11.3 & 4_inners_IJBCR 11.3 & 4_inners.qxd 02/01/2014 12:59 Page 99

Christopher R Harnish et al100
Table 2. Correlation matrix summarizing the relationships in DXA data for prone and supine measurements in spinal cordinjured men.
Prone (Pearson Correlation Coefficient)
Age BMD BMC T-score FM FFM
BMD -0.04(P = 0.8170)
BMC -0.18 0.83(P = 0.2759) (P < 0.0001)
T-score -0.04 0.99 0.83(P = 0.8149) (P < 0.0001) (P < 0.0001)
FM -0.11 0.33 0.51 0.33(P = 0.4902) (P = 0.0353) (P = 0.0007) (P = 0.0382)
FFM 0.01 0.64 0.75 0.64 0.34(P = 0.9892) (P < 0.0001) (P < 0.0001) (P < 0.0001) (P = 0.0301)
% Fat -0.10 0.08 0.18 0.07 0.87 -0.12(P = 0.5278) (P = 0.6353) (P = 0.2584) P = 0.6501) (P < 0.0001) (P = 0.4580)
Supine (Pearson Correlation Coefficient)
Age BMD BMC T-score FM FFM
BMD -0.05(P = 0.7740)
BMC -0.19 0.87(P = 0.2368) (P < 0.0001)
T-score -0.05 0.99 0.87(P = 0.7742) (P < 0.0001) (P < 0.0001)
FM -0.13 0.36 0.52 0.36(P = 0.4156) (P = 0.0234) (P = 0.0005) (P = 0.0216)
FFM 0.14 0.50 0.58 0.51 0.20(P = 0.3911) (P = 0.0009) (P < 0.0001) (P = 0.0009) (P = 0.2164)
% Fat -0.13 0.07 0.17 0.07 0.86 -0.20(P = 0.4412) (P = 0.6780) (P = 0.2805) (P = 0.6571) (P < 0.0001) (P = 0.2078)
Table 3. Comparisons of Body Mass Means (overall).
Body Mass Mean SD 95% CI
DXA 88.2 18.6 82.3, 94.2Supine 86.1 19.6 79.8, 92.3Prone 87.0 18.4 81.1, 92.9
Difference SD 95% CI P-value
Actual – Supine 2.1 7.1 -0.1, 4.4 0.064Actual – Prone 1.2 2.2 0.5, 1.9 0.001
IJBCR 11.3 & 4_inners_IJBCR 11.3 & 4_inners.qxd 02/01/2014 12:59 Page 100
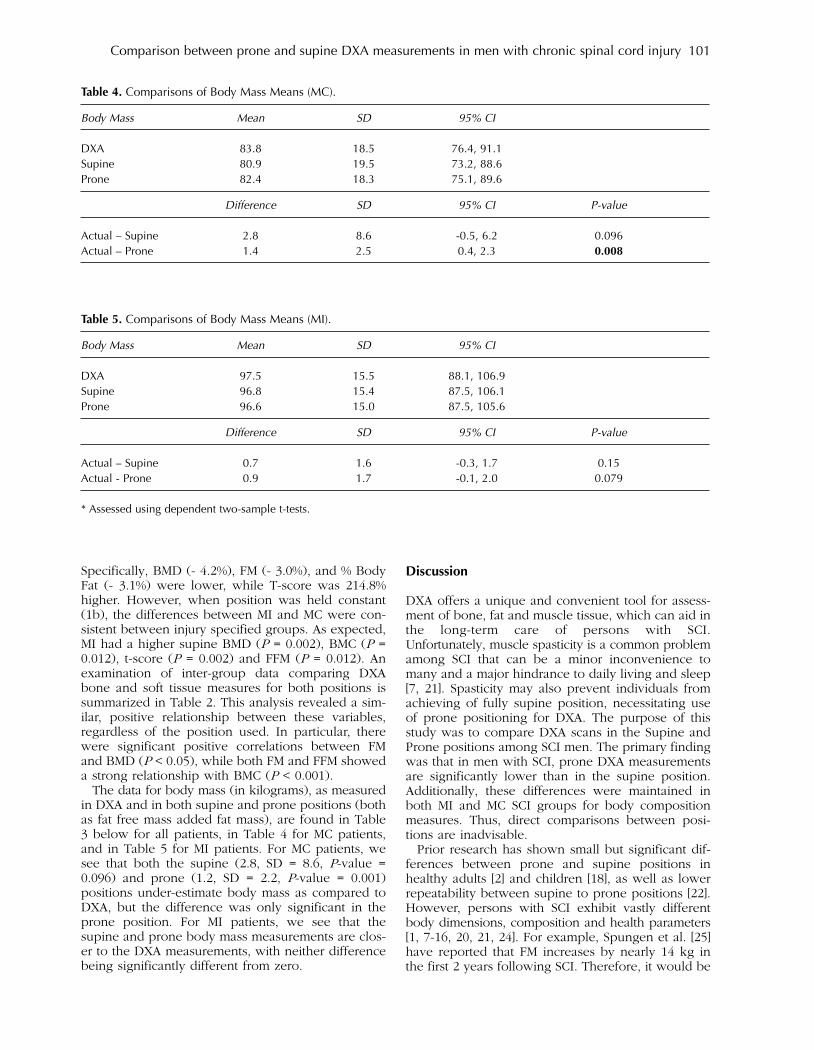
Specifically, BMD (- 4.2%), FM (- 3.0%), and % BodyFat (- 3.1%) were lower, while T-score was 214.8%higher. However, when position was held constant(1b), the differences between MI and MC were con-sistent between injury specified groups. As expected,MI had a higher supine BMD (P = 0.002), BMC (P =0.012), t-score (P = 0.002) and FFM (P = 0.012). Anexamination of inter-group data comparing DXAbone and soft tissue measures for both positions issummarized in Table 2. This analysis revealed a sim-ilar, positive relationship between these variables,regardless of the position used. In particular, therewere significant positive correlations between FMand BMD (P < 0.05), while both FM and FFM showeda strong relationship with BMC (P < 0.001). The data for body mass (in kilograms), as measured
in DXA and in both supine and prone positions (bothas fat free mass added fat mass), are found in Table3 below for all patients, in Table 4 for MC patients,and in Table 5 for MI patients. For MC patients, wesee that both the supine (2.8, SD = 8.6, P-value =0.096) and prone (1.2, SD = 2.2, P-value = 0.001)positions under-estimate body mass as compared toDXA, but the difference was only significant in theprone position. For MI patients, we see that thesupine and prone body mass measurements are clos-er to the DXA measurements, with neither differencebeing significantly different from zero.
Discussion
DXA offers a unique and convenient tool for assess-ment of bone, fat and muscle tissue, which can aid inthe long-term care of persons with SCI.Unfortunately, muscle spasticity is a common problemamong SCI that can be a minor inconvenience tomany and a major hindrance to daily living and sleep[7, 21]. Spasticity may also prevent individuals fromachieving of fully supine position, necessitating useof prone positioning for DXA. The purpose of thisstudy was to compare DXA scans in the Supine andProne positions among SCI men. The primary findingwas that in men with SCI, prone DXA measurementsare significantly lower than in the supine position.Additionally, these differences were maintained inboth MI and MC SCI groups for body compositionmeasures. Thus, direct comparisons between posi-tions are inadvisable. Prior research has shown small but significant dif-
ferences between prone and supine positions inhealthy adults [2] and children [18], as well as lowerrepeatability between supine to prone positions [22].However, persons with SCI exhibit vastly differentbody dimensions, composition and health parameters[1, 7-16, 20, 21, 24]. For example, Spungen et al. [25]have reported that FM increases by nearly 14 kg inthe first 2 years following SCI. Therefore, it would be
Comparison between prone and supine DXA measurements in men with chronic spinal cord injury 101
Table 4. Comparisons of Body Mass Means (MC).
Body Mass Mean SD 95% CI
DXA 83.8 18.5 76.4, 91.1Supine 80.9 19.5 73.2, 88.6Prone 82.4 18.3 75.1, 89.6
Difference SD 95% CI P-value
Actual – Supine 2.8 8.6 -0.5, 6.2 0.096Actual – Prone 1.4 2.5 0.4, 2.3 0.008
Table 5. Comparisons of Body Mass Means (MI).
Body Mass Mean SD 95% CI
DXA 97.5 15.5 88.1, 106.9Supine 96.8 15.4 87.5, 106.1Prone 96.6 15.0 87.5, 105.6
Difference SD 95% CI P-value
Actual – Supine 0.7 1.6 -0.3, 1.7 0.15Actual - Prone 0.9 1.7 -0.1, 2.0 0.079
* Assessed using dependent two-sample t-tests.
IJBCR 11.3 & 4_inners_IJBCR 11.3 & 4_inners.qxd 02/01/2014 12:59 Page 101

impossible to draw comparisons from these earlierstudies. Nonetheless, our data support the notion thatthere are significant differences between the supineand prone positions. Our findings indicate that in alongitudinal evaluation of body composition or bodydensity, alternating from supine to prone positionswill overestimate or underestimate (depending ontest order) any decreases in BMD, FM and %Fat, andincreases in FFM. In light of this, clinicians are stronglyadvised to use a single position for longitudinal meas-ures of SCI persons. Despite these differences, wefound a tight relationship between the two positions. We believe this is the first positional study to
examine the effect that position has on the inherentrelationships between various DXA measures in theSCI population. While alternating between positionsis not recommended, correlation analysis (Table 2)supports the consistent use of either position,because of the strong positive relationship betweenvariables. Regardless of position, correlation coeffi-cients between soft tissue (FM or FFM, with bone –BMC and BMD) were similar and significant (P <0.01). This is a principal finding because longitudinalbody composition assessment is important to moni-tor after SCI due to the pronounced changes thatoccur [1, 3, 4, 7, 8, 25, 26]. Muscle paralysis followingSCI contributes to a significant loss of bone due to awithdrawal of external forces on bone, which minimizebone resorption [27], while disruption of parathor-mone, Vitamin D and calcitonin levels contribute toresorption [28]. Taken together, most SCI can expectlower extremity BMD to stabilize more than 30%below normal [26] Thus, understanding factorsimportant for bone preservation and restoration arecritical in preventing fractures in this population.Additionally, convenient measures like body massindex (BMI) grossly underestimate overweight andobesity in SCI [3-5,10,24], necessitating other meas-ures for body fat and muscle tissue assessment. Although it has yet to be validated as a standard in
spinal cord injured populations, DXA is an essentialand reliable tool in this assessment because of itsconvenience, safety and relative accuracy [17]Nonetheless, incorrect positioning of patients is notuncommon and can have a deleterious impact onDXA results and clinical decisions [19] The results ofthe present study indicate that DXA can be used forpersons with SCI in either the supine (standard) posi-tion, or prone (alternate) position with a high degreeof association allowing for longitudinal tracking inone of those positions. Special care was taken toensure that the scans were assessed with proper ROIposition. As reported by Lohman and colleagues [22],the Lunar DXA software automatically establishesregional boundaries, but often in a way that yieldsdata with a lower reproducibility and lower accuracy.The manual adjustments ensured that not only wereregional calculations correct, but that each regioncould be weighted properly in terms of contributionto total body structure for BMC, FM and FFM.Additionally, while our findings demonstrated a dif-
ference in BMD but not BMC, the difference betweenthe two positions may be explained by a differencein measured bone area. Nonetheless, our findingsmirror the results published by Lambrinoudaki et al.[2], where the increase in bone area in the proneposition, relative to the supine position, may beattributed to the larger profile of the cranium viewedfrom an axial position, rather than an anteroposteriorposition. Our findings support the premise that persons with
MC SCI suffer greater pathologic disability than MI.MC individual’s had a significantly lower mass, whichwas almost entirely accounted for by a lower FFM,and lower BMD. Our analysis indicate that despitethe use of variable body positioning, these relation-ships are also maintained, making assessments fromeither position a relevant indicator of body composi-tion in either MC or MI SCI persons. These findingsare similar to those seen among monozygotic SCItwins [29, 30], and reinforce assertions of how impor-tant motor function is to body composition. It isespecially important to note the profound differencesbetween MC and MI SCI as evidenced by the greaterdisparity of BMI, FFM and %BF displayed by thosewith MC SCI. Whereas BMI of 26.6 kg/m2 in MC SCIappears almost “normal”, %BF clearly falls into the“obese” range, while BMI of 31.0 kg/m2 in MI SCImore accurately reflects “obesity” as clearly indicatedby 34.8% BF. The significantly lower FFB in the MCSCI population due to muscular atrophy may furthermask differences in BF, as fewer soft-tissue pixels areavailable for review relative to the “bone” pixels.While this does not appear to impact comparisons ofprone and supine measures, investigators need tocontinue cautious interpretation of data that mixesthese populations until such time that DXA has beenproven a valid tool for determining body composi-tion in those with MC SCI. [3, 5] Additionally, ourresults indicated that fat free mass and fat mass werepositively associated with BMD in SCI, suggestingthat both muscle and adipose tissue play an impor-tant role in bone preservation for SCI. Nonetheless,the absence of external bone stress [29], and theimportance of exercise training and muscle develop-ment cannot be overlooked for the long-term man-agement of bone mass and obesity in persons withSCI [27, 31, 32]. Serial use of DXA should play animportant role in the management of exercise adap-tation and health evaluation. SCI has profound andlasting impact on body composition and health. DXAis a reliable tool for the long-term evaluation of SCI,but positioning has an important influence of results.Our data indicate that DXA measures are signifi-
cantly lower in the prone position, but that the rela-tionships between variables are maintained in eitherposition. Therefore, clinicians may confidently relyon either the prone or supine position for longitudi-nal and reliable body composition measures in menwith SCI, but should not alternate between positions,and remain conscious that the method has yet to bevalidated in this population. Furthermore, it must be
Christopher R Harnish et al102
IJBCR 11.3 & 4_inners_IJBCR 11.3 & 4_inners.qxd 02/01/2014 12:59 Page 102

noted that this data does not apply to women withSCI and additional investigation is warranted to deter-mine if men and women with SCI exhibit a similarrelationships in such scans.
Funding – 246 This research was made possiblethrough the support of VHA RR&D Merit GrantsB3918R and 247 B6757R, as well as by award numberUL1RR031990 from the National Center for Research248 Resources.
Acknowledgements – We wish to thank David Gater,M.D. for his generous support of resources andinsight into this project, as well as Hunter Poarch forhis assistance in DXA testing during the study, andAllison Keeley for her assistance in this manuscript’sproduction, and Jewel Moore RN for her assistance inclinical research support. The content is solely theresponsibility of the authors and does not necessarilyrepresent the official views of the Veterans HealthAdministration, National Center for ResearchResources, or the National Institutes of Health.
Conflict of interests – None of the authors have a con-flict of interest related to this research.
Author contributions – Mr. Harnish contributed sig-nificantly to the administration and completion of thisstudy, including subject recruitment, while Mr.Daniels was instrumental in reviewing and correctlyanalyzing each DXA scan. Both Mr. Harnish and Mr.Daniels contributed to researching, writing and editingthe manuscript. Dr. Sabo contributed to the statisticaldesign and analyses of the data, as well as offeringcontributions to the writing and editing of the manu-script. Dr. Lavis aided in the design, medical monitor-ing, and administration of the research.
References
1. Giangregorio L, McCartney N. Bone loss and muscleatrophy in spinal cord injury: epidemiology, fractureprediction, and rehabilitation strategies. J Spinal CordMed. 2006; 29 (5): 489-500.
2. Lambrinoudaki I, Georgiou E, Douskas G, Tsekes G,Kyriakidis M, Proukakis C. Body composition assess-ment by dual-energy x-ray absorptiometry: comparisonof prone and supine measurements. Metabolism. Nov1998; 47 (11): 1379-1382.
3. Gater DR, Clasey, JL. Body Composition Assessment inSpinal Cord Injury Clinical Trials. Top Spinal Cord InjRehabil. 2006; 11 (3): 36-49.
4. Gater DR. Pathophysiology of Obesity After Spinal CordInjury. Top Spinal Cord Inj Rehabil. 2007; 12 (4): 20-34.
5. Gater DR. Obesity After Spinal Cord Injury. Phys MedRehabil Clin N Am. May 2007; 18 (2): 333-351.
6. Garland DE, Adkins RH, Stewart CA, Ashford R, VigilD. Regional osteoporosis in women who have a com-plete spinal cord injury. J Bone Joint Surg Am. Aug2001; 83A (8): 1195-1200.
7. Gater DR, ed Spinal Cord Injury. Champaign: HumanKinetics; 2009. Ehrman JK, P.M. Gordon, P.S. Visich,and S.J. Keteyian., ed. Clinical Exercise Physiology.
8. Spungen AM, Adkins RH, Stewart CA, et al. Factorsinfluencing body composition in persons with spinalcord injury: a cross-sectional study. J Appl Physiol. Dec2003; 95 (6): 2398-2407.
9. Rajan S, McNeely MJ, Warms C, Goldstein B. Clinicalassessment and management of obesity in individualswith spinal cord injury: a review. J Spinal Cord Med.2008; 31 (4): 361-372.
10. Weaver FM, Collins EG, Kurichi J, et al. Prevalence ofobesity and high blood pressure in veterans with spinalcord injuries and disorders: a retrospective review. AmJ Phys Med Rehabil. Jan 2007; 86 (1): 22-29.
11. Lavela SL, Weaver FM, Goldstein B, et al. Diabetes mel-litus in individuals with spinal cord injury or disorder.J Spinal Cord Med. 2006; 29 (4): 387-395.
12. Bauman WA, Spungen AM. Coronary heart disease inindividuals with spinal cord injury: assessment of riskfactors. Spinal Cord. Jul 2008; 46 (7): 466-476.
13. Rajan S, Hammond MC, Goldstein B. Trends in diabetes mellitus indicators in veterans with spinalcord injury. Am J Phys Med Rehabil. Jun 2008; 87 (6):468-474.
14. Wilt TJ, Carlson KF, Goldish GD, et al. Carbohydrateand lipid disorders and relevant considerations in per-sons with spinal cord injury. Evid Rep Technol Assess(Full Rep). Jan 2008 (163): 1-95.
15. Myers J, Lee M, Kiratli J. Cardiovascular disease inspinal cord injury: an overview of prevalence, risk,evaluation, and management. Am J Phys Med Rehabil.Feb 2007; 86 (2): 142-152.
16. Liang H, Chen D, Wang Y, Rimmer JH, BraunschweigCL. Different risk factor patterns for metabolic syn-drome in men with spinal cord injury compared withable-bodied men despite similar prevalence rates. ArchPhys Med Rehabil. Sep 2007; 88 (9): 1198-1204.
17. Jones LM, Goulding A, Gerrard DF. DEXA: a practicaland accurate tool to demonstrate total and regionalbone loss, lean tissue loss and fat mass gain in para-plegia. Spinal Cord. Sep 1998; 36 (9): 637-640.
18. Henderson RC, Lark RK, Renner JB, et al. Dual X-rayabsorptiometry assessment of body composition inchildren with altered body posture. J Clin Densitom.Winter 2001; 4 (4): 325-335.
19. Cetin A, Ozguclu E, Ozcakar L, Akinci A. Evaluation ofthe patient positioning during DXA measurements indaily clinical practice. Clin Rheumatol. Jun 2008; 27(6): 713-715.
20. Gorgey AS, Chiodo AE, Zemper ED, Hornyak JE,Rodriguez GM, Gater DR. Relationship of spasticity tosoft tissue body composition and the metabolic profilein persons with chronic motor complete spinal cordinjury. J Spinal Cord Med. 2010; 33 (1): 6-15.
21. Adams MM, Hicks AL. Spasticity after spinal cordinjury. Spinal Cord. Oct 2005; 43 (10): 577-586.
22. Lohman M, Tallroth K, Kettunen JA, Marttinen MT.Reproducibility of dual-energy x-ray absorptiometrytotal and regional body composition measurementsusing different scanning positions and definitions ofregions. Metabolism. Nov 2009; 58 (11): 1663-1668.
23. Fisher RA . Frequency distribution of the values of thecorrelation coefficient in samples of an indefinitelylarge population. Biometrika. 1915; 10 (4): 507-521.
24. McDonald CM, Abresch-Meyer AL, Nelson MD,Widman LM. Body mass index and body compositionmeasures by dual x-ray absorptiometry in patientsaged 10 to 21 years with spinal cord injury. J SpinalCord Med. 2007; 30 Suppl 1: S97-104.
Comparison between prone and supine DXA measurements in men with chronic spinal cord injury 103
IJBCR 11.3 & 4_inners_IJBCR 11.3 & 4_inners.qxd 02/01/2014 12:59 Page 103
25. Spungen AM, Kirshblum S, Cirnigliaro CM, Wecht JM,Bauman WA. Body composition changes within theinitial months following spinal cord injury. 2010Annual Meeting of the Academy of Spinal Cord InjuryPorfessionals. Las Vegas, NV2010.
26. Garland DE, Stewart CA, Adkins RH, et al.Osteoporosis after spinal cord injury. J Orthop Res.May 1992; 10 (3): 371-378.
27. Gater DR. Exercise and Fitness with Spinal Cord Injury.In: Sisto SA, Druin E, Sliwinski MM, eds. Spinal cordinjuries Management and Rehabilitation 1 ed.Philadelphia: Mosby; 2009: 430-454.
28. Vaziri ND, Pandian MR, Segal JL, Winer RL, Eltorai I,Brunnemann S. Vitamin D, parathormone, and calci-tonin profiles in persons with long-standing spinalcord injury. Arch Phys Med Rehabil. Jul 1994; 75 (7):766-769.
29. Bauman WA, Spungen AM, Wang J, Pierson RN, Jr.,Schwartz E. Relationship of fat mass and serum estra-diol with lower extremity bone in persons with chron-ic spinal cord injury. Am J Physiol Endocrinol Metab.Jun 2006; 290 (6): E1098-1103.
30. Bauman WA, Zhang RL, Spungen AM. Provocativestimulation of growth hormone: a monozygotic twinstudy discordant for spinal cord injury. J Spinal CordMed.; 30 (5): 467-472.
31. Devillard X, Rimaud D, Roche F, Calmels P. Effects oftraining programs for spinal cord injury. Ann ReadaptMed Phys. Jul 2007; 50 (6): 490-498, 480-499.
32. Belanger M, Stein RB, Wheeler GD, Gordon T, LeducB. Electrical stimulation: can it increase musclestrength and reverse osteopenia in spinal cord injuredindividuals? Arch Phys Med Rehabil. Aug 2000; 81 (8):1090-1098.
Christopher R Harnish et al104
IJBCR 11.3 & 4_inners_IJBCR 11.3 & 4_inners.qxd 02/01/2014 12:59 Page 104
Introduction
The stimulus for studies of body composition in vivocame from the studies of [1] who used underwaterweighing for dividing human body into fat and leanbody mass with the density of 1.100 g/cc. It wasassumed that all adult normal humans differ only inthe proportion of fat which is suspended on the basiclean body with mineral, protein, and water having astable ratio. The lean body mass was designated asthe total weight minus all fat except the indispensablefat which was assumed to be about ten percent of thelean body mass. This assumption was in error and re-evaluated by [1] to allow only two percent fat toinclude essential lipids in the spinal cord, brain,nerves, cell walls. The concept of lean body masswas criticized by [2] who suggested proper designationfor the mass devoid of all fat as ‘fat-free mass’.This new body compartment by its name dominated
research in body composition for two decades andthe wealth of its contributions was presented in twovolumes of Annals of the New York Academy ofSciences entitled Body Composition – Part I –Volume 110 and Part II – Volume 111.
The contents of Part I presented several newmethodological approaches to measurements ofbody composition in animal studies or in humanbiology with emphasis on growth and aging as wellas implications for medical sciences. One of the mostfascinating presentations dealt with Body Cell Mass,a new body composition compartment calculatedfrom total body potassium K40 [3]. Thus body cell massbecame the basis for multi-compartmental studies ofbody composition.Initially, the three-component model, which
includes fat, water, and fat-free dry solids was pro-posed by [4]. This model was based on results fromdensitometry and hydrometry which minimizeduncertain hydration of fat-free mass. However, a stableproportion of protein to mineral in this componentwas assumed. New research methodology, dual-energyX-ray absorptiometry (DXA) which gave its birththree decades after densitometry and hydrometry,
International Journal of Body Composition Research 2013 Vol. 11 No. 3 & 4: 105–112. © Smith-Gordon ISSN 1479-456X
Submitted 25 September 2013 accepted after revision 20 July 2013
Four-compartment model: effect of biological aging and gender differences
L P Novak
Department of Biological Anthropology, Southern Methodist University,Dallas, Texas, USA.
Objective: This investigation provides information about changes of the four compartments of the humanbody related to biological aging processes of both genders.Methods: Total Body Fat + Extracellular Water + Body Cell Mass + Total Bone were determined on 51 maleand 55 female healthy volunteers aged 20 to 67 years divided into five age groups by decades.Results: In males, tendency for increased boy fat with age after 30 years onwards from 14.9 kg to 21.2 kgwas noted in the oldest age group (P < 005 level). Extracellular water increased from 20.5 to 22.9 liters(NS). Body cell mass decreased with age from 35.9 to 31.1 kg (P < 0.05 level). Total bone showed minimaldecrease from 6.3 to 6.0 kg (NS).
Total body fat of females ranged from the lowest value of 15.9 to the highest of 21.8 kg (.08) a gain of fatof approximately 6.0 kg noted in the middle-aged subjects. Extracellular water increased from 16.6 to 17.5liters (NS) age trend. Body cell mass decreased from 21.7 to 17.5 kg with largest decrease of 4.2 kg seemedto occur in the oldest group (P < 0.01 level). Total bone remained practically unchanged showing a decreasefrom 4.5 to 4.2 kg (NS) with increasing age. Expressed percentage wise, total body fat of males increased from19.5 to 25.1% with increasing age (P < 0.05 level). Extracellular water increased from 25.6 to 28.4% (NS).Body cell mass indicated loss with age from 45.4 to 38.8% (P < 0.01 level). Only a slight decrease from 8.2to 7.8% (NS) of total bone was noted. Total body fat of females increased with age from 26.5 to 33.8% (P <0.05 level). Extracellular water in all age groups showed consistency between 28.3 to 29.4%. Body cell massdecreased from 37.2 to 29.8% (P < 0.01 level). Total bone indicated small bone loss from 7.7 to 7.0% (NS).
Keywords: ???????????
Address for correspondence: Dr LP Novak, Dept of BiologicalAnthropology, Southern Methodist University, Dallas, Texas,75275, USA. Email: [email protected]
IJBCR 11.3 & 4_inners_IJBCR 11.3 & 4_inners.qxd 02/01/2014 12:59 Page 105

was effectively used by [5], which allowed the bodyto be divided into four-component model i.e. bodyfat, body water, protein and mineral. This approachsets apart protein from mineral by direct determinationof total bone mineral content. Changes in body com-position in the elderly by losses of skeletal musclesand gain in body fat seem to lower quality of life andincrease potential for earlier death according to [6].The first purpose of this study is to identify the
effect of aging on the four-compartments of the bodyand then, secondly, to examine sex differences withinthe four-compartments of the body.
Subjects and methodsThe subjects for this study were 51 male and 55female healthy volunteers aged 20 to 67 years. Theywere divided into five age groups by decades. Four-compartmental analysis of the human body was used,which allowed the body weight to be divided into:
Body Weight, kg = Fat, kg + Exracellular Water,L + Body Cell Mass, kg + Total Bone, kg
Total Body Fat was determined from the knowledgeof total body water assuming that body fat is anhydrous and fat-free body is 73.2 percent water asmentioned by [7]. In this case, total body fat refers tochemical neutral fat, i.e. triglycerides and not to theactual composition of total obesity tissues which hasabout 15 to 22 percent water and 5 to 8 percent cells.The subjects were given orally one gram of deuteri-um oxide (99.8%) per kg of body weight with anadditional 100 ml of tap water. After the equilibrationperiod of deuterium oxide to normal water elapsed,the subjects emptied their bladders and two urinesamples at 3 and 4 hours were collected. Aliquotswere analyzed for the ratio of hydrogen from deuteri-um oxide to hydrogen of normal water by mass spec-trometry as proposed by [8]. The calculations of vol-ume distribution of total body water were doneaccording to the procedure suggested by [9].Approximately 80 mg/kg of body weight of stablebromide was given orally to the subjects and bloodwas drawn after 2 hours of equilibration period. Thecalculation of corrected bromide space in liters wasachieved by correcting total dose of bromide admin-istered by 10% which represents the amount of bro-mide entering the red cells during equilibration.Corrected dose was then divided by plasma bromideconcentration which was corrected for the Donnaneffect and plasma water.Body cell mass was calculated from the knowledge
of total body potassium according to the formula pro-posed by [10]. Whole body counter was used to countemissions of naturally radioactive potassium 40-K asdescribed by [11]. Small correction was applied for theminimal amount of extracellular potassium.Total bone was calculated from the regression for-
mula proposed by [10] which takes into considerationthe numerical relationships between the ratio of bodypotassium to fat-free solids. It also assumes that the
bone weight is 10.3 percent of the normally hydratedfat-free body in health.
Statistical analysisData from total body fat, extracellular water, bodycell mass, and total bone served as dependent vari-ables whereas height, weight, age and sex served asindependent variables. The statistical significancebetween the sexes in regards to the four compart-ments was sought by testing null hypothesis that theintercepts of the regression lines are the same forboth male and female subjects.
Results
The physical characteristics of male and female sub-jects are presented in Table 1. Males of all age groupsshowed similar heights between 176.3 to 178.9 cen-timeters and their weights varied between 75.2 to81.4 kilograms. Heights and weights in all age groupsof males were significant at (P < 0.01 level) comparedto females.The heights of female subjects varied between
165.4 cm to 161.8 cm and their weights werebetween 58.5 and 64.3 kilograms.Four compartmental analysis of males is shown in
Table 2. Total body fat ranged from 14.9 to 21.2 kilo-grams. Tendency for increased body fat with age after30 years onwards is indicated by the mean values. Thelargest fat gain of 5.0 kg was noted in the oldest agegroup (P < 0.05 level). Extracellular water of malesexpressed in liters seemed to increase with age from20.5 to 22.9 liters, respectively. This change repre-sents an 11 percent increase of extracellular waterwith age in males (NS). Body cell mass of malesexpressed in kilograms showed a decreasing tendencywith age from 35.9 to 31.1 kg which represents, inthis study, a loss of cellular mass of nearly 5.0 kilo-grams, i.e., a decrease of 13.4% (P < 0.05 level). Totalbone of males expressed in kg remained practicallyunchanged with minimal accountable decrease from6.3 to 6.0 kg only (NS).Four compartmental analysis of females is shown
in Table 2. Total body fat of females ranged from thelowest value of 15.9 to the highest of 21.8 kg (.08), again of fat of approximately 6.0 kg which was notedin the middle-aged subjects in this study. It is of inter-est that the mean values of total body fat of femalescorrespond to those of males. Extracellular water offemales expressed in liters seemed to be changedwith values of 16.6 to 17.5 liters (NS) age trend.However, compared to the extracellular water ofmales, the average values of females are lower byabout 4.0 to 5.0 liters. Body cell mass of femalesexpressed in kilograms showed decrease from 21.7kg to 17.5 kg. Only in the oldest group, a decreaseof 4.2 kg, i.e., about 20% was noted (P < 0.01 level).Compared to males, the body cell mass of females inthe younger age groups was lower by about 15 kgand by about 11.0 to 15.0 kg in the older age groupof females. Total bone of females expressed in kilo-
L P Novak106
IJBCR 11.3 & 4_inners_IJBCR 11.3 & 4_inners.qxd 02/01/2014 12:59 Page 106
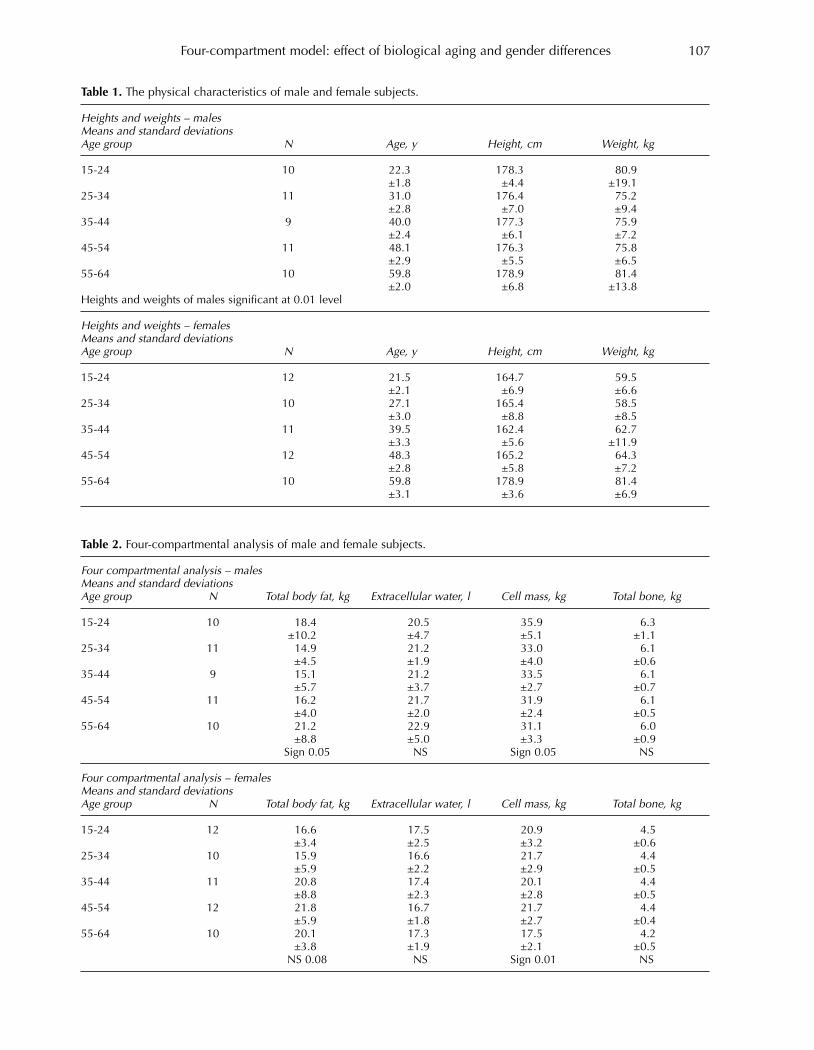
Four-compartment model: effect of biological aging and gender differences 107
Table 1. The physical characteristics of male and female subjects.
Heights and weights – malesMeans and standard deviationsAge group N Age, y Height, cm Weight, kg
15-24 10 22.3 178.3 80.9±1.8 ±4.4 ±19.1
25-34 11 31.0 176.4 75.2±2.8 ±7.0 ±9.4
35-44 9 40.0 177.3 75.9±2.4 ±6.1 ±7.2
45-54 11 48.1 176.3 75.8±2.9 ±5.5 ±6.5
55-64 10 59.8 178.9 81.4±2.0 ±6.8 ±13.8
Heights and weights of males significant at 0.01 level
Heights and weights – femalesMeans and standard deviationsAge group N Age, y Height, cm Weight, kg
15-24 12 21.5 164.7 59.5±2.1 ±6.9 ±6.6
25-34 10 27.1 165.4 58.5±3.0 ±8.8 ±8.5
35-44 11 39.5 162.4 62.7±3.3 ±5.6 ±11.9
45-54 12 48.3 165.2 64.3±2.8 ±5.8 ±7.2
55-64 10 59.8 178.9 81.4±3.1 ±3.6 ±6.9
Table 2. Four-compartmental analysis of male and female subjects.
Four compartmental analysis – malesMeans and standard deviationsAge group N Total body fat, kg Extracellular water, l Cell mass, kg Total bone, kg
15-24 10 18.4 20.5 35.9 6.3±10.2 ±4.7 ±5.1 ±1.1
25-34 11 14.9 21.2 33.0 6.1±4.5 ±1.9 ±4.0 ±0.6
35-44 9 15.1 21.2 33.5 6.1±5.7 ±3.7 ±2.7 ±0.7
45-54 11 16.2 21.7 31.9 6.1±4.0 ±2.0 ±2.4 ±0.5
55-64 10 21.2 22.9 31.1 6.0±8.8 ±5.0 ±3.3 ±0.9
Sign 0.05 NS Sign 0.05 NS
Four compartmental analysis – femalesMeans and standard deviationsAge group N Total body fat, kg Extracellular water, l Cell mass, kg Total bone, kg
15-24 12 16.6 17.5 20.9 4.5±3.4 ±2.5 ±3.2 ±0.6
25-34 10 15.9 16.6 21.7 4.4±5.9 ±2.2 ±2.9 ±0.5
35-44 11 20.8 17.4 20.1 4.4±8.8 ±2.3 ±2.8 ±0.5
45-54 12 21.8 16.7 21.7 4.4±5.9 ±1.8 ±2.7 ±0.4
55-64 10 20.1 17.3 17.5 4.2±3.8 ±1.9 ±2.1 ±0.5
NS 0.08 NS Sign 0.01 NS
IJBCR 11.3 & 4_inners_IJBCR 11.3 & 4_inners.qxd 02/01/2014 12:59 Page 107
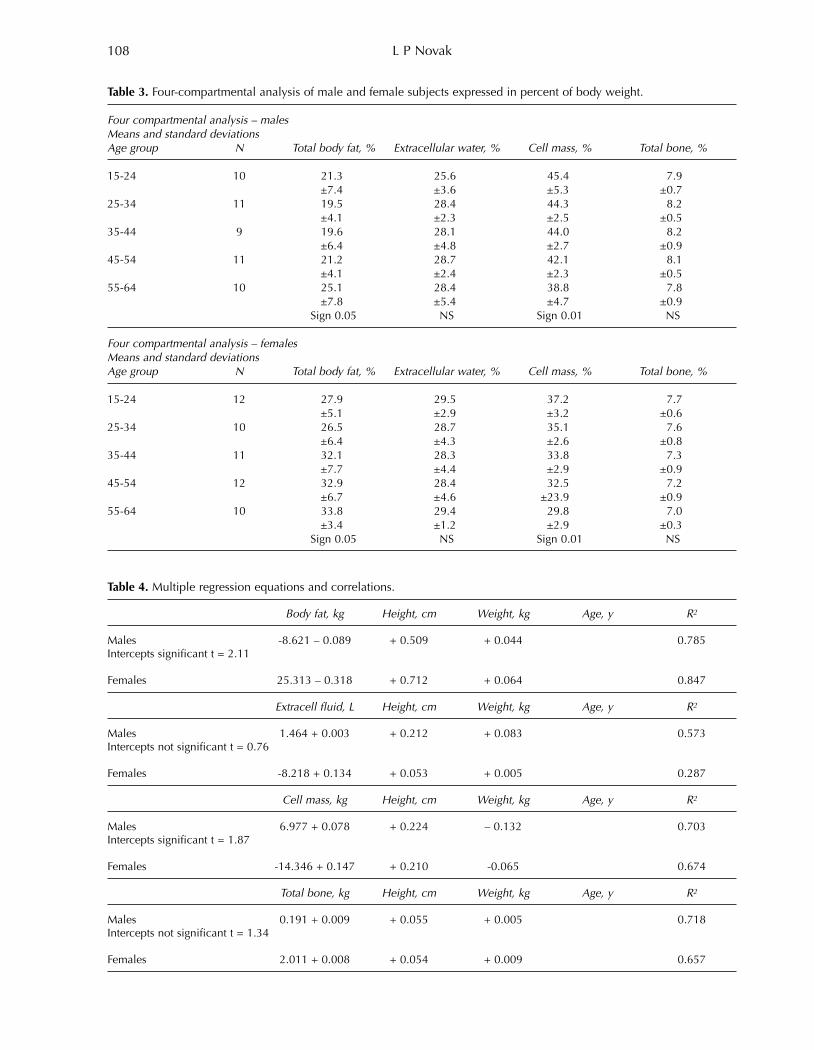
L P Novak108
Table 3. Four-compartmental analysis of male and female subjects expressed in percent of body weight.
Four compartmental analysis – malesMeans and standard deviationsAge group N Total body fat, % Extracellular water, % Cell mass, % Total bone, %
15-24 10 21.3 25.6 45.4 7.9±7.4 ±3.6 ±5.3 ±0.7
25-34 11 19.5 28.4 44.3 8.2±4.1 ±2.3 ±2.5 ±0.5
35-44 9 19.6 28.1 44.0 8.2±6.4 ±4.8 ±2.7 ±0.9
45-54 11 21.2 28.7 42.1 8.1±4.1 ±2.4 ±2.3 ±0.5
55-64 10 25.1 28.4 38.8 7.8±7.8 ±5.4 ±4.7 ±0.9
Sign 0.05 NS Sign 0.01 NS
Four compartmental analysis – femalesMeans and standard deviationsAge group N Total body fat, % Extracellular water, % Cell mass, % Total bone, %
15-24 12 27.9 29.5 37.2 7.7±5.1 ±2.9 ±3.2 ±0.6
25-34 10 26.5 28.7 35.1 7.6±6.4 ±4.3 ±2.6 ±0.8
35-44 11 32.1 28.3 33.8 7.3±7.7 ±4.4 ±2.9 ±0.9
45-54 12 32.9 28.4 32.5 7.2±6.7 ±4.6 ±23.9 ±0.9
55-64 10 33.8 29.4 29.8 7.0±3.4 ±1.2 ±2.9 ±0.3
Sign 0.05 NS Sign 0.01 NS
Table 4. Multiple regression equations and correlations.
Body fat, kg Height, cm Weight, kg Age, y R2
Males -8.621 – 0.089 + 0.509 + 0.044 0.785 Intercepts significant t = 2.11
Females 25.313 – 0.318 + 0.712 + 0.064 0.847
Extracell fluid, L Height, cm Weight, kg Age, y R2
Males 1.464 + 0.003 + 0.212 + 0.083 0.573Intercepts not significant t = 0.76
Females -8.218 + 0.134 + 0.053 + 0.005 0.287
Cell mass, kg Height, cm Weight, kg Age, y R2
Males 6.977 + 0.078 + 0.224 – 0.132 0.703Intercepts significant t = 1.87
Females -14.346 + 0.147 + 0.210 -0.065 0.674
Total bone, kg Height, cm Weight, kg Age, y R2
Males 0.191 + 0.009 + 0.055 + 0.005 0.718Intercepts not significant t = 1.34
Females 2.011 + 0.008 + 0.054 + 0.009 0.657
IJBCR 11.3 & 4_inners_IJBCR 11.3 & 4_inners.qxd 02/01/2014 12:59 Page 108
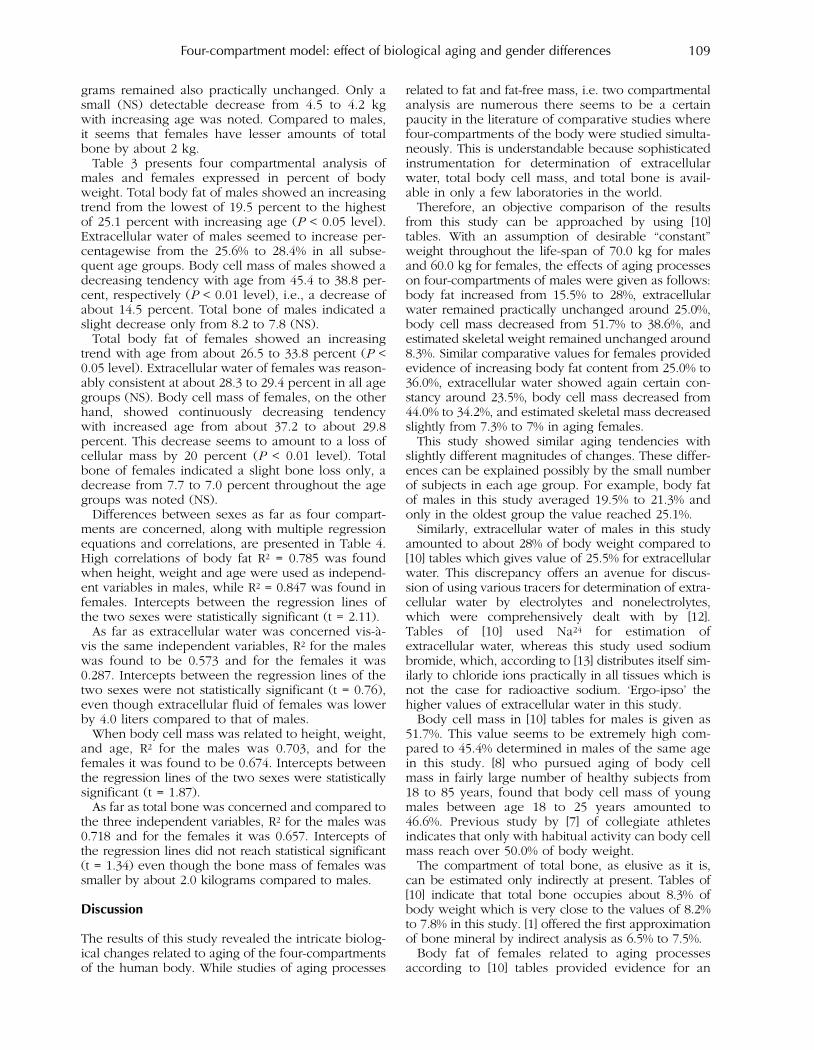
grams remained also practically unchanged. Only asmall (NS) detectable decrease from 4.5 to 4.2 kgwith increasing age was noted. Compared to males,it seems that females have lesser amounts of totalbone by about 2 kg.Table 3 presents four compartmental analysis of
males and females expressed in percent of bodyweight. Total body fat of males showed an increasingtrend from the lowest of 19.5 percent to the highestof 25.1 percent with increasing age (P < 0.05 level).Extracellular water of males seemed to increase per-centagewise from the 25.6% to 28.4% in all subse-quent age groups. Body cell mass of males showed adecreasing tendency with age from 45.4 to 38.8 per-cent, respectively (P < 0.01 level), i.e., a decrease ofabout 14.5 percent. Total bone of males indicated aslight decrease only from 8.2 to 7.8 (NS).Total body fat of females showed an increasing
trend with age from about 26.5 to 33.8 percent (P <0.05 level). Extracellular water of females was reason-ably consistent at about 28.3 to 29.4 percent in all agegroups (NS). Body cell mass of females, on the otherhand, showed continuously decreasing tendencywith increased age from about 37.2 to about 29.8 percent. This decrease seems to amount to a loss ofcellular mass by 20 percent (P < 0.01 level). Totalbone of females indicated a slight bone loss only, adecrease from 7.7 to 7.0 percent throughout the agegroups was noted (NS).Differences between sexes as far as four compart-
ments are concerned, along with multiple regressionequations and correlations, are presented in Table 4.High correlations of body fat R2 = 0.785 was foundwhen height, weight and age were used as independ-ent variables in males, while R2 = 0.847 was found infemales. Intercepts between the regression lines ofthe two sexes were statistically significant (t = 2.11).As far as extracellular water was concerned vis-à-
vis the same independent variables, R2 for the maleswas found to be 0.573 and for the females it was0.287. Intercepts between the regression lines of thetwo sexes were not statistically significant (t = 0.76),even though extracellular fluid of females was lowerby 4.0 liters compared to that of males.When body cell mass was related to height, weight,
and age, R2 for the males was 0.703, and for thefemales it was found to be 0.674. Intercepts betweenthe regression lines of the two sexes were statisticallysignificant (t = 1.87).As far as total bone was concerned and compared to
the three independent variables, R2 for the males was0.718 and for the females it was 0.657. Intercepts ofthe regression lines did not reach statistical significant(t = 1.34) even though the bone mass of females wassmaller by about 2.0 kilograms compared to males.
Discussion
The results of this study revealed the intricate biolog-ical changes related to aging of the four-compartmentsof the human body. While studies of aging processes
related to fat and fat-free mass, i.e. two compartmentalanalysis are numerous there seems to be a certainpaucity in the literature of comparative studies wherefour-compartments of the body were studied simulta-neously. This is understandable because sophisticatedinstrumentation for determination of extracellularwater, total body cell mass, and total bone is avail-able in only a few laboratories in the world.Therefore, an objective comparison of the results
from this study can be approached by using [10]tables. With an assumption of desirable “constant”weight throughout the life-span of 70.0 kg for malesand 60.0 kg for females, the effects of aging processeson four-compartments of males were given as follows:body fat increased from 15.5% to 28%, extracellularwater remained practically unchanged around 25.0%,body cell mass decreased from 51.7% to 38.6%, andestimated skeletal weight remained unchanged around8.3%. Similar comparative values for females providedevidence of increasing body fat content from 25.0% to36.0%, extracellular water showed again certain con-stancy around 23.5%, body cell mass decreased from44.0% to 34.2%, and estimated skeletal mass decreasedslightly from 7.3% to 7% in aging females.This study showed similar aging tendencies with
slightly different magnitudes of changes. These differ-ences can be explained possibly by the small numberof subjects in each age group. For example, body fatof males in this study averaged 19.5% to 21.3% andonly in the oldest group the value reached 25.1%.Similarly, extracellular water of males in this study
amounted to about 28% of body weight compared to[10] tables which gives value of 25.5% for extracellularwater. This discrepancy offers an avenue for discus-sion of using various tracers for determination of extra-cellular water by electrolytes and nonelectrolytes,which were comprehensively dealt with by [12].Tables of [10] used Na24 for estimation of extracellular water, whereas this study used sodiumbromide, which, according to [13] distributes itself sim-ilarly to chloride ions practically in all tissues which isnot the case for radioactive sodium. ‘Ergo-ipso’ thehigher values of extracellular water in this study.Body cell mass in [10] tables for males is given as
51.7%. This value seems to be extremely high com-pared to 45.4% determined in males of the same agein this study. [8] who pursued aging of body cellmass in fairly large number of healthy subjects from18 to 85 years, found that body cell mass of youngmales between age 18 to 25 years amounted to46.6%. Previous study by [7] of collegiate athletesindicates that only with habitual activity can body cellmass reach over 50.0% of body weight.The compartment of total bone, as elusive as it is,
can be estimated only indirectly at present. Tables of[10] indicate that total bone occupies about 8.3% ofbody weight which is very close to the values of 8.2%to 7.8% in this study. [1] offered the first approximationof bone mineral by indirect analysis as 6.5% to 7.5%.Body fat of females related to aging processes
according to [10] tables provided evidence for an
Four-compartment model: effect of biological aging and gender differences 109
IJBCR 11.3 & 4_inners_IJBCR 11.3 & 4_inners.qxd 02/01/2014 12:59 Page 109

increased tendency from 25.0% to 36.0% as com-pared to 19.5% to 21.2% in this study. Only the old-est group of females demonstrated respectable 25.1%of body fat. Perhaps, females of this decade are moresensitive to emphasis on leanness.Extracellular water for females in [10] tables is
given as 23.5% of body weight whereas higher valuesbetween 28.0% to 29.0% were documented. The pos-sible reason for this discrepancy was provided in thediscussion of extracellular water of males above.Body cell mass seems to be again somewhat higher
in the young 25 years old group of females in [10]tables, i.e., 44.0% as compared to 37.2% in this study.Results from investigations of [9] and [11] of adoles-cent female athletes and active middle-aged femalesprovided evidence of body cell mass 44.1% to 46.6%in the former group and 38.2% in the latter group,respectively.Total bone of females in [10] tables indicates a
decrease from 7.3% to 7.0% with advancing age.These values correspond well with those in thisstudy, namely, loss of bone from 7.7% to 7.0%. Suchtendency of bone loss, perhaps, relates to calciumdeficiencies in the female population in this countrywhich was also documented by neutron analysis ofCa47 by [3] which showed decreased body calciumwith age.More recently, with availability of new research
methodology, several studies focused themselves oncomparing body fat mass determined by four-compartment model versus dual energy-ray absorp-tiometry (DXA), by underwater weighing and totalbody water. This approach was used in the study of[20] as well as by [23] and [22] which provided evidencethat DXA seemed to underestimate percentage ofbody fat compared to four-compartment model. Biasof 3.1 to 5.3% of body fat was noted when DXA wascompared with 4-C model. Thus, the validity of DXAmeasurements of body composition was questionedby [24] and warning was issued that usage of DXAshould be used with caution in clinical evaluationand in research endeavors. The numerous studies of total body fat are well
justified considering the facts that excess of body fatleads to obesity and correlates positively with coro-nary heart disease, hypertension, diabetes, highblood cholesterol and saturated fat, all of which areincreasing the risk of deleterious effects on overallhealth status and become a significant predictor ofmorbidity and mortality.
Conclusion
Currently there seems to be a paucity in studies offour-compartments analysis of human body related tobiological aging processes. Thus, this present studyseems to be the only one identifying the effect ofaging as well as gender differences within the four-compartment model of the body despite small numberof subjects. Body cell mass revealed a significantreduction of both genders with simultaneous large
increases of total body fat. Extracellular waterincreased slightly, as well as total bone showed min-imal decrease in both genders.
References
1. Behnke, A, Feen, BG, and Welham, WC. The specificgravity of healthy men. J.A.M.A. 1942, 118: 495-498.
2. Brozek, J. Measurement of body compartments innutritional research: Comments on selected methods.In Methods for Evaluation of Nutritional Adequacy andStatus. Nat. Acad. Sci.-Nat. Res. Council 1954; 265-279.
3. Moore, FD and Caryl Magnus Boyden. Body Cell Massand Limits of Hydration of the Fat-Free Body: TheirRelation to Estimated Skeletal Weight, 1963; Ann NYAcad Sci 110: 62-71.
4. Siri, WE. Body composition from fluid spaces and density:analysis of methods. In Brozek, J, Henschel A, Editors.Techniques for measuring body composition. WashingtonDC; Nat. Acad. Sci-Nat. Res. Council 1961; 223-244.
5. Fuller, NJ, Jebb, SA, Laskey, MA, Coward, WA and Elia,M. Four-compartment model for the assessment of bodycomposition in humans: comparison with alternativemethods, and evaluation of the density and hydration offat-free mass. Clinical Science, 1992; 82: 687-693.
6. Visser, M, Harris TB, Langlois, J, Hannan, MT,Roubenoff, R, Felson, DT. Body fat and skeletal musclemass in relation to physical disability in very old menand women of the Framingham Heart Study. JGerontol. 1998; 53, M214-M221.
7. Pace, N and Rathbun, EN. Studies on body composi-tion III. The body water and chemically combinednitrogen content in relation to fat content. J. BiolChem., 1945; 158: 625-637.
8. Solomon, AK, Edelman, IS, Soloway, S. The use of themass spectrometer to measure deuterium in body fluids.J. Clin. Invest., 1950; 29: 1311-1319.
9. Schloerb, PR, Friis-Hansen, FJ, Edelman, IS, Solomon,AK and Moore, FD. The measurement of total bodywater in human subject by deuterium oxide dilution:with consideration of the dynamics of deuterium distri-bution. J. Clin. Invest. 1950; 29: 1296-1310.
10. Moore, FD, Olesen, KH, McNurrey, JB, Parker, VH,Ball, MR, Boyden, CM. The Body Cell Mass and ItsSupporting Environment. Body Composition in Healthand Disease. W. B. Saunders Comp. 1963.
11. Novak, LP. Estimation of total body potassium in normaladolescents by whole-body counting: age and sex dif-ferences. Med. and Science in Sports 1973, 3: 147-155.
12. Edelman, IS, Leibman, J. Anatomy of body water andelectrolytes. Amer. J. Med. 1959; 27: 256-277.
13. Cheek, DB. Extracellular volume: its structure andmeasurements and the influence of age and disease. J.Pediatr. 1961; 58: 103.
14. Novak, LP. Aging total body potassium, fat-free mass,and cell mass in males and females, 18 to 85 years. J.Gerontol. 1972; 97: 438-443.
15. Novak, LP. Body composition and physiologic functionof athletes. J. Am. Med. Assoc., 1968: 205: 764-770.
16. Allen, TH, Welch, BE, Trujillo, TT, Roberts, JE. Fat,water and tissues solids of the whole body less itsbone mineral. J. Appl. Physiol., 1959; 14: 1009-1012.
17. Novak, LP. Maximal oxygen consumption, pulmonaryfunction, body composition, and anthropometry ofadolescent female athletes. Intern. Z. Angew. Physiol.,1973; 31: 103-119.
L P Novak110
IJBCR 11.3 & 4_inners_IJBCR 11.3 & 4_inners.qxd 02/01/2014 12:59 Page 110

18. Novak, LP. Body composition and maximal oxygenuptake of sedentary and active middle-aged women.Presented at University of Leuven; Leuven, Belgium,1978.
19. Cohn, SH, Dombrowski, CS, Fairchild, RG. In-vivoneutron activation analysis of calcium content in man.J. Appl. Rad. Isotopes, 1970; 21: 127-137.
20. Goran, MI, Toth, MJ, Poehlman, ET. Assessment ofresearch-based body composition techniques inhealthy men and women using the 4-compartmentmodel as a criterion method. Int. J. Obes Relat MetabDisord 1998; 22(2): 135-142.
21. Oldroyd, B, Steward, SP, Truscot, JG, Westmacott, CF,Smith, MA. Age related changed in body composition.Appl. Radiat. Isot. 1998; Vol. 49, No. 5/6: 589-590.
22. Grant, E, Van der Ploeg, Robert T Withers, Joe Laforgia.Percent body fat via DXA comparison with a four-com-partment model. J. Appl. Physiol 2003; 94: 499-506.
23. Casey, JL, Kanaley, JA, Wideman, L, Heymsfield, SB etal. Validity of methods of body composition assess-ment in young and older men and women. J. ApplPhysiol 1999; 86(5): 1728-1738.
24. Wang, ZM, Deurenberg, P, Guo SS, Pietrobelli A, WangJ, Pierson RN Jr., Heymsfield SB. Six-compartmentbody composition model: inter-method comparisonsof total body fat measurement. Int J Obes Relat MetabDisord 1998; 22: 329-337.
Four-compartment model: effect of biological aging and gender differences 111
IJBCR 11.3 & 4_inners_IJBCR 11.3 & 4_inners.qxd 02/01/2014 12:59 Page 111

112
IJBCR 11.3 & 4_inners_IJBCR 11.3 & 4_inners.qxd 02/01/2014 12:59 Page 112
Introduction
Diabetes affects about 20% of older adults in theUnited States and has emerged as a recognized riskfor osteoporotic fractures [1]. Dyslipidemia is intri-cately linked to diabetes, possibly affecting bonemetabolism [2]. Although the exact pathophysiologyof diabetes-related dyslipidemia is unknown, insulinresistance is recognized as a promoter of the typicaldyslipidemia in Type-2 diabetes leading to increasedlow density cholesterol (LDL), decreased high densitycholesterol (HDL), and elevated trigly-ceride levels[3, 4]. The LDL cholesterol may be particularly sus-ceptible to oxidation or glycation modifications inDM.
The impact of diabetic dyslipidemia on bonemetabolism was reported by Yamaguchi et al. (2002),showing that lumbar BMD was inversely and posi-tively associated with plasma LDL and HDL cholesterolrespectively [2]. However, other studies observedeither a negative association between HDL levels andlumbar spine BMD [5], or no significant link betweenblood cholesterols and BMD [6]. In the face of varying
International Journal of Body Composition Research 2013 Vol. 11 No. 3 & 4: 113–118. © Smith-Gordon ISSN 1479-456X
Submitted 3 June 2013 accepted after revision 7 November 2013
Serum lipids and bone mineral density in Hispanics with type-2 diabetes
W Lawrence Beeson1, Emmanuel A Ojo2, Ihuoma Chukwueke1,Eloy Schulz3, Anthony Firek4, Marino De Leon5
and Zaida Cordero-MacIntyre5,6,7.
1Loma Linda University School of Public Health, Department of Epidemiology and Biostatistics, Loma Linda, CA;
2Boston University School of Medicine, Boston, MA 02118; 3Loma Linda University School of Medicine, Department of Radiology;
4JL Pettis Memorial VA Medical Center, Endocrinology, Loma Linda, CA;5Loma Linda University Center for Health Disparities and MolecularMedicine, Loma Linda, CA; 6Loma Linda University, School of PublicHealth, Department of Nutrition, Loma Linda, CA; 7Whittier College,
Department of Kinesiology and Nutrition, Whittier, CA.
Objective: Individuals with diabetes face increased risk of fractures and related bone disorders. In thisstudy we examined bone mineral density (BMD) in Hispanics with type-2 diabetes focusing on the potentialeffect of serum lipids. High lipid levels have been reported to interfere with osteoblast activity.Research methods: Thirty nine Hispanic subjects with type-2 diabetes (age=53.9 ± 11.2y, BMI=31.67 ±6.73, M=16 F=23) were enrolled from surrounding San Bernardino and Riverside counties. The age rangefor the females was 29 to 75 so included both pre- and post-menopausal women. Baseline BMD measure-ments of participants were obtained using the Fan Beam Dual energy x-ray absorptiometry (DXA)Discovery A, software V 12.6. Correlation analyses were used to evaluate relationships between selectedserum lipids (total cholesterol, HDL cholesterol, LDL cholesterol, and triglycerides) and body compositionvalues. Results: Serum High Density Lipoprotein (HDL) cholesterol was positively associated with BMD at lumbarspine L2 (ρ=0.32, p=0.05). No significant associations were observed between BMD at the lumbar spineand LDL cholesterol, triglycerides or with total cholesterol.Conclusion: These results suggest a significant positive association between bone mineral density and HDL-cholesterol in Hispanics with type-2 diabetes independent of: age, gender, insulin and HbA1c. Prospectivestudies are needed to confirm a causal relationship between HDL cholesterol and BMD measurements.
Keywords: HDL cholesterol, LDL cholesterol, osteoporosis, bone density, bone metabolism
Address for correspondence: Zaida R. Cordero-MacIntyre, PhD.Center for Health Disparities and Molecular Medicine, School ofMedicine and School of Public Health, Loma Linda University,Loma Linda, CA 92350.Tel: (909) 558-1000 Ext: 47172Email: [email protected]
IJBCR 11.3 & 4_inners_IJBCR 11.3 & 4_inners.qxd 02/01/2014 12:59 Page 113

observations, a well-known fact is that osteoblast andosteoclast activity are fundamental to bone integrityand any disturbance in the coordination ofosteogenic processes impairs bone strength [7]. Thedisruptive effect of serum lipids on osteogenic activ-ity has been demonstrated in bone cells, in whichminimally oxidized LDL cholesterol inhibitsosteoblast differentiation [8]. This effect promotesbone resorption [9, 10] and contributes to BMDreduction [ 8]. Nonetheless, contradictory findings instudies of BMD vis-a-vis serum lipids necessitates theunderstanding of the role of dyslipidemia in bonedisorders, especially in the Hispanic population whohave been inadequately studied.A particularly important group with inadequate
access to health care is the expanding Hispanic pop-ulation. According to Mead et al. (2008) [11], the USpopulation is approximately 67% non-Hispanicwhite, 1% American Indian/ Alaska Native, 12%Black, and 14% Hispanic. By 2050, minority popula-tions are expected to increase to 50% of the total USpopulation and the largest increase will be observedin the Hispanic population, reaching up to 30% [12].Hispanics are reported to have inadequate access todiabetes prevention programs [13], poor nutrition,and greater rates of obesity compared to non-Hispanic whites [14]. It is therefore not surprising thatHispanics are two times more likely to have diabetescompared to non-Hispanic whites [11, 15] and have adiabetes prevalence of 11.8% in those 20 or older,which is greater than the national statistics - 11.3%[16]. Identifying patients at risk for osteoporosis (OP) is
an important goal for improving health care out-comes. One emerging health issue is the recognitionof diabetes as a risk for OP related fractures. Theincrease in DM prevalence in our nation, particularlyin the Hispanic population, suggests that this groupmay pose a specific vulnerable population for OPand the complication of fragility fractures. Earlierstudies have suggested a relationship betweenlipoproteins and BMD but, to our knowledge, nostudy to date has examined this relationship in ourever enlarging Hispanic population.
Materials and methods
SubjectsThis study population is based on a previousprospective study cohort of 39 Hispanic participants(16 males and 23 females) with type-2 diabetes(duration greater than 5 years), and average BMI of31.67 kg/m2 [17]. The original aim of this study wasto examine bone mineral density (BMD) in Hispanicswith type-2 diabetes focusing on the potential effectof serum lipids. Study participants were excluded ifthey had any of the following conditions: a history ofalcohol or drug abuse; were pregnant or lactating;had an impaired mental state; were on steroid therapy;had any neurologic, endocrine, hepatic or other systemic disease; had a pacemaker, or had a history
of heart disease. All thirty-nine participants, whoseprimary language was Spanish, were recruited fromsurrounding San Bernardino and Riverside countiesin Southern California via Spanish radio stations andnewspaper announcements; flyers were also distrib-uted around markets and ambulatory care clinicswithin the Hispanic community. Physical activity,medical and diet histories of participants wereobtained via personal and telephone interviews.Because of the limited access to health care of thestudy subjects, accurate self-reported medication usewas not available. All study participants gaveinformed consent and the study protocol wasapproved by the Loma Linda University InstitutionalReview Board.
Outcome measuresBone mineral density was measured using theHologic Fan Beam DXA (Discovery A, software V12.6. Bedford, MA). BMD measurements in the lum-bar spine (L1 through L4 are the four vertebra of thelumbar spine with L5 being just above the sacrum)were obtained with participant in the supine position.For each assessment, scan time was about 3 minutesat a radiation exposure of 1.5 mrem. These scanswere read and signed by a qualified radiologist atbaseline. Assessments were conducted according tostandard procedures [18].
Serum cholesterol and triglyceride values wereobtained after 12-14 hours fasting and analyzed usingthe Beckman CX7 instrument (Beckman Coulter,Fullerton, California). Serum high-density lipoprotein(HDL) cholesterol and low-density lipoprotein (LDL)cholesterol were analyzed using the Beckman CX4CEinstrument. Each measurement was obtained accord-ing to standard procedures [18]. Serum lipid measure-ments were done at the Loma Linda UniversityMedical Center clinical laboratory, California
Serum insulin was measured by radioimmunoassay(Quest Diagnostics, Teterboro, New Jersey; NicholsInstitute Diagnostics, San Juan Capistrano, California)using guinea pig antibodies to the porcine 125I-insulin(Linco Research, Inc., St. Louis, Missouri) radioactivetracer. Serum glucose was determined by reactingsubjects’ serum with glucose oxidase, which convertsglucose to gluconolactone. Hemoglobin A1c wastested at the Loma Linda University Medical CenterLaboratory. The test is a boronate affinity bindingassay that measures and reports percent glycated hemoglobin and is also standardized toreport percent hemoglobin A1c.
Statistical analysesStatistical analyses were conducted using the SPSSv22 and the Statistical Analysis System (SAS) softwareversion 9.3. Normality of data was determined usingthe Kolmogorov-Smirnov test. Non-normal data werelog-transformed and then included in the statisticalmodels. The variables that were non-normal are
W Lawrence Beeson et al114
IJBCR 11.3 & 4_inners_IJBCR 11.3 & 4_inners.qxd 02/01/2014 12:59 Page 114
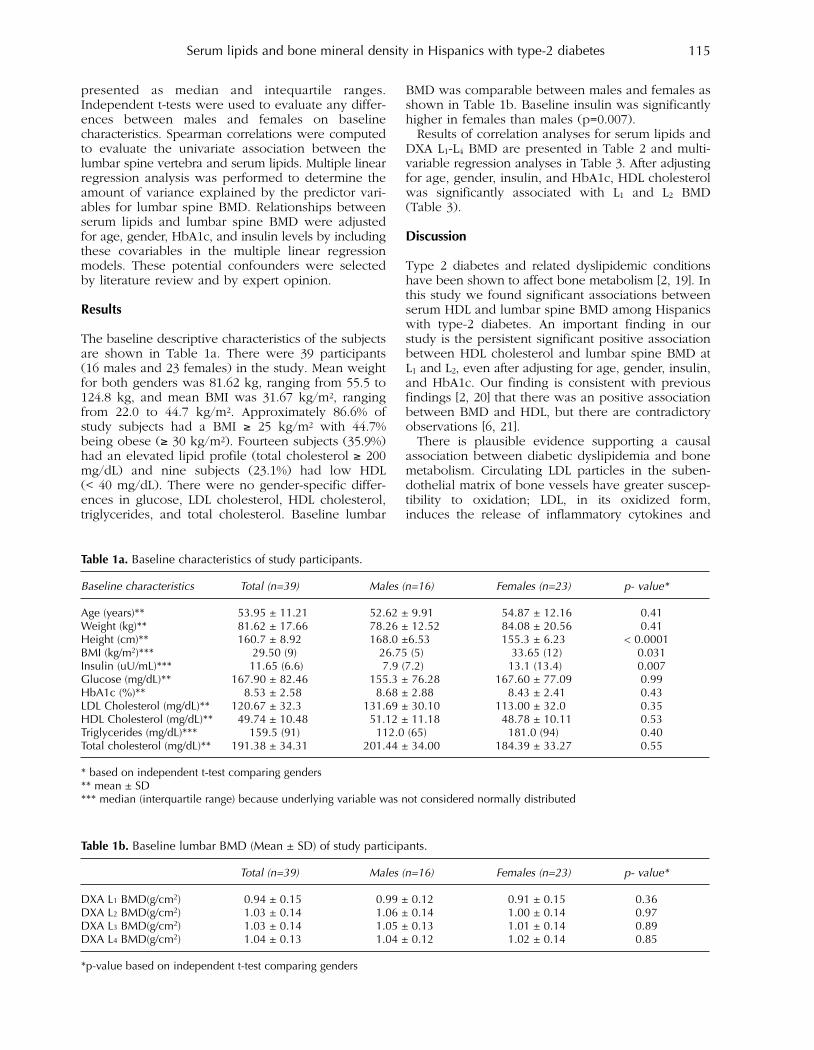
presented as median and intequartile ranges.Independent t-tests were used to evaluate any differ-ences between males and females on baseline characteristics. Spearman correlations were computedto evaluate the univariate association between thelumbar spine vertebra and serum lipids. Multiple linearregression analysis was performed to determine theamount of variance explained by the predictor vari-ables for lumbar spine BMD. Relationships betweenserum lipids and lumbar spine BMD were adjustedfor age, gender, HbA1c, and insulin levels by includingthese covariables in the multiple linear regressionmodels. These potential confounders were selectedby literature review and by expert opinion.
Results
The baseline descriptive characteristics of the subjectsare shown in Table 1a. There were 39 participants(16 males and 23 females) in the study. Mean weightfor both genders was 81.62 kg, ranging from 55.5 to124.8 kg, and mean BMI was 31.67 kg/m2, rangingfrom 22.0 to 44.7 kg/m2. Approximately 86.6% ofstudy subjects had a BMI ≥ 25 kg/m2 with 44.7%being obese (≥ 30 kg/m2). Fourteen subjects (35.9%)had an elevated lipid profile (total cholesterol ≥ 200mg/dL) and nine subjects (23.1%) had low HDL (< 40 mg/dL). There were no gender-specific differ-ences in glucose, LDL cholesterol, HDL cholesterol,triglycerides, and total cholesterol. Baseline lumbar
BMD was comparable between males and females asshown in Table 1b. Baseline insulin was significantlyhigher in females than males (p=0.007).Results of correlation analyses for serum lipids and
DXA L1-L4 BMD are presented in Table 2 and multi-variable regression analyses in Table 3. After adjustingfor age, gender, insulin, and HbA1c, HDL cholesterolwas significantly associated with L1 and L2 BMD(Table 3).
Discussion
Type 2 diabetes and related dyslipidemic conditionshave been shown to affect bone metabolism [2, 19]. Inthis study we found significant associations betweenserum HDL and lumbar spine BMD among Hispanicswith type-2 diabetes. An important finding in ourstudy is the persistent significant positive associationbetween HDL cholesterol and lumbar spine BMD atL1 and L2, even after adjusting for age, gender, insulin,and HbA1c. Our finding is consistent with previousfindings [2, 20] that there was an positive associationbetween BMD and HDL, but there are contradictoryobservations [6, 21]. There is plausible evidence supporting a causal
association between diabetic dyslipidemia and bonemetabolism. Circulating LDL particles in the suben-dothelial matrix of bone vessels have greater suscep-tibility to oxidation; LDL, in its oxidized form,induces the release of inflammatory cytokines and
Serum lipids and bone mineral density in Hispanics with type-2 diabetes 115
Table 1a. Baseline characteristics of study participants.
Baseline characteristics Total (n=39) Males (n=16) Females (n=23) p- value*
Age (years)** 53.95 ± 11.21 52.62 ± 9.91 54.87 ± 12.16 0.41Weight (kg)** 81.62 ± 17.66 78.26 ± 12.52 84.08 ± 20.56 0.41Height (cm)** 160.7 ± 8.92 168.0 ±6.53 155.3 ± 6.23 < 0.0001BMI (kg/m2)*** 29.50 (9) 26.75 (5) 33.65 (12) 0.031Insulin (uU/mL)*** 11.65 (6.6) 7.9 (7.2) 13.1 (13.4) 0.007Glucose (mg/dL)** 167.90 ± 82.46 155.3 ± 76.28 167.60 ± 77.09 0.99HbA1c (%)** 8.53 ± 2.58 8.68 ± 2.88 8.43 ± 2.41 0.43LDL Cholesterol (mg/dL)** 120.67 ± 32.3 131.69 ± 30.10 113.00 ± 32.0 0.35HDL Cholesterol (mg/dL)** 49.74 ± 10.48 51.12 ± 11.18 48.78 ± 10.11 0.53Triglycerides (mg/dL)*** 159.5 (91) 112.0 (65) 181.0 (94) 0.40Total cholesterol (mg/dL)** 191.38 ± 34.31 201.44 ± 34.00 184.39 ± 33.27 0.55
* based on independent t-test comparing genders** mean ± SD*** median (interquartile range) because underlying variable was not considered normally distributed
Table 1b. Baseline lumbar BMD (Mean ± SD) of study participants.
Total (n=39) Males (n=16) Females (n=23) p- value*
DXA L1 BMD(g/cm2) 0.94 ± 0.15 0.99 ± 0.12 0.91 ± 0.15 0.36DXA L2 BMD(g/cm2) 1.03 ± 0.14 1.06 ± 0.14 1.00 ± 0.14 0.97DXA L3 BMD(g/cm2) 1.03 ± 0.14 1.05 ± 0.13 1.01 ± 0.14 0.89DXA L4 BMD(g/cm2) 1.04 ± 0.13 1.04 ± 0.12 1.02 ± 0.14 0.85
*p-value based on independent t-test comparing genders
IJBCR 11.3 & 4_inners_IJBCR 11.3 & 4_inners.qxd 02/01/2014 12:59 Page 115
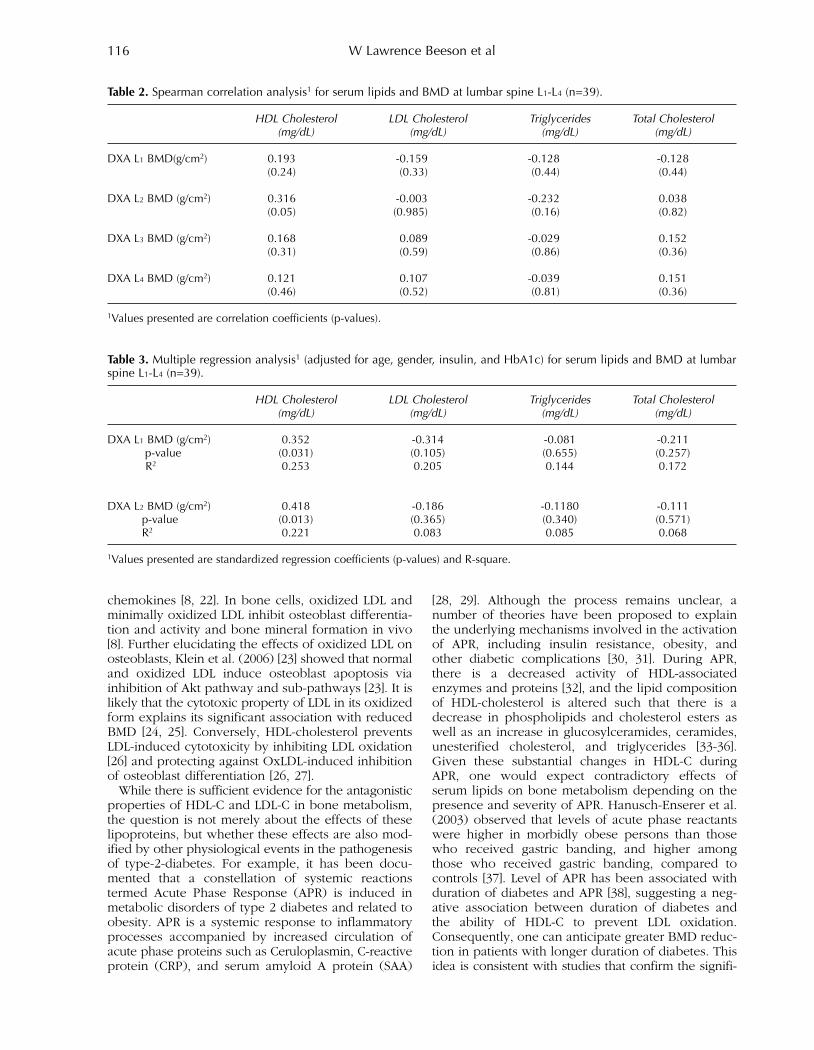
chemokines [8, 22]. In bone cells, oxidized LDL andminimally oxidized LDL inhibit osteoblast differentia-tion and activity and bone mineral formation in vivo[8]. Further elucidating the effects of oxidized LDL onosteoblasts, Klein et al. (2006) [23] showed that normaland oxidized LDL induce osteoblast apoptosis viainhibition of Akt pathway and sub-pathways [23]. It islikely that the cytotoxic property of LDL in its oxidizedform explains its significant association with reducedBMD [24, 25]. Conversely, HDL-cholesterol preventsLDL-induced cytotoxicity by inhibiting LDL oxidation[26] and protecting against OxLDL-induced inhibitionof osteoblast differentiation [26, 27]. While there is sufficient evidence for the antagonistic
properties of HDL-C and LDL-C in bone metabolism,the question is not merely about the effects of theselipoproteins, but whether these effects are also mod-ified by other physiological events in the pathogenesisof type-2-diabetes. For example, it has been docu-mented that a constellation of systemic reactionstermed Acute Phase Response (APR) is induced inmetabolic disorders of type 2 diabetes and related toobesity. APR is a systemic response to inflammatoryprocesses accompanied by increased circulation ofacute phase proteins such as Ceruloplasmin, C-reactiveprotein (CRP), and serum amyloid A protein (SAA)
[28, 29]. Although the process remains unclear, anumber of theories have been proposed to explainthe underlying mechanisms involved in the activationof APR, including insulin resistance, obesity, andother diabetic complications [30, 31]. During APR,there is a decreased activity of HDL-associatedenzymes and proteins [32], and the lipid compositionof HDL-cholesterol is altered such that there is adecrease in phospholipids and cholesterol esters aswell as an increase in glucosylceramides, ceramides,unesterified cholesterol, and triglycerides [33-36].Given these substantial changes in HDL-C duringAPR, one would expect contradictory effects ofserum lipids on bone metabolism depending on thepresence and severity of APR. Hanusch-Enserer et al.(2003) observed that levels of acute phase reactantswere higher in morbidly obese persons than thosewho received gastric banding, and higher amongthose who received gastric banding, compared tocontrols [37]. Level of APR has been associated withduration of diabetes and APR [38], suggesting a neg-ative association between duration of diabetes andthe ability of HDL-C to prevent LDL oxidation.Consequently, one can anticipate greater BMD reduc-tion in patients with longer duration of diabetes. Thisidea is consistent with studies that confirm the signifi-
W Lawrence Beeson et al116
Table 2. Spearman correlation analysis1 for serum lipids and BMD at lumbar spine L1-L4 (n=39).
HDL Cholesterol LDL Cholesterol Triglycerides Total Cholesterol(mg/dL) (mg/dL) (mg/dL) (mg/dL)
DXA L1 BMD(g/cm2) 0.193 -0.159 -0.128 -0.128(0.24) (0.33) (0.44) (0.44)
DXA L2 BMD (g/cm2) 0.316 -0.003 -0.232 0.038(0.05) (0.985) (0.16) (0.82)
DXA L3 BMD (g/cm2) 0.168 0.089 -0.029 0.152(0.31) (0.59) (0.86) (0.36)
DXA L4 BMD (g/cm2) 0.121 0.107 -0.039 0.151(0.46) (0.52) (0.81) (0.36)
1Values presented are correlation coefficients (p-values).
Table 3. Multiple regression analysis1 (adjusted for age, gender, insulin, and HbA1c) for serum lipids and BMD at lumbarspine L1-L4 (n=39).
HDL Cholesterol LDL Cholesterol Triglycerides Total Cholesterol(mg/dL) (mg/dL) (mg/dL) (mg/dL)
DXA L1 BMD (g/cm2) 0.352 -0.314 -0.081 -0.211p-value (0.031) (0.105) (0.655) (0.257)R2 0.253 0.205 0.144 0.172
DXA L2 BMD (g/cm2) 0.418 -0.186 -0.1180 -0.111p-value (0.013) (0.365) (0.340) (0.571)R2 0.221 0.083 0.085 0.068
1Values presented are standardized regression coefficients (p-values) and R-square.
IJBCR 11.3 & 4_inners_IJBCR 11.3 & 4_inners.qxd 02/01/2014 12:59 Page 116
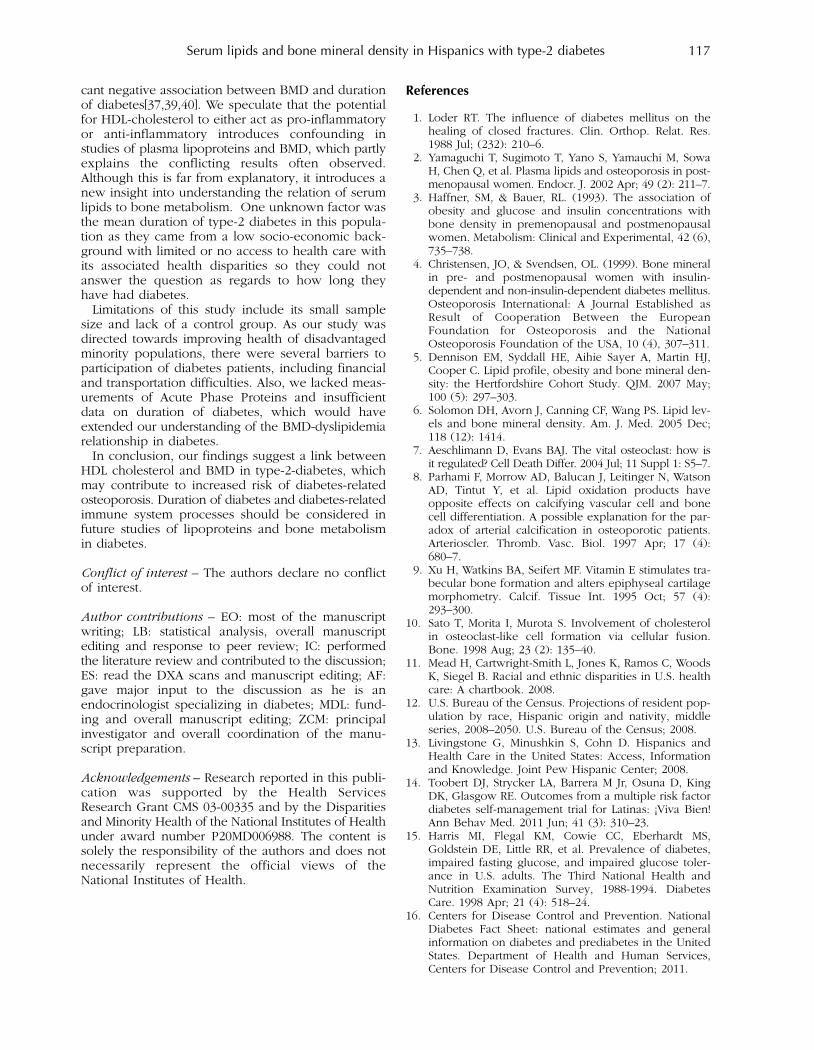
cant negative association between BMD and durationof diabetes[37,39,40]. We speculate that the potentialfor HDL-cholesterol to either act as pro-inflammatoryor anti-inflammatory introduces confounding in studies of plasma lipoproteins and BMD, which partlyexplains the conflicting results often observed.Although this is far from explanatory, it introduces anew insight into understanding the relation of serumlipids to bone metabolism. One unknown factor wasthe mean duration of type-2 diabetes in this popula-tion as they came from a low socio-economic back-ground with limited or no access to health care withits associated health disparities so they could notanswer the question as regards to how long theyhave had diabetes.Limitations of this study include its small sample
size and lack of a control group. As our study wasdirected towards improving health of disadvantagedminority populations, there were several barriers toparticipation of diabetes patients, including financialand transportation difficulties. Also, we lacked meas-urements of Acute Phase Proteins and insufficientdata on duration of diabetes, which would haveextended our understanding of the BMD-dyslipidemiarelationship in diabetes. In conclusion, our findings suggest a link between
HDL cholesterol and BMD in type-2-diabetes, whichmay contribute to increased risk of diabetes-relatedosteoporosis. Duration of diabetes and diabetes-relatedimmune system processes should be considered infuture studies of lipoproteins and bone metabolismin diabetes.
Conflict of interest – The authors declare no conflictof interest.
Author contributions – EO: most of the manuscriptwriting; LB: statistical analysis, overall manuscriptediting and response to peer review; IC: performedthe literature review and contributed to the discussion;ES: read the DXA scans and manuscript editing; AF:gave major input to the discussion as he is anendocrinologist specializing in diabetes; MDL: fund-ing and overall manuscript editing; ZCM: principalinvestigator and overall coordination of the manu-script preparation.
Acknowledgements – Research reported in this publi-cation was supported by the Health ServicesResearch Grant CMS 03-00335 and by the Disparitiesand Minority Health of the National Institutes of Healthunder award number P20MD006988. The content issolely the responsibility of the authors and does notnecessarily represent the official views of theNational Institutes of Health.
References
1. Loder RT. The influence of diabetes mellitus on thehealing of closed fractures. Clin. Orthop. Relat. Res.1988 Jul; (232): 210–6.
2. Yamaguchi T, Sugimoto T, Yano S, Yamauchi M, SowaH, Chen Q, et al. Plasma lipids and osteoporosis in post-menopausal women. Endocr. J. 2002 Apr; 49 (2): 211–7.
3. Haffner, SM, & Bauer, RL. (1993). The association ofobesity and glucose and insulin concentrations withbone density in premenopausal and postmenopausalwomen. Metabolism: Clinical and Experimental, 42 (6),735–738.
4. Christensen, JO, & Svendsen, OL. (1999). Bone mineralin pre- and postmenopausal women with insulin-dependent and non-insulin-dependent diabetes mellitus.Osteoporosis International: A Journal Established asResult of Cooperation Between the EuropeanFoundation for Osteoporosis and the NationalOsteoporosis Foundation of the USA, 10 (4), 307–311.
5. Dennison EM, Syddall HE, Aihie Sayer A, Martin HJ,Cooper C. Lipid profile, obesity and bone mineral den-sity: the Hertfordshire Cohort Study. QJM. 2007 May;100 (5): 297–303.
6. Solomon DH, Avorn J, Canning CF, Wang PS. Lipid lev-els and bone mineral density. Am. J. Med. 2005 Dec;118 (12): 1414.
7. Aeschlimann D, Evans BAJ. The vital osteoclast: how isit regulated? Cell Death Differ. 2004 Jul; 11 Suppl 1: S5–7.
8. Parhami F, Morrow AD, Balucan J, Leitinger N, WatsonAD, Tintut Y, et al. Lipid oxidation products haveopposite effects on calcifying vascular cell and bonecell differentiation. A possible explanation for the par-adox of arterial calcification in osteoporotic patients.Arterioscler. Thromb. Vasc. Biol. 1997 Apr; 17 (4):680–7.
9. Xu H, Watkins BA, Seifert MF. Vitamin E stimulates tra-becular bone formation and alters epiphyseal cartilagemorphometry. Calcif. Tissue Int. 1995 Oct; 57 (4):293–300.
10. Sato T, Morita I, Murota S. Involvement of cholesterolin osteoclast-like cell formation via cellular fusion.Bone. 1998 Aug; 23 (2): 135–40.
11. Mead H, Cartwright-Smith L, Jones K, Ramos C, WoodsK, Siegel B. Racial and ethnic disparities in U.S. healthcare: A chartbook. 2008.
12. U.S. Bureau of the Census. Projections of resident pop-ulation by race, Hispanic origin and nativity, middleseries, 2008–2050. U.S. Bureau of the Census; 2008.
13. Livingstone G, Minushkin S, Cohn D. Hispanics andHealth Care in the United States: Access, Informationand Knowledge. Joint Pew Hispanic Center; 2008.
14. Toobert DJ, Strycker LA, Barrera M Jr, Osuna D, KingDK, Glasgow RE. Outcomes from a multiple risk factordiabetes self-management trial for Latinas: ¡Viva Bien!Ann Behav Med. 2011 Jun; 41 (3): 310–23.
15. Harris MI, Flegal KM, Cowie CC, Eberhardt MS,Goldstein DE, Little RR, et al. Prevalence of diabetes,impaired fasting glucose, and impaired glucose toler-ance in U.S. adults. The Third National Health andNutrition Examination Survey, 1988-1994. DiabetesCare. 1998 Apr; 21 (4): 518–24.
16. Centers for Disease Control and Prevention. NationalDiabetes Fact Sheet: national estimates and generalinformation on diabetes and prediabetes in the UnitedStates. Department of Health and Human Services,Centers for Disease Control and Prevention; 2011.
Serum lipids and bone mineral density in Hispanics with type-2 diabetes 117
IJBCR 11.3 & 4_inners_IJBCR 11.3 & 4_inners.qxd 02/01/2014 12:59 Page 117

17. Ojo E, Beeson L, Shulz E, Firek A, De Leon M, BalcazarH, et al. Effect of the EnBalance, a culturally and lan-guage-sensitive diabetes education program, ondietary changes and plasma lipid profile in Hispanicdiabetics. International Journal of Body CompositionResearch. 2010; 8 (Supp): S69–S76.
18. Going SB, Massett MP, Hall MC, Bare LA, Root PA,Williams DP, et al. Detection of small changes in bodycomposition by dual-energy x-ray absorptiometry. Am.J. Clin. Nutr. 1993 Jun; 57 (6): 845–50.
19. Krakauer JC, McKenna MJ, Buderer NF, Rao DS,Whitehouse FW, Parfitt AM. Bone Loss and BoneTurnover in Diabetes. Diabetes. 1995 Jul 1; 44 (7):775–82.
20. Jeong I-K, Cho SW, Kim SW, Choi HJ, Park KS, Kim SY,et al. Lipid profiles and bone mineral density in pre-and postmenopausal women in Korea. Calcif. TissueInt. 2010 Dec; 87 (6): 507–12.
21. Brownbill RA, Ilich JZ. Lipid profile and bone paradox:higher serum lipids are associated with higher bonemineral density in postmenopausal women. J WomensHealth (Larchmt). 2006 Apr; 15 (3): 261–70.
22. Graham LS, Parhami F, Tintut Y, Kitchen CMR, DemerLL, Effros RB. Oxidized lipids enhance RANKL produc-tion by T lymphocytes: implications for lipid-inducedbone loss. Clin. Immunol. 2009 Nov; 133 (2): 265–75.
23. Klein BY, Kerem Z, Rojansky N. LDL induces Saos2osteoblasts death via Akt pathways responsive to aneutral sphingomyelinase inhibitor. J. Cell. Biochem.2006 Jun 1; 98 (3): 661–71.
24. Poli A, Bruschi F, Cesana B, Rossi M, Paoletti R,Crosignani PG. Plasma low-density lipoprotein choles-terol and bone mass densitometry in postmenopausalwomen. Obstet Gynecol. 2003 Nov; 102 (5 Pt 1): 922–6.
25. Makovey J, Chen JS, Hayward C, Williams FMK,Sambrook PN. Association between serum cholesteroland bone mineral density. Bone. 2009 Feb; 44 (2):208–13.
26. Mackness MI, Durrington PN. HDL, its enzymes and itspotential to influence lipid peroxidation. Atherosclerosis.1995 Jun; 115 (2): 243–53.
27. Hessler JR, Robertson AL Jr, Chisolm GM 3rd. LDL-induced cytotoxicity and its inhibition by HDL inhuman vascular smooth muscle and endothelial cellsin culture. Atherosclerosis. 1979 Mar; 32 (3): 213–29.
28. Pepys MB, Baltz ML. Acute phase proteins with specialreference to C-reactive protein and related proteins(pentaxins) and serum amyloid A protein. Adv.Immunol. 1983; 34: 141–212.
29. Benditt EP, Eriksen N, Hanson RH. Amyloid proteinSAA is an apoprotein of mouse plasma high densitylipoprotein. Proc. Natl. Acad. Sci. U.S.A. 1979 Aug; 76(8): 4092–6.
30. Pickup JC, Crook MA. Is type II diabetes mellitus a disease of the innate immune system? Diabetologia.1998 Oct; 41 (10): 1241–8.
31. Gabay C, Kushner I. Acute-phase proteins and othersystemic responses to inflammation. N. Engl. J. Med.1999 Feb 11; 340 (6): 448–54.
32. Jahangiri A. High-density lipoprotein and the acutephase response. Current Opinion in Endocrinology,Diabetes and Obesity. 2010 Apr; 17 (2): 156–60.
33. Grimble RF. Inflammatory status and insulin resistance.Curr Opin Clin Nutr Metab Care. 2002 Sep; 5 (5):551–9.
34. Pradhan AD, Ridker PM. Do atherosclerosis and type 2diabetes share a common inflammatory basis? Eur.Heart J. 2002 Jun; 23 (11): 831–4.
35. Khovidhunkit W, Kim M-S, Memon RA, Shigenaga JK,Moser AH, Feingold KR, et al. Effects of infection andinflammation on lipid and lipoprotein metabolism:mechanisms and consequences to the host. J. LipidRes. 2004 Jul; 45 (7): 1169–96.
36. Van Lenten BJ, Hama SY, de Beer FC, Stafforini DM,McIntyre TM, Prescott SM, et al. Anti-inflammatoryHDL becomes pro-inflammatory during the acutephase response. Loss of protective effect of HDLagainst LDL oxidation in aortic wall cell cocultures. J.Clin. Invest. 1995 Dec; 96 (6): 2758–67.
37. Hanusch-Enserer U, Cauza E, Spak M, Dunky A, RosenHR, Wolf H, et al. Acute-phase response and immuno-logical markers in morbid obese patients and patientsfollowing adjustable gastric banding. Int. J. Obes.Relat. Metab. Disord. 2003 Mar; 27 (3): 355–61.
38. Shamim S, D’Souza V, Manjrekar P. Acute PhaseProteins in newly diagnosed diabetics. BiomedicalResearch. 2008; 19 (1): 49–53.
39. Kao CH, Tsou CT, Chen CC, Wang SJ. Bone mineraldensity in patients with noninsulin-dependent diabetesmellitus by dual photon absorptiometry. Nucl MedCommun. 1993 May; 14 (5): 373–7.
40. Wakasugi M, Wakao R, Tawata M, Gan N, Koizumi K,Onaya T. Bone mineral density measured by dualenergy x-ray absorptiometry in patients with non-insulin-dependent diabetes mellitus. Bone. 1993; 14(1): 29–33.
W Lawrence Beeson et al118
IJBCR 11.3 & 4_inners_IJBCR 11.3 & 4_inners.qxd 02/01/2014 12:59 Page 118


International Journal of Body Composition Research Volume 11, Numbers 3 & 4, 2013 [67–118]
Generation of normal ranges for measures of body composition in adults based on bioelectrical impedance analysis using the seca mBCA S PEINE, S KNABE, I CARRERO, M BRUNDERT, J WILHELM, A EWERT, U DENZER, B JENSEN and P LILBURN 67
Waist circumference cannot be improved as an index of abdominal visceral fatness by combining it with correlates of abdominal subcutaneous fat or non-fat tissue RICHARD F BURTON and MICHAEL E J LEAN 77
Anthropometric indices as measures of body fat assessed by DXA in relation to cardiovascular risk factors in children and adolescents: NHANES 1999-2004 ZHAOHUI CUI, KIMBERLY P TRUESDALE, JIANWEN CAI, MICHAELA B KOONTZ andJUNE STEVENS 85
Comparison between prone and supine DXA measurements in men with chronic spinal cord injury CHRISTOPHER R HARNISH, JONATHAN A DANIELS, ROY T SABO and TIMOTHY LAVIS 97
Four-compartment model: effect of biological aging and gender differences L P NOVAK 105
Serum lipids and bone mineral density in hispanics with type-2 diabetes W LAWRENCE BEESON, EMMANUEL A OJO, IHUOMA CHUKWUEKE, ELOY SCHULZ, ANTHONY FIREK, MARINO DE LEON and ZAIDA CORDERO-MACINTYRE 113
ISSN: 1479–456XSMITH-GORDON
www.ijbcr.co
Intern
ational Jo
urn
al of B
ody C
om
positio
n R
esearch: 2013
Volu
me 11 N
um
bers 3 &
4 pages 67–116
IJBCR 2013: 11, Numbers 3 & 4: 35–66 ISSN 1479–456X
2013 Volume 11 Numbers 3 & 4
International Journal of
Body Composition Research
EditorAnja Bosy-Westphal, Stuttgart
Editorial board
www.ijbcr.co
Published bySmith-Gordon
Steven B. Heymsfield, Baton RougeTim R. Nagy, Birmingham ALKristina Norman, BerlinAngelo Pietrobelli, VeronaGuy Plasqui, Maastricht
Leanne Redman, Baton RougeWei Shen, New York
Analiza Monica Silva, LisbonMarjolein Visser, AmsterdamZiMiang Wang, New York
IJBCR 11.3 & 4_Cover_IJBCR 11.3 & 4_Cover.qxd 02/01/2014 13:00 Page 1


![The Oregon Daily Journal. (Portland, OR) 1907-05-28 [p 8].€¦ · THE.OREGON 'DAILY JOU.'NAL, PORTLAND." TUESDAY J EVENING, MAY 3;.1007. STATE GRANGE FIFTy-SI-X WILL , FWERiy SALES](https://static.fdocuments.us/doc/165x107/5f7e80a2b933f144d635f946/the-oregon-daily-journal-portland-or-1907-05-28-p-8-theoregon-daily-jounal.jpg)


![Stephen Toulmin - University of Florida College of … Critical Consideration of Stephen Toulmin's Contributions to Composition" (Jour-nal of Advanced Composition 17 [1997]: 95-107).](https://static.fdocuments.us/doc/165x107/5b1e2a3d7f8b9a901f8b4f74/stephen-toulmin-university-of-florida-college-of-critical-consideration-of-stephen.jpg)