Nagoya STUDIES ON BLOOD VISCOSITY DURING … · STUDIES ON BLOOD VISCOSITY DURING EXTRACORPOREAL...
26
Nagoya ]. med. Sci. 31: 25-50, 1967. STUDIES ON BLOOD VISCOSITY DURING EXTRACORPOREAL CIRCULATION HrsASHI NAGASHIMA 1st Department of Surgery, Nagoya University School of Medicine (Director: Prof Yoshio Hashimoto) ABSTRA CT Blood viscosity was studied during extracorporeal circulation by means of a cone in cone viscometer. This rotational viscometer provides sixteen kinds of shear rate, rang ing from 0.05 to 250.2 sec- 1 • Mer its and demerits of the e quipment were described comparing with the capillary viscometer. In experimental study it was well demonstrated that the whole blood viscosity showed the shear rate dependency at all hematocrit levels. The influence of the temperature change on the whole blood viscosity was clearly seen when hemato· crit was high and shear rate low. The plasma viscosity was 1.8 cp. at 37°C and Newtonianlike b ehavior was observed at the same temperature. ·In the hypothermic condition plasma showed shear rate d ependency. Viscosity of 10% LMWD was over 2.2 fold as high as that of plasma. The increase of COz content resulted in a constant increase in whole blood viscosity and the increased whole blood viscosity after C02 insufflation, rapidly decreased returning to a little higher level than that in untreated group within 3 minutes. Clinical data were obtained from 27 patients who underwent hypothermic hemodilution perfusion. In the cyanotic group, w hole blood was much more viscous than in the non- cyanotic. During bypass, hemodilution had greater influence upon whole blood viscosity than hypothermia, but it went inversely upon the plasma viscosity. The whole blood viscosity was more dependent on dilution rate than amount of dilue nt in mljkg. The venous mixture was a littl e higher as to its viscosity than that of the oxygenat ed whole b lood and the above phe nomenon became more pronounced within low shear rate range. Peripheral circulation was discussed in relation to the blo od viscosity. PREFACE In recent years a considerable number of reports h as been published on open heart surgery. However, few viscometric studies during extracorporeal circulation using a rotational viscometer have been made. :lit Received for publication September 27, 1967.
Transcript of Nagoya STUDIES ON BLOOD VISCOSITY DURING … · STUDIES ON BLOOD VISCOSITY DURING EXTRACORPOREAL...

Nagoya ]. med. Sci. 31: 25-50, 1967.
STUDIES ON BLOOD VISCOSITY DURING EXTRACORPOREAL CIRCULATION
HrsASHI NAGASHIMA
1st Department of Surgery, Nagoya University School of Medicine (Director: Prof Yoshio Hashimoto)
ABSTRACT
Blood viscosity was studied during extracorporeal circulation by means of a cone in cone viscometer. This rotational viscometer provides sixteen kinds of shear rate, ranging from 0.05 to 250.2 sec-1 •
Merits and demerits of the equipment were described comparing with the capillary viscometer.
In experimental study it was well demonstrated that the whole blood viscosity showed the shear rate dependency at all hematocrit levels. The influence of the temperature change on the whole blood viscosity was clearly seen when hemato· crit was high and shear rate low.
The plasma viscosity was 1.8 cp. at 37°C and Newtonianlike behavior was observed at the same temperature. ·In the hypothermic condition plasma showed shear rate dependency.
Viscosity of 10% LMWD was over 2.2 fold as high as that of plasma. The increase of COz content resulted in a constant increase in whole blood
viscosity and the increased whole blood viscosity after C02 insufflation, rapidly decreased returning to a little higher level than that in untreated group within 3 minutes.
Clinical data were obtained from 27 patients who underwent hypothermic hemodilution perfusion.
In the cyanotic group, w hole blood was much more viscous than in the noncyanotic.
During bypass, hemodilution had greater influence upon whole blood viscosity than hypothermia, but it went inversely upon the plasma viscosity.
The whole blood viscosity was more dependent on dilution rate than amount of diluent in mljkg.
The venous mixture was a little higher as to its viscosity than that of the oxygenated whole blood and the above phenomenon became more pronounced within low shear rate range.
Peripheral circulation was discussed in relation to the b lood viscosity.
PREFACE
In recent years a considerable number of reports has been published on open heart surgery. However, few viscometric studies during extracorporeal circulation using a rotational viscometer have been made.
:lit M~ ~ Received for publication September 27, 1967.

26 H. NAGASHIMA
The need for a large volume of blood for initial priming of the pumpoxy
genator has presented a difficult problem for the patient with cardiac disease;
thus the ideas such · as reduced flow, moderate hypothermia, and hemodilution,
have been under investigation in regard to perfusion technics1', while these
three factors have great influences on the blood viscosity.
On the other hand, blood has been understood as a non-Newtonian fluid
from the rheological point of view. The rotational viscometer is the most
adequate apparatus to measure the viscosity of fluid of that nature.
The present report deals with the effect of hypothermic perfusion with
hemodilution and the related factors on .blood viscosity measured by means of
a cone in cone viscometer.
HISTORICAL REVIEW
Within recent years, many reports on the methods of extracorporeal cir
culation have accumulated indicating a growing interest in the field of cardio
vascular surgery. In 1937, a heart-lung machine was introduced as an experimental device
by Gibbon21 • The first clinical application of the artificial circulation by Dennis,
in 195PI, resulted in failure. Since Gibbon reported the first successful clinical
use of the apparatus4', many successful cases have been reported by Crafoad5 ' ,
Lillehei61 and Kirklin et al. 7>. Hypothermia, by surface cooling, has extensively been studied by Bigelow8 '
and Swan9 '. Lewis10> made successful closure of the atrial septal defect with
the aid of hypothermia in 1953. Cooling of the blood by extracorporeal circulation is an efficient way of
lowering body temperature. Clinical use of the blood cooling method was
studied by Ross111 , and Brock and Ross12 '. After an efficient heat exchanger
was devleoped by Brown et al. 13 ' in 1958, the combination of hypothermia with
a heart-lung apparatus greatly promoted cardiac surgery.
Well known difficulties in the procurement of a large volume of blood for
initial priming and increased risks by blood transfusions have animated many
attempts to overcome these obstacles. After experimental studies Neptune
and others14 > developed a method of priming the pump-oxygenator without the
need for the donor blood and this method was successfully applied on clinical
cases, and 500 to 1,000 ml of the physiologic saline solution was used for initial priming.
Zuhdi15', Long"> and their coworkers stressed usefulness of hemodilution
with 5% dextrose in water or low molecular weight dextran (LMWD).
From the rheological stand point, Poiseuille's equation17 > was applicable to
the dynamics of flow in rigid tubes. Because of the anomalous flow properties
of blood as a non-Newtonian fluid18', the Poiseuillian law can not be directlv

VISCOSITY STUDIES DURING BYPASS 27
applied to capillary blood flow. By Whittaker19 >, apparent viscosity of blood
changes as velocity of blood changes. Fahraeus and Lindqvist20 > investigated the viscosity of the blood in narrow
capillary tubes and found that when the size of the tube is less than 1 mm in
diameter, the calculated viscosity does not agree with the measured value.
Dix and Scott-Blair21 > explained similar phenomena in colloidal suspension as
sigma effect. Wells and Merrill22 > estimated the shear rate at the wall of the
aorta in a resting normal man roughly as 100 inverse second (sec-1). The shear
rate at the wall of the blood vessel vary unrestrictedly according to the differ·
ences of the radius of the vascular tree. Therefore viscometry done at a fixed
shear rate is not adequate for determining human blood viscosity. In 1961
Wells23 > introduced a cone plate rotational viscometer for measuring viscosity
of biologic fluid. This type of instrument provides a wide ragne of shear
rates and suits for the study of non-Newtonian fluid. In discussing the colloidal
structures of blood utilizing a cone in cone viscometer, Dintenfass24 > stressed
the importance of the shear rates lower than 10 sec-1•
MATERIALS AND METHODS
The report is divided into two parts: part I, experimental studies and part
II, clinical studies.
Part I Fresh blood was obtained from donor dogs heparinized in a dose of 4 mg/kg
of body weight. To carry out series of viscometry on blood samples of
different hematocrit values, the blood was withdrawn into a sterile 500 ml
vials and was centrifuged at 3,000 rpm for 15 minutes. Then plasma was
pipetted to reconstitute the desired hematocrit level. After viscometry, actual
hematocrit of each sample was confirmed using the Wintrobe tube, and
samples not within ± 0.5% of the planned hematocrit value was rejected from
this study. Samples were prepared in water-bath at a desired temperature prior to
studies, and the water-jacketted sample cup of the viscometer were also kept
at the same temperature ranging within ± 0.1 °C. Viscometry was carried out
on the blood at various temperatures and hematocrit levels, and was also
performed on several kinds of diluent. To see the relationship between the blood gas and the blood viscosity, a
further experimental study was carried out. At the bottom of a deep bottle
blood sample was placed, then pure C02 was insufflated without bubbling until
partial pressure of C02 reached 40 to 90 mm Hg at 37°C. With this sample
the viscosity and blood gas content were determined. In other 10 experiments,
after exposure to pure C02 at a partial pressure of 90 mm Hg viscosity was
measured continuously every minute for 15 minutes with a single shear rate

28 H. NAGASHIMA
of 31.1 sec-1•
Part II Clinical data were obtained from 27 patients who underwent hypothermic
hemodilution perfusion for the correction of cardiovascular defects at the Nagoya University Hospital (Table 1). The cases were as follows: tetralogy of Fallot, 13 cases; ventricular septal defect, 5; mitral valve lesion, 4; atrial septal defect, 2; pulmonic stenosis, 2; and aortic valve lesion, 1.
Case Body I No. Sex Age weight
----~1 1 M 11 33.5 2 F 7 20.2 3 F 27 47.5 4 M 25 45.9
,....; 5 F 27 52.9 p. 6 M 5 17.7 ;:; 7 M 8 23.4 0 8 F 10 32.4 .... (!I 9 M 6 14.7
10 F 14 35.2 11 M 13 35.8 12 1\[ 15 40.8 13 F 18 37.0
I
TABLE 1
I 1 Per- Lowest 1
Results Lesion __ op. Pro~:du~:J:~~£ Er~~R~:~~1~
-~-----------~--·~--
TF Total correction 1 TF Total correction 1 TF Total correction 1 TE< Total correction 1 TF Total correction 1 TF Total correction TF Total correction TF Total correction TE< Total correction TF Total correction TF I Total correction TF Total correction TF Total correction
1 1 1 1 1 1 1
14 25.5 10 27.3 49 24.2 77 26.0 48 23.4 94 24.0 49 24.2 26 25.0 15 21.3 08 27.0 89 24.5 32 25.4 48 24.2
25.2 Alive and well 29.3 Alive and well 25.1 Alive and well 24.0 Alive and well 27.7 Alive and well 25.5 Alive and well 25.0 Alive and well 24.9 Alive and well 23.5 Alive and well 23.5 Alive and well 24.2 Alive and well 25.5 Aline and well 24.5 Died, P.O. 2nd D.
------
I 14 ~ 1
1: I
37.7 I 15 17.2 I
I 16 M 5 16.8 17 F 24 46.6 18 F 5 13.5
:I 19
I& 22 43.5
20 5 12.5 ;:; 21 24 58.8 0 22 15 34.5 .... (!I 23 jF 6 18.5
I 24 IF 20 39.1
25
I~ 4 13.9
26 16 41.0 27 43 59.2
AI+ VSD jAnnuloplasty Teflon patch 98
PS Commissurotomy 29 VSD Direct suture 74 ASD Direct suture 60 VSD+PH Teflon patch 1 33 MSI Mitral valve repl 100 VSD+PHTeflon patch ASI Aortic valve rep! 1 PS Out flow patch ASD Direct suture
Aortic valve repl ASI+MS Mitral val. 1
VSD MSI MSI
commissurotomy '!Direct suture Mitral valve rep! 1 Mitral valve rep! 1
91 66 73 46
75
80 99 97
24.0 27.2 Died, P.O. 1st. D.
27.4 30.0 Alive and well 26.8 28.5 Alive and well 27.0 27.6 Alive and well 23.5 26.6 Alive A V block 24.5 24.6 Alive and well 24.9 27.9 Alive and well 25.4 24.6 Alive and well 28.5 27.1 Alive and well 28.8 28.3 Alive and well
23.2 25.0 Died, P.O. 5th. D.
26.0 26.3 Alive and well 26.2 26.1 Died. P.O. 1st. D. 22.4 25.0 Alive and well
---------
Legend: TF Tetralogy of fallot AI Aortic insufficiency VSD Ventricular septal defect ASI Aortic steno-insufficiency ASD Atrial septal defect MS Mitral stenosis
PS Pulmonary stenosis MSI Mitral steno-insufficiency PH Pulmonary hypertension
All cases were anesthetized with N20, 02 and ether by the semiclosed overflow method.
Pump-oxygenator system included two Debakey-type rotary occlusive pumps, a Kay-Cross disc oxygenator and a double helical heat exchanger (Fig. 1) 25 l 29 l,

VISCOSITY STUDIES DURING BYPASS 29
The extracorporeal circuit was primed according to the following formula :
B+ (A~ B)= amount of priming solution. 3/ 4(A-B) ==amount of heparinized
blood, where B equals 1/3 of the daily fluid requirement of the patient of about 30 mljkg and A is the priming volume. Prior to cannulation, 2 mgj kg of bodyweight of heparin was given intravenously, and the same amount of heparin was also installed into the apparatus.
Using a blanket and blood cooling, intraesophageal and rectal temperatures were lowered to 25 to 30°C and the total bypass was established by tightening the caval tapes. When intracardiac correction was accomplished, rewarming was started with a blanket and assisted circulation. The caval tapes were ·re-
• 43 ° ~ 45"
3. 1 tfl'l
W A,, ... luVtlo<.ltt t' l~;~ " /H<.
FIG. 1. Pump Oxygenator System
FJv. 2. Go11:e in Cone Yiscometer

30 H. NAGASHIMA
leased and partial perfusion was continued until the body temperature reached
to 34°C. Oxygen and carbon dioxide were insufflated into the disc oxygenator, with
the flow rate of 5 1/min and 100 cm3/min, respectively.
Blood samples were drawn by venipuncture before and one hour after the
perfusion, employing a 20 ml glass-syringe containing 0.15 ml of heparin
sodium, (7.5 U. per 1 ml of blood). The samples were collected as mixed
venous blood and oxygenated arterial blood during total bypass and at the end
of bypass. Additional samples were obtained at every 30 minutes intervals
during total bypass when the perfusion was continued over bne hour.
All glass-wares used in the study were siliconized.
The viscometer used in these studies was a coaxial cone in cone type, a
kind of rotational viscometer, requireing 5 ml of sample placed between both
cones (Figs. 2, 3 and 4) 27 >28 >.
The external cone was rotated by a constant speed motor which provides
sixteen grades of rotating speeds, representing the following shear rates (Table
2). The angles of the internal cone (a) and the external cone (f/) to the
vertical were 43 and 45 degrees, respectively. The mean shear rates were
calculated by the following equation:
( tanf//2)-1
D= (2w/ fJ -a) (cot a -cot f/) cot a cosec a - cot fJ cosec fJ- Int ·tan a/2 •
FIG. 3. General view of the
viscom~t~r.
FIG. 4. External cone and internal
<;:one i;lurrov.nQ.ed by water jacket.

VISCOSITY STUDIES DRRING BYPASS
TABLE 2. Revolutions per minutes and shear rate
I I Shear Rate 11 R.P.M. (SR) sec-1
' 1 0.025 0.05 2 0.05 0.10 3 0.1 0.21 4 0.2 0.42 5 0.25 0.52 6 0.5 1.04 7 1.0 2.09 8 1.5 3.13
9 10 11 12 13 14 15 16
I I Shear Rate R.P.M. (SR) sec-1
I 2.0 4.17 3.0 6.26 6.0 12.51
12.0 25.0 15.0 31.3 30.0 62.6 60.0 125.1
120.0 250.2
31
where w is the angular velocity of the external rotating cone in radians per second. Temperature control was done by a water jacket that surrounded external cone.
Apparent viscosity was expressed in C. G.S. units of centipoise ( cp. = 1/ 100 poise). Shear rate was defined as the velocity gradient of two fluid planes
divided by ' the distance between them ( cmj~ec =sec -J), and shear stress as
the tangential force per unit area of fluid plane ( dyn/ cm2). Viscosity, by de· finition, is shear stress divided by shear rate (dyn • secjcm2 or poise).
Calibration of the instrument was made using standard viscosity fluid of JS 10, the viscometer calibrating liquid prepared by Showa Oil Co. Ltd., providing constant viscosity of 8.537, 6.083, 4.828 and 3.508 cp. at 20.0, 30.0, 37.8 and 50.0°C, respectively.
Viscosity determination on each sample was carried out beginning from the lower shear rate toward the higher shear rate, keeping the sample at the same temperature as it was withdrawn.
The total protein concentration was determined by a refractometer manufactured by Hitachi Manufac. Co. Ltd. at room temperature. Plasma albumin and globulin were measured by the auto-analyser manufactured by Technicon Co. Ltd. U.S.A. and A/G ratio was calculated. Plasma fibrinogen was determined by the tyros in method29>.
Blood gas analysis was carried out by Van Slyke Neil method30 ••
RESULTS
Part I Relationships among whole blood viscosity, hematocrit and temperature
are presented graphically on log-log · paper in Figs. 5, 6, 7, 8, 9, and 10. At hematocrit level between 20 and 40%, there was a relatively linear rise in viscosity with increasing hematocrit. Over 40%, viscosity increased more sharply and exponentially. For example, at the shear rate of 250 sec-1 at 37°C, the viscosity of the whole blood showed 3.50 cp. when hematocrit is 20%, whereas it became 6.95 cp. when hematocrit increased to 70%. However, at the low shear rate of 1.04 sec-\ viscosity varied from 9.10 to 63.0 cp.

32
100
so
JO
0.5
0.1
SR o,.t :15)
100
so
10
as
0.1
10
FIG. 5
IJJ.f''
FJG. 7
Ht 20"/.
100
1- 42'c 2- 37'c 3- 32'c 4- V'c s- 22'c 6- 17't
Ht 40"/.
1- 42'< 2- 37'c 3- 32'c 4- 27't S- 22'c 6- 17"c
H. NAGASHIMA
lOCOcp
ViS(OSily
m:Jcp
SR osee·l
2SO
100
so
10
o.s
Ol
1 SR Dset .. 250
100
so
10
QS
0.1
11HS6
10 100
FIG. 6
CJi4J'
10
1- 42'c 2- 37'c 3- 32'c 4- 27'c S- 22'c 6- 17'<
Ht 50"/.
1- 4t'c 2- 37C 3 -3Z'c 4- 27't S- 22"c 6 -17"c
llXJ cp

VISCOSITY STUDIES DUUING BYPASS 33
SR • SR 05c~ Dstt.j IUfU 1U4H 2!'£) 2!'£)
Ht 60"/o Ht 70"!. 100 100
50 50 1- 4Z'c 2-'!1'< 3- 32°c
1- 42'c 4- 27°c 2- 37"c 5- 22'c
10 3- 32c "() 6 -rtc 4- 27"c
~= ff~
Q5 OS
0.1 0.1
100QcP 10 1000 cp.
FIG. 9 FIG. 10
FIGs. 5, 6, 7, 8, 9 and 10. Relationship among whole blood viscosity, hematocrit and temperature are plotted on log-log paper. Shear rate dependency of the whole blood viscosity as a non-Newtonian fluid is apparent and this tendency is more clearly manifested in the lower temperature and higher hematocrit range.
on the same sample with the similar change in condition. The influence of the temperature was remarkable when hematocrit was high and at the same time, the shear rate was low. The sample with hematocrit of 70%, shear rate of 250 sec- 1, and temperature of 42°C had viscosity of 6.50 cp. and the same sample showed viscosity of 13.5 cp. at 17"C. And at the shear rate of 1.04 sec-1 viscosity increased from 58.2 to 143 cp. as temperature was lowered from 42 to 17°C. These results indicate that the temperature affects the whole blood viscosity but not as markedly as hematocrit or the shear rate does. These was also clearly demonstrated the shear rate dependency, that is, nonNewtonian behavior of whole blood viscosity.
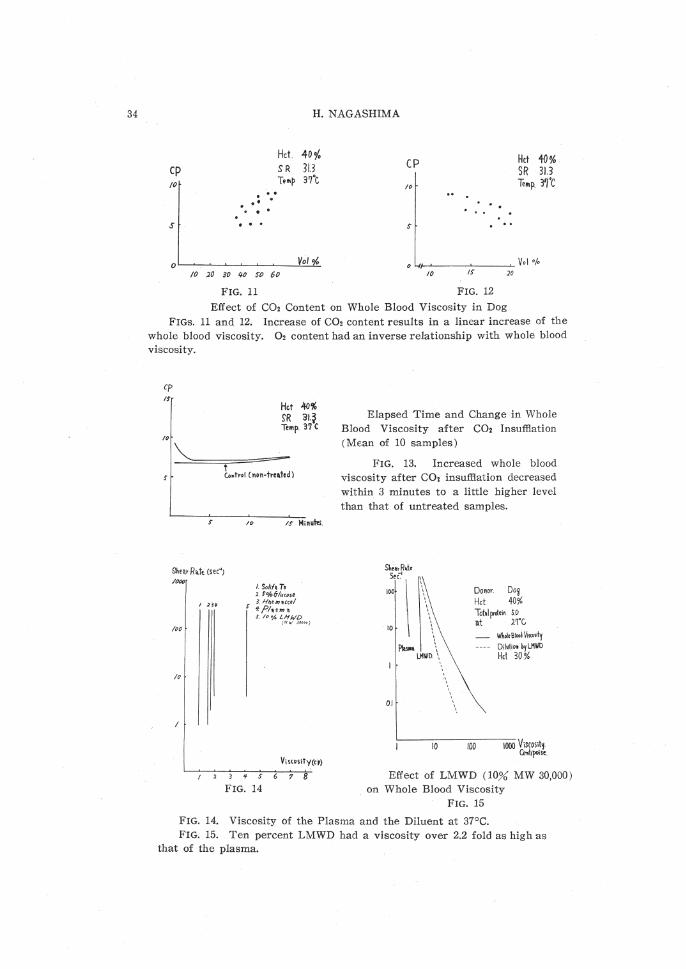
The influence of blood gas on whole blood viscosity was well detected in canine studies (Figs. 11 and 12). Oxygen and C02 content were determined just before viscometry. These figures showed a linear correlation that the rise in C02 content increased whole blood viscosity, while the 02 content lowered whole blood viscosity. Whole blood viscosity immediately after C02 insufflation was 9.2 cp. with hematocrit of 40%, the shear rate of 31.3 and temperature of 37°C, whereas viscosity of the untreated sample was 6.7 cp. (Fig. 13). This ncreased whole blood viscosity after C02 insufflation rapidly decreased within
34
cp /0
s
.. . . .
H. NAGASHIMA
Hct 40 o/. SR 313 Temp 37'c
10 20 30 ~o s-o 60
FIG. 11
CP 10
. .
Hct 40% SR 313 Te .. p. 3~'c
0 '-11-~--~--~ Vol 0/o 10 IS 20
FIG. 12
Effect of C02 Content on Whole Blood Viscosity in Dog FIGs. 11 and 12. Increase of C02 content results in a linear increase of the
whole blood viscosity. 02 content had an inverse relationship with whole blood viscosity.
cp I!
10
Hct .lj{)% SR 31.~ re .. p. 37(
L,trol (non-treded)
Shear R•t• (sec"J /(}Of)
/00
/0
/() IS HiRUi'eS.
I. Soli/~ TJ 2. t 0/o61ucose 3.Hl!oeJJHCctf
*PI'4""''~~ S. to% LHWD
(ttw 3~coo)
V;s<Os;ty(cp)
3~>678
FIG. 14
Elapsed Time and Change in Whole Blood Viscosity after C02 Insufflation (Mean of 10 samples)
FIG. 13. Increased whole blood viscosity after col insufflation decreased within 3 minutes to a little higher level than that of untreated samples.
ShwR•\• SeC:1
100
10
0.1
10
Donor. Doi Hct. 40% Totalproteln !.".0 n.t 27'G
100
WholeBioodV.<osi\y Q;i,t;, by LHWD Hd 30%
Effect of LMWD ( 10% MW 30,000) on Whole Blood Viscosity
FIG. 15
FIG. 14. Viscosity of the Plasma and the Diluent at 37°C. FIG. 15. Ten percent LMWD had a viscosity over 2.2 fold as high as
that of the plasma.

VISCOSITY STUDIES DURING BYPASS 35
3 minutes to a little higher level -than that of untreated sample and then
gradually increased again to 7.6 cp. This late increase might be explained by
drying up of the blood in the sample cup.
Viscosity of the plasma and the diluents at 37°C was presented in Fig. 14.
All the diluents behavior were like that of Newtonian fluid at 37°C. The mean
value of the mixed priming solution actually used in the perfusion procedure
was 1.53 cp. Except 10% LMWD (mean molecular weight 30.000), the diluents
and mixed priming solution showed viscosity lower than that of the plasma.
At 37°C, the mean value of the commercially available products like Solita
T-3, 5% glucose in water, Haemaccel, and 10% LMWD, and that of the human
plasma were 0.95, 1.50, 1.71, 4 00 and 1.80 in centipoise, respectively. Ten
percent LMWD had viscosity over twofold as high as that of the plasma, but
it made whole blood less viscous by lowering hematocrit and by the plasma
expanding effect through the tissue perfusion (Fig. 15).
Part II
The cases were divided into two groups; 13 cyanotic cases and 14 non
cyanotic. Four of 27 cases died postoperatively. Case 13 died of right ventri
cular dysfunction on the 2nd post-operative day (POD); Case 14 of ventricular
fibrillation on the 1st POD; Case 24 of renal shut down on the 5th POD; and
Case 26 of myocardial dysfunction on the 1st POD.
Perfusion data were presented in Table 3. The longest perfusion time was
199 minutes and the shortest was 29. Perfusion rate varied from 65.4 to 30.4
mljkgjmin (average: 51.51). The initial priming solution was prepared mainly
with 5% glucose in water, 5 mljkg of 10% LMWD, 7% sodium bicarbonate,
2.9 mEq of K, 2 mgjkg of heparin sodium, and 500 mg of vitamin C. In cases
12, 13, 23, 24, 25, 26 and 27, Solita T-3 was used instead of 5% glucose and
in Cases 10 and 18 Haemaccel. In 4 cases, heparinized blood was obviated.
Average value of the volume of the diluent and the dilution rate were 37.7
mljkg and 0.636, respectively, where dilution rate was defined as the lowest
hematocrit during total bypass divided by hematocrit before dilution. Viscosity
of the mixed diluent was 1.53 cp. and no significant difference was noted be
tween the 5% glucose group and other diluent groups.
Polycythemia had a dominant influence on whole blood viscosity and little
on the plasma viscosity (Fig. 16). In group 1, the whole blood was much
viscous than in group 2, but as to the plasma itself there was no difference
between two groups. The whole blood with polycythemia (RBC 746 x 10') had
viscosity of 64 cp. at the shear rate of 1.04, sec-1 and the plasma viscosity was
2.1 cp. at the shear rate of 62.6 sec- 1•
The plasma viscosity in man was also affected by temperature (Fig. 17) .
The human plasma showed viscosity of 1.8 cp. at 37°C and was approximately
that of Newtonian fluid characteristics but indicated the shear rate dependency

36
Perf. Case B.W. Time No. (kg) (min)
1 33.5 114 2 20.2 110 3 47.5 149 4 45.9 177 5 52.9 148 6 17.7 94 7 23.4 149 8 32.4 126 9 14.7 115
10 35.2 108
11 3fi.8 189 12 40.8 132 13 37.0 148 14 37.7 198 15 17.2 29 16 16.8 74 17 46.6 60 18 1:l5 133 19 43.5 100 20 12.5 91
21 58.8 166 22 34.5 73 23 18.5 46 24 39.1 75 25 13.9 80 26 41.0 199 27 59.2[ 197
-------·
H. NAGASHIMA
TABLE 3. Perfusion Data
I Initial Priming I I Perf. Rate _ ( cc) Diluent Dilution
I( cc/ kg/ min) Solution! Blood I ( cc/kg ) I Rate
I 44.7 1160 I 600 I 34.7 0.645
I 59.4 860 I 800
I
42.6 0.685 52.6 1560 400 32.9 0.566 65.4 1770 200 38.6 0.512 47.3 1540 29.2 0.686 56.5 690 800 39.0 0.586 50.5 870 600 37.2 0.666 61.7 1150 400 35.5 61.2 850 600 57.8 0.617 54.2 1170 400 I 33.3 0.650
50.3 1100 500 30.7 0.700 39.3 1300 200 31.9 0.712 43.3 1200 400 32.5 0.587 53.1 1360 200 36.1 0.586 58.4 770 750 45.2 0.524 59.6 700 800 41.6 42.8 1520 32.6 0.640 59 3 770 600 57.0 46.0 1400 600 32.2 0.787 48.1 600 600 48.2 0.708
45.9 2120
I
36.1 0.620
I 43.6 1175
I 400 34.1 0.666
I 43.3 780 600 42.2 0.602
I 38.4 1280 200 32.8 0.571 43.1 680
I 600 48.7 0.648
43.9 1200 400 29.3 0.631 I 30.4 1480 25.0 0.666 I
--
Arterial I P Pressure (m (mmHg) cc/
VR
mHg'; sec)
38 40 60 50 60 40 30 50 20 55
60 38 65 40
30 I
65 i
44
60 40 30
38 30 40
1. 52 00 44
.00
.44
.40
.50
.50
.33
.74
2. 1. 1 1 2 1 1 1 1
2 1 2 1
0
1
.00
.43
.44
.20
.90
.95
.40 4
1 1 2
3 1 1
.33
.60
.25
.80
.00
.33
Legend : B.W. body weight. Perf. perfusion. PVR peripheral vascular r esistance.
x!O' SR=I-O+ SR= 6lf
711! Whole Blood Pl~>m;
:/ 600 I
!00 .
A A~'"' ~ :~~ A "' A A,< A
"'' A A
::} cp L cp
ro · !DO 10
Blood Viscosity and Red Blood Cell Pre-Perfusion at 37°C
Group 1 x Group 2 c,
FIG. 16
SR
1119
10
( J.l +. r- 37c ~.-32•c 3.- 27'c 1.-n'c
s
Plasma Viscosity in Man FIG. 17
cp ,.
FIG. 16. Polycythemia had a dominant influence on whole blood viscosity and little on plasma viscosity.
FIG. 17. Plasma viscosity was a lso affected by temperature, and indicated sh ear rate dependency in the hypothermic condition.

VISCOSITY STUDIES DURING BYPASS 37
in the hypothermic condition. Hypothermic condition, not hemodilution, made a little change in plasma viscosity. At the lowest temperature during total bypass plasma viscosity gave the highest value, and then gradually decreased to the normal level. The difference between group 1 and group 2, and arterio-venous (A-V) difference were not measured, but further investigation will make it clear.
The whole blood viscosity was more dependent on the dilution rate than on the amount of the diluent used [ml/ kg]. especially at the lower shear rate (Figs. 19 and 20), and there were no significant difference between group 1 and 2.
Hc1. Pre-R.rfus;o n , Total Bypass •!o , (3H) (27c)
Byp~ss- off Post-Perfusion I hr. (3t'c) (35'c)
70
60 X •, ' so ,.
"' ' ~· lf.o ~·
' 30 A
ox
~ ' ~ 0 '
' 0 0 ' •A ~ • • .6• o"'X.
10
T· 2
Plasma Viscosity SR = 62.6 Gr oup 1 Group 2
ox ~' 0 > '•
' ~ '!J!~
44JXX ... .. :.· ....
3cp
Arterial Bl. Venous Bl. 0
• X
"' FIG. 18. Dur ing total bypass plasma viscosity shows its
highest value at th e lowest t emperature r ange.
Dll~o~ti OII R~te.
l'f/c,- SR 6>-•- --SR 6. H --
6o
ag - SR 6l·6- --SR &.16 - - 0
50 . . 0.7
. . o.!' ·' ~·
Q • 0 0 0 0 0
Q6
I 0
"l I. cp t .
,o , o 0 0 •.z: 0
30 0 .. ...
,. cp
s "' 10 If ,. >t 30 /0 I $' /0 /$ .J:O .u 30
Whole Blood Viscosity and Dilution Rate Whole Blood Viscosity and Hemodilution Group 1 o Group 2 • - Group 1 o Group 2 •
F IG. 19 FIG 20 FIGs. 19 and 20. Whole blood viscosity was more dependent on dilution
rate than on the a mount of diluent, especially at the low shear rate a r ea.

38 H. NAGASHIMA
Clinically, hemodilution greatly influenced the whole blood viscosity (Fig. 21, 22, 23, and 24). When the dilution rate was the highest, the whole blood
viscosity remained the lowest at the lowest temperature during total bypass. Both in arterial and venous blood, group 1 showed the higher level than group 2. The viscosity of the mixed venous blood was rather greater than that of
the oxygenated blood. These findings were remarkable in the low shear rate range.
Hct %
60
;o
'#
30
20
Hd. ojo Sheal' R\te{SR) 1.04
Bo
?0
60
so
30
10
' '' Jilt. X X . ' ...
Cp
100 l
St~en fl,ate(I"R) 62.6
,, Group 1 x
Group 2 "
100
Hrt. '/o bO
so
lo
10
SR I 04 SR 626
CP CP
10 tOO I /0
Whole Blood Viscosity during Total Bypass ( 27°C)
roo
Whole Blood Viscosity Pre·Perfusion at 37°C
FIG. 21 Arterial Blood Venos Blood
SR !.04 IR 62.6 He!. %
so 0' . . . ;o
oo~•<
l !."31 )o
· ·;,.-• .. .... ~·"" )0 , . ..,. ..... !0
cP cp /0 /00 /0 /00 '
Group 1 Group 2
SR 1.04
'' ,., "'"'' .t>.l.~L>. ;( A"'
A A
!0
'
0
• FIG. 22
cp
/00 I
X
SR 62.6
X x
"'' .-IJ. All.=
<> A A A
cp
/0 100
Whole Blood Viscosity at the End of Whole Blood Viscosity one hour after Bypass ( 34 °C) Group 1 o x
Group 2 • 6
FIG. 23
Bypass (35°C) Group 1 x Group 2 6
FIG. 24 FIGs. 21, 22, 23 and 24. During total bypass, the whole blood viscos:ty was the
lowest when the temperature was the lowest. The whole blood viscosity of the Group 1 was higher than that of the Group 2.
The total peripheral resistance during the total bypass was calculated as mmHgj mlj sec and had no significant effect on the whole blood viscosity (Fig. 25). There was no difference between group 1 and 2.
The plasma protein concentration showed almost no difference between the oxygenated and the mixed venous blood (caval mixture) throughout bypass
(Figs. 26, 27, 28, 29 and 30). Generally, albumin, globulin, fibrinogen and total

S/ot ll
3.0
l.O
1.$
VISCOSITY STUDIES DURING BYPASS
TPR ..... (C/It(..
S +-SR::6l.6-+[...___ SR"' 6.l.s-
• 0
< . ' .·:--·. ::· .. 10 15 ,.
cp
>t
Whole Blood Viscosity and Total Periphera l Resistance
during Total Bypass. Group 1 o Group 2 •
FIG. 25. During total bypass, whole blood viscosity had no significant
effect on the total peripheral r esistance.
·!· ·:·· 6:: l o0 o :·. o8.,o
P,.,.Petl•"'" Tot.l Byp~ss Bypl«-ofl ~d-P.tfusion I h •.
Total Protein oxygenated Blood 0
mixed venous Blood • FIG. 26
J?,.p.,j.s:on Tot•IBypHs Bypass- off Post·R~"'''"I h•
~kJI
;.o
4.0
3.0
1.0
t.o
:j: ;:
Albumin
300
lOO
100
oxygenated Blood o
mixed venous Blood • FIG. 27
39
Globulin oxygenated Blood o
mixed venous Blood • FIG. 28
Fibrinogen oxygenated Blood o m:xed venous Blood •
FIG. 29
40
.H
1.)
1.0
ooo o 0
oo
H. NAGASHIMA
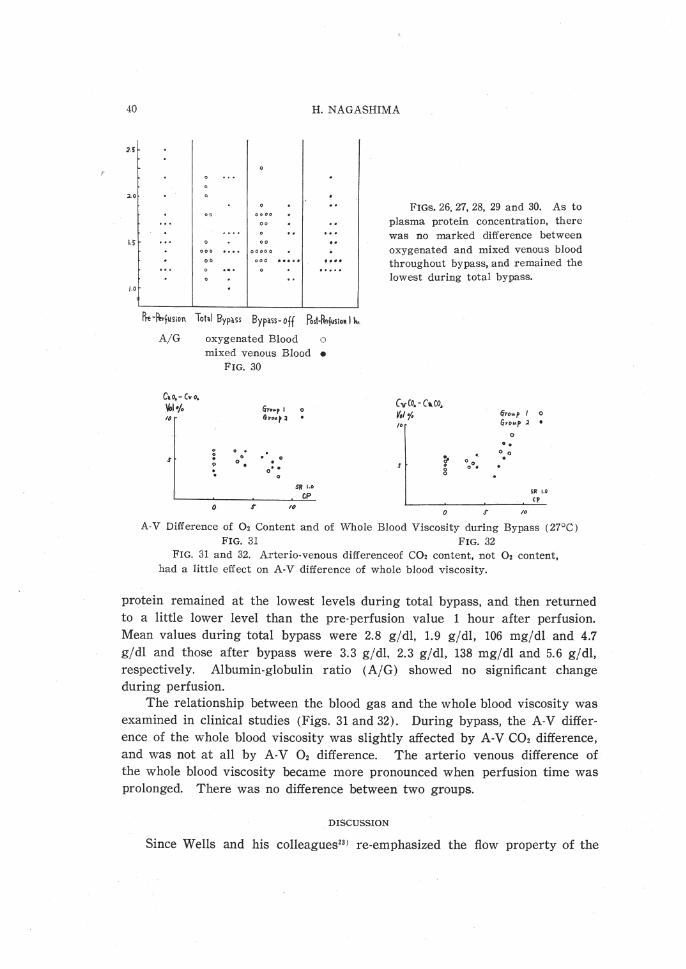
FIGs. 26, 27, 28, 29 and 30. As to plasma protein concentration, there was no marked difference between oxygenated and mixed venous blood throughout bypass, and r emained the lowest during total bypass.
Pre-ltrf~s;on Tohl ByplSS Bypass- off Post·ll.rjus;o•l ~'·
A/G
C,o.-Cvo, Vol-/. ,.
s
oxygenated Blood 0
mixed venous Blood • FIG. 30
Gt•""r 1 &l"•ut 2
0
0 0 . 0 .
0 0
0 . . o' • . 0
SR 1.0
CP 0 S' ,~
CvCo.- Ca. co. y,,, (irov.p I 0 ,. Grou.p .2 . 0 ..
0 0
~ ooo• ..
8 SR t.O ,,
0 S' ,. A-V Difference of 02 Content and of Whole Blood Viscosity during Bypass (27°C )
FIG. 31 FIG. 32 FIG. 31 and 32. Arterio-venous differenceof C02 content, not 02 content,
had a little effect on A-V difference of whole blood viscosity.
protein remained at the lowest levels during total bypass, and then returned to a little lower level than the pre-perfusion value 1 hour after perfusion. Mean values during total bypass were 2.8 gjdl, 1.9 gj dl, 106 mgj dl and 4.7 gjdl and those after bypass were 3.3 g jdl, 2.3 gjdl, 138 mgjdl and 5.6 gjdl, respectively. Albumin-globulin ratio (A/G) showed no significant change during perfusion.
The relationship between the blood gas and the whole blood viscosity was examined in clinical studies (Figs. 31 and 32) . During bypass, the A-V difference of the whole blood viscosity was slightly affected by A-V C02 difference, and was not at all by A-V 02 difference. The arteria venous difference of the whole blood viscosity became more pronounced when perfusion time was prolonged. There was no difference between two groups.
DISCUSSION
Since Wells and his colleagues231 re-emphasized the flow property of the

VISCOSITY STUDIES DURING BYPASS 41
blood as a non-Newtonian fluid, the viscometry by means of a capillary viscometer had its own practical limit because of the difficulty in deriving values in the lower shear rate range of below 100 sec- 131' 32 >. First of all, the Poiseuillian equation has as its first condition that the fluid under study in the rigid tube be a Newtonian fluid which maintains a constant ratio of shear stress to shear rate22 l. The tube radius ;has a pronounced effect on viscosity due to the Fahraeus Lindqvist effect. When whole blood passes through the narrow tube, accumulation of the blood cell to the central axis occurs, and so called "plasma skimming" is seen along the tube walL This phenomenon makes it difficult to obtain an accurate estimation of viscosity. The second problem is to calculate the shear rate in a tube. Haynes and Burton181 have derived shear rate values for capillary tubes from analysis of the pressure-flow curves of red cell suspension. Virgilio33l used an Ostwald-Cannon-Fenske viscosimeter having capillary bores of 0.63 ± 0.02 mm which had the shear rates ranging from 750 to 50 sec-1 depending upon the nature of the heparinized sample and the temperature. He stated that the viscosity was relatively independent of shear rates in this range. His explanation was based on the report by Dintenfass. Using a cone in cone viscometer without anticoagulant, Dintenfass considered that the range below the 10 sec- 1 was of the greatest importance in the determination of the colloidal structures of blood. He demonstrated a critical shear rate of normal blood to be 5 sec-1 above which viscosity was independent of further change in shear rate and abnormally thixotropic blood was characterized by the critical rates of shear of 30 to 60 sec-1• And he also stressed that the importance and the extent of the thixotropy was not appreciated due mainly to the use of a capillary viscometer which was unable to permit determinations at the very low shear rate and also due to the use of anticoagulants which decrease and distort the thixotropy. The measurement or derivation of the shear rate below 200 to 100 sec-1 for non-Newtonian fluid in capillary tubes requires precise and microscopic measurements of the flow rate and the tube dimension22'. The arteriole has a shear rate of about 10 sec-1, therefore, the shear rate of the capillary viscometer is too high to presume peripheral circulation and too complicated to calculate. The third is the pulsatile flow of the blood. It changes the radius of the blood vessel and flow velocity as well. Even with a static condition of the vascular tree, there may exist infinite variability, according to the vessel size. When the pulsatile change in every moment is considered, it becomes much more complicated to clarify viscosity of flowing blood.
The viscometer used in the present study was a cone in cone rotational type which provides sixteen different kinds of shear rate, ranging from 0.05 to 250.2 sec-1• This range of shear rate was well reproducible with whole blood viscosity. However, when the plasma or whole blood of very low hematocrit i$ on determination, rotation of the internal cone caused by rotation of the

42 H. NAGASHIMA
external cone at the revolution velocity of 1.5 rpm. is so slight that the observational error may increase. The above mentioned phenomenon may be due to the plastic characteristic of whole blood and this critical point observed could be intepreted as the yield value. But Gelin34 ) stressed that blood behaved like pseudoplastic fluid. Anyway, the measurement of these less viscous samples was carried out at the range from 6.26 to 250.2 sec-1• Supposing that plasma has a dominant function on the hemodynamics in the peripheral
circulation, there is room for further improvement of the equipment. Thixotropy as an isothermal sol-gel transformation, in which system vis
cositiy is dependent on time and shear rate, was clearly demonstrated by Dintenfass without using anticoagulant in the blood sample24 ). Because all samples were heparinized in this study, it was not adequate to determine the critical shear rate. From the Figs. 5, 6, 7, 8, 9 and 10, however, the flow curves were approximately parallel to the shear rate axis with the shear rate of over 10 sec-1 in the samples with lower hematocrit, and when hematocrit was over 40%, the flow curves shifted to the right as the shear rate decreased. Dintenfass summarized that the significance of thixotropy of blood was due to its intimate relationship with the aggregation of red cells and suggested that it was also related to the proneness of the thrombus formation24 )35) .
Concerning sampling the donor blood, there are some discussions on the use of anticoagulant. Dintenfass24 ) studied the thixotropy of blood and also its proneness to the thrombus formation in the absence of anticoagulants. He stressed that thixotropy was decreased and distorted due to the use of anticoagulants. Wells and Merrill36 ) documented that the blood and plasma vis
cosity was altered by adding heparin of 20 U jml, but Rand et al. 37) have not noted such an effect, employing a smaller amount of 7.5 U /ml. In this study the same dose as Rand et at's was used, because it is effective with minute quantities by which sample is negligibly diluted.
The relationship between the corpuscular concentration and blood viscosity observed in this studies was demonstrated in Fig. 16. As to whole blood viscosity, it was more viscous in the polycythemic group than in the normocythemic group, but there was little difference between two groups in plasma viscosity.
Hemodilution is a reasonable procedure for polycythemic group because it reduces hematocrit, decreases whole blood viscosity, and diminishes the peri· pheral vascular resistance. Replogle38), in his canine study, in which polycythemia was experimentally induced, observed an increase in the peripheral vascular resistance and a fall in cardiac output, and he noted that these results were associated with increased hematocrit and increased viscosity; and hemodilution brought about a reduction in the pressure load of the heart. In the present study the dilution rate had a positive correlation to whole blood
viscosity at lower shear rate, but hemodilution 1n ml/kg appeared to have
less correlation (Figs. 19 and 20). There were no differences among various

VISCOSITY STUDIES DURING BYPASS 43
kinds of diluents used for priming. Total peripheral resistance during total
bypass and whole blood viscosity had no significant relationship each other,
as shown in Fig. 25. Hypothermic perfusion with hemodilution has two dominant influences on
blood viscosity, namely, hematocrit change and low temperature. These factors
change the viscosity in more complex fashion, and more over, it is further
complicated because of the non-Newtonian behavior of blood.
Shear rate dependency of the whole blood viscosity as a non-Newtonian
fluid appeared clearly in Figs. 5, 6, 7, 8, 9 and 10, and this tendency became
more conspicuous in the lower temperature and higher hematocrit region.
Also the plasma itself showed its shear rate dependency in the lower temper
ature range. When the shear rate and the temperature were lower, the vis
cosity rapidly increased when the hematocrit value gradually became higher.
Rand37 1 pointed out that a gradual and relatively linear rise in viscosity
occurred as shear rates diminished from 212 to 106 sec-1 at all hematocrit levels
and below this point of 106 sec-1 blood thickend dramatically. In the present
study the thickening was pronounced in below 50 sec- 1 shear rate and over
40 % hematocrit region. When shear rate is less than 50 sec- 1 and hematocrit
over 40% , the shift of the flow curve to the right became clear. When the
relationship between viscosity and the shear rate was checked on the log-log
scale, temperature change caused viscosity change in a fixed manner at all
hematocrit levels. The flow curve went precipitously downward and ended
making a gentle slope. Virgilio331 pointed out that there is a critical temper
ature range somewhere between 10 and 20°C, where there appeared to be a
disproportionate increase in viscosity with both hemoconcentration and hypo
thermia, and he speculated that it might be the explanation for the poor
capillary flow observed in the absence of intra-vascular aggregation in the
same temperature range. In the human vascular tree, there are innumerable variety of the flow
velocity of blood, the diameter of the blood vessel and the shear rate. Under
the assumption that the whole blood is one of Newtonian fluids, Wells221 cal
culated the shear rate at the wall of the tube using the formula 4 V j r: where
V represented the mean velocity in centimeters per second and r represented
the radius of the vesseP91. From his estimation, the aortic blood flow velocity
of 35 em per second and the radius of 1.3 em would result in the shear rate
of 108 sec- 1• And if one assumes that an end arteriole varies from 50 to 500
t-t in diameter and the flow velocity of 0.11 mm per second40 1, then in a vessel
which bore is 100 t-t from the formula shown above, blood in these arterioles
would be subjected to the shear rate of about 10 sec- 1• These calculations
are very instructive, but not exactly true as to the arterial stream because
blood flow is pulsatile in nature, having influence over the flow velocity and
the radius of the vessel.

44 H. NAGASHIMA
Since blood viscosity is dependent on the shear rate, its variability is infinite according to the variation of shear rates which is usually seen through the aorta to microcirculation and then back to the venae cavae. It is clear that this non-Newtonian behavior of blood is significant in the smaller vessels leading to the capillary bed. At this level, the velocity of flow is much less than in the arteries, and blood viscosity is thought to be increased. However, splendid homeostasis is provided in flow mechanics. Fahraeus-Lindqvist found that with water the size of the tube did not alter the calculated viscosity, however, with blood, this value fell markedly if the diameter of the tube was less than 1 mm2ll. Plasma skimming or axial accumulation of the flowing blood cells plays a part. Along the vessel wall there may exist a zone free from the blood cell and it may result in the reduced resistance to flow. Actually hematocrit value of blood samples drawn from the capillaries is about 25% less than that of whole body blood41>. From these facts, blood viscosity in vivo is much less than the measured viscosity in vitro.
During hypothermic-hemodilution perfusion, the effects of hypothermia and hemodilution on the whole blood viscosity is counteracting. A greater influence by the latter rather than the former upon whole blood viscosity is noted, but upon the plasma viscosity it went inversely. While whole blood viscosity was the lowest during total bypass, plasma viscosity remained the highest regardless of the diminished serum protein concentration by dilution. These viscosity changes returned to the subnormal level at the end of bypass.
The plasma viscosity is affected by the plasma protein concentration, especially by fibrinogen27>. In this study during perfusion, fibrinogen had little effect on plasma viscosity. Wright et a/.42' stated that continuous circulation of plasma through the screen oxygenator produced a small, though definite, increase in viscosity, and the increase was less in each of the experiment with the membrane oxygenator than in any other with the screen oxygenator. And the rised viscosity level was accompanied with the increase in turbidity and ultraviolet light absorption. Lee43 ' also pointed out plasma protein denaturation by contact with surface-polarizing forces at the blood-gas interface in currently used disc, bubble and screen oxygenators. In his study, oxygenated plasma also increased viscosity. Contrary to above reports, the oxygenated blood was less viscous than the mixed venous blood in the present study. Hematocrit and serum protein were examined both on the mixed venous blood and on the blood oxygenated through the disc oxygenator. There was no significant difference between them. It may be because of the shorter duration of bypass with whole blood or of the influence of the C02 content in whole blood. The arterio-venous difference of whole blood viscosity through the disc oxygenator was due in some cases to insufflation with a gas mixture of 98% 02 and 2% C02. If the concentration of C02 in this gas-mixture became greater, A-V difference of whole blood viscosity whould be increased. There was no clear
VISCOSITY STUDIES DURING BYPASS 45
relationship between the A-V difference both in gas content and in whole blood viscosity (Figs. 31 and 32), this may well indicate that the ratio of gas mixture is adequate.
Plasma viscosity was 1.8 cp. at 37°C and showed Newtonian-like behayior at the same temperature. In the hypothermic condition plasma demonstrated shear rate dependency. These findings are very important in speculating peripheral circulation where the shear rate is low and the axial accumulation occurrs. The high plasma viscoisty, in case of tissue perfusion, would result in hypoxia.
Although LMWD was 2.2 times as viscous as plasma, it plays as a flow improver by expanding plasma volume, lowering hematocrit and increasing the negative charge of the red cell surface, thereby decreasing the aggregation tendency.
Koeppe44 1 and Welsh451 demonstrated that exposure of blood to C02 results in a marked increase in viscosity. Burch4' 1 confirmed this with a Brookfield synchroelectric viscometer at the shear rates of 23, 46, 115 and 230 sec-1•
There was a statistically significant increase in blood viscosity at the shear rates of 23 and 43 sec- 1 and an increase in blood viscosity was not completely reversible. And plasma viscosity was indifferent to the change in whole blood viscosity. Although the blood gas content was measured just before viscometry, the blood began to lose C02 as soon as it is placed in the viscometer. Rand311
noticed a decrease in viscosity on the majority of the fresh samples during the first few minutes of measurement and it was independent of the shear rate, hematocrit, or temperature gradient. In the present study increased whole blood viscosity after C02 insufflation decreased rapidly within 3 minutes (Fig. 13) . This phenomenon may be expalined as below. If venous blood is exposed to room air during viscometry, the C02 content will be reduced to that of room air and, thus, viscosity will be decreased.
As Burch pointed out, the technical difficulty from this respect was encountered in the study. But in the hypoxic condition or in the areas of the peripheral ischemia, the C02 content of blood becomes well beyond the physiologic range. This high COz content produces an increase in whole blood viscosity, and increased whole blood viscosity which is shear-dependent make blood flow velocity slower especially in the periphery, because the diameter of the blood vessel becomes smaller and it results in lower shear rate. Thus increased blood viscosity promotes to produce higher COz content in the circulating blood in the impaired peripheral flow. Through this process it forms a vicious cycle which ultimately leads to stasis or slugging of the blood stream461 •
On the clinical study, the A-V difference of whole blood viscosity was not remarkable. This means that the pump-oxygenator system has been adequately, operated keeping co! content within the normal range,

46 H. NAGASHIMA
The reason why exposure of whole blood to COz caused an increase in
viscosity is obscure. Carbon dioxide produced in the tissue comes into circu
lating blood to combine with hemoglobin by the difference of the C02 tension.
When HCOa- in the red blood cell increases, a chloride shift from plasma into
the red cell occurs as shown by the Donnan's equation. The swelling of the
red blood cell may be found because of the difference of the osmotic pressure.
The swelling. makes hematocrit rise and then causes increased viscosity.
Scribner47 ' observed that the rise in the hematocrit values in acidotic dogs is
completed within 10 minutes in his experimental study in which respiratory
acidosis was induced by inhalation of a gas mixture of 30% C02 and 70% Oz
through a tight-fitting intratracheal catheter. The assumption that increased
viscosity is caused by a chloride shift was not proved in the study. There
was no difference in hematocrit between the oxygenated and venous blood.
Burch suggested that irreversible structural changes must have occurred in
the red blood cells. Dintenfass48 ' concluded that the interior of the red cells
is a dynamic system, viscosity of which is not constant but varies depending
on the external conditions. The effect of the blood gas content as an external
condition may have a great influence on the thixotropic interior of the red
cells.
SUMMARY AND CONCLUSION
Basic problems in the hypothermic hemodilution perfusion were considered
from the rheological stand point using a cone in cone viscometer.
In experimental study it was well demonstrated the shear rate dependency,
that is, non-Newtonian behavior, of whole blood viscosity at all hematocrit
levels. The influence of the temperature change was clearly seen when hemato
crit was high and the shear rate was low.
The increase of the COz content produced a linear increase in whole blood
viscosity, and the 02 content had a contrary effect on whole blood viscosity.
This increased whole blood viscosity after C02 insufflation rapidly decreased,
w.thin 3 minutes, to a little higher level than that of the untreated samples
and then gradually increased.
Viscosity of the plasma was 1.8 cp. at 37°C and showed a Newtonian-like
behavior at the same temperature. In the hypothermic condition the plasma
demonstrated a shear rate dependency. These findings are very important in
speculating the peripheral circulation where the shear rate is low and an axial
accumulation of the blood cell occurs.
Except 10% low molecular weight dextran solution (mean molecular weight
30,000), the diluents and the mixed priming solution showed viscosity below
that of the plasma. Viscosity of 10% LMWD was more than 2.2 fold as high
as that of the plasma.
Clinical data were obtained from 27 patients who underwent hypothermic

VISCOSITY STUDIES DURING BYPASS 47
hemodilution perfusion for the correction of cardiovascular defects at the
Nagoya University Hospital. In the cyanotic group whole blood was much viscous than whole blood of
the non-cyanotic patient. During hypothermic hemodilution perfusion, the effects of hypothermia
and hemodilution on whole blood viscosity are counteracted. The latter in
fluences whole blood viscosity much more than the former, but an inverse
relation is present to plasma viscosity. While whole blood viscosity was the
lowest during total bypass, plasma viscosity remained the highest, in spite of
the diminished serum protein value by dilution. These viscosity changes
returned to the subnormal level at the end of bypass.
Whole blood viscosity was more dependent on the dilution rate than the
amount of diluent in mljkg. As to whole blood, mixed venous blood viscosity was a little higher than
that of the oxygenated blood and this tendency was more pronounced at the
low shear rates. Total peripheral resistance during total bypass had no significant effect
on whole blood viscosity. The plasma protein concentration remained the lowest during total bypass
and showed no marked difference between the oxygenated blood and the mixed
venous blood. The arterio-venous difference of the C02 content, not of the 02 content,
had a little effect on the A-V difference of whole blood viscosity.
Merits and demerits of the cone in cone viscometer as a rotational visco·
meter were described, comparing with the capillary viscometer. The visco
meter used in the present study provids sixteen different grades of shear rate,
ranging from 0.05 to 250.2 sec-1• The shear rates within above range were
well reproducible on whole blood. However, when plasma or whole blood
with very low hematocrit was examined, there was room for further improve·
ment of the equipment. The relation between the peripheral circulation and blood viscosity was
also discussed. Plasma viscosity and blood gas content are important factors
in tissue perfusion. When the carbon dioxide in blood increases abnormally,
blood viscosity increases and aggravates the impaired peripheral flow, which
results in the higher C02 content in the circulating blood, subsequently. This
vicious cycle ultimately leads to stasis or slugging of the blood circulation.
The results obtained from the present study using the cone in cone visco
meter well indicates that the routine with the pump oxygenator at this clinic
is proper and adequate,

48 H. NAGASHIMA
ACKNOWLEDGEMENT
The author wishes to express his grateful acknowledgement to Professor Dr. Yoshio Hashimoto for his kind guidance and advice. Also expresses his thanks to Assistant Prof. Dr. I. Fukukei and to Lect. Dr. Y. lyomasa.
REFERENCES
1) DeWall, R. A. and Lillehei. C. W., Simplified total body perfusion, ].A.M.A., 179, 430, 1962.
2) Gibbon, J. H. Jr., Artificial maintenance of circulation during experimental occlusion of pulmonary artery, Arch. Surg., 34, 1105, 1937.
3) Dennis, C., Spreng, D. S. Jr., Nelson, G. E., Karlson, K. E., Nelson, R. M., Thomas, J. V., Eder, W. P. and Varco, R. L., Development of a pump oxygenator to replace the heart and lungs; An apparatus applicable to human patients and application to one case, Ann. Surg., 134, 709, 1951.
4) Gibbon, J. H. Jr., Application of a mechanical heart and lung apparatus to cardiac surgery, Minnesota Med., 37, 171, 1954.
5) Crafoad, C., Some aspects of the development of intrathoracic surgery, Sur g. Gynec. Obstet., 89, 523, 1955.
6) Lillehei, C. W., Cohen, M., Warden, H. W. and Varco, R. L., The direct vision intracardiac correction of congenital anomalies by controlled circulation, Surgery, 38, 11, 1955.
7) Kirklin, J. W., Dushane, W., Patrick, R. T., Donald, D. E., Hetzel, P. S., Harshberger, H. G. and Wood, E. H., Intracardiac surgery with the aid of a mechnical pump oxygenator system (Gibbon type): Report of eight cases, Proc. Mayo Clin., 30, 211, 1955.
8) Bigelow, W. G., Callaghan, J. C. and Hopps, ]. A., General hypothermia for experimental intracardiac surgery, Ann. Surg., 132, 531, 1950.
9) Swan, H., Zeavin, I., Holmes, ]. H. and Montgomery, V., Cessation of circulation in general hypothermia. I. Physiologic changes and their control, Ann. Surg., 138, 360, 1953.
10) Lewis, F.]. and Taufic, M., Closure of atrial septal defects with the aid of hypothermia: Experimental accomplishments and the report of one successful case, Surgery, 33, 52, 1953.
11) Ross, D. N., Venous cooling. A new method of cooling the blood stream, Lancet, 1, 1108, 1954.
12) Brock, R. and Ross, D. N., Hypothermia III. The clinical application of hypothermic techniques, Guy. Hosp. Rep., 104, 99, 1955.
13) Brown, I. W. Jr., Smith, W. W. and Emmons, W. 0., An efficient blood heat exchanger for use with extracorporeal circulation, Surgery, 44, 372, 1958.
14) Neptune, W. B., Bougas, ]. A. and Panico, F. G., Open-heart surgery without the need for donor blood priming in the pump oxygenator, New Eng. ]. Med., 263, 111, 1960.
15) Zuhdi, N., McCollough, B., Carey, J and Krieger, C., Hypothermic perfusion for openheart surgical procedures, ]. Int. Colt. Surg., 35, 319, 1961.
16) Long, D. M. Jr., Sanchez, L., Varco, R. L. and Lillehei, C. W., The use of low molecular weight dextran and serum albumin as plasma expanders in extracorporeal circulation, Surgery, 50, 12, 1961.
17) Poiseuille, M., Recherches experimentales sur le mouvement des liquids dans les tubes de tres petits diametres, Des Seances de L'Academie des Sciences, 11, 961, 1841.
18) Haynes, R. H. and Burton, A. C., Role of non-Newtonian behavior of blood in hemodynamics, Amer. J. Physiol., 197, 943, 19~9,

VISCOSITY STUDIES DURING BYPASS 49
19) Whittaker, S. R. F. and Winton, F. R., The apparent viscosity of blood flowing in the isolated hind limb of the dog and its variation with corpuscular concentration, ]. Physiol. (London), 78, 339, 1933.
20) Fahraeus, R. and Lindqvist, T., The viscosity of the blood in narrow capillary tubes, Amer. ]. Physiol., 96, 462, 1931.
21) Dix, F. J. and Scott-Blair, G. W, On the flow of suspension through narrow tubes, ]. Appl. Phys., 11, 574, 1940.
22) Wells, R. E. Jr. and Merrill, E: W., Influence of flow properties of blood upon viscosity-hematocrit relationships, ]. Clin. Invest., 41, 1591, 1962.
23) Wells, R. E. Jr., Denton, R. and Merrill, E. W., Measurement of viscosity of biologic fluids by cone plate viscometer, ]. Lab. Clin. Med., 57, 646, 1961.
24) Dintenfass, L., Thixotropy of blood and proneness to thrombus formation, Circ. Res., 11, 233, 1961.
25) Yamaguchi, T. An experimental study on hypothermic cardiopulmonary bypass with hemodilution technique, Nagoya ]. Med. Sci., 30, 129, 1967.
26) Nakai, T., ]. Nagoya Med. Ass., 90, 285, 1967 (in Japanese). 27) Yamaguchi, T., Rheological studies on peripheral circulation especially on the blood
viscosity,]. Nagoya Med. Ass., 90, 179, 1967 (in Japanese). 28) Iino, S., Experimental and clinical studies on peripheral circulation with rheological
consideration,]. Nagoya Med. Ass., 90, 2, 1967 (in Japanese). 29) Kanai, I., Rinsho-Kensa-Ho-Teiyo. Kanehara-Shoten. Tokyo, 1964. VII-19 (in Japanese). 30) Van Slyke, D. D. and Neill, ]. M., The determination of gases in blood and other
solutions by vacuum extraction and manometric measurement, ]. Biol. Chem., 61, 523, 1924.
31) Merrill, E. W., Basicproblems in the viscometry of non-Newtonian fluids, ISA journal (Instrument Soc. of America), 2, 462, 1955.
32) Merrill, E. W. and Wells, R. E. Jr., Flow properties of biological fluids, Appl. Meek. Rev., 14, 663, 1961.
33) Virgilio, R. W., Long, D. M., Mundth, E. D. and McClenathan, J. E., The effect of temperature and hematocrit on the viscosity of blood, Surgery, 55, 825, 1964.
34) Gelin, L. E., Rheology: theoretic background for clinicians, Medical postgrad., 3, 1, 1965.
35) Dintenfass, L., Viscosity and clotting of blood in venous thrombosis and coronary occlusions, Circ. Res., 14, 1, 1964.
36) Wells, R. E. and Merrill, E., Shear rate dependence of the viscosity of whole blood and plasma, Science, 133, 763, 1961.
37) Rand, P. W., Lacombe, E., Hunt, H. E. and Austin, W. H., Viscosity of normal human blood under normothermic and hypothermic conditions,]. Appl. Physiol., 19, 117, 1964.
38) Replogle, R. L., Kundelr, H. and Gross, R. E., Studies on the hemodynamic importance of blood viscosity, ]. Thoracic Cardiovas. Surg., 50, 658, 1965.
39) Wilkinson, W. L., Non-Newtonian fluids: Fluid mechanics, mixing and heat transfer, New York Pergamon Press., p. 34, 1960.
'10) Lee, R. E., Anatomical and physiological aspects of the capillary bed in bulbar conjunctiva of man in health and disease, Angiology, 6, 369, 1955.
41) Gibson, J. C., Seligman, A. M., Peacock, W. C., Aub, J. C., Fine, J. and Evans, R. D., Distribution of red cells and plasma in large and minute vessels of normal dog, determined by radioaktive isotopes of iron and iodine, ]. Clin. Invest., 25, 848, 1946.
42) Wright, E. S., Sarkozy, E., Harpur, E. R., Dobell, A. R. C. and Murphy, E. R., Plasma protein denaturation in extracorporealcir culation, ]. Thoracic Cardiovas. Sur g., 44, 550, 1962.
43) Lee, W. H. Jr., Krumhaar, D., Fonkalsrud, E. W., Schjeide, 0. A. and Maloney, ]. V.

50 H. NAGASHIMA
Jr .. Denaturation of plasma proteins as a cause of morbidity and death after intra
cardiac operations, Surgery, 50, 29, 1961. 44) Koeppe, H., Der osmotische Druck als Ursache des Stoffaustausches zwischen roten
Blutk orperchen und Salzlosungen, Arch. Ges. Physiol., 67, 189, 1897. 45) Welsh, W. H., Viscosity of the blood, Heart, 3, 118, 1911.
46) Burch, G. E. and DePasquale, N. P., The effect of C02 on the viscosity of whole blood,
Archiv Kreislaufforsch .. 46, 161, 1964.
47) Scribner, B. H., Smith, K. F. and Burnell, J. M., The effect of acute respiratory
acidosis on the internal equilibrium of potassium, ]. Clin . Invest., 34, 1276, 1955.
48) Dintenfass, L., Considerations of the internal viscosity of red cells and its effect on
the viscosity of whole blood, Angiology, 13, 333, 1962.


![Sensors and Actuators A: Physical...viscosity and density. In our previous works we utilized nickel cantilevers to measure viscosity of blood plasma and serum [18,19]. We achieved](https://static.fdocuments.us/doc/165x107/604e38515165892e430464df/sensors-and-actuators-a-physical-viscosity-and-density-in-our-previous-works.jpg)