Nagaland Tariff Order 1
98
i TARIFF ORDER FY 2011-12 June 27, 2011 NAGALAND ELECTRICITY REGULATORY COMMISSION (NERC) Old MLA Hostel Complex Kohima – 797 001 Website: www.nerc.org.in, E-mail: [email protected]
-
Upload
pavan-khetrapal -
Category
Documents
-
view
38 -
download
0
description
gggggjg
Transcript of Nagaland Tariff Order 1

i
TARIFF ORDER FY 2011-12
June 27, 2011
NAGALAND ELECTRICITY REGULATORY COMMISSION (NERC)Old MLA Hostel Complex
Kohima – 797 001Website: www.nerc.org.in, E-mail: [email protected]
9TH MARCH 2011
INDEX
1 INTRODUCTION.............................................................................................................11.2 Department of Power, Nagaland – ARR and Tariff Petition............................................21.3 Admission of Petition.......................................................................................................21.4 Public Hearing Process...................................................................................................21.5 Notice for Public Hearing................................................................................................31.6 Public Hearing.................................................................................................................32. SUMMARY OF PETITION OF POWER DEPARTMENT NAGALAND FOR
AGGREGATE REVENUE REQUIREMENT...................................................................72.1 Introduction.....................................................................................................................72.2 The Power Department, Nagaland requested the Commission to:.................................73. POWER SECTOR IN NAGALAND – AN OVERVIEW.......................................................93.1 Introduction.....................................................................................................................93.2 Power Supply..................................................................................................................93.3 Transmission and Distribution Network.........................................................................93.4 Transmission and Distribution (T&D) Losses...............................................................103.5 Consumer Profile and Energy Sales............................................................................103.6 Demand and Supply Position.......................................................................................113.7 Power Supply Position..................................................................................................113.8 Energy Balance.............................................................................................................124. BRIEF SUMMARY OF OBJECTIONS RAISED, RESPONSE FROM DEPARTMENT
AND COMMISSION’S COMMENTS............................................................................134.1 Public response to the Petition....................................................................................134.2 Objections/Suggestions and response of DPN............................................................134.2.1 NERC Proceedings of Public Hearing on 9th June, 2011 at Kohima............................134.2.2 Objections raised by NVCO (Nagaland Voluntary Consumer Organization), Kohima:.144.2.3 Objections raised by the representative from KCCI (Kohima Chamber of Commerce
and Industries), Kohima:...............................................................................................16Annexure – 4.1.......................................................................................................................195. AGGREGATE REVENUE REQUIREMENT 2011-12 - COMMISSION’S ANALYSIS AND
DECISIONS..................................................................................................................205.1 Introduction...................................................................................................................205.2 Consumer Categories...................................................................................................205.2.1 Projected Consumer Growth and connected load........................................................205.3 Energy Sales.................................................................................................................215.3.1 Analysis of energy sales projected and Commission’s view.........................................225.3.2 Category-wise Energy Sales.........................................................................................255.4 Transmission and Distribution (T&D) losses................................................................255.5 Energy Requirement and Availability...........................................................................275.6 Gross fixed Assets........................................................................................................285.7 Capital Investment........................................................................................................295.8 Revenue Requirement for FY 2011-12.........................................................................305.9 Fuel Cost.......................................................................................................................315.10 Power Purchase cost....................................................................................................315.11 Operation and Maintenance Expenses.........................................................................325.11.1 Employee Cost...................................................................................................335.11.2 Repairs and Maintenance Expenses..........................................................................345.11.3 Administration and General Expenses...............................................................355.12 Depreciation..................................................................................................................365.13 Interest and Finance Charges.......................................................................................365.14 Interest on Working Capital...........................................................................................385.15 Return on equity............................................................................................................405.16 Provision for Bad and doubtful debts............................................................................415.17 Non Tariff Income.........................................................................................................415.18 Aggregate Revenue Requirement................................................................................42
ii

5.19 Expected revenue from existing tariff............................................................................435.19.1 Revenue gap for FY 2011-12.............................................................................445.19.2 Revenue from revised tariff................................................................................44Annexure – 5.1.......................................................................................................................466. DIRECTIVES......................................................................................................................477 TARIFF PRINCIPLES AND DESIGN...........................................................................527.1 Background...................................................................................................................52
iii

List of Tables
Table 2.1: Aggregate Revenue Requirement and Revenue Gap projected by DPN for FY 2011-12....................................................................................................................................... 7
Table 3.1: Allocation from Central Generating Stations.........................................................................9Table 3.2: Transmission and Distribution Network as on 31st March 2010.........................................10Table 3.3: Consumer Profile and Energy Sales for FY 2009-10..........................................................11Table 3.4: Power Supply from Central Generating Stations and other Sources..................................11MU 11Table 3.5: Energy Balance...................................................................................................................12(MU) 12Table 5.1: Category-wise Consumers.................................................................................................21Table 5.2: Consumers and connected load.........................................................................................21Table 5.3: Energy Sales...................................................................................................................... 21Table 5.4: Energy Sales...................................................................................................................... 22Table 5.5: Specific Consumption.........................................................................................................23Table 5.6: Category wise energy sales for FY 2011-12.......................................................................25Table 5.7: T&D Loss for FY 2008-09 & 2009-10..................................................................................26Table 5.8: T&D loss worked out for FY 2010-11 & 2011-12:................................................................27Table 5.9: Energy Balance...................................................................................................................27Table 5.10 Rectified Energy balance...................................................................................................28(MU) 28Table 5.11: Gross Fixed Assets...........................................................................................................29Table 5.12 Investment Plan (Scheme wise) 2009-10..........................................................................29Table 5.13 Investment Plan (Scheme wise) 2010-11..........................................................................29Table 5.14 Investment Plan (Scheme wise) 2011-12..........................................................................30Table 5.15 Capital works in progress...................................................................................................30Table 5.16 Expenses projected by DPN for 2011-12...........................................................................30Table 5.17 Power Purchase cost projected by DPN for FY 2011-12...................................................31Table 5.18 Power Purchase for the year 2011-12...............................................................................32Table 5.19:- Operation & Maintenance Expenses for FY 2011-12.......................................................33Table 5.20 Employee cost actuals for 2007-08 to 2010-11 (upto 30.9.2010).......................................33Table 5.21 Repair & Maintenance Expenses.......................................................................................34Table 5.22 Administrative & General Expenses for FY 2011-12..........................................................35Table 5.23: Depreciation for the FY 2011-12 projected by DPN..........................................................36Table 5.24 Interest and Finance Charges............................................................................................37Table 5.25: Institution wise loan and details and interest for FY 2009-10............................................37Table 5.26: Institution wise loan and details and interest for FY 2010-11............................................37Table 5.27: Institution wise loan and details and interest for FY 2011-12............................................38Table 5.28: Interest on working capital................................................................................................39Table 5.29 : Interest on working capital FY 2011-12............................................................................39Table 5.30: Return on Equity for FY 2011-12 projected by DPN.........................................................40Table 5.31: Non Tariff Income.............................................................................................................41Table 5.32 Aggregate Revenue Requirement for FY 2011-12.............................................................42Table-5.33: Revenue from existing tariff projected by DPN for FY 2011-12........................................43Table 5.34: Revenue from existing tariff approved by the Commission for FY 2011-12......................43Table 5.35: Net revenue requirement and gap with revenue at existing tariff......................................44Table 5.36: Revenue from revised tariff approved by the Commission for FY 2011-12.......................44Table 7.1 Average Cost of supply........................................................................................................54Table 7.2 Category Wise Tariffs existing and proposed by DPN.........................................................55Table 7.3: Category of Consumer wise tariffs approved by the Commission.......................................56
iv

LIST OF ABBREVIATIONS
Abbreviation Description
A&G Administration & General
ARR Annual Revenue Requirement
ATE Appellate Tribunal For Electricity
CAGR Compound Annual Growth Rate
CD Contract Demand
CERC Central Electricity Regulatory Commission
CGS Central Generating Stations
CoS Cost of Supply
CPSU Central Power Sector Undertakings
Cr Crore
D.E Debt Equity
DPN Department of Power, Govt. of Nagaland
EHT Extra High Tension
ER Eastern Region
FAC Fuel Adjustment Costs
FDR Fixed Deposits Receipts
FY Financial Year
GFA Gross Fixed Assets
HP Horse Power
HT High Tension
KV Kilovolt
KVA Kilo volt Amps
KW Kilo Watt
kWh kilo Watt hour
LNG Liquefied Natural Gas
LT Low Tension
MVA Million volt Amps
MW Mega Watt
NERC Nagaland Electricity Regulatory Commission
v

Before the Nagaland Electricity Regulatory Commission
for the State of Nagaland Kohima
Present
Er. S.I. Longkumer, Chairman-cum-Member
Case No. 01 of 2010
In the matter of
Aggregate Revenue Requirement (ARR) and Retail Tariff for the State of Nagaland for the Financial Year 2011-12
AND
In the matter of
Department of PowerGovernment of Nagaland Petitioner(herein referred to as DPN)
ORDER
Date: 27th June, 2011
1 Introduction
1.1 In exercise of the powers conferred by the Electricity Act, 2003, the State
Government of Nagaland constituted an Electricity Regulatory Commission to be
known as “Nagaland Electricity Regulatory Commission” for the State of Nagaland,
as notified on 21st February, 2008.
The Commission is a one-member body designated to function as an autonomous
authority responsible for regulation of the power sector in the State of Nagaland. The
powers and the functions of the Commission are as prescribed in the Electricity Act,
2003. The head office of the Commission is presently located at Kohima, capital city
of the Nagaland State.
1

The Nagaland Electricity Regulatory Commission for the State of Nagaland started to
function with effect from 4th March, 2008 with the objectives and purposes for which
the Commission has been established.
The Department of Power – Nagaland herein called DPN, a deemed licensee under
section 14 of the Electricity Act, 2003, is carrying on the business of distribution and
retail supply of electricity in the state of Nagaland
1.2 Department of Power, Nagaland – ARR and Tariff Petition
1.2.1 DPN had filed its petition for approval of Aggregate Revenue Requirement (ARR)
and determination of retail supply tariff for FY 2011-12 according to the conduct of
Business Regulations and determination of Tariff Regulations of NERC. In the
petition DPN has estimated ARR of Rs. 314.16 crore and worked out a revenue gap
of Rs. 203.12 crore. At this estimation the average cost of supply works out to be Rs.
9.98 / unit for FY 2011-12. Details on this is dealt in Chapter-5.
1.3 Admission of Petition
DPN has originally filed ARR and Tariff Petition in November 2010 for the year 2011-
12 and the petition was taken on record in Case No. 01 of 2010.
On preliminary analysis of the petition it was observed that certain data / information
was lacking in the petition. The Commission, in its letter dated 15 th January, 2011,
22nd January, 2011 and 25th January, 2011 directed DPN to furnish the data on
urgent basis.
The Commission also held a hearing on 8th March, 2011 at Kohima. CE Power
Department attended the meeting with senior officers. The DPN was informed about
the importance of Data required.
In response to the Commission’s communications and the discussions had in the
said hearing the petitioner has submitted the additional data / information on 9 th
March, 2011 and on 22nd March, 2011 in form of affidavit.
1.4 Public Hearing Process
The Commission directed the DPN to publish the summary of the ARR and Tariff
proposal in the abridged form and manner as approved by the Commission in
accordance with section 64 of the Electricity Act, 2003 to ensure public participation.
2

The public notice was published by the DPN in the following newspapers in two
issues.
Sl. No. Name of the newspaper Language Date of publication1 Nagaland Post, Dimapur English 22nd and 24th April 20112 The Morung Express English 22nd and 24th April 20113 The Eastern Mirror English 22nd and 24th April 2011
Through the public notice dated 22nd April, 2011 the public were invited to forward
their objections / suggestions on the petition on or before 20th May, 2011.
No objection was received by the Commission on DPN petition.
1.5 Notice for Public Hearing
A public notice was published by the Commission in leading newspapers on 27th and
28th May, 2011 giving due intimation to general public, interested parties, objectors
and the consumers about the public hearing to be held by the Commission on 9 th
June, 2011 on the petition filed by DPN.
1.6 Public Hearing
Public hearing was held as scheduled on 9th June, 2011 at Commission’s office from
11 AM onwards. During the public hearing each participant was provided a time slot
for presenting views on the petition of DPN before the Commission. The main issues
raised by the objectors during the public hearing along with the response of DPN are
briefly given in Chapter-4.
1.7 The Commission held the 2nd State Advisory Committee meeting on 27th May, 2011
at Hotel Jafu, Kohima.
The Advisory Committee discussed on Tariff Petition filed by the DPN for determining
ARR and Tariffs for FY 2011-12.
The following State Advisory Committee Members attended the meeting
1. Er. S.I Longkumer - Ex officio, Chairperson2. Mr. Neichnta Donlo - Member 3. Ms. Hekani Jakhalu - Member4. Er. Khriesito Savino - Member5. Capt. Hekiye Sema - Member6. Mr. Omprakash Sethi - Member7. Mr. Kezhokhoto Savi - Member8. Mr. Ramongo Lotha - Addl. Secretary, F&C.S., Nagaland
Representing Secretary F&C.S.& Member SAC
3

Special invitees viz., E.D Basumatari Chief Engineer (Power), Nagaland, Er. T.S.
Angami, Director New and Renewable Energy Department, Nagaland,
representatives from Electrical Inspectorate, Nagaland also attended the meeting.
The issues relating to tariffs for 2011-12 were discussed.
Minutes of the State Advisory Committee Meeting are enclosed in Annexure 1.1
4

Annexure 1.1
Minutes of the State Advisory Committee Meeting
2nd Meeting of State Advisory Committee held at Kohima on 27th April, 2011
The Tariff Petition of the DPN was listed as Agenda No. 3 of the meeting. The
members present raised the following questions.
As special invitees, the following accompanied by some of their sub-ordinate officers
attended this meeting.
1. The Chief Engineer (Power), Nagaland
2. The Director, New & Renewable Energy Department, Nagaland
3. The Chief Electrical Inspector, Nagaland
Ms Hekani Jakhalu, SAC Member
Interest on loans, depreciation on assets and return on equity have been excluded in
the Revised Tariff Petition. Are these not vital parameters to be considered as inputs
for working out power business’s purchase / sale transactions?
DPN
The parameters mentioned are used for Corporate Accounting exercises. The DPN,
so far fully supported by the State Government would like to revise tariff “based
mainly on the increased cost of energy purchased and minimum permissible loading
of the determinants keeping in view the welfare of different categories as a
Government managed utility”. Hence, the components mentioned by the questioner
are not included in the Revised Tariff Petition as submitted and it is prayed that the
Commission consider this point of view.
NERC
The exclusion or otherwise of the components raised in this discussion would be
examined and decided based on the merit of the case as petitioned. However, as per
guidelines provided in the NERC (Terms and Conditions for determination of Tariff)
Regulations, 2010, the matters i.e., Interest, Depreciation and Return on Equity
(ROE) are integral components for filing ARR and Tariff Petition.
Capt. Hekiye Sema, SAC Member
If the average cost of sale of power is Rs. 9.98 / unit as projected in the Tariff Petition
of the DPN and the Department is now seeking to raise the average cost of power /
5

unit to Rs. 3.52; the loss in the Power Department is very high and the Government
is made to bear a heavy burden.
Why not raise the rate to at least about Rs. 7/- per unit; but of course subsidize the
paying consumers to some extent?
NERC:
In the original tariff petition of November 2010, the DPN sought to raise the tariff to
average rate of Rs. 4.50/unit, so as to recover about 50% of the average cost of sale
i.e., Rs. 9.98 / unit as mentioned.
It is found that the above action would amount to raising the existing tariff (2006
level) by about 66%. This would be a heavy burden on the consumer at one go. The
Commission, in consideration of the issues raised by DPN relating to Interest,
Depreciation, Return on equity etc., have considered to accept the Revised ARR and
Tariff Petition in March 2011. The Commission is in the final stages of finalization of
the Tariff Order, where sans Interest, Depreciation, Return on equity and some other
components, the average cost of sale of power works out to be about Rs. 5.52 / unit.
The DPN have sought to revise tariff to realize tariff at an average rate of Rs. 3.52 /
unit as against average cost of sale of Rs. 5.52 / unit. This is what was projected in
DPN Public Notice published on 22.04.2011
As for raising tariff to any higher rate and providing subsidy to paying consumers, let
us say that the subject matter is outside the purview of present DPN Tariff Petition.
6

2. Summary of Petition of Power Department Nagaland for Aggregate Revenue Requirement
2.1 Introduction
The DPN in its petition has indicated the Aggregate Revenue Requirement (ARR) for
the year 2011-12 in ARR and tariff Petition. The estimated Aggregate Revenue
Requirement with the existing tariffs and the revenue gap are shown in Table 2.1
below:
Table 2.1: Aggregate Revenue Requirement and Revenue Gap projected by DPN for FY 2011-12
(Table 3.19 of ARR)(Rs. crore)
Sl.No. Particulars FY 2011-12(Projected)
1. Cost of Fuel 0.082. Cost of power purchase 127.423. Employee costs 59.124. R&M expenses 17.235. Administrative and general expenses 2.536. Depreciation 16.837. Interest charges (including interest on working capital) 38.848. Return on equity 51.269. Provision for bad debts 1.2610. Total revenue requirement 314.5611. Less non-tariff income 0.4012. Net revenue requirement (10-11) 314.1613. Revenue from existing tariff 75.4914. Revenue from sale of surplus power 35.5515. Gap (12-13-14) 203.12
The petitioner has shown a revenue gap of Rs.203.12 crore for the FY 2011-12.
2.2 The Power Department, Nagaland requested the Commission to:
1. The petition provides, inter-alia, DPN’s approach for formulating the present
petition, the broad basis for projections used, summary of the proposals being
made to the Commission, performance of DPN in the recent past, and certain
issues impacting the performance of DPN in the Licensed Area.
2. Broadly, in formulating the ARR and Tariff Petition for the FY 2011-12, the
principles specified by the Nagaland Electricity Regulatory Commission in
the notified (Terms and Conditions for determination of Tariff) Regulations,
2010 have been considered as the basis.
7

3. In order to align the thoughts and principles behind the ARR and Tariff
Petition, DPN respectfully seeks an opportunity to present their case prior to
the finalization of the Tariff Order. DPN believes that such an approach
would go a long way towards providing a fair treatment to all the
stakeholders and may eliminate the need for a review or clarification.
4. DPN may also be permitted to propose suitable changes to the ARR
petition and the mechanism of meeting the revenue on further analysis,
prior to the final approval by the Commission.
8

3. Power Sector in Nagaland – An Overview
3.1 Introduction
The DPN is responsible for distribution and supply of electricity in the State of
Nagaland.
The DPN is a deemed licensee under the provisions of Electricity Act, 2003 for
distribution of electricity in the state, it operates in an area of 16527 sq.km. The total
population of the State is around 19.89 lakhs as per 2001 census.
3.2 Power Supply
DPN has its own generation capacity of 27.5 MW at Likhimro Hydro power project.
Apart from this the power supply requirements of the DPN are met from its share from
Central Generating Stations which is wheeled through the PGCIL network of NER.
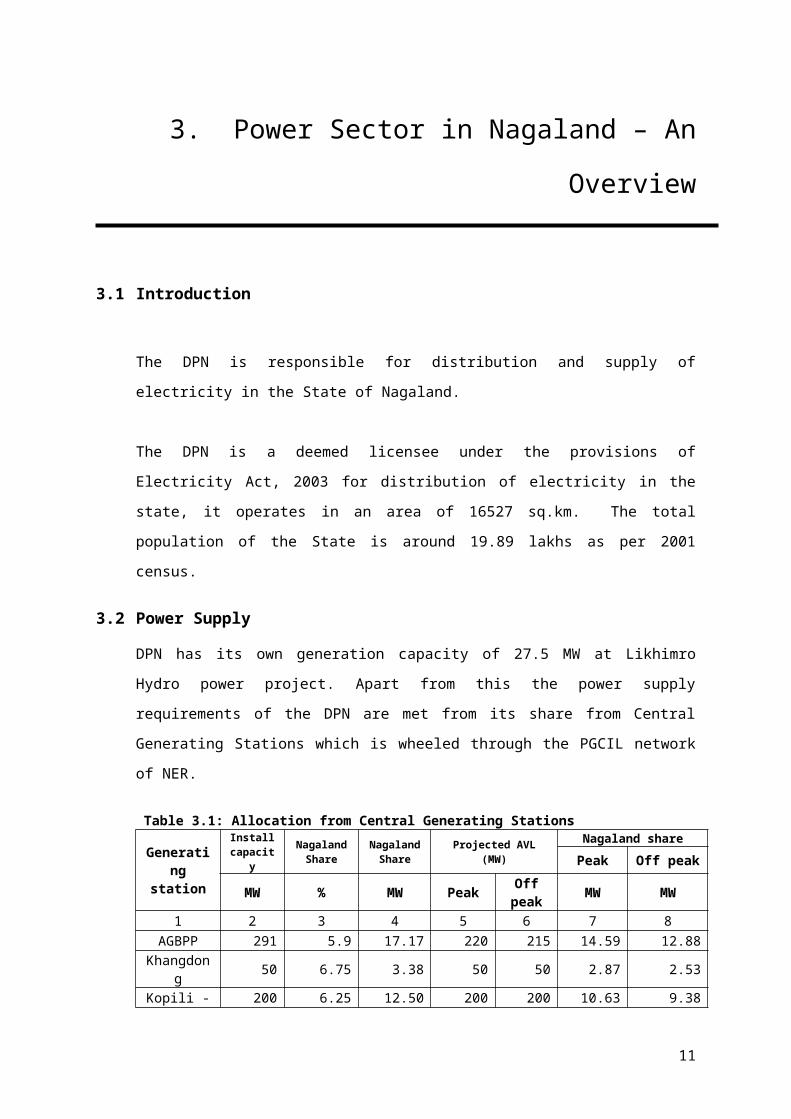
Table 3.1: Allocation from Central Generating Stations
Generating station
Install capacity
Nagaland Share
Nagaland Share
Projected AVL (MW)Nagaland share
Peak Off peak
MW % MW PeakOff
peakMW MW
1 2 3 4 5 6 7 8
AGBPP 291 5.9 17.17 220 215 14.59 12.88
Khangdong 50 6.75 3.38 50 50 2.87 2.53
Kopili - I 200 6.25 12.50 200 200 10.63 9.38
Kopili - II 25 5.75 1.44 25 25 1.22 1.08
AGTPP 84 5.7 4.79 84 78 4.07 3.59
Doyang 75 18.03 13.52 74 70 11.49 10.14
RHEP 405 5.43 21.99 405 401 18.69 16.49
Loktak 105 6.52 6.85 90 90 5.82 5.13
1148 1129 69.38508 61.222125
NTPC 25 21.25 18.0625 21.25 20.00
Total 1235 81.63 1169.25 1147.06 90.64 81.22
3.3 Transmission and Distribution Network
DPN owns and operates the transmission and distribution network as on 31.03.2010
as given in Table 3.2 below:
9

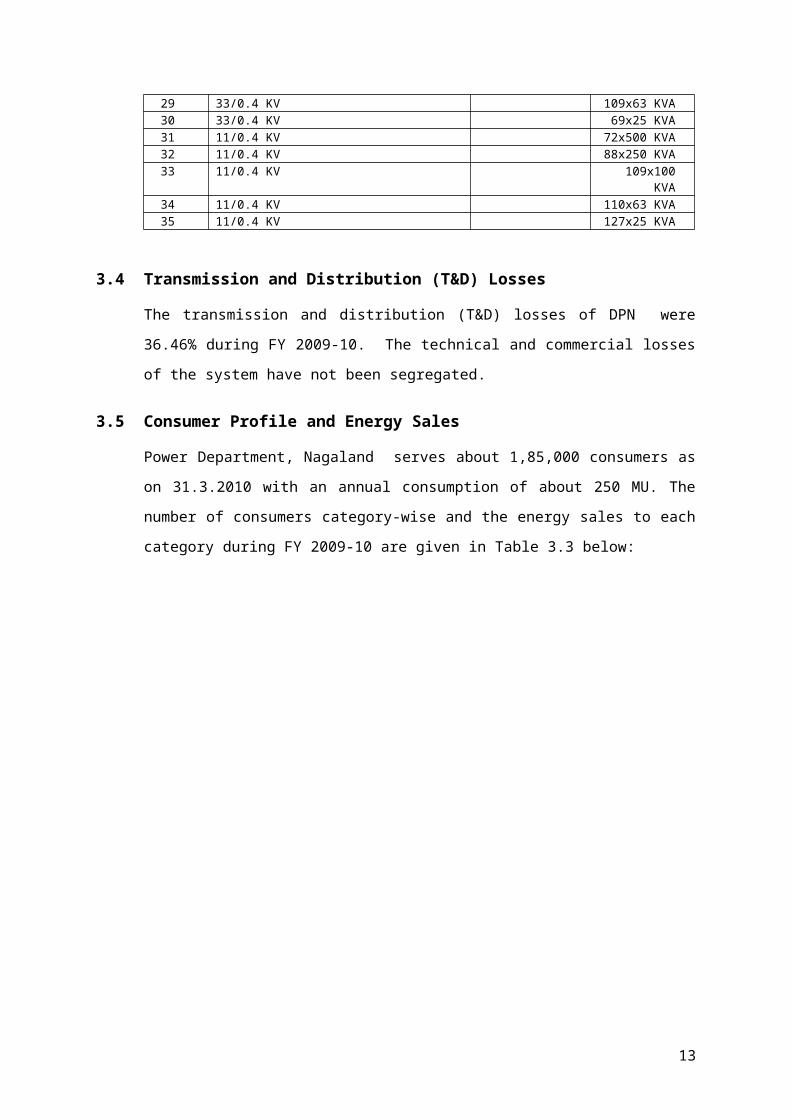
Table 3.2: Transmission and Distribution Network as on 31st March 2010.
Sl.No. Voltage Transmission lines (ck.km.)
Transformer Capacity
(A) Lines7 132 KV 382.28 66 KV 396.339 33 KV 414.310 11 KV 512.211 LT 2494.1(B) Capacity Wise Power Transformers12 132/66 KV 3x20 MVA13 132/66 KV 2x12.5 MVA14 132/66 KV 3x6.5 MVA15 132/33 3x8 MVA16 132/33 KV 2x5 MVA17 66/33 KV 3x20 MVA18 66/33 KV 3x7.5 MVA19 66/33 KV 6x5 MVA20 33/11 KV 5x10 MVA21 33/11 KV 7x5 MVA22 33/11 KV 4x2.5 MVA23 33/11 KV 22x1.6 MVA24 33/11 KV 2x1 MVA25 33/11 KV 13x0.5 MVA26 33/11 KV 59x500 KVA27 33/11 KV 53x250 KVA(C) Capacity wise Distribution Transformers28 33/0.4 KV 90x100 KVA 29 33/0.4 KV 109x63 KVA30 33/0.4 KV 69x25 KVA31 11/0.4 KV 72x500 KVA32 11/0.4 KV 88x250 KVA33 11/0.4 KV 109x100 KVA34 11/0.4 KV 110x63 KVA35 11/0.4 KV 127x25 KVA
3.4 Transmission and Distribution (T&D) Losses
The transmission and distribution (T&D) losses of DPN were 36.46% during FY
2009-10. The technical and commercial losses of the system have not been
segregated.
3.5 Consumer Profile and Energy Sales
Power Department, Nagaland serves about 1,85,000 consumers as on 31.3.2010
with an annual consumption of about 250 MU. The number of consumers category-
wise and the energy sales to each category during FY 2009-10 are given in Table 3.3
below:
10

Table 3.3: Consumer Profile and Energy Sales for FY 2009-10
Sl.No. Consumer Category Number of Consumers
Energy Sales (MU)
1. Domestic 164515 (89%) 175.84 (70%)2. Commercial 17273 (9%) 22.71 (9%)3. Industrial 2095 (1%) 11.86 (5%)4. Public Lighting 581 (0.3%) 1.83 (0.7%)5. Public Water Works 27 (0.01%) 1.27 (0.5%)6. Agriculture 2 (0.001%) 0.04 (0.01%)7. Bulk Supply 553 (0.30 %) 36.33 (15%)8. Total 185049 249.889. Out side state 75.67
Grand Total 185049 325.55
3.6 Demand and Supply Position
The demand of the state of Nagaland was about 95 MW during the FY 2009-10 and
the allocation from various Central Generating Stations (CGS) was about 90 MW. A
deficit of about 5 MW together with any shortfall from CGS was met by purchase
from other sources.
3.7 Power Supply Position
The power purchase from various Central Generating Stations and others during FY
2009-10, 2010-11 and 2011-12 excluding external losses of 3.93% for 2009-10 and
3.89% for FY 2010-11 and 2011-12 are given in Table 3.4 below:
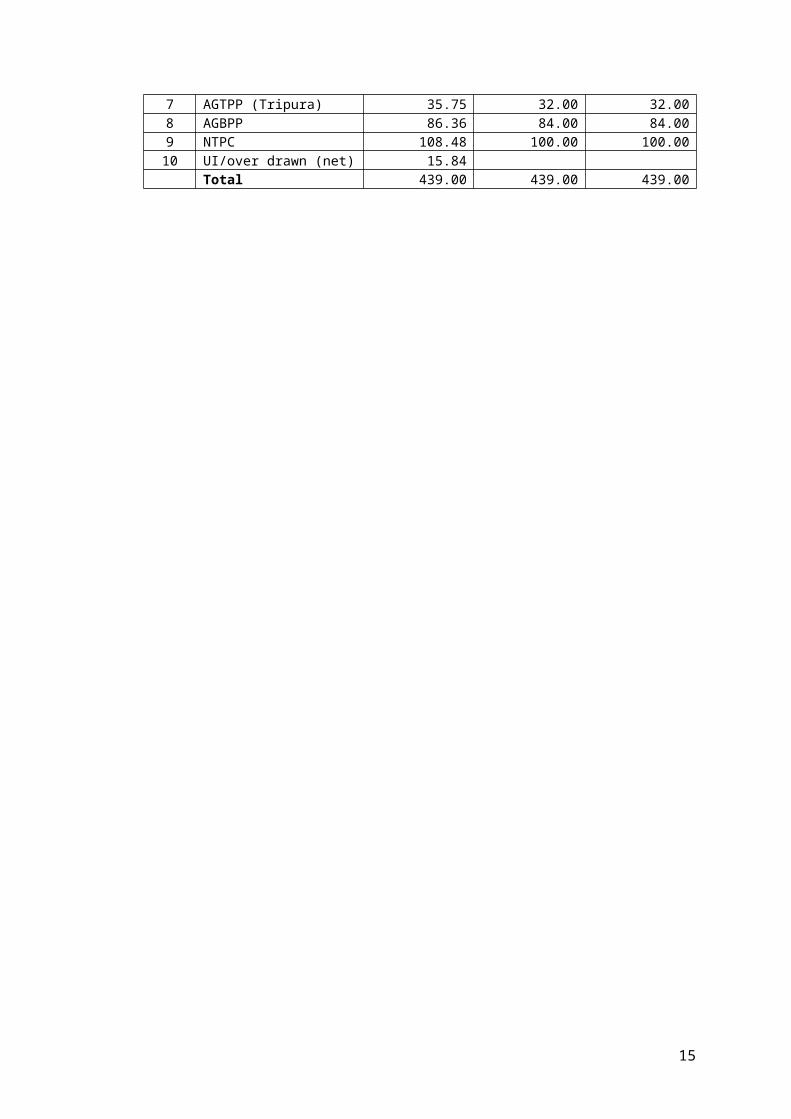
Table 3.4: Power Supply from Central Generating Stations and other Sources MU
Sl.No. SourceFY 2009-10
(Actual)FY 2010-11(Estimated)
FY 2011-12(Projected)
Central Sector1. Loktak, NHPC 23.98 28.00 28.002. Khandong NEEPCO
69.84 65.00 65.003 Kopili – I, NEEPCO4 Kopili – II, NEEPCO5 Ranganadi, NEEPCO 71.14 85.00 85.006 Doyang, NEEPCO 27.91 45.00 45.007 AGTPP (Tripura) 35.75 32.00 32.008 AGBPP 86.36 84.00 84.009 NTPC 108.48 100.00 100.00
10 UI/over drawn (net) 15.84Total 439.00 439.00 439.00
11

3.8 Energy Balance
The supply and demand during the FY 2009-10, 2010-11 and 2011-12 as furnished
by DPN are given in Table 3.5 below:
Table 3.5: Energy Balance(MU)
Sl.No.
Energy Balance FY 2009-10 (Actual)
FY 2010-11 (Estimated)
FY 2011-2012 (Projected)
A ENERGY REQUIREMENT1 Energy Sales within State 249.88 264.25 279.102 Sales to other distribution
licensees75.67 91 90
3 Total Energy Sales 325.55 355.25 369.10
4 Overall T & D Losses % 36.46 30.77 28.075 Overall T & D Losses (MUs) 186.81 157.91 144.066 Total Energy Requirement 512.36 513.16 513.16
B ENERGY AVAILABILITY7 Power Purchase from CGS/UI 439 439 4398 Generation 73.36 74.16 74.169 Total Energy Availability 512.36 513.16 513.1610 ENERGY SURPLUS/(GAP) 0.00 0.00 0.00
Source: Extracted from Table 3.3 of ARR
12
4. Brief Summary of Objections raised, Response from Department and
Commission’s comments
4.1 Public response to the Petition.
On admitting the ARR & Tariff Petition for the FY 2011-12 the Commission directed
the DPN to publish the Petition in news papers in abridged form duly inviting
Comments/Objections from public / stake holders.
In order to ensure transparency in the process of determination of tariffs as
envisaged in the Electricity Act 2003, the DPN arranged publication of petition in
abridged form in leading News Papers calling for objections / comments. Due date
was fixed as 20th May 2011. DPN or the Commission did not receive any objection /
comments from the public.
The Commission arranged issuing of notice in Newspapers for public hearing. Public
hearing was conducted on 9th June, 2011. The list of objectors who attended the
public hearing is listed in the Annexure 4.1
4.2 Objections/Suggestions and response of DPN
4.2.1 NERC Proceedings of Public Hearing on 9th June, 2011 at Kohima.
PUBLIC HEARING:
That in order to ensure transparency and to give opportunity to the general public &
different business organizations (from all Domestic, Commercial, Agriculture and
Industrial Consumers) and also to express their views/ comments/ suggestions /
objections in the process of Determination of Tariff as envisaged in the Electricity Act,
2003, Public Hearing was held at Kohima on 9th June, 2011 as scheduled.
The DPN (Department of Power, Nagaland) had published a Public Notice on 22nd
April, 2011 calling for written suggestions/objections, if any, on the ARR and Tariff
Petition filed by the Power Department on or before 20 th May, 2011 before the office
of the Chairman-cum-Member, NERC Kohima. No written suggestions/objections
were received till the given scheduled period; but on the day of Public Hearing a
13

written objection was received from the Nagaland Voluntary Consumer Organization
(NVCO), Kohima. Other participants from the general public including representatives
from various organizations like Youth Net, Kohima; DICE (Dialogues on Indigenous
Culture and Environment) Foundation, Kohima; Entrepreneurs Associates, Kohima
and Kohima Chamber of Commerce & Industries attended the Public Hearing. All
participants were given an opportunity to offer their views and suggestions/objections
in respect of ARR and Tariff proposal filed by the DPN. The list of the participants
who attended the Public Hearing is given in Annexure-4.1. The officers of the DPN,
who were present during the Public Hearing, responded to the objections/queries
raised by the objectors.
4.2.2 Objections raised by NVCO (Nagaland Voluntary Consumer Organization), Kohima:
Why the Commission is conducting Public Hearing when the department of Power
has already fixed the Electricity Tariff w.e.f. 01/04/2011?
Reply by the Commission:
As mandated under section 86 (1)(a) of the Electricity Act, 2003, the NERC directed
the DPN to file the Tariff Petition, which was filed by the DPN on 30/11/2010. The
NERC started processing of the said Tariff Petition and in order to give an
opportunity to all the public to express their views/suggestions/objections, the Public
Hearing is being held. In regard to the Interim Tariff, DPN may reply at later stage in
the course of this Public Hearing.
Either the Commission (NERC) or Power Department, Government of Nagaland has
the power to fix or regulate electricity supply in the State?
Reply by the Commission:
Under section 62 of the Electricity Act, 2003 it is only the Appropriate Commission
constituted under the Act has the power to revise the Tariff. Hence, it is the
Commission (NERC) who is empowered under the Act.
Why the DPN has brought out two different Tariff i.e. Tariff as per Public Notice as
appeared in Newspapers on 22nd April, 2011 and other Tariff as appeared in
Newspapers on 27th May, 2011?
14
Reply by DPN:
The Tariff was not revised by the DPN since 2006, hence the department was under
pressure by the State Government to revise the Tariff. Accordingly, the department
wrote to the NERC for revision of Tariff in the Month of July, 2010. At that point of
time the Commission was in the process of formulating the Tariff Regulation, 2010
and hence the DPN resorted for preparation of Interim Tariff and accordingly
forwarded to the Govt. for an approval.
In the meantime, NERC directed the DPN to file the Tariff Petition for the FY 2011-12
as per NERC tariff Regulation which was published in the month of October 2010.
The Department accordingly filed the said Petition on 30th Nov.2010. The
Commission, after examining the said Petition, vide letters dated 15/01/2011,
22/01/2011, and 25/01/2011 directed the DPN to furnish additional information/data.
The information sought by the Commission was furnished by the DPN only on 9 th
March, 2011 along with the Revised Tariff Petition for FY2011-12. Thereafter, the
Commission directed the DPN to publish the Public Notice in an abridged form of the
said Tariff Petition. The draft Public Notice was sent to the Govt. for an approval on
11th March, 2011 and also requested the State Govt. not to go ahead with the Interim
Tariff approved by the State Cabinet in view of the process of Tariff Petition filed
before the NERC following the publication of the Tariff Regulation by the
Commission. The Govt. accorded its approval only on 4th April, 2011. So, the DPN
published the said Public Notice in 3 (three) local daily English Newspapers for 2
(two) consecutive days starting from 22nd April, 2011.
That, inspite of the request made by the DPN, the State Government vide notification
No.PWR/TARIFF-15/94 dated 23rd March, 2011 was pleased to revise & fixed the
Interim Electricity Tariff for all categories in the State w.e.f. 01/04/2011.
The Department will implement the Tariff as per the provision of the Act.
“While the Consumers are facing deficiency in the services provided by the DPN such as:
a) There are places/villages where transformer got burnt and the department failed
to attend the transformer even for more than 6 (six) months keeping the villagers
without the electricity.
b) Frequent load shedding everywhere in the state, not even sparing the State
Capital.
15

c) That many Govt. offices and public buildings are not paying electricity bills and
there are cases of electricity theft within the state incurring huge losses to the
state.”
The DPN without taking the corrective steps to solve the aforesaid
problems/deficiency, why go ahead for increasing Tariff which will ultimately only
affect the genuine paying consumers?
Reply by the DPN:
a) On Transformers:
Till date, DPN has only one transformer repairing centre i.e. at Dimapur. When a
transformer gets damaged the same has to be transported to Dimapur for its
repairing; and as such, during the course of transportation & repairing the delays
are caused which is beyond the control of the Department.
b) On frequent Load Shedding:
The DPN has very less Generating Stations in the State. Hence, 90% of the
requirement of electricity in the state is purchased from outside the state.
As most of the outside state Power generating stations are hydro projects, during
OFF seasons (dry season) the state gets lesser Power allocation even from
outside the State. Hence, Load shedding becomes unavoidable.
To mitigate the above problem, the state requires developing its own generating
station for which the DPN has proposed to the Govt. for establishing a 160 MW
DIKHU Hydro Electric Project.
c) On Power theft and non-payment of Bills:
In this regard, the system has to be overhauled i.e., Department alone cannot
control the power theft, hence, co-operation from the public is required along with
the active support from the District Administration.
4.2.3 Objections raised by the representative from KCCI (Kohima Chamber of Commerce and Industries), Kohima:
1) “ Due to frequent interruption/load shedding resorted to by the DPN, the business
communities within the state are suffering as out of total 8 working hours in a day,
they are able to work only 2-3 hours a day with electricity supply. This results in
incurring heavy losses in establishments such as Electronics repairing centers,
16
Electrical Stores, Bakeries, Stone Crusher, Clinical laboratories etc which mainly
depend on electricity.”
The questioner also emphasized about need for setting up of the Cold Storage
and Refrigerator which will facilitate to preserve food stuff, vegetables etc but due
to frequent load shedding resorted by the DPN, the business community cannot
flourish.
Hence, the increase of Power Tariff without improving the service of electricity
supply is not at all justified.
Public voice is the strongest in any civilized society and as such the department
& the NERC should take up necessary measures to redress the grievances of the
business communities within the state.
Reply by DPN:
To mitigate the problem faced by the business communities and the general
public within the state, the Power Sector Authorities in the state are pursuing for
establishing HEP project as mentioned earlier as well as smaller hydro projects
and other renewable source generation projects.
The last Tariff fixed by the DPN was in the year 2006. The cost of power
purchase per unit (KWh) of power from outside the state have been increasing
periodically over the years. The maintenance cost of power supply system in the
state have also increased to a large scale and as such, the department is
compelled to enhance the Tariff to meet the additional expenses made by the
department to some extent.
4.2.4 Queries asked by representatives of DICE (Dialogues on Indigenous Culture and Environment) Foundation, Kohima:
1) What is the total power requirement of our state?
Reply by DPN:
95MW.
2) What is the Generation capacity of our state?
Reply by DPN:
We have 24 MW hydel generating station at Likhimro; but it generate maximum
up to 20MW only. During “OFF season” the generation is limited to only 6MW to 7
MW due to less volume of water in the river.
17

Therefore, 90% of our required energy is purchased from other states.
3) Whether this Tariff will be uniform with the other states?
Reply by DPN:
In view of the geographical conditions prevalent in the state, factoring the high
T&D losses even on account of this factor, tariff rates in the state are reasonable.
4) Whether Revenue collected through Communitization is effective?
Reply by DPN:
Communitization was implemented in our state in order to improve our Revenue
collection.
Through Communitization, consumers have been made to realize the importance
of electricity and they are made to participate and involve/control in improving the
electricity sector.
5) Whether the DPN is moving towards Privatization like other states in the
country or is going more of Govt. sector?
Reply by DPN:
We are trying to move more towards Privatization so that “Non-Technical”
persons’ interference can be reduced up to some extent.
18

Annexure – 4.1
List of persons who attended the Public Hearing on 9th June, 2011
1. Neingulie Nakhro Spokesperson, Kohima Chamber of Commerce &
Industry;
2. Hekani Jakhalu Director, Youthnet, Kohima;
3. Esther Swuro Youthnet, Kohima;
4. Kuovizo Belho Youthnet, Kohima;
5. Kezhokhoto Savi President Nagaland Volunatry Consumer Org.,Kohima.
6. R. Adeno Ngullie Nagaland Voluntary Consumer Org., Kohima.
7. Rabemo Nagaland Voluntary Consumer Org., Kohima.
8. Hutoshe Achumi Nagaland Voluntary Consumer Org., Kohima.
9. Huluvi Chophy Nagaland Voluntary Consumer Org., Kohima.
10. N.Chumben Ngullie Nagaland Voluntary Consumer Org., Kohima.
11. Pito Tuccu Nagaland Voluntary Consumer Org., Kohima.
12. Kekruselie Nagaland Voluntary Consumer Org., Kohima.
13. Neingular Noudi Nagaland Voluntary Consumer Org., Kohima.
14. Neichute Doulo Entrepreneurs Associates., Kohima.
15. M.Kikon Director, DICE Foundation, Kohima.
16. Wonchibeni Patton DICE Foundation, Kohima.
17. Johnny Lotha DICE Foundation, Kohima.
DPN officials:
1. Er.Imli Ao Addl. Chief Engineer (D&R);
2. Er.R.Angami S.E (Design);
3. Er.P.T.Philip SDO(E).
19

5. Aggregate Revenue Requirement 2011-12 - Commission’s Analysis and Decisions
5.1 Introduction
The ARR and Tariff petition filed by the DPN for 2011-12 on 30 th November, 2010
was incomplete as some of the data / information required under NERC (Terms and
Conditions for Determination of Tariff) Regulations, 2010 was not furnished. The
Commission directed the DPN through letters dated 15th January, 2011, 22nd
January, 2011 and 25th January, 2011 to furnish data / information. A hearing was
also conducted at the Commission’s office on 8th March, 2011 and the Department
was directed to furnish the data / information required. The Department has
submitted the additional information vide their letters dated 9 th March, 2011 and 23rd
March, 2011 under Affidavit.
The additional data / information submitted by the DPN is taken into consideration
while analyzing the ARR & Tariff Petition in the order.
5.2 Consumer Categories
DPN serves about 1,85,049 consumers as on 31st March, 2010 in its area of
operation and the consumers are broadly categorized as under:
Domestic including BPL
Commercial
Industrial
Public Lighting
Irrigation and Agriculture
The DPN serves the consumers at different voltages at which the consumers
avail supply.
5.2.1 Projected Consumer Growth and connected load
The DPN has furnished the details of category-wise consumers existing over the last
five years (2005-06 to 2009-10) and are shown in Table 5.1 below:
20

Table 5.1: Category-wise Consumers (Nos)
Sl.No. Category FY2005-06
FY2006-07
FY2007-08
FY2008-09
FY2009-10
1. Domestic 135020 156711 160760 163975 1645152. Commercial 14513 16516 16910 16928 17273
3. Industrial 1727 1947 1987 2021 20954. Public Lighting 664 704 743 759 5815. Agriculture 2 2 4 2
6. Public Water works 22 25 26 21 277. Bulk supply 139 152 169 173 1788. Inter State
Total 152085 176057 180597 189881 184671
Category wise-consumers estimated for FY 2010-11 and projected for FY 2011-12 by
DPN are indicated in Table 5.2 below:
Table 5.2: Consumers and connected load
Sl.No
Consumer Category No of Consumers Connected Load (kW)
(FY 2009-10)2010-11
Estimated2011-12
Projected1 Domestic 164000 163000 710002 Commercial 17400 17800 95003 Industrial 2150 2155 65004 Public Lighting 560 580 80005 Irrigation & Agriculture 2 2 206 Public Water works & sewage 30 34 7107 Bulk supply 180 185 20000
Total 184322 183756 115730 Source: Extracted from Table 3.2 of ARR petition and Annexure XII of additional information.
5.3 Energy Sales
The DPN has projected energy sales from 2005-06 to 2009-10 actuals and
estimation for 2010-11 and projection for 2011-12. The same are indicated in table
5.3 below:
Table 5.3: Energy Sales
S.No Category
2005-06(Actuals)
2006-07(Actuals)
2007-08(Actuals)
2008-09(Actuals)
2009-10(Actuals)
2010-11(Estimated)
2011-12(Projected)
1 Domestic 86.92 97.09 127.02 145.00 175.84 183.15 190.002 Commercial 14.46 13.60 9.77 8.95 22.71 23.16 25.203 Industrial 12.30 13.29 13.09 13.90 11.86 13.35 14.504 Public Lighting 3.63 4.57 4.42 4.86 1.83 2.02 2.40
5Irrigation & Agriculture 0.01 0.01 0.04 0.04 0.04 0.04
6
Public Water Works & Sewage 1.47 1.52 1.70 2.02 1.27 1.30 2.28
7 Bulk supply 26.02 26.42 26.72 18.20 36.33 41.23 44.68Total 144.80 156.50 182.73 192.97 249.88 264.25 279.10
21

The DPN has submitted that it has projected the category wise energy sales for FY
2011-12 based on the past sales over the five year period (FY 2005-06 to FY 2009-
10),new developments on account of Government policies, socio economic changes,
Industrial growth etc. that would effect consumption across various categories of
consumers, the growth in usage of new gadgets in urban areas have been taken as
guiding factors in estimating the sales. DPN has further stated that the CAGR is the
basis for sales projections. The trend method is a tried and tested method and is
used extensively across the states and accepted by the regulators. However the
CAGR considering the sales for the last five years presented an abnormal trend and
hence normalization has been undertaken for some categories for assessing the
sales for FY 2011-12.
5.3.1 Analysis of energy sales projected and Commission’s view
Reasonable projection of category wise sales is essential to determine the energy
required to be purchased and the likely revenue by sale of electricity.
DPN has projected the category wise energy sales for FY 2011-12 based on past
trends over a period of Five years (2005-06 to 2009-10). These sales with CAGR for
4 years, 3 years and year on year are shown in table 5.4 below.
Table 5.4: Energy Sales
Sl.No.
Category 2005-06 2006-07 2007-08 2008-09 2009-10 CAGR for 4 Year
CAGR for 3 Year
CAGR for Year on
Year(Actuals) (Actuals) (Actuals) (Actuals) (Actuals)
1 Domestic 86.92 97.09 127.02 145 175.84 19.26 21.89 21.27
2 Commercial
14.46 13.6 9.77 8.95 22.71 11.95 18.64 153.74
3 Industrial 12.3 13.29 13.09 13.9 11.86 -0.91 -3.72 -14.68
4 Public Lighting
3.63 4.57 4.42 4.86 1.83 -15.74 -26.29
-62.35
5 Irrigation & Agriculture
0.01 0.01 0.04 0.04 0.00 58.74 0.00
6 Public Water Works & Sewage
1.47 1.52 1.7 2.02 1.27 -3.59 -5.81 -37.13
7 Bulk supply
26.02 26.42 26.72 18.2 36.33 8.70 11.20 99.62
Total 144.8 156.5 182.73 192.97 249.88 14.61 16.88 29.49
Specific consumption based on number of consumers and total consumption is
worked out and shown in Table 5.5 below.
22

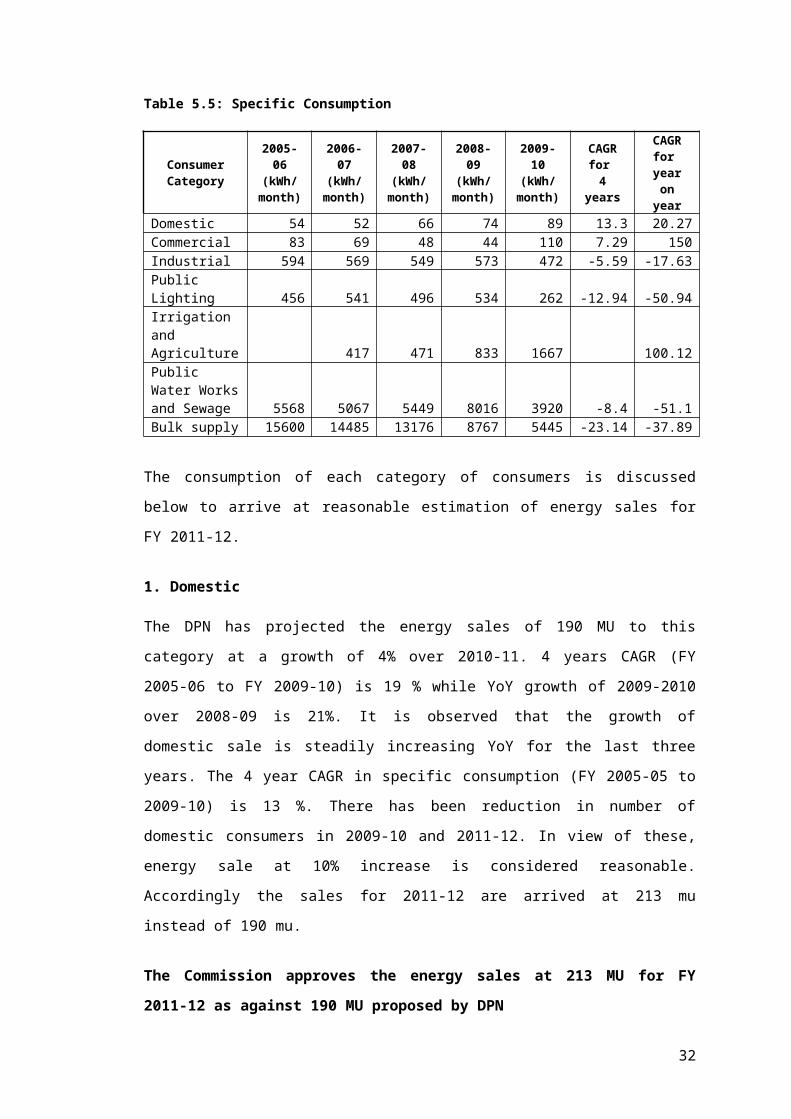
Table 5.5: Specific Consumption
Consumer Category
2005-06(kWh/
month)
2006-07(kWh/
month)
2007-08(kWh/
month)
2008-09(kWh/
month)
2009-10(kWh/
month)
CAGR for
4 years
CAGR for
year on year
Domestic 54 52 66 74 89 13.3 20.27Commercial 83 69 48 44 110 7.29 150Industrial 594 569 549 573 472 -5.59 -17.63Public Lighting 456 541 496 534 262 -12.94 -50.94Irrigation and Agriculture 417 471 833 1667 100.12Public Water Works and Sewage 5568 5067 5449 8016 3920 -8.4 -51.1Bulk supply 15600 14485 13176 8767 5445 -23.14 -37.89
The consumption of each category of consumers is discussed below to arrive at
reasonable estimation of energy sales for FY 2011-12.
1. Domestic
The DPN has projected the energy sales of 190 MU to this category at a growth of
4% over 2010-11. 4 years CAGR (FY 2005-06 to FY 2009-10) is 19 % while YoY
growth of 2009-2010 over 2008-09 is 21%. It is observed that the growth of domestic
sale is steadily increasing YoY for the last three years. The 4 year CAGR in specific
consumption (FY 2005-05 to 2009-10) is 13 %. There has been reduction in number
of domestic consumers in 2009-10 and 2011-12. In view of these, energy sale at
10% increase is considered reasonable. Accordingly the sales for 2011-12 are
arrived at 213 mu instead of 190 mu.
The Commission approves the energy sales at 213 MU for FY 2011-12 as
against 190 MU proposed by DPN
2. Commercial
DPN has projected the energy sales of 25.20 MU for FY 2011-12 at a growth of 9%.
The past growth in energy sales of this category is about 12 to 19%. The 4 year
CAGR of specific consumption is almost 7%. Considering the above factors the
growth of 9% for projecting the sales for FY 2011-12 is considered reasonable.
The Commission approves the energy sales of 25.20 MU for commercial
category for FY 2011-12 as proposed by DPN.
23

3. Industrial
DPN projected the energy sales of 14.5 MU to this category for the FY 2011-12 at a
growth of 9% as industrial growth is likely to pick up.
Since the DPN projected energy sales based on the latest data, the projected sales
of 14.5 MU for FY 2011-12 is considered reasonable.
The Commission approves the energy sales of 14.5 MU for industrial power
supply for FY 2011-12 as proposed by DPN.
4. Public lighting
The DPN has projected the energy sales for this category at 2.4 MU for FY 2011-12
at a growth rate of 19%. The past growth had been erratic. The 4 year CAGR was
(-)15.7%, 3 year CAGR was about (-)26.2% and the latest YoY during FY 2009-10
was (-) 62.3%.
The DPN has however projected consumption based on field conditions and is
considered.
The Commission accordingly approves energy sales for public lighting at 2.4
MU for FY 2011-12 as projected by the DPN.
5. Irrigation and Agriculture
The DPN has projected energy sales of 0.04 MU for FY 2011-12 at a zero growth.
The sales to this category were at the level of zero over the last three years. The
Commission accepts the projection of DPN for agriculture at 0.04 MU for FY 2011-
12.
The Commission accordingly approves energy sales for agricultural category
at 0.04 MU for FY 2011-12 as proposed by DPN.
6. Public Water Supply and Sewage System
The DPN has projected the energy sales for the category of 2.28 MU for the year
2011-12. Though a negative growth is observed during 2009-10, the DPN has
considered past growth in sales and projected 2.28 mu for 2011-12.
The Commission accordingly approves energy sales for Public water supply
and sewage system at 2.28 MU for FY 2011-12 as projected by DPN.
24

7. Bulk Supply
DPN has projected the energy sales of this category at 44.68 MU for FY 2011-12 at a
growth rate of 8%. The three-year CAGR (2006-07 to 2009-10) was 8.7%, four year
CAGR (FY 2005-06 to FY 2009-10) was 11.2% and the growth during FY 2009-10
over FY 2008-09 was 99.6%, sudden jump in consumption during FY 2009-10 over
FY 2008-09 is not explained (18.2 MU to 36.3 MU). The growth during FY 2010-11
over FY 2009-10 is about 13%.
Looking at the four year and three year CAGR of this category over the period FY
2005-06 to FY 2009-10 it is considered reasonable to consider a growth of 11%
based on three year CAGR.
Based on this annual growth of 11% the sales during FY 2011-12 would be 44.76 MU
The Commission accordingly approves energy sales for bulk supply at 44.76
MU for FY 2011-12 as against 44.68 MU projected by DPN
5.3.2 Category-wise Energy Sales
The category wise energy sales for FY 2011-12 as discussed above and the energy
sales projected by Power Department, Nagaland and approved by the Commission
are given in Table 5.6 below:
Table 5.6: Category wise energy sales for FY 2011-12
(MU) Sl.No.
Consumer CategoryEnergy sales projected
by DPN
Energy sales approved by the
Commission1. Domestic 190 213.002. Commercial 25.20 25.203. Industrial 14.50 14.504. Public Water Supply 2.28 2.285. Agriculture 0.04 0.046. Public lighting 2.40 2.407. Bulk supply 44.68 44.768. Total 279.10 302.18
5.4 Transmission and Distribution (T&D) losses
It is submitted by DPN that it has achieved significant reduction in transmission and
distribution loss during the recent years as a result of execution of system
improvement works under the plan schemes. It is submitted by DPN that their efforts
would be continued and will be enhanced henceforth.
25

The T&D loss (Actuals) of DPN during FY 2008-09 and 2009-10 are given in Table
5.7 below:
Table 5.7: T&D Loss for FY 2008-09 & 2009-10
Year T&D loss (%)FY 2008-09 (Actuals) 31.01FY 2009-10 (Actuals) 36.46
The DPN has projected the T&D loss for FY 2010-11 and FY 2011-12 as under:
FY 2010-11(Projected) 30.77FY 2011-12 (Projected) 28.07
DPN has shown 2.7% decrease in T&D Loss during 2011-12 over 2010-11
Commission’s Analysis
The DPN has arrived T&D loss as above considering the sales outside the state as
sales with in the state. But these sales cannot be taken for purpose of calculation of
loss.
The T & D loss furnished by DPN is including intra state transmission loss which the
DPN has not furnished .It would be around 4 to 4.5% as in the neighboring states.
The details of regional net work losses have been obtained from NERLD for the
period 29th March, 2010 to 6th Dec 2010 (37 weeks) during 2010-11. The data is
furnished in Annexure 5-1. The loss is in the range of 2.77% to 3.94%, highest loss
being 4.31% in April 2010. The average loss is about 3.21% .It is considered
reasonable to adopt 3.5% towards regional transmission loss (pool Loss).
The regional pool loss level of 3.5% has therefore been considered for DPN. Now
after considering regional pool loss of 3.5% the internal T & D loss of the state is
worked out for the year 2009-10 with the data furnished by DPN as follows.
Commission arrived at the T&D losses for 2009-10 as shown below.
Sl.No Particulars 2009-10Energy Availability
1 Own Generation (MU) 73.362 Power Purchase from CGS (MU) 395.253 Free Power from Doyang (MU) 27.914 Less Inter State Loss (Pool loss) @3.5% on (2) + (3) 14.815 UI Purchases 15.846 Less sales out side state 75.677 Power availability at state periphery 421.888 Sales with in States (MU) 249.889 T & D Loss (MU) 172.00
10 T & D Loss % 40.77
26

Thus the T & D loss during 2009-10 is 40.77% and not 36.46 % as furnished by DPN.
On the same lines the T & D losses during 2010-11 and 2011-12 are worked out and
furnished in Table 5.8 below.
Table 5.8: T&D loss worked out for FY 2010-11 & 2011-12:
Year Projected by DPN As Corrected above
2010-11 30.77 35.04
2011-12 28.07 31.54
The technical and commercial losses are not segregated. DPN should analyze the
reasons for such a high T & D loss and effective measures be taken to reduce the
losses by proper accounting of energy sales, conducting voltage wise energy audit
by providing meters on incoming lines and arresting pilferage of energy and
replacement of all defective meters and installation of meters to all un metered
connections.
With the above observations the trajectory loss reduction for the year 2011-12 to
2013-14 is fixed as follows
2011-12 31.562012-13 29.502013-14 27.50
DPN shall make all efforts for reduction of losses in the system as above.
5.5 Energy Requirement and Availability
DPN has projected energy requirement and availability as detailed in liable 5.9 below
Table 5.9: Energy Balance(MU)
Sl.No.
Energy BalanceFY 2009-10
(Actual)FY 2010-11 (Estimated)
FY 2011-2012 (Projected)
A ENERGY REQUIREMENT1 Energy Sales within State 249.88 264.25 279.102 Sales to other distribution licensees 75.67 91 903 Total Energy Sales 325.55 355.25 369.10
4 Overall T & D Losses % 36.46 30.77 28.075 Overall T & D Losses (MUs) 186.81 157.91 144.066 Total Energy Requirement 512.36 513.16 513.16
B ENERGY AVAILABILITY7 Power Purchase from CGS/UI 439 439 4398 Generation 73.36 74.16 74.169 Total Energy Availability 512.36 513.16 513.1610 ENERGY SURPLUS/(GAP) 0.00 0.00 0.00
27

Source: Extracted from Table 3.3 of ARR
Commission’s Analysis
As seen from the above DPN has not considered the regional transmission losses
and clubbed the outside sales (UI Sales) with the sales within the state which is not
in order. The sales outside the state will effect at state periphery, so intra state T & D
loss has no bearing on out side sales. The power purchase from central generating
stations will be billed at ex bus of the respective generators. So the power received at
state periphery will be influenced by regional pool loss. With the above observation
the energy balance is modified without any changes in basic data given by DPN as
detailed in table 5.10 below:
Table 5.10 Rectified Energy balance(MU)
Sl.No.
Particulars 2011-12Projected by
DPN
2011-12Approved by Commission
A Energy Requirement1 Sales within the state 279.10 302.182 T & D Loss (MU) 128.69 139.343 T & D Loss (%) 31.56 31.564 Energy required at the state periphery 407.79 441.52B Energy Availability1 Own generation (net) 74.16 74.162 Power purchase from CGS & others 394.00 394.003 Free power from Doyang 45.00 45.004 Less Inter state transmission
Loss @3.5% on (2) & (3)15.37 15.37
5 UI Purchases - -6 Total Power availability at state
Periphery ((1+2+3-4)+5)497.79 497.79
7 Energy required 407.79 441.528 Surplus for sale outside the State 90.00 56.27
Note: DPN clubbed sales outside the state with sales inside the state and calculated T&D losses
5.6 Gross fixed Assets
The DPN has projected GFA as on 1.4.2009 at 422.88 Cr as on 1-4-2009 based on
available information in the absence of fixed asset registers. Additions during the
year have been considered from the works capitalized. The DPN has furnished year
wise GFA as detailed in table 5.11 below:
28

Table 5.11: Gross Fixed Assets (Rs.
Crore)Sl.No.
Financial Year Opening Balance
Addition during the year
Closing Balance
1 FY 2009-10 422.88 149.20 572.082 FY 2010-11 572.08 76.26 648.343 FY 2011-12 648.34 76.26 724.60
Commission’s Analysis
The DPN has been maintaining Annual Accounts; and but not audited. DPN has also
not maintained the asset registers. In view of this, Commission cannot accept the
GFA furnished by DPN for purpose of depreciation and return on equity / capital
base.
5.7 Capital Investment
The DPN has projected capital expenditure of Rs. 120.39 Cr during 2011-12.
Scheme wise details during 2009-10 (Actuals) and 2010-11 (estimated) and 2011-12
(projected) are furnished in Table 5.12, 5.13 & 5.14 below:
Table 5.12 Investment Plan (Scheme wise) 2009-10 (Rs. Crore)
Sl.No
Particulars
EleventhPlan
(Actual) FY 2009-10
Approved outlay
Approved outlay
Actual Expenditure
PlanOut side
Plan1 Generation Schemes 100.00 18.75 17.81 5.502 Transmission & Distribution
Schemes225.00 31.89 26.26 12.00
3 Renovation & Modernization 80.00 29.00 35.00 7.474 Rural Electrification 90.00 8.46 8.03 54.005 Miscellaneous Expenditure 64.40 2.00 3.00
Total 559.40 90.10 90.10 78..97
Table 5.13 Investment Plan (Scheme wise) 2010-11
(Rs. Crore)
Sl.No. Particulars
EleventhPlan
FY 2010-11
Approved outlay
Approved outlay
Actual Expenditure
PlanOut side
Plan1 Generation Schemes 100.00 7.61 7.612 Transmission & Distribution
Schemes225.00 34.66 34.66 31.73
3 Renovation & Modernization 80.00 10.39 10.39 34.004 Rural Electrification 90.00 2.00 2.005 Miscellaneous Expenditure 64.40
Total 559.40 54.66 54.66 65.73
29

Table 5.14 Investment Plan (Scheme wise) 2011-12
(Rs. Crore)
Sl.No.
Particulars
Eleventh Plan FY 2011-12
Approved outlayApproved
outlay
Actual Expenditure
PlanOut side
Plan1 Generation Schemes 100.00 7.61 7.612 Transmission & Distribution
Schemes225.00 34.66 34.66 31.73
3 Renovation & Modernization 80.00 10.39 10.39 34.004 Rural Electrification 90.00 2.00 2.005 Miscellaneous Expenditure 64.40
Total 559.40 54.66 54.66 65.73
Capital Works in progress is furnished in table 5.15 below:
Table 5.15 Capital works in progress
(Rs. Crore)Sl.No.
Particulars FY 2009-10(Actual)
FY 2010-11(Estimated)
FY 2011-12(Projected)
1 Opening Balance 480.15 500.02 544.152 Add; New Investments 169.07 120.39 120.393 Total (1+2) 649.22 620.41 664.544 Less Investment capitalized 149.20 76.26 76.265 Closing balance 500.02 544.15 588.58
Quantum of works in progress has been increased. Works programmed may be got
completed and assets taken into service. This is further discussed while dealing with
depreciation at para 5.12.
5.8 Revenue Requirement for FY 2011-12
DPN has projected a total ARR of Rs. 314.16 Cr for the year 2011-12 as given in
table 5.16 below.
Table 5.16 Expenses projected by DPN for 2011-12
(Rs. crore)Sl.No Item Of Expenditure Proposed
FY 2011-121 Cost of fuel 0.082 Cost of power purchase 127.423 Employees cost 59.124 O & M Expenses 17.235 Adm & Gen Expenses 2.536 Depreciation 16.837 Interest charges ( including interest on working capital) 38.848 Provision for Bad debt 1.269 Return on Equity 51.26
10 Total revenue requirement 314.5611 Less: Non tariff income 0.4012 Net revenue requirement 314.1613 Revenue from tariff 75.4614 Revenue from sale of surplus power 35.5515 Gap (12-13-14) 203.1217 Revenue surplus carried over 0.0018 Additional revenue from proposed tariff 50.1219 Regulatory asset 153.01
30

20 Energy Sales (MU) 279.10
Commission’s Analysis
The expenses projected by DPN under each head and the Commission’s analysis
are discussed below.
5.9 Fuel Cost
DPN has projected fuel cost of Rs. 0.08 Cr for FY 2011-12.
The Commission approves the fuel cost of Rs. 0.08 Cr for the year 2011-12 as
projected by DPN.
5.10 Power Purchase cost
The allocation of power from CGS, the parameters adopted by DPN to arrive at the
entitlement of energy from CGS and estimated availability of energy for purchase for
the FY 2011-12 are discussed in para 5.5 above.
The power purchase cost estimated by DPN for the year 2011-12 is given in table
5.17 below:
Table 5.17 Power Purchase cost projected by DPN for FY 2011-12
Sl.No.
Source
2009-10(Actuals) 2010-11(Estimated) 2011-12(Projected)
Purchase(MU)
Rate(Rs/
KWh)
TotalCost
Purchase(MU)
Rate(Rs/
KWh)
TotalCost
Purchase(MU)
Rate(Rs/
KWh)
TotalCost(Rs.
Crore)1 NEEPCOa Kopili 69.84 1.04 7.26 65.00 1.05 6.83 65.00 1.05 6.83b Khangdongc AGTPP (Tripura) 35.45 1.92 6.81 32.00 2.85 9.12 32.00 2.85 9.12
AGBPP 86.36 2.23 19.26 84.00 2.88 24.19 84.00 2.88 24.19d Ranganadi (RHEP) 71.14 2.40 17.06 85.00 1.89 16.07 85.00 1.89 16.07e Doyang (DHEP) 10.24 4.38 4.48 18.00 4.25 7.65 18.00 4.25 7.652 NHPC 23.98 1.37 3.28 28.00 1.38 3.86 28.00 1.38 3.863 NTPC 108.48 2.41 26.18 100.00 2.48 24.80 100.00 2.48 24.804 PGCIL
(Trans.Charges)20.92 26.00 26.00
5 Purchase from IPP/Private sector
- - - - - - - -
6 NERDC/NERPC charges
0.63 0.90 0.90
7 UI/over drawn (net) 15.84 6.56 10.39 8.00 8.008 Total Energy
Purchase421.33 2.76 116.27 412.00 127.42 412.00 127.42
9 Free Power from Doyang
17.67 27.00 27.00
10 (Total energy available)
439.00 2.65 116.27 439.00 2.90 127.42 439.00 2.90 127.42
11 Arrear energy bill/IT paid
- - -
12 Total of the year 116.27 127.42 127.42
31

Commission’s Analysis
As seen from the power purchase cost projected by DPN for the FY 2011-12 PGCIL
transmission charges are increased from Rs. 20.92 Cr to 26 Cr for 2010-11 over
2009-10. DPN claimed Rs. 26 Cr for 2011-12 at the same level. The same is
approved by the Commission. RLDC charges are increased from 0.63 Cr to 0.90 Cr
for 2011-12. Commission allows these charges. UI Charges of Rs. 8 Cr projected
without any purchase of energy under UI. Hence the same is not allowed with the
above observation the power purchase cost is approved as detailed in table 5.18
below.
Table 5.18 Power Purchase for the year 2011-12
Sl. No.
Source Purchase (MU)
Rate (Rs./ KWh)
Total Cost (Rs. Crore)
1 2 3 4 51 NEEPCOA Kopili 65.00 1.05 6.83B KhangdongC AGTPP (Tripura) 32.00 2.85 9.12D AGBPP 84.00 2.88 24.19E Ranganadi (RHEP) 85.00 1.89 16.07F Doyang (DHEP) 18.00 4.25 7.652 NHPC 28.00 1.38 3.863 NTPC 100.00 2.48 24.804 PGCIL (Trans.Chrges) 26.005 NERLDC/NERPC charges 0.906 UI /over drwan (net) -7 Total Energy Purchase 412.00 119.428 Free Power from Doyang 27.00 0.009 (Total energy available) 439.00 119.42
The Commission accordingly approves Rs. 119.42 crore towards power purchase
cost for the year 2011-12 as against Rs. 127.42 crore projected by DPN.
5.11 Operation and Maintenance Expenses
The O&M expenses comprises of employee expenses, Repairs and Maintenance
expenses and administration and general expenses
The DPN has projected the over all O&M expenses at Rs. 78.88 crore for the year
2011-12 as detailed in table 5.19 below:
32

Table 5.19:- Operation & Maintenance Expenses for FY 2011-12
(Rs. Crore)Sl.No.
SourceFY 2009-10
(Actual)FY 2010-11(Estimated)
FY 2011-12(Projected)
1 Employee cost 33.17 56.59 59.122 Repair & Maintenance
Expenses16.23 16.55 17.23
3 Administration and General Expenses
1.71 2.25 2.53
Total Operation & Maintenance Expenses
51.11 75.39 78.88
5.11.1 Employee Cost
DPN has projected the employee cost at Rs. 59.12 Cr for the year 2011-12. The
employee cost includes salaries, allowances, bonus, LTC and Honorarium, leave
salary etc. The component wise details of employee cost (actuals) for the years
2007-08 to 2010-11 (upto 30.9.2010) as furnished by DPN and are shown in Table
5.20 below:
Table 5.20 Employee cost actuals for 2007-08 to 2010-11 (upto 30.9.2010)
(Rs. Lakhs)Sl.No.
Particulars 2007-08 2008-09 2009-102010-11
(Up to 30.09.2010)
SALARIES & ALLOWANCES1 Basic Pay 1834.92 1865.46 1894.41 2033.542 Dearness Pay 0.00 0.00 0.00 0.003 Dearness Allowance 864.32 985.81 1241.28 467.714 House rent Allowance 73.44 78.00 79.08 114.865 Fixed medical allowance 24.38 24.72 25.52 23.006 Medical reimbursement charges 20.50 23.02 25.73 0.007 Over time payment 0.00 0.00 0.00 0.008 Other allowances 10.62 9.52 9.88 15.549 Generation incentive 0.00 0.00 0.00 0.00
10 Bonus 0.00 0.00 0.00 0.0011 Total 2828.18 2986.63 3275.90 2654.6512 Leave encashment 44.50 46.53 41.53 175.0013 Gratuity 0.00 0.00 0.00 0.0014 Communication of pension 0.00 0.00 0.00 0.0015 Workman compensation 0.00 0.00 0.00 0.0016 Ex-gratia 0.00 0.00 0.00 0.0017 Total 44.50 46.53 41.53 175.00
Pension payment 0.00 0.00 0.00 0.0018 Basic pension 0.00 0.00 0.00 0.0019 Dearness Pension 0.00 0.00 0.00 0.0020 Dearness allowance 0.00 0.00 0.00 0.0021 Any other expenses 0.00 0.00 0.00 0.0022 Total 0.00 0.00 0.00 0.0023 Total (11+17+22) 2872.68 3033.16 3317.43 2829.6524 Amount capitalized 0.00 0.00 0.00 0.0025 Net amount 0.00 0.00 0.00 0.0026 Add prior period expenses 0.00 0.00 0.00 0.0027 Grand total 2872.68 3033.16 3317.43 2829.65
33
The DPN has stated the increased level of expenses in 2011-12 related to increase
in pay & allowances as per 6th Pay Commission and Nagaland Services (Revision of
Pay) Rules, 2010.
Commission’s Analysis
As seen from the above table it is observed that the increase in employee cost during
2008-09 over 2007-08 is 5.57 %. While during 2009-10 over 2008-09 is 9.36%.
During 2010-11 steep increase is observed which may be due to the impact of
implementation of 6th Pay Commission pay scales and Nagaland Services (Revision
of Pay) Rules, 2010 and payment of arrears. DPN has furnished actual expenses for
6 months of 2011-12 at Rs. 28.30 Cr. During hearing on 8th March 2011 the finance
officer of the DPN has explained the need for increase consequent to revision of pay
as mentioned above. Considering 6 months actuals, Commission approves
employee expenses at Rs.57 Cr for 2011-12
The Commission accordingly approves Rs 57 crore towards employee costs
for FY 2011-12 as against DPN projection of Rs 59.12 crore
5.11.2 Repairs and Maintenance Expenses
DPN has projected Rs 17.23 Cr towards R & M expenses for the FY 2011-12. The R
& M expenses include expenses on R & M of electrical equipment, transmission and
distribution system, vehicles, furniture and fixtures, office equipment and buildings
etc.
The DPN has estimated the expenses during 2010-11 at increased rate of 2% over
actual expenditure incurred during 2009-10 and projected at 4% for the year 2011-12
as detailed in table 5.21 below:
Table 5.21 Repair & Maintenance Expenses
(Rs. Lakhs)Sl.No.
ParticularsFY 2009-10
(Actuals)FY 2010-11(Estimated)
FY 2011-12(Projected)
1 Plant & Machinery 2.75 3.25 3.502 Building 8.25 9.00 10.753 Hydraulic works & civil works 5.75 6.25 6.754 Line cable & network 1592.00 1620.00 16.84.005 Vehicles 9.75 11.50 12.756 Furniture & Fixtures 2.25 2.50 2.507 Operating expenses 2.25 2.50 2.75
Total 1623.00 1655.00 1723.00
34

The DPN was requested to furnish actual expenditure for 2011-12 accordingly they
furnished 6 months actuals at Rs.7.94 crore.
Commission’s Analysis
The DPN has subsequently furnished actual expenditure during first half of FY 2010-
11 from 4/2010 to 9/2010 of Rs 7.94 crore. The expenses for 2010-11 are Rs. 15.86
crore. An increase of 5% is considered for 2011-12 over the expenses of 2010-11.
Considering the above the Commission accordingly approves Rs 16.70 Cr for the
year 2011-12 against Rs. 17.23 proposed by DPN.
5.11.3 Administration and General Expenses
The DPN has projected Admin and General Expenses at Rs 2.53 crore for the year
2011-12. Administration and General Expenses comprise payment of rent, rates and
taxes, Telephone, postage expenses, conveyance and travel expenses, technical
and consultancy fee etc.
The details of Expenses projected by DPN are furnished in table 5.22 below:
Table 5.22 Administrative & General Expenses for FY 2011-12
(Rs. Lakhs)Sl.No.
Particulars FY 2009-10(Actuals)
FY 2010-11( Estimated)
FY 2011-12(Projected)
1 Rent, rate & taxes 11.55 17.50 20.502 Telephone, postage & telegrams 12.00 18.75 22.503 Consultancy Fees 0.00 15.00 15.004 Technical fees 0.00 20.00 20.005 Other Professional charges 7.45 7.45 7.456 Conveyance & travel expenses 55.00 90.00 110.007 Others 85.00 56.08 57.93
Total 171.00 224.78 253.38
The DPN has subsequently furnished actual expenditure for 6 months of 2010-11 as
directed by the Commission at Rs. 1.07 crore.
Commission’s Analysis
Based on actual expenditure of Rs.1.07 crore for six months the expenses for FY
2010-11 are Rs.2.14 crore. Considering an increase of 5% the expenses for FY
2011-12 would be Rs.2.25 crore.
The Commission approves Rs 2.25 crore towards Administration and General
Expenses for the year 2011-12 as against Rs. 2.53 projected by DPN.
35

5.12 Depreciation
The DPN has projected depreciation of Rs. 16.83 Cr for the year 2011-12. DPN has
applied average rate of depreciation as 2.45 % for the year 2011-12. The details
projected by DPN are furnished in table 5.23 below.
Table 5.23: Depreciation for the FY 2011-12 projected by DPN
(Rs. crore)Sl. No. Particulars FY 2011-12
1 Gross Block in Beginning of the year 648.342 Additions during the Year 76.263 Cumulative Depreciation at the Beginning of the Year 136.574 Average Rate of Depreciation 2.45%5 Depreciation for the Year 16.836 Cumulative Depreciation at the End of the Year 153.407 Net Block in the Beginning of the Year 511.778 Net Block in the End of the Year 571.20
Commission’s Analysis
DPN has not maintained asset / depreciation registers. Audited proforma accounts
are also not furnished. This subject is discussed in Para 5.6 and DPN is directed to
verify the assets and update the assets / depreciation registers and produce in the
next filing along with audited proforma accounts to allow depreciation.
In view of the above the Commission is not allowing any depreciation for the
year 2011-12.
5.13 Interest and Finance Charges
DPN has projected interest & finance charges at Rs. 36.86 Cr for FY 2011-12. The
DPN has treated 50% of GFA as on 31.3.2010 as notional debt and considered
funding through normative loan, with the assumption that these notional loan be
repaid in next 10 years. The rate of interest is assumed at 11.5% being the SBI PLR
as on 1.4.2010 Based on the above assumptions interest is worked out as detailed in
table 5.24 below.
36

Table 5.24 Interest and Finance Charges
(Rs. Crore)Sl. No.
Particulars FY 2010-11 (Estimated)
FY 2011-12 (Projected)
1 Opening Loan 286.04 310.822 Loan Additions 53.38 53.383 Repayment 28.60 33.944 Closing Loan 310.82 330.265 Average Loan 298.43 320.546 Wt Avg Interest on Loan 11.50% 11.50%7 Interest on Loan 34.32 36.868 Total Interest & Finance Charges 34.32 36.86
But in the format 15 of the Petition DPN has furnished year wise and institution wise
loans availed during 2009-10, 2010-11 and 2011-12 as detailed in Table 5.25, 5.26
and 5.27 below:
Table 5.25: Institution wise loan and details and interest for FY 2009-10 (Rs. crore)
Sl. No.
ParticularsOpening balance
Rate ofInterest
Addition during
the year
Repayment
during the year
Closing balance
Amount of
interest paid
1 2 3 4 5 6 7 8
1 REC 66.48 18.76 6.71 78.53 9.26
2 PFC 33.39 5.00 12.69 25.70 3.58
3
OTHERS-NABARD/HUDCO / BOND 0.82 27.24 0.09 27.97 5.24
TOTAL 100.69 51.00 19.49 132.20 18.08
Table 5.26: Institution wise loan and details and interest for FY 2010-11
(Rs. crore)
Sl. No.
ParticularsOpening
balance
Rate ofInterest
Addition during
the year
Repayment
during the year
Closing balance
Amount of
interest paid
1 2 3 4 5 6 7 8
1 REC 78.53 12.39 7.00 83.92 10.00
2 PFC 25.70 0.00 9.62 16.08 2.69
3
OTHERS-NABARD/HUDCO/BOND 27.97 7.61 0.09 35.49 5.23
TOTAL 132.20 20.00 16.71 135.49 17.92
37

Table 5.27: Institution wise loan and details and interest for FY 2011-12
(Rs. crore)
Sl. No.
ParticularsOpening balance
Rate ofInterest
Addition during the
year
Repayment
during the year
Closing balance
Amount ofinterest
proposed
1 2 3 4 5 6 7 81 REC 83.92 12.39 7.00 89.31 10.002 PFC 16.08 0.00 9.62 6.46 2.69
3
OTHERS-NABARD/HUDCO/BOND 35.49 7.61 0.09 43.01 5.23
TOTAL 135.49 20.00 16.71 138.78 17.92
Commission’s Analysis
The notional interest claimed by DPN as per Table 5.24 is Rs. 36.86 Cr and as per
table 5.26 actual interest proposed to be paid is Rs. 17.92 Cr. The DPN in reply to
Commission’s letters dated 19.1.2011 and 22.1.2011 has stated as follows:
“Loans from various financial institutions have been availed by the State
Government and provided to the power department as a budgetary support.
The same is treated in the account of power department as grant. Payment of
interest on loans and repaying is done by State Government….”
In view of the above the Commission has not considered any interest charges
for the year 2011-12
5.14 Interest on Working Capital
The DPN has projected interest on working capital for FY 2011-12 at RS 1.97 Cr on
normative basis. As per NERC Regulations, working capital shall be the sum of one
month requirement of the following
Fuel Cost
Power Purchase Cost
Employee Cost
Administration & General Expenses
R & M Expenses
The rate of Interest claimed by the DPN is 11.5 % being the SBI prime-lending rate
as on 1st April 2010. The details of interest on working capital are furnished in table
5.28 below:
38

Table 5.28: Interest on working capital
Sl.No.
ParticularsAmount ( Rs. In Crore)
2010-11 (Estimated)
2011-12 (Projected)
1 Fuel Cost 0.01 0.012 Power Purchase Cost 10.62 10.623 One month’s employees Cost 4.72 4.934 Administration & General Expenses 0.15 0.185 One Month’s R & M Cost 1.38 1.446 Total 16.88 17.17
Interest on working capital 1.94 1.97
Commission’s Analysis
The DPN has claimed interest on working capital on normative basis as per NERC
Regulations and considered the rate of interest at 11.75%. The interest is claimed at
Rs.1.97 crore.
The interest on working capital is revised based on approved cost of the following.
Fuel Cost One Month
Power Purchase Cost One Month
Employee Cost One Month
Administration Expense One Month
R & M Expenses One month
Considering the interest rate of 11.75% as per SBI short-term PLR as on 1st April,
2010 the interest works out to Rs.1.91 crore as shown in Table 5.29.
Table 5.29 : Interest on working capital FY 2011-12
(Rs. crore)Sl.No.
Particulars Total Cost Cost for One Month
1 Fuel Cost 0.08 0.012 Power Purchase Cost 119.42 9.953 Employees Cost 57.00 4.754 Administration & General Expenses 2.25 0.195 R & M Expenses 16.70 1.39
Total 195.45 16.296 Rate of Interest 11.757 Interest on working capital 1.91
Commission therefore allows Rs.1.91 crore instead of Rs.1.97 crore claimed by DPN.
39

5.15 Return on equity
The DPN has projected return on equity at R 51.26 Cr at 16 % as detailed in table
5.30 below
Table 5.30: Return on Equity for FY 2011-12 projected by DPN
(Rs. Crore)Sl.No.
ParticularsFY 2010-11 (Estimated)
FY 2011-12 (Projected)
1 Opening Equity 286.04 308.922 Equity Addition (30% Capex for the
FY ) 22.88 22.88
3 Closing Equity 308.92 331.804 Average Equity 297.48 320.365 Rate of Return on Equity 16% 16%6 Return on Equity 47.60 51.26
The DPN has submitted that the distribution business has always been perceived to
be a business having a greater inherent risk than the generation and transmission
business due to various factors amongst which the direct interface with the retail
consumers is the biggest risk. The same has been recognized by many
Commissions across the country and they have proposed a higher rate of return on
the equity invested in distribution business as compared to generation and
transmission business. This has been demonstrated by various Commissions by
offering rate of return at 16% for distribution as compared to 14% to other business
areas. It may also kindly be noted that CERC in its recent tariff regulation of 2009 for
generation and transmission has fixed pre tax return on equity at 15.5% with an
additional return of 0.5% for projects completing within specified time limits.
The DPN being a Government Department the entire capital employed has been
funded through equity infusion by government of Nagaland through budgetary
support without any external borrowing. DPN has cited examples of Central Power
Sector Undertakings (CPSUs) undertaking such as NTPC, NHPC, PGCIL where the
actual equity deployed in the assets created prior to formulation of tariff regulations
was much higher than the equity calculated considering a normative debt :equity ratio
of 70:30. These CPSUs were allowed normative debt :equity ratio of 50:50 for the
purpose of determination of tariff in respect of their old assets.
Commission’s Analysis
The basic requirement either for return on capital base or return on equity is the
audited accounts and the register of assets and depreciation. DPN has not furnished
40

the Audited Accounts and Asset Registers. In the absence of audited accounts and
assets registers, the Commission cannot allow any return on equity or capital base till
such time the assets registers and audited accounts are submitted..
5.16 Provision for Bad and doubtful debts
DPN has projected provision for bad debts at Rs. 1.26 Cr for the year 2011-12. DPN
has considered the provision for bad debts as 1% of revenue from sale of power to
consumers.
Commission’s Analysis
As per Regulations 98(5) of NERC (Terms and conditions for determination of Tariff)
Regulations 2010, the Commission may, after distribution licensee gets the
receivable audited allow a provision for bad debts upto 1% of receivable in the
revenue requirement of the distribution licensee. Here receivables mean arrears of
current consumption charges due from the consumers.
As per Annual Plan the receivables are Rs. 77.38 Cr for FY 2010-11.
Considering 1% of receivables Commission allows Rs. 0.75 Cr towards bad
and doubtful debts.
5.17 Non Tariff Income
The DPN has projected non-tariff income at RS 0.40 Cr for the year 2011-12. Non-
Tariff income is in the form of meter rent, late payment charges, interest on staff
loans, miscellaneous charges from consumers etc.
The details of non tariff income are furnished in table 5.31 below:
Table 5.31: Non Tariff Income
(Rs. Crore)
Sl. No.
Source of IncomePrevious
year(Actual) FY
2009-10
Current Year
(Estimated) FY 2010-11
Ensuingyear
(Projected) FY 2011-12
1 2 3 4 51 Meter / Service rent - - -2 Late payment surcharge - - -3 Theft / pilferage of energy - - -4 Misc. receipts 0.40 0.40 0.405 Misc. charges (except PLEC) - - -6 Wheeling charges - - -7 Interest on staff loans & advance - - -8 Income from trading - - -
41

Sl. No.
Source of IncomePrevious
year(Actual) FY
2009-10
Current Year
(Estimated) FY 2010-11
Ensuingyear
(Projected) FY 2011-12
9 Income from welfare activities -- - -10 Excess on verification - - -11 Investments & bank balances - - -12 Total Income 0.40 0.40 0.4013 Add Prior period income * - - -14 Total Non tariff income 0.40 0.40 0.40
Commission’s Analysis
Though the DPN is collecting meter rent, delayed payment charges and other
miscellaneous charges from the consumers, proper accounting is not being done.
The DPN is directed to maintain proper accounts for non-tariff income. This being the
1st ARR the Commission admits the non-tariff income projected by DPN at Rs. 0.40
crore.
5.18 Aggregate Revenue Requirement
Having analyzed the aggregate revenue requirement projected by DPN for the year
2011-12 as enumerated in preceding paragraphs the Commission approves the ARR
for FY 2011-12 as indicated in table 5.32 below.
Table 5.32 Aggregate Revenue Requirement for FY 2011-12
(Rs. Crore)Sl.No.
Projected by DPN
Approved by Commission
1 Fuel cost 0.08 0.082 Power Purchase cost 127.42 119.423 O&M Expenses3.1 Employee cost 59.12 57.003.2 Repairs & Maintenance expenses 17.23 16.703.3 Administration and General Expenses 2.53 2.254 Depreciation 16.83 -5 Interest & Finance charges 38.84 -6 Interest on working capital - 1.917 Provision for bad debts 1.26 0.758 Return on equity 51.26 -9 Total expenditure 314.56 198.1110 Less Non tariff income 0.40 0.4011 Aggregate Requirement 314.17 197.71
42

5.19 Expected revenue from existing tariff
The DPN has furnished the revenue from existing tariff at Rs. 111.04 Cr for FY 2011-
12 as detailed in the table 5.33 below:
Table-5.33: Revenue from existing tariff projected by DPN for FY 2011-12 (Rs. crore)
Sl.No.
SourceEnsuing year
(projected)FY 2011-12
1 Domestic including BPL 48.372 Commercial 10.333 Industrial Consumers 3.984 Public Lighting 0.665 Public water works & Sewage 0.736 Irrigation and Agriculture 0.017 Bulk Supply 11.418 Outside state 35.55
Total 111.04
Commission’s Analysis
The category-wise sales for FY 2011-12 are approved in paragraph 5.3. Based on
sales and revenue (actuals) furnished by DPN in the Tariff Petition for FY 2009-10
the average unit rates are arrived at for different category of consumers.
The revenue from the existing tariff is worked out adopting these average rates and
furnished in the Table 5.34 below:
Table 5.34: Revenue from existing tariff approved by the Commission for FY 2011-12
Sl. No.
CategorySales(MU)
Revenue from existing tariffAverage rate
(Rs./kWh)Revenue
(Rs/crore)1. Domestic 213.00 2.10 44.73
2. Commercial 25.20 3.60 9.07
3. Industrial 14.50 2.90 4.21
4. Public lighting 2.40 2.73 0.66
5. Public water works & sewage 2.28 2.90 0.66
6. Irrigation & Agriculture 0.04 1.50 0.01
7. Bulk supply 44.76 3.10 13.88
8. Total 302.18 2.42 73.23
9. Sale Outside State 56.27 3.95 22.23
Total 358.45 2.96 95.46
43

The Commission accordingly assessed the revenue from existing tariff for energy
sales including sales out side the state at Rs.95.46 crore for FY 2011-12 as against
Rs. 111.04 crore projected by DPN. The revenue towards energy sales from the
consumers is Rs.73.23 crore for FY 2011-12.
5.19.1 Revenue gap for FY 2011-12
Table 5.35: Net revenue requirement and gap with revenue at existing tariff
(Rs. crore)Sl. No.
Particulars Projected by DPN
Approved by the Commission
1. Net Revenue Requirement (Rs. crore) 314.16 197.712. Revenue from sale of power (Rs. crore) 111.04 95.463. Gap (Rs. crore) 203.12 102.254. Energy sales (MU) 369.10 358.455. Average cost (Rs/kWh) 8.51 5.52
5.19.2 Revenue from revised tariff
As seen from the above table there is a gap of Rs. 102.25 crore between aggregate
revenue requirement and revenue from sale of power at existing tariff. To meet the
gap the Commission considered the proposed tariff by the DPN, the paying capacity
of consumers in Nagaland, concerns of State Government to improve revenue
mobilization efforts and approves the revised tariff for different category consumers.
The revenue is worked out with the revised tariff and shown in Table 5.36 below:
Table 5.36: Revenue from revised tariff approved by the Commission for FY 2011-12
Sl.No.
CategorySales(MU)
Revenue from revised tariffAverage
Revised Tariff (Rs./kWh)
Revenue(Rs/crore)
1. Domestic 213.00 3.25 69.232. Commercial 25.20 4.50 11.343. Industrial 14.50 3.35 4.864. Public lighting 2.40 * 2.335. Public water works & sewage 2.28 3.85 0.886. Irrigation & Agriculture 0.04 2.00 0.087. Bulk supply 44.76 3.85 17.238. Total 302.18 105.959. Sale outside State 56.27 3.95 22.23
Total 358.45 128.18
* Charges for public lighting have to be recovered from the consumers of Domestic,
Commercial, Industrial and Bulk categories at the rates shown below:
44

Domestic Rs. 10 per connection / month
Commercial Rs. 15 per connection / month
Industrial Rs. 20 per connection / month
Bulk Supply Rs. 25 per connection / month
The Commission accordingly approves revenue from revised tariffs at Rs. 128.18
crore. Additional revenue with the revised tariff from the consumers would be
Rs.32.72 crore.
Tariff principles and design is discussed in Chapter-7.
45

Annexure – 5.1
ACTUAL METERED TRANSMISSION LOSS IN NORTH EASTERN REGION 2010-11
Week No.WEEK
% LossFrom To
1 29-Mar-10 4-Apr-10 3.572 5-Apr-10 11-Apr-10 3.243 12-Apr-10 18-Apr-10 3.494 19-Apr-10 25-Apr-10 4.315 26-Apr-10 2-May-10 3.666 3-May-10 9-May-10 3.087 10-May-10 16-May-10 3.838 17-May-10 23-May-10 3.949 24-May-10 30-May-10 3.24
10 31-May-10 6-Jun-10 4.0711 7-Jun-10 13-Jun-10 3.6112 14-Jun-10 20-Jun-10 3.0313 21-Jun-10 27-Jun-10 3.2614 28-Jun-10 4-Jul-10 3.2115 5-Jul-10 11-Jul-10 2.9616 12-Jul-10 18-Jul-10 2.8717 19-Jul-10 25-Jul-10 3.0418 26-Jul-10 1-Aug-10 2.8019 2-Aug-10 8-Aug-10 2.8720 9-Aug-10 15-Aug-10 2.9621 16-Aug-10 22-Aug-10 3.2422 23-Aug-10 29-Aug-10 3.0923 30-Aug-10 5-Sep-10 2.9624 6-Sep-10 12-Sep-10 3.0425 13-Sep-10 19-Sep-10 3.0426 20-Sep-10 26-Sep-10 3.2727 27-Sep-10 3-Oct-10 3.0728 4-Oct-10 10-Oct-10 3.2729 11-Oct-10 17-Oct-10 2.8730 18-Oct-10 24-Oct-10 2.7731 25-Oct-10 31-Oct-10 2.7832 1-Nov-10 7-Nov-10 2.8533 8-Nov-10 14-Nov-10 2.9634 15-Nov-10 21-Nov-10 3.1235 22-Nov-10 28-Nov-10 3.1736 29-Nov-10 5-Dec-10 3.2637 6-Dec-10 12-Dec-10 3.07
Average 3.21
Maximum Loss of 37 Week 4.31
46

6. Directives
Commission’s Observation
While examining the information and data contained in the proposed ARR and Tariff
Petition for the FY 2011-12 it has been observed that the compilation and
computation of data have been done based on certain assumptions in respect of
certain vital information. Most of the areas of the operational and financial
performance of DPN require substantial improvement.
Therefore, the Commission decided to issue the following directives to the DPN in
the larger interest of Stakeholders.
Directive 1: Submission of next ARR
DPN shall file the ARR and Tariff Petition well in time i.e. on or before 30th
November each year.
Directive 2: Maintenance of Asset Registers and Audited Annual Accounts
The DPN has stated that the complete data of fixed assets is not available.
Unless the function wise, asset wise data is up-dated, correct asset value and
depreciation thereon cannot be ascertained. The DPN is directed to get the asset
registers built up, assets verified and submit updated assets & depreciation
registers.
Accounts are to be maintained for construction and operation activities of the Power
Department. Audited Annual Accounts should be submitted. In the event of delay in
getting Accounts audited by the Accountant General, the DPN can get the same
audited by CAG empanelled auditors and submit the same with the future filing.
Directive 3: Management Information System (MIS)
The DPN has not maintained proper data in respect of sales (slab wise), revenue
and revenue expenses as also the category wise / slab wise number of consumers,
connected load / demand etc. for proper analysis of the past data based on actuals
and estimation of proper projections for consideration in the ARR and Tariff Petition.
47

The DPN is directed to take steps to build credible and accurate data base and
management information system (MIS) to meet the requirements for filing ARR &
Tariff Petition as per regulatory requirement and also to suit the Multi Year Tariff
principles which the Commission may consider at an appropriate time under
Regulation 20 of NERC (Terms and Conditions for Determination of Tariff)
Regulations, 2010. The formats, software and hardware may be synchronized with
the Regulatory Information and Management System (RIMS) circulated by Central
Electricity Regulatory Commission (CERC).
Directive 4: Pilferage of Energy
The DPN has furnished the T&D losses at 36.46% during 2009-10 and projected
the losses at 30.77% for 2010-11and 28.07% 2011-12.The Department has not
segregated the losses into technical and commercial losses. It is possible that the
losses projected may include commercial losses on account of pilferage and
malpractices.
Pilferage of energy may be by illegal tapings from electrical lines, tampering meters
etc. The Commission feels that there is need to launch an extensive drive to
remove illegal connections, if any, check meter tampering, replace the defective
meters, maintain proper account of un-metered services and keep constant vigil so
that corrective measures could be taken to reduce the AT & C losses. Requisite
action may be taken as per the provisions under sections 135 and 138 of Electricity
Act, 2003.
The DPN is directed to furnish an action plan in a month time to arrest the pilferage
and malpractice.
Directive 5 : Replacement of Non-Functional / Defective Meters
It is reported that about 50% of total connections are with defective meters.
Information of non-functional meters may be obtained from the field officers and
ensure that data is maintained correctly.
Replacement of meters shall be planned on priority wise i.e., meters of Bulk supply,
commercial, industrial and high value domestic categories to be replaced. In
respect of defective meters billing may be done by adopting standard method. The
Data on defective meters, replacement, pendancy shall be filed with the next
petition. It is seen from the data with tariff filed number of static meters single phase
and three phase have been procured by the Power Department from APDRP funds.
48

These meters shall be utilized for replacing defective meters / replacing old
electromagnetic meters and compliance reported.
Directive 6: Consumers contribution for Capital Investment
The fact of consumer contribution for capital investment is not brought out in the
ARR and Tariff Petition.
The DPN is directed to furnish the details of contributions being collected from
consumers for capital works. The amounts collected from the consumers towards
capital investment shall be brought out in the accounts. The depreciation and
Return on Equity / Capital Base should not be claimed on the amount contributed
by the consumers towards capital investment.
Directive 7: Energy Audit
The DPN has projected the transmission and distribution loss at 30.77% for the
year 2010-11 & 28.07 % for FY 2011-12.
The DPN is directed to get Energy Audit conducted by providing meters on all the
feeders (132 kV, 33 kV and 11 kV) and at distribution transformers to identify the
high loss areas and take appropriate measures to reduce both technical and
commercial losses to the level fixed by the Commission. Intrastate transmission
loss shall be assessed by providing meters on incoming 132 kV feeders and 33 kv
feeders to facilitate assessment of distribution losses in the state. The DPN shall
also comply with loss reduction trajectory for T&D losses for the next three years.
The investment required to reduce the losses shall be included in the investment
plan for augmentation of T&D system to be submitted to the Commission. Effective
technical and administrative measures shall be taken to reduce the commercial
losses. The action plan for energy audit and loss reduction measures shall be
furnished to the Commission by 30-9-2011.
Directive 8: Investment Plan and Capping of capital expenditure
Annual Investment Plan shall be submitted to the Commission and approval of
Commission should be obtained for all major capital works costing Rs. 5.00 crore
and above before execution of the works.
49

Directives 9: Interest on Security Deposit
DPN did not indicate the amount of security deposit collected from the consumers.
DPN is directed to maintain consumer-wise security deposit collected. Such data
shall be furnished with the next filing.
Directive 10:
Power Department does not have website and e-mail facility. These are important
items for the Department for timely communication and for maintaining data in
various functions of the Department. Compliance shall be reported in 2 months
time.
Directive 11:
The finalization of this Tariff Order has been much delayed due to certain situations
as under:
(i) Additional information / data asked by the Commission vide letters dated
15/01/2011, 22/01/2011 and 25/01/2011 was furnished by DPN only on 23rd
March 2011 – about 2 months delay.
(ii) Draft Public Notice to be published by DPN was formally hand-delivered to the
Department on 09/03/2011. The DPN published the notice only on 22nd April,
2011 – nearly 1½ months delay.
- It is to be noted that the Commission is charged to dispose Tariff Petitions
within 120 days.
- Tariff petition and its processing are new activities for both the DPN and the
NERC; and as such, certain delays have been contributed by both parties
resulting in inability to decide the revised tariff to be effective from 1st April,
2011.
The DPN is directed to respond timely to the NERC in the future.
Directive - 12
Attention, all concerned
“Better performance by reduction of loss level will result in substantial reduction in
quantum of power purchase and costs which means reduction in average cost of
supply” (Refer last sentence of para 7.1.2 of Tariff order).
50

In this context, the average cost of supply is Rs. 8.51 / Unit (reworked from Rs. 9.98 /
Unit as per original petition submitted on 30/11/2010).
This figure of Rs. 8.51 / Unit will come down or will not increase substantially if the
DPN functions more effectively and people do not resort to theft of power. DPN shall
take steps to curb theft / malpractices by the consumers / people
The increase in the average cost of supply and the DPN’s inability to collect required
revenue (w.r.t. energy consumed) will have a direct result in increased drain on the
State Exchequer.
This increased drain by the DPN on the State Exchequer will affect all Departments
in the Government and the public in general will be deprived of the services they are
entitled (not only in power sector; but also in other sectors due to reduced allocation
of non-plan funds in such Departments), on account of Power Departments having
used more non-plan funds.
In the above manner, the deterioration of the power sector on account of its
inefficiency, consumer / public non-cooperation to pay bills or even resorting to theft
of power will have far-reaching and cascading consequences as mentioned in the
foregoing paragraphs.
51

7 Tariff Principles and Design
7.1 Background
7.1.1 The Commission in determining the revenue requirement of DPN for the year 2011-
12 and the retail supply tariff has been guided by the provisions of the Electricity
Act, 2003, the National Tariff Policy (NTP), Regulations on Terms and Conditions of
Tariff issued by the Central Electricity Regulatory Commission (CERC) and
Regulations on Terms and Conditions of Tariff notified by the NERC. Section 61 of
the Act lays down the broad principles, which shall guide determination of retail
tariff. As per these principles the tariff should “Progressively reflect cost of supply”
and also reduce cross subsidies “within the period to be specified by the
Commission”. The Act lays special emphasis on safeguarding consumer interests
and also requires that the costs should be recovered in a reasonable manner. The
Act mandates that the tariff determination shall be guided by the factors, which
encourage competition, efficiency, economical use of resources, good performance
and optimum investment.
The NTP notified by Government of India in January 2006 provides comprehensive
guidelines for determination of tariff and also in working out the revenue
requirement of power utilities. The Commission has endeavored to follow these
guidelines as far as possible.
7.1.2 NTP mandates that the Multi-Year-Tariff (MYT) framework be adopted for
determination of tariff from 1st April 2006. However the Commission is not in a
position to introduce MYT Regime in the State mainly because of lack of requisite
and reliable data. The present MIS and regulatory reporting system of the DPN is
very inadequate for any such exercise at this stage. There has been no study to
assess voltage wise losses in the absence of metering of all feeders, and
distribution transformers. Technical and commercial losses are yet to be segregated
and quantified voltage wise. The Commission has issued a directive to the DPN in
the Tariff Order 2011-12 to chalk out a action plan for reduction of T&D losses.
7.1.3 The mandate of the NTP is that tariff should be within plus / minus 20% of the
average cost of supply by 2011-12. It is not possible for the Commission to lay
52
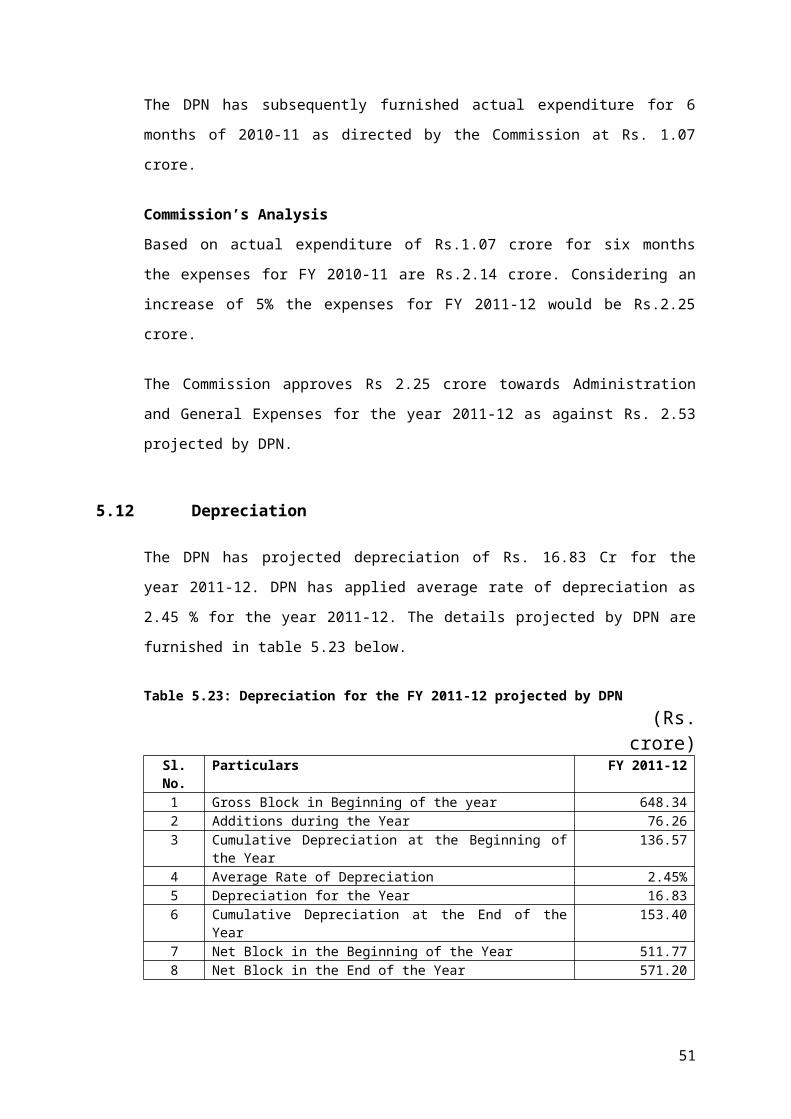
down the road map for reduction of cross subsidy, mainly because of lack of data
regarding cost of supply at various voltage levels. In view of the prevailing situation
the Commission has gone on the basis of average cost of supply for working out
consumer category-wise cost of supply. However in this tariff order an element of
performance target has been indicated by setting target for T&D loss reduction for
the years 2011-12 to 2013-14. This better performance by reduction of loss level
will result in substantial reduction in average cost of supply.
7.1.4 Section 8.3 of National Tariff Policy lays down the following principles for tariff design:
(1) In accordance with the National Electricity Policy, consumers below poverty
line who consume below a specified level, say 30 units per month, may receive
a special support through cross subsidy. Tariffs for such designated group of
consumers will be at least 50% of the average cost of supply. This provision
will be re-examined later.
(2) For achieving the objective that the tariff progressively reflects the cost of
supply of electricity, the SERC would notify the roadmap, within six months
with a target that latest by the end of the year 2010-11 tariffs are within ± 20%
of the average cost of supply. The road map would have intermediate
milestones, based on the approach of a gradual reduction in cross subsidy.
For example if the average cost of service is Rs.3 per unit, at the end of year
2011-12 the tariff for the cross subsidized categories excluding those referred
to in para-1 above should not be lower than Rs 2.40 per unit and that for any of
the cross subsidizing categories should not go beyond Rs 3.60 per unit.
(3) While fixing tariff for agricultural use, the imperatives of the need of using
ground water resources in a sustainable manner would also need to be kept in
mind in addition to the average cost of supply. The tariff for agricultural use
may be set at different levels for different parts of the State depending on the
condition of the ground water table to prevent excessive depletion of ground
water.”
7.1.5 The provisions of the Electricity Act, 2003, National Tariff Policy and the NERC
Tariff Regulations require that there should be a gradual movement towards
reduction of cross subsidy. The Tariff aims at bringing down cross subsidy to + 20%
of the average cost of supply by the year 2011-12.
53

Regulation 6 of NERC (Terms and Conditions for Determination of Tariff)
Regulations, 2010 specifies –
Cross subsidy as:
“(1) ‘Cross subsidy for a consumer category in the first phase ( as defined in sub
regulation 2 below) means the difference between the average realization per unit
from that category and the combined average cost of supply per unit expressed in
percentage terms as a proportion of the combined average cost of supply. In the
second phase(as defined in sub-regulation 2 below) means the difference between
the average realization per unit from that category and the combined per unit cost of
supply for that category expressed in percentage terms as a proportion of the
combined cost of supply of that category.
(2) The Commission shall determine the tariff to progressively reflect the cost of
supply of electricity and also reduce cross subsidies within a reasonable period. To
this purpose, in the first phase the Commission shall determine tariff so that it
progressively reflects combined average unit cost of supply in accordance with
National Tariff Policy. In the second phase, the Commission shall consider moving
towards the category-wise cost of supply as a basis for determination of tariff.”
7.1.6 The average tariff for each category of consumers, the average cost of supply, the
average tariff as a percentage of average cost of supply and the consumer tariff
within the range +20% of cost of supply for 2011-12 are given as under:
Table 7.1 Average Cost of supply
Sl.No.
Consumer category
Average unit rate as per
existing tariff
(Rs/kWH)
Average cost of supply per unit
(Rs/kWH)
Tariff as a percentage of average
cost of supply
(3/4) (%)
Unit rate with +20% of
average cost of supply (Rs/kWH)
1 Domestic 2.10 5.52 38 4.42 (-20%)2 Commercial 2.60 5.52 47 4.42 (-20%)3 Industrial 2.90 5.52 53 4.42 (-20%)4 Public Lighting 2.73 5.52 49 4.42 (-20%)5 Public Water
works2.90 5.52 53 4.42 (-20%)
6 Agriculture 1.50 5.52 27 4.42 (-20%)7 Bulk Supply 3.10 5.52 56 4.42 (-20%)
54

It is seen that the average existing tariffs to all categories of consumers are lower
than 20% range of the average cost of supply.
The tariff are being determined for DPN for the first time
7.2 Tariffs approved by the Commission 7.2.1 The following are considered while arriving at category-wise tariffs approved.
Net revenue requirement for the year 2011-12 is Rs. 197.71 Cr as against the
revenue of Rs 95.46 Cr. arrived at existing tariff.
7.2.2 The tariff rates category-wise existing and proposed by DPN are given in table 7.2
below:
Table 7.2 Category Wise Tariffs existing and proposed by DPN
Sl.No.
CategoryExisting Rate
(Rs./kWh)Proposed Rate
Rs./kwh
Proposed Fixed
ChargesRs./Month
1 CATEGORY ‘A’ DOMESTIC (a) 0 to 30 kwh 2.30 2.90 10.00(b) 31 to 100 kwh 2.90 3.60 10.00(c) 101 to 250 kwh 3.20 4.05 10.00(d) > 250 kwh 3.50 4.40 10.00
2 CATEGORY ‘B’ INDUSTRIAL(a) < 500 kwh 2.60 2.95 20.00(b) 501 to 5000 kwh 2.90 3.40 20.00(c) > 5000 kwh 3.15 3.85 20.00
3 CATEGORY ‘C’ BULK 3.10 3.85 25.004 CATEGORY ‘D’ COMMERCIAL
(a) < 60 kwh 3.50 4.05 15.00(b) 61 to 240 kwh 4.00 4.60 15.00(c) > 240 kwh 4.40 4.95 15.00
5 CATEGORY ‘E’ P.W.W. 3.20 3.85 25.006 CATEGORY ‘F’ Public Light 2.75 Nil7 CATEGORY ‘G’ AGRICULTURE 1.50 2.20
8CATEGORY ‘H’ TEMPORARY CONNECTION
Metered Rs. 4/kWh
Unmetered Rs. 100/day/kW load or part
thereof
Metered DLF: Rs 6/kWH, others Rs. 8/kWh UnmeteredDLF: Rs. 100/ day / kWOthers Rs. 150/kW/day
9 Kutir Jyoti(point)Same as Domestic Category
Same as Domestic Category
10 SINGLE POINT METERED RURALRs. 2.00 /
kWh2.75 20.00
11SINGLE POINT METERED URBAN
2.3 to 3.5 for different class
of UEMB2.85 25.00
55

7.2.3 Based on the approved Aggregate Revenue Requirement (ARR) the approved Tariffs
for supply of Energy in respect of different categories of consumers are as per
Table – 7.3 below
Table 7.3: Category of Consumer wise tariffs approved by the Commission
Sl.No.
CategoryApproved Rate
Rs./kwh1 CATEGORY ‘A’ DOMESTIC
(a) 0 to 30 kwh 2.65(b) 31 to 100 kwh 3.60
(c) 101 to 250 kwh 4.00
(d) > 250 kwh 4.252 CATEGORY ‘B’ INDUSTRIAL
(a) < 500 kwh 2.95
(b) 501 to 5000 kwh 3.40
(c) > 5000 kwh 3.85
3 CATEGORY ‘C’ BULK 3.854 CATEGORY ‘D’ COMMERCIAL
(a) < 60 kwh 4.00
(b) 61 to 240 kwh 4.60
(c) > 240 kwh 4.90
5 CATEGORY ‘E’ P.W.W. 3.85
6 CATEGORY ‘F’ Public LightTo be recovered from
consumers *7 CATEGORY ‘G’ AGRICULTURE 2.00
8 CATEGORY ‘H’ TEMPORARY CONNECTION
DLF Rs 6.00Others Rs. 8.00
(All with metered supply only)
9 Kutir Jyoti(point) Same as DLF11 SINGLE POINT METERED RURAL 2.50
12 SINGLE POINT METERED URBAN 2.75
* Charges for public lighting have to be recovered from the Consumes of Domestic,
Commercial, Industrial and Bulk categories at the rates shown below.
Domestic Rs. 10 per connection / month
Commercial Rs. 15 per connection / month
Industrial Rs. 20 per connection / month
Bulk Supply Rs. 25 per connection / month
7.2.4 Tariffs for various categories of consumers are given in tariff schedule annexed.
56
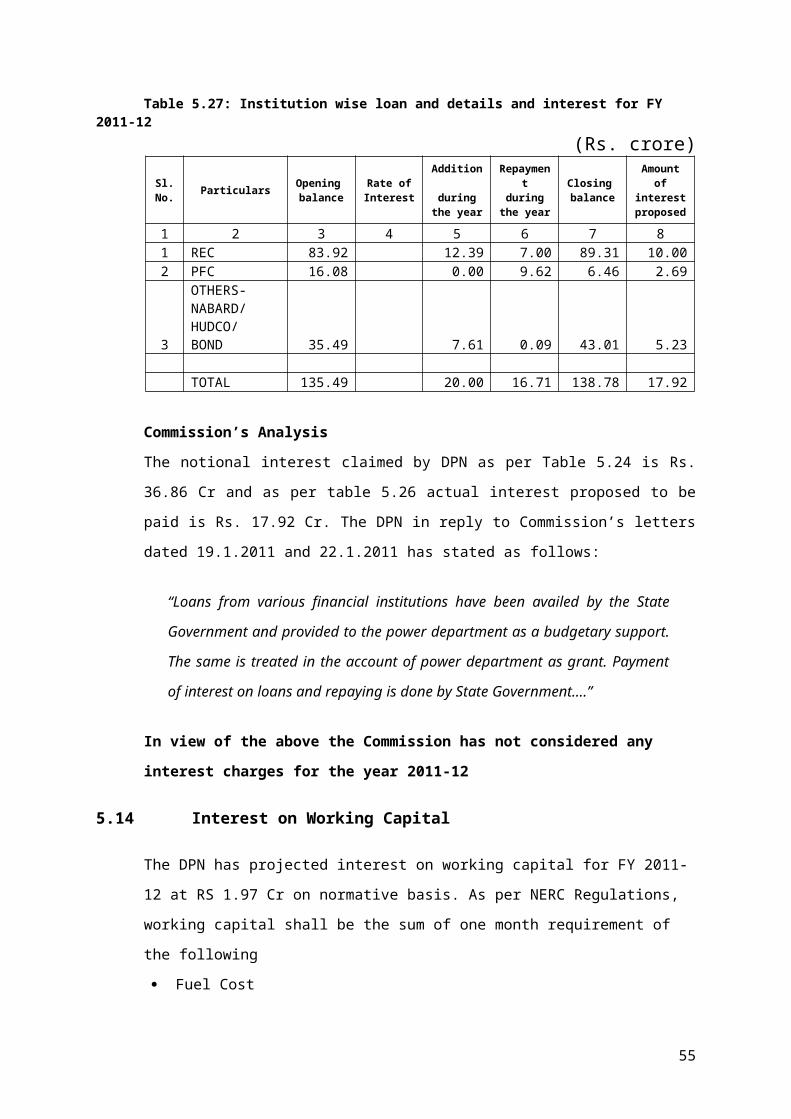
Commission’ s Order
Having considered the Petition No.01/2010 of DPN for approval of Aggregate
Revenue Requirement (ARR) and determination of retail tariff for supply of energy, in
exercise of power conferred by Section 62 of the Electricity Act, 2003; the
Commission approves the aggregate revenue requirement (ARR) as detailed below:
(Rs. crore)
Sl.No. Details Amount
1. Fuel cost 0.082. Power purchase cost 119.423. Employee cost 57.004. R&M expenses 16.705. Administration and expenses 2.256. Depreciation -7. Interest and finance charges -8. Interest on working capital 1.919. Return on equity -10. Provision for bad debts 0.7511. Total requirement 198.1112. Less: Non tariff income 0.4013. Net revenue requirement 197.7114. Total revenue from revised tariff 128.1815. Gap 69.53
1. The gap is to be met through support from the State Government.
2. The approved retail tariff for supply of energy shall be in accordance with the tariff
schedule annexed.
3. This order shall come into effect from 1st July, 2011 and shall be in force till
revised.
Er. S.I. LongkumerChairman-cum-Member
KohimaDate: 27th June, 2011
57

Appendix
Tariff Schedule Sl. No.
Category Rs./kwh
1 2 3A. 1 CATEGORY ‘A’ DOMESTIC
(a) 0 to 30 kwh 2.65(b) 31 to 100 kwh 3.60
(c) 101 to 250 kwh 4.15
(d) > 250 kwh 4.752 CATEGORY ‘B’ INDUSTRIAL
(a) < 500 kwh 3.15
(b) 501 to 5000 kwh 3.60
(c) > 5000 kwh 4.10
3 CATEGORY ‘C’ BULK 3.854 CATEGORY ‘D’ COMMERCIAL
(a) < 60 kwh 4.35
(b) 61 to 240 kwh 5.20
(c) > 240 kwh 5.95
5 CATEGORY ‘E’ P.W.W. 3.85
6 CATEGORY ‘F’ Public LightTo be recovered from consumers
*7 CATEGORY ‘G’ AGRICULTURE 2.0
8 CATEGORY ‘H’ TEMPORARY CONNECTIONDLF 6.00
Others 8.00
9 Kutir Jyoti(point) Same as DLF
10 SINGLE POINT METERED RURAL 2.50
11 SINGLE POINT METERED URBAN 2.75
* Charges for public lighting have to be recovered from the Consumes of Domestic,
Commercial, Industrial and Bulk categories at the rates shown below.
Domestic Rs. 10 per connection / month
Commercial Rs. 15 per connection / month
Industrial Rs. 20 per connection / month
Bulk Supply Rs. 25 per connection / month
58

B. OTHER CHARGES : (a) Disconnection Charges Rs.
i. Single phase L.T. 150.00/each
ii. Three phase L.T. 250.00/each
iii. H.T. consumers (11 KV above) 1500.00/each(b) Reconnection Charges
i. Single phase L.T. 150.00/each
ii. Three phase L.T. 250.00/each
iii. H.T. consumers (11 KV above) 1500.00/each
C. METER RENT Rs. per monthi. Single phase L.T. 20.00 ii. Three phase L.T.(whole current) 50.00 iii. Three phase L.T.(CT operated) 100.00 iv. 11 kv H.T. 500.00 v. 33 kv H.T. 750.00 vi. 66 kv EHV 900.00 vii. 132 kv EHV 1000.00
D. METER TESTING CHARGES Rupees
i. Single phase L.T. 100.00 eachii. Three phase L.T. 300.00 eachiii. H.T. consumers (11 KV above) 1000.00 each
E.
SECURITY DEPOSITRs. per
connectioni. Single phase L.T. 250ii. Three phase L.T. 750iii. H.T. consumers (11 KV above) 3000
F. MONTHLY MINIMUM CHARGES Rupees
i. Domestic100.00 pm/kw of contract demand
or part thereof
ii. Commercial150.00 pm/kw of contract demand
or part thereof
iii. Industrial150.00 pm/kva of contract demand
or part thereof
iv. Bulk150.00 pm/kva of contract demand
or part thereof
v. Agriculture 50.00 pm/HP or part thereof
vi. Public Water Works 75.00 pm/kva or part thereof
G. SURCHARGES (DELAYED PAYMENT) Rs. 0.10/kwh pm or part thereof
H. BILLING PERIODICITY Monthly
59

I.CHARGES OF POLES USAGE FOR ADVERTISEMENT
Rupees
1 Charges for application and agreement forms 100.00
2Charges towards dismantling of hoardings/banners
300.00
3 The pole rental charges for advertisements: - Rs./month
a. Category I-Commercial area (Max size 3'X2') 100.00
b. Category II - Residential area (Max size 3'X2') 60.00
c. Category III-National Highway (Max size 3'X2') (outside the city/town limit)
40.00
The DPN has proposed certain charges for usage of poles for running cables by TV
cable operators without providing satisfactory modalities for billing and collection of
such charges from the operators. Under these circumstances, the Commission does
not feel it necessary at preset to approve the proposal.
60