NAFA INCOME OPPORTUNITY FUND - nbpfunds.com · Meezan Bank Limited Sindh Bank Limited ... There has...
60
Transcript of NAFA INCOME OPPORTUNITY FUND - nbpfunds.com · Meezan Bank Limited Sindh Bank Limited ... There has...


Annual Report 2017 Page 01
NAFA INCOME OPPORTUNITY FUND
To rank in the top quartile
in performance of
NAFA FUNDS
relative to the competition,
and to consistently offer
Superior risk-adjusted returns to investors.
MISSIONSTATEMENT

Annual Report 2017 Page 02
NAFA INCOME OPPORTUNITY FUND
Al Baraka Bank LimitedMeezan Bank LimitedSindh Bank LimitedDubai Islamic Bank Pakistan LimitedKhushhali Bank LimitedBankislami Pakistan LimitedZarai Taraqiati Bank LimitedSummit Bank LimitedNRSP Micro�nace Bank Limited
Mr. Lui Mang Yin (Martin Lui)Dr. Foo Chiah Shiung (Kelvin Foo)
Mr. Tariq JamaliMr. Abdul Hadi PalekarMr Humayun Bashir
Mr. Mudassir Husain Khan
Dr. Foo Chiah Shiung (Kelvin Foo)Mr. Tariq Jamali
Human Resource and Remuneration Committee
Mr. Kamal Amir Chinoy ChairmanMr. Lui Mang Yin (Martin Lui) MemberMr. Abdul Hadi Palekar Member
Chief Financial Of�cer
Mr. Khalid Mehmood

Annual Report 2017 Page 03
NAFA INCOME OPPORTUNITY FUND
Auditors
Deloitte Yousuf AdilChartered AccountantsCavish Court,A-35, Block 7 & 8,KCHSU, Sharae FaisalKarachi-75350 Pakistan
Legal Advisor
M/s Jooma Law Associates 205, E.I. Lines, Dr. Daudpota Road,Karachi.
7th Floor Clifton Diamond Vuilding, Block No. 4,Scheme No. 5, Clifton Karachi.UAN: 111-111NFA (111-111-632),(Toll Free): 0800-20001,Fax: (021) 35825329Website: www.nafafunds.com
Lahore Of�ce:
7-Noon Avenue, Canal Bank,Muslim Town, Lahore.UAN: 042-111-111-632Fax: 92-42-35861095
Islamabad Of�ce:
Plot No. 395, 396Industrial Area, I-9/3 Islamabad.UAN: 051-111-111-632Phone: 051-2514987Fax: 051-4859031
Peshawar Of�ce:
Opposite Gul Haji Plaza, 2nd FloorNational Bank BuildingUniversity Road Peshawar, UAN: 091-111 111 632 (nfa)Fax: 091-5703202
Multan Of�ce:

Annual Report 2017 Page 04
NAFA INCOME OPPORTUNITY FUNDC
ont
ents
Co
nten
tsDIRECTORS' REPORT
TRUSTEE REPORT TO THE UNIT HOLDERS
STATEMENT OF COMPLIANCE WITH THE CODE OFCORPORATE GOVERNANCE
FUND MANAGER REPORT
REVIEW REPORT TO THE UNIT HOLDERS ON THE STATEMENTOF COMPLIANCE WITH THE CODE OF CORPORATEGOVERNANCE
INDEPENDENT AUDITORS’ REPORT TO THE UNIT HOLDERS
STATEMENT OF ASSETS AND LIABILITIES
INCOME STATEMENT
STATEMENT OF COMPREHENSIVE INCOME
DISTRIBUTION STATEMENT
STATEMENT OF MOVEMENT IN UNIT HOLDERS' FUND
CASH FLOW STATEMENT
NOTES TO THE FINANCIAL STATEMENTS
PERFORMANCE TABLE
05
10
11
14
17
18
20
21
22
23
24
25
26
55

Board of Directors
Mr. Shehryar FaruqueDirector
Mr. Kamal Amir ChinoyDirector
Mr. Abdul Hadi PalekarDirector
Mr. Humayun BashirDirector
Mr. Mudassir Husain KhanChairman
Mr. Tariq JamaliDirector
Mr. Lui Mang Yin (Martin Lui)Director
Dr. Amjad Waheed, CFAChief Executive Of�cer
Dr. Foo Chiah Shiung (Kelvin Foo)Director

Senior Management
Dr. Amjad Waheed, CFAChief Executive Of�cer
Mr. Samiuddin AhmedCountry Head Corporate
Marketing
Mr. Ozair KhanChief Technology Of�cer
Mr. Muhammad Ali, CFA, FRMHead of Fixed Income
Mr. Hassan Raza, CFAHead of Research
Mr. M. Murtaza AliChief Operating Of�cer& Company Secretary
Mr. Sajjad Anwar, CFAChief Investment Of�cer
Mr. Khalid MehmoodChief Financial Of�cer
Mr. Taha Khan Javed, CFAHead of Equity
Mr. Salman AhmedHead of Risk Management
Syed Ali Azhar HasaniHead of Internal Audit
Mr. Raheel Rehman, ACASenior Manager Compliance
Mr. Shahbaz UmerHead of Human Resource &
Administration

Annual Report 2017 Page 05
NAFA INCOME OPPORTUNITY FUND
Co
nten
ts The Board of Directors of NBP Fullerton Asset Management Limited is pleased to present the Twelfth Annual Report of NAFA Income Opportunity Fund for the year ended June 30, 2017.
Fund’s Performance
The size of NAFA Income Opportunity Fund has increased from Rs. 6,274 million to Rs. 8,199 million during the period, i.e. a growth of around 31%. During the said period, the unit price of the Fund has increased from Rs. 10.0640 (Ex-Div) on June 30, 2016 to Rs. 10.6964 on June 30, 2017, thus posting a return of 6.28% as compared to its Benchmark return of 6.10% for the same period. The return of the Fund is net of management fee and all other expenses.
NIOF is categorized as an Income Scheme and has been awarded stability rating of A (f) by PACRA.
Helped by the lower food prices, in�ation as measured by the CPI averaged 4.2% for FY17. During the year, State Bank of Pakistan (SBP) maintained the policy rate at 5.75%. SBP cited improving economic prospects amid investment activity in the context of CPEC gathering pace; but also highlighted its concerns on surge in imports, which along with a marginal decline in exports and workers’ remittances widened the current account de�cit. SBP’s prudent monetary policy stance translated into low and stable market interest rates; encouraging the private sector to undertake capacity expansions. Sovereign yield curve slightly steepened as the short end of the curve inched up by 5-10 basis points whereas long-term yields increased by 40-60 basis points.
Trading activity in corporate TFCs / Sukuks slightly improved with cumulative trade value of Rs 9.1 billion in FY17 compared to Rs 7.7 billion last year. The trades remained skewed towards high quality debt issues, mainly concentrated towards the Banking sector with 71% contribution. Dearth of primary issuance and rising demand kept the yield spread tightened in the secondary market.
The Fund has earned a total income of Rs.540.87 million during the year. After accounting for total expenses of Rs.249.96 million, the net income is Rs.290.91 million. The asset allocation of NAFA Income Opportunity Fund as on June 30, 2017 is as follows:
DIRECTORS’ REPORT
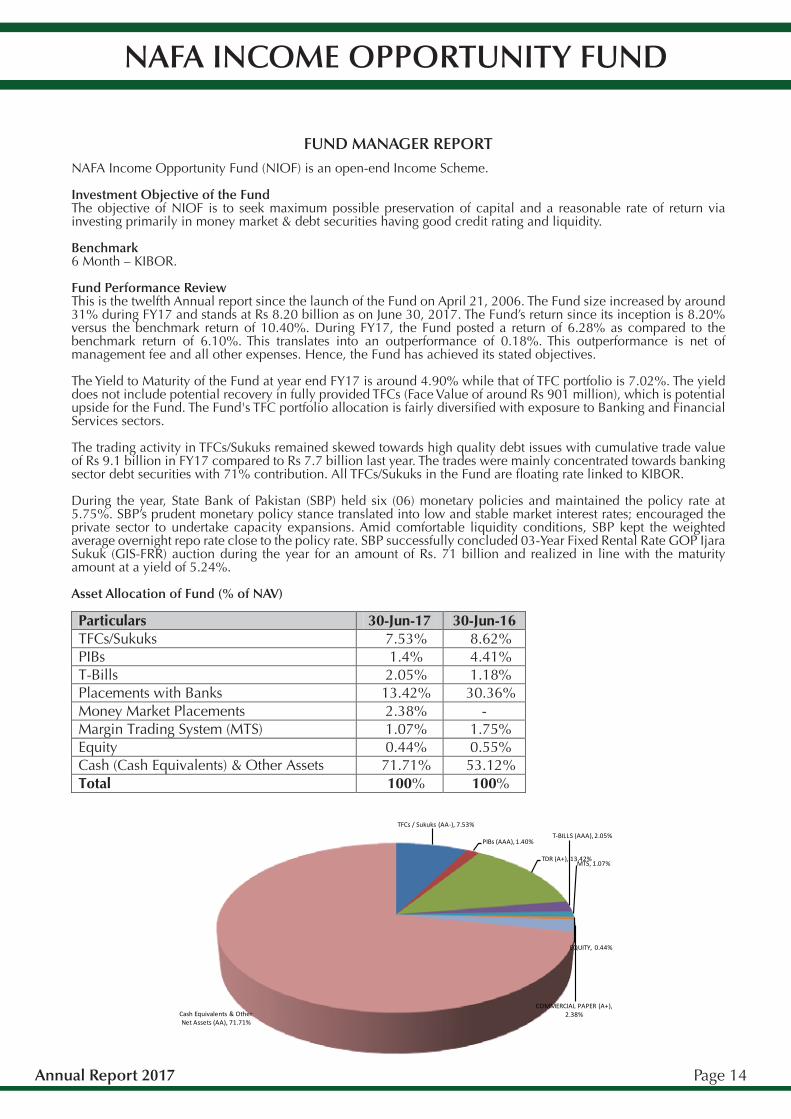
TFCs / Sukuks (AA-), 7.53%
PIBs (AAA), 1.40%
TDR (A+), 13.42%
T-BILLS (AAA), 2.05%
MTS, 1.07%
EQUITY, 0.44%
COMMERCIAL PAPER (A+), 2.38%Cash Equivalents & Other
Net Assets (AA), 71.71%

Annual Report 2017 Page 06
NAFA INCOME OPPORTUNITY FUND
Income Distribution
The Board of Directors of the Management Company has approved cash dividend of 6.34% of opening ex-NAV (6.78% of the par value) for the year.
Taxation
As the above cash dividend is more than 90% of the income earned during the year, excluding realized and unrealized capital gains on investments, the Fund is not subject to tax under Clause 99 of the Part I of the Second Schedule of the Income Tax Ordinance, 2001.
Auditors
The present auditors, Messrs Deloitte Yousuf Adil & Co., Chartered Accountants, retire and, being eligible, offer themselves for re-appointment for the year ending June 30, 2018.
Directors’ Statement in Compliance with Code of Corporate Governance
The �nancial statements, prepared by the management company, present fairly the state of affairs of the Fund, the result of its operations, cash �ows and statement of movement in unit holders' funds.
Proper books of account of the Fund have been maintained.
Appropriate accounting policies have been consistently applied in preparation of �nancial statements. Accounting estimates are based on reasonable and prudent judgment.
International Financial Reporting Standards, as applicable in Pakistan, have been followed in preparation of �nancial statements.
The system of internal control is sound in design and has been effectively implemented and monitored.
There are no signi�cant doubts upon the Fund’s ability to continue as a going concern.
There has been no material departure from the best practices of Corporate Governance, as detailed in the listing regulations.
A performance table/ key �nancial data is given in this annual report.
Outstanding statutory payments on account of taxes, duties, levies and charges, if any, have been fully disclosed in the �nancial statements.
The Board of Directors of the Management Company held four meetings during the current �nancial year. The attendance of all directors is disclosed in the note 26 to these �nancial statements.
The detailed pattern of unit holding is disclosed in the note 25 to these �nancial statements.
All trades in the units of the Fund, carried out by directors, CEO, CFO, Company Secretary and their spouses and minor children are disclosed in note 22 to these �nancial statements.
1.
2.
3.
4.
5.
6.
7.
8.
9.
10.
11.
12.

Annual Report 2017 Page 07
NAFA INCOME OPPORTUNITY FUND
Acknowledgement
The Board takes this opportunity to thank its valued unit-holders for their con�dence and trust in the Management Company, and providing the opportunity to serve them. It also offers its sincere gratitude to the Securities & Exchange Commission of Pakistan and State Bank of Pakistan for their patronage and guidance. The Board also wishes to place on record its appreciation for the hard work, dedication and commitment shown by the staff and the Trustee.
On behalf of the Board ofNBP Fullerton Asset Management Limited
Chief Executive Director
Date: September 15, 2017Place: Karachi.

Annual Report 2017 Page 08
NAFA INCOME OPPORTUNITY FUND
TFCs / Sukuks (AA-), 7.53%
PIBs (AAA), 1.40%
TDR (A+), 13.42%
T-BILLS (AAA), 2.05%
MTS, 1.07%
EQUITY, 0.44%
COMMERCIAL PAPER (A+), 2.38%Cash Equivalents & Other
Net Assets (AA), 71.71%

Annual Report 2017 Page 09
NAFA INCOME OPPORTUNITY FUND

Annual Report 2017 Page 10
NAFA INCOME OPPORTUNITY FUND
TRUSTEE REPORT TO THE UNIT HOLDERSNAFA INCOME OPPORTUNITY FUND
Report of the Trustee pursuant to Regulation 41(h) and Clause 9 of Schedule V of the Non-Banking Finance Companies and Noti�ed Entities Regulations, 2008
We, Central Depository Company of Pakistan Limited, being the Trustee of NAFA Income Opportunity Fund (the Fund) are of the opinion that NBP Fullerton Asset Management Limited being the Management Company of the Fund has in all material respects managed the Fund during the year ended June 30, 2017 in accordance with the provisions of the following:
(i) Limitations imposed on the investment powers of the Management Company under the constitutive documents of the Fund;
(ii) The pricing, issuance and redemption of units are carried out in accordance with the requirements of the constitutive documents of the Fund; and
(iii) The Non-Banking Finance Companies (Establishment and Regulations) Rules, 2003, the Non-Banking Finance Companies and Noti�ed Entities Regulations, 2008 and the constitutive documents of the Fund.
Aftab Ahmed DiwanChief Executive Of�cerCentral Depository Company of Pakistan Limited
Karachi, September 29, 2017
Annual Report 2017 Page 11
NAFA INCOME OPPORTUNITY FUND
STATEMENT OF COMPLIANCE WITH THE CODE OF CORPORATE GOVERNANCEFOR THE YEAR ENDED JUNE 30, 2017
This statement is being presented by the Board of Directors (the Board) of NBP Fullerton Asset Management Limited (the Company), the Management Company of NAFA Income Opportunity Fund (the Fund) to comply with the Code of Corporate Governance (CCG) contained in Regulation No. 5.19 of the Rule Book of the Pakistan Stock Exchange Limited for the purpose of establishing a framework of good governance, whereby a listed company is managed in compliance with the best practices of corporate governance.
NBP Fullerton Asset Management Limited, the Management Company, is not listed and hence, the CCG is not applicable to it. However, the Fund being listed on Pakistan Stock Exchange comes under the ambit of the CCG. The Fund, being a unit trust scheme, does not have its own Board. The Board of Directors of the Management Company manages the affairs of the Fund and appoints the Chief Executive Of�cer (CEO), Chief Financial Of�cer (CFO) and the Company Secretary of the Man-agement Company and other necessary personnel to manage its affairs.
The Company has applied the principles contained in the CCG in the following manner:
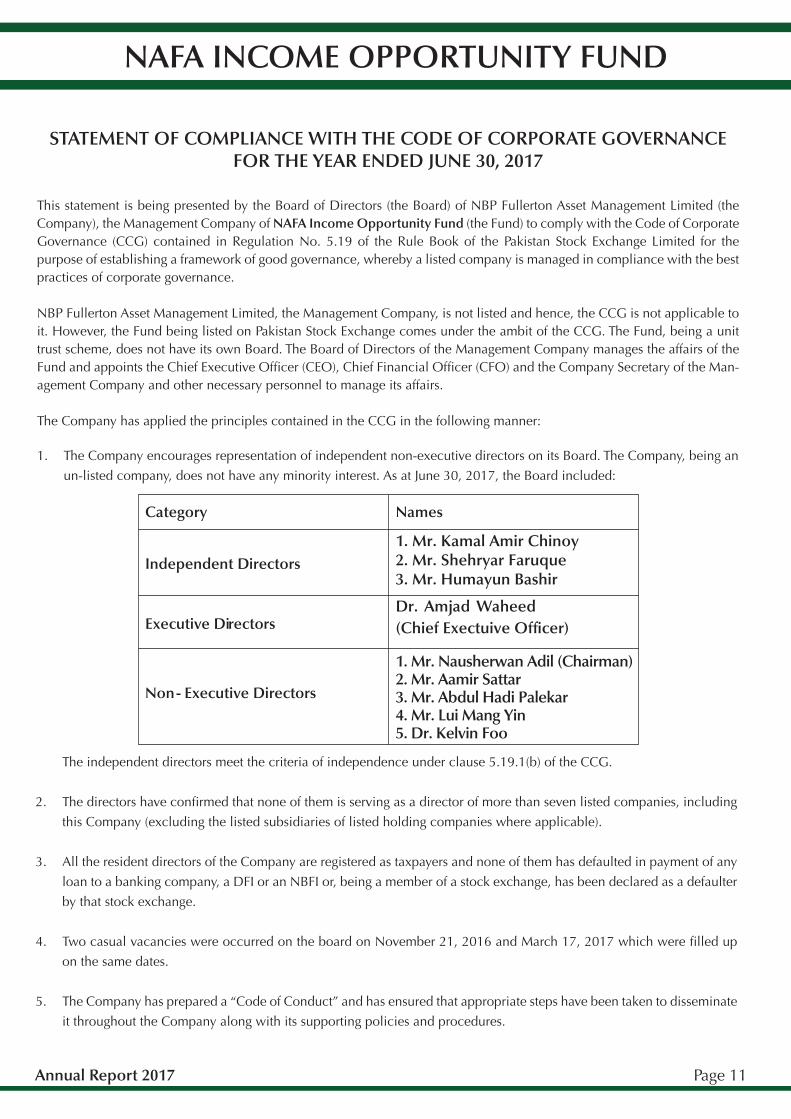
The Company encourages representation of independent non-executive directors on its Board. The Company, being an
un-listed company, does not have any minority interest. As at June 30, 2017, the Board included:
1.
The independent directors meet the criteria of independence under clause 5.19.1(b) of the CCG.
The directors have con�rmed that none of them is serving as a director of more than seven listed companies, including
this Company (excluding the listed subsidiaries of listed holding companies where applicable).
All the resident directors of the Company are registered as taxpayers and none of them has defaulted in payment of any
loan to a banking company, a DFI or an NBFI or, being a member of a stock exchange, has been declared as a defaulter
by that stock exchange.
Two casual vacancies were occurred on the board on November 21, 2016 and March 17, 2017 which were �lled up
on the same dates.
The Company has prepared a “Code of Conduct” and has ensured that appropriate steps have been taken to disseminate
it throughout the Company along with its supporting policies and procedures.
2.
3.
4.
5.
Category Names
Independent Directors 1. Mr. Kamal Amir Chinoy
2. Mr. Shehryar Faruque3. Mr. Humayun Bashir
Executive Directors Dr. Amjad Waheed (Chief Exectuive Of�cer)
Non- Executive Directors
1. Mr. Nausherwan Adil (Chairman)2. Mr. Aamir Sattar3. Mr. Abdul Hadi Palekar4. Mr. Lui Mang Yin5. Dr. Kelvin Foo

Annual Report 2017 Page 12
NAFA INCOME OPPORTUNITY FUND
The Board has developed a vision / mission statement, overall corporate strategy and signi�cant policies of the Fund. A
complete record of particulars of signi�cant policies along with the dates on which they were approved or amended has
been maintained.
All the powers of the Board have been duly exercised and decisions on material transactions, including appointment
and determination of remuneration and terms and conditions of employment of the Chief Executive have been taken by
the Board. There is no other executive-director of the Company besides Chief Executive Of�cer (CEO).
The meetings of the Board were presided over by the Chairman and, in his absence, by a director elected by the Board
for this purpose and the Board met at least once in every quarter. Written notices of the Board meetings, along with
agenda and working papers, were circulated at least seven days before the meetings. The minutes of the meetings were
appropriately recorded and circulated.
The directors are conversant of the relevant laws applicable to the Company, its policies and provisions of memorandum
and articles of association and are aware of their duties and responsibilities. As of 30 June 2017, four directors of the
Company had acquired the director’s training certi�cate as required under the CCG. The Company plans to arrange a
Director’s Training Program in future, for the remaining directors.
The Board has approved the appointment of Head of Internal Audit of the Company with remuneration and terms and
conditions of employment. There has been no new appointment of the Company Secretary and Chief Financial Of�cer
(CFO) during the year.
The Directors’ report for this year has been prepared in compliance with the requirements of the CCG and fully
describes the salient matters required to be disclosed.
The �nancial statements of the Fund were duly endorsed by CEO and CFO before approval of the Board.
The Directors, CEO and executives do not hold any interest in the units of the Fund other than that disclosed in note 22
to the �nancial statements “Transactions with Connected Persons”.
The Company has complied with all the corporate and �nancial reporting requirements of the CCG.
The Board has formed an Audit Committee. It comprises of three members, of whom all are non-executive directors and
the chairman of the committee is an independent director.
The meetings of the audit committee were held at least once every quarter prior to approval of interim and �nal results
of the Fund and as required by the CCG. The committee has formed the terms of reference for compliance.
The Board has formed a Human Resource and Remuneration Committee. It comprises of three members. All the mem-
bers are non-executive directors and the chairman of the committee is an independent director.
6.
7.
8.
9.
10.
11.
12.
13.
14.
15.
16.
17.
Annual Report 2017 Page 13
NAFA INCOME OPPORTUNITY FUND
The Board has set up an effective internal audit function headed by the Head of Internal Audit who is considered suitably
quali�ed and experienced for the purpose and is conversant with the policies and procedures of the Management Company.
The statutory auditors of the Fund have con�rmed that they have been given a satisfactory rating under the Quality
Control Review Program of the Institute of Chartered Accountants of Pakistan (ICAP), that they or any of the partners of
the �rm, their spouses and minor children do not hold units of the Fund and that the �rm and all its partners are in
compliance with International Federation of Accountants (IFAC) guidelines on code of ethics as adopted by ICAP.
The statutory auditors or the persons associated with them have not been appointed to provide other services except in accor-
dance with the listing regulations and the auditors have con�rmed that they have observed IFAC guidelines in this regard.
The ‘closed period’, prior to the announcement of interim / �nal results, and business decisions was determined and
intimated to directors, employees and stock exchange except for 60th and 61st meeting of the Board of Directors.
Material / price sensitive information has been disseminated amongst all market participants at once through stock
exchange.
We con�rm that all other material principles enshrined in the CCG have been complied with expect the following:
- the mechanism was required to put in place for an annual evaluation of the Board within two years of
coming into effect of the Code i.e. April 2014. The mechanism is in place and the Company is in the
process of completion of annual evaluation of the Board.
- the Company has not complied with the requirements relating to maintenance of register of persons
employed having access to inside information nor any senior management of�cer has been designated
by the Company responsible for maintaining proper record including basis for inclusion or exclusion of
names of persons from the said list.
For and behalf of the Board
___________________
Dr. Amjad Waheed
September 15, 2017 Chief Executive Of�cer
Karachi
18.
19.
20.
21.
22.
23.
Annual Report 2017 Page 14
NAFA INCOME OPPORTUNITY FUND
NAFA Income Opportunity Fund (NIOF) is an open-end Income Scheme.
Investment Objective of the Fund The objective of NIOF is to seek maximum possible preservation of capital and a reasonable rate of return via investing primarily in money market & debt securities having good credit rating and liquidity.
Benchmark 6 Month – KIBOR.
Fund Performance Review This is the twelfth Annual report since the launch of the Fund on April 21, 2006. The Fund size increased by around 31% during FY17 and stands at Rs 8.20 billion as on June 30, 2017. The Fund’s return since its inception is 8.20% versus the benchmark return of 10.40%. During FY17, the Fund posted a return of 6.28% as compared to the benchmark return of 6.10%. This translates into an outperformance of 0.18%. This outperformance is net of management fee and all other expenses. Hence, the Fund has achieved its stated objectives.
The Yield to Maturity of the Fund at year end FY17 is around 4.90% while that of TFC portfolio is 7.02%. The yield does not include potential recovery in fully provided TFCs (Face Value of around Rs 901 million), which is potential upside for the Fund. The Fund's TFC portfolio allocation is fairly diversi�ed with exposure to Banking and Financial Services sectors.
The trading activity in TFCs/Sukuks remained skewed towards high quality debt issues with cumulative trade value of Rs 9.1 billion in FY17 compared to Rs 7.7 billion last year. The trades were mainly concentrated towards banking sector debt securities with 71% contribution. All TFCs/Sukuks in the Fund are �oating rate linked to KIBOR.
During the year, State Bank of Pakistan (SBP) held six (06) monetary policies and maintained the policy rate at 5.75%. SBP’s prudent monetary policy stance translated into low and stable market interest rates; encouraged the private sector to undertake capacity expansions. Amid comfortable liquidity conditions, SBP kept the weighted average overnight repo rate close to the policy rate. SBP successfully concluded 03-Year Fixed Rental Rate GOP Ijara Sukuk (GIS-FRR) auction during the year for an amount of Rs. 71 billion and realized in line with the maturity amount at a yield of 5.24%.
Asset Allocation of Fund (% of NAV)
FUND MANAGER REPORT
Particulars 30-Jun-17 30-Jun-16 TFCs/Sukuks 7.53% 8.62% PIBs 1.4% 4.41% T-Bills 2.05% 1.18% Placements with Banks 13.42% 30.36% Money Market Placements 2.38% - Margin Trading System (MTS) 1.07% 1.75% Equity 0.44% 0.55% Cash (Cash Equivalents) & Other Assets 71.71% 53.12% Total 100% 100%
TFCs / Sukuks (AA-), 7.53%
PIBs (AAA), 1.40%
TDR (A+), 13.42%
T-BILLS (AAA), 2.05%
MTS, 1.07%
EQUITY, 0.44%
COMMERCIAL PAPER (A+), 2.38%Cash Equivalents & Other
Net Assets (AA), 71.71%

Annual Report 2017 Page 15
NAFA INCOME OPPORTUNITY FUND
Distribution for the Financial Year 2017
PIB yields during the year are shown in below graph:
Details of Non-Compliant Investments
5.75
6.25
6.75
7.25
7.75
8.25
8.75
PIB Rates during FY 2017
3 Years 5 Years 10 Years
Interim Period/Quarter Dividend as % of Par Value (Rs.10)
Cumulative Div. Price/Unit
Ex- Div. Price
Interim. 6.78 11.3796 10.7016
Particulars Type of Investment Value of Investments before Provision
Provision held Value of Investments after Provision
% of Net Assets
% of Gross Assets
AgriTech Limited I - Revised II 29-NOV-07 29-NOV-19 TFC 149,860,200 149,860,200 - - -
AgriTech Limited V 01-JUL-11 01-JAN-18 TFC 32,320,000 32,320,000 - - -
Azgard Nine Limited III (PP) - Revised 04-DEC-07 04-DEC-17 TFC 108,376,850 108,376,850 - - -
Azgard Nine Limited V (PPTFC Markup) 31-MAR-12 31-MAR-19 TFC 82,180,000 82,180,000 - - -
BRR Guardian Modaraba - Sukuk Revised II 07-JUL-08 07-APR-19 SUKUK 14,192,360 14,192,360 - - -
Dewan Cement Limited (Pre-IPO) 17-JAN-08 17-JAN-18 TFC 150,000,000 150,000,000 - - -
Eden House Limited - Sukuk Revised 29-MAR-08 29-SEP-17 SUKUK 9,056,250 9,056,250 - - -
New Allied Electronics Limited (PP) 15-MAY-07 15-NOV-17 TFC 31,706,536 31,706,536 - - -
New Allied Electronics Limited II - Sukuk 03-DEC-07 03-DEC-17 SUKUK 44,148,934 44,148,934 - - -
PACE Pakistan Limited - Revised 15-FEB-08 15-FEB-19 TFC 149,820,000 149,820,000 - - -
Saudi Pak Leasing Company Limited - Revised II 13-MAR-08 13-MAR-19 TFC 41,321,115 41,321,115 - - -
Worldcall Telecom Limited - Revised 07-OCT-08 07-OCT-21 TFC 88,455,825 88,455,825 - - -
Azgard Nine Limited (Non-Voting Ordinary Shares) Equity 12,854 12,854 - - -
Agritech Limited Shares Equity 141,403,150 105,108,575 36,294,575 0.4% 0.4%Total 1,042,854,074 1,006,559,499 36,294,575 0.4% 0.4%
Annual Report 2017 Page 16
NAFA INCOME OPPORTUNITY FUND
During the period under question:
During the year, the provision for Workers' Welfare Fund held by the fund till June 30, 2015 has been reversed on January
12, 2017. Further, the provision in respect of Sindh Workers’ Welfare Fund has been made on a prudent basis with effect
from May 21, 2015. For further details, refer note 17 to the �nancial statements.
There has been no signi�cant change in the state of affairs of the Fund, other than stated above. NAFA Income
Opportunity Fund does not have any soft commission arrangement with any broker in the industry.
Sindh Workers’ Welfare Fund (SWWF)
The scheme has maintained provisions against Sindh Workers' Welfare Fund's liability to the tune of Rs. 10.469 million.
If the same were not made the NAV per unit/FY17 return of scheme would be higher by Rs. 0.0137/0.13%. For details
investors are advised to read note 17 of the Financial Statement of the Scheme for the year ended June 30, 2017.
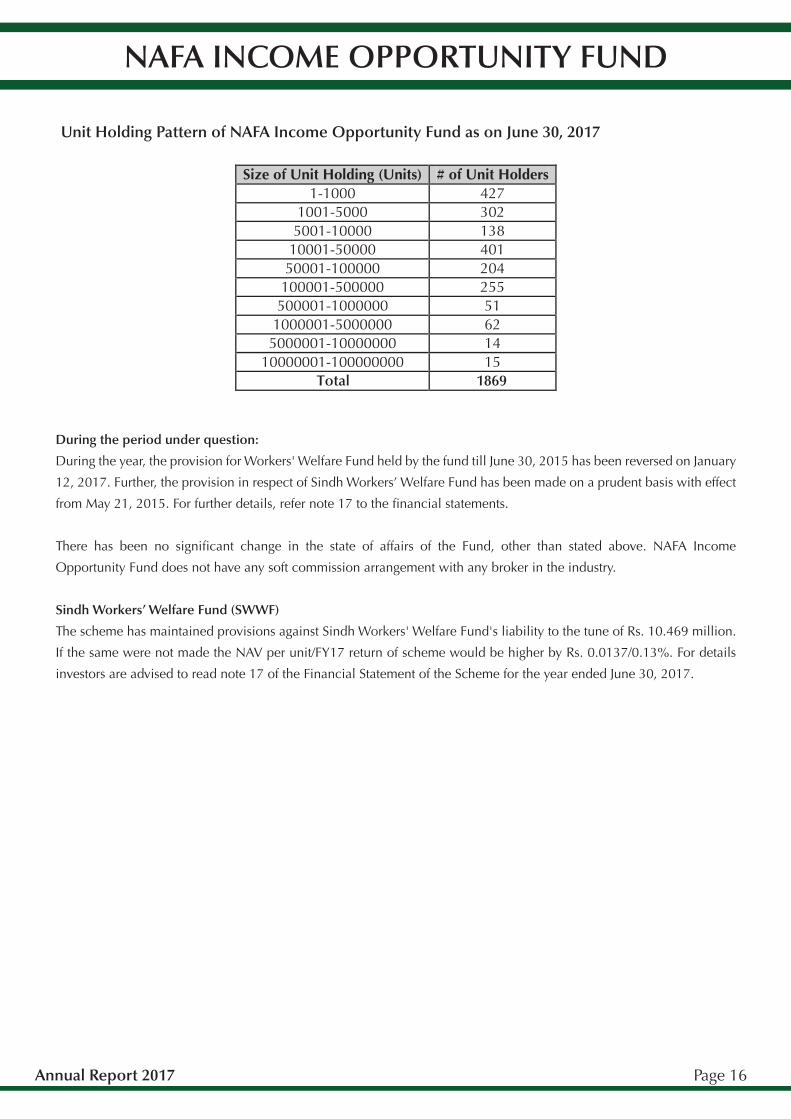
Unit Holding Pattern of NAFA Income Opportunity Fund as on June 30, 2017
Size of Unit Holding (Units) # of Unit Holders 1-1000 427
1001-5000 302 5001-10000 138
10001-50000 401 50001-100000 204
100001-500000 255 500001-1000000 51
1000001-5000000 62 5000001-10000000 14
10000001-100000000 15 Total 1869
Annual Report 2017 Page 17
NAFA INCOME OPPORTUNITY FUND
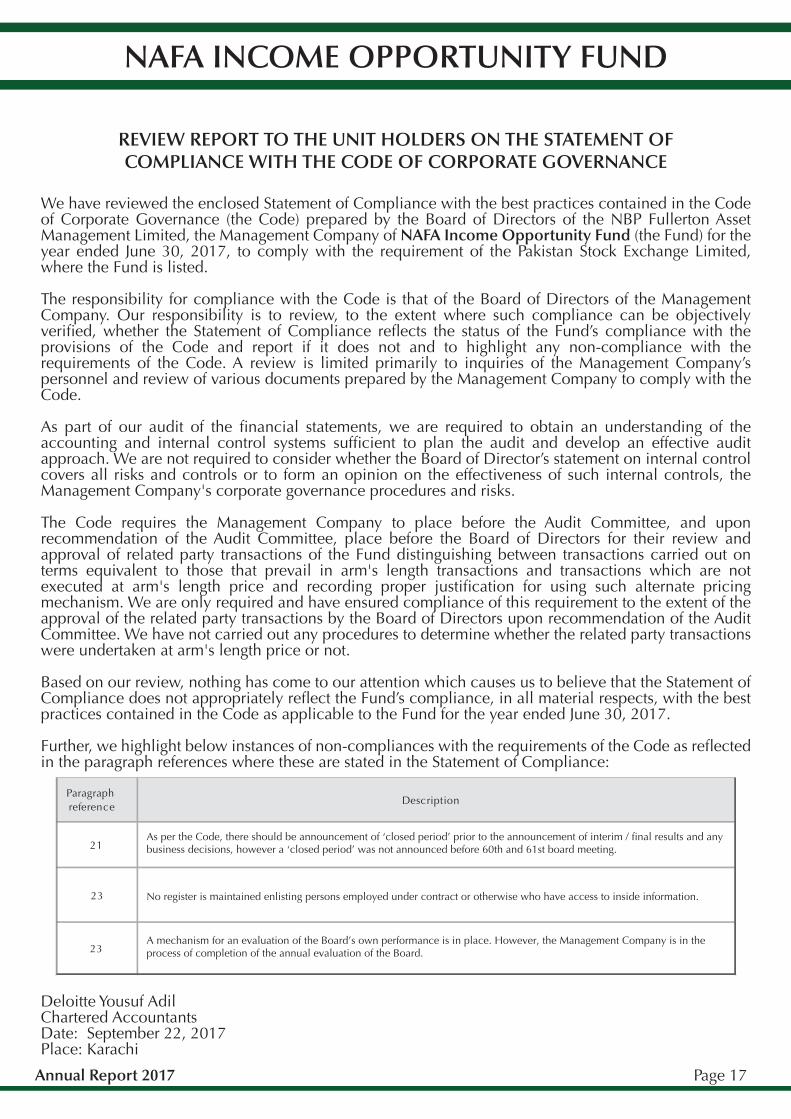
REVIEW REPORT TO THE UNIT HOLDERS ON THE STATEMENT OFCOMPLIANCE WITH THE CODE OF CORPORATE GOVERNANCE
We have reviewed the enclosed Statement of Compliance with the best practices contained in the Code of Corporate Governance (the Code) prepared by the Board of Directors of the NBP Fullerton Asset Management Limited, the Management Company of NAFA Income Opportunity Fund (the Fund) for the year ended June 30, 2017, to comply with the requirement of the Pakistan Stock Exchange Limited, where the Fund is listed.
The responsibility for compliance with the Code is that of the Board of Directors of the Management Company. Our responsibility is to review, to the extent where such compliance can be objectively veri�ed, whether the Statement of Compliance re�ects the status of the Fund’s compliance with the provisions of the Code and report if it does not and to highlight any non-compliance with the requirements of the Code. A review is limited primarily to inquiries of the Management Company’s personnel and review of various documents prepared by the Management Company to comply with the Code.
As part of our audit of the �nancial statements, we are required to obtain an understanding of the accounting and internal control systems suf�cient to plan the audit and develop an effective audit approach. We are not required to consider whether the Board of Director’s statement on internal control covers all risks and controls or to form an opinion on the effectiveness of such internal controls, the Management Company's corporate governance procedures and risks.
The Code requires the Management Company to place before the Audit Committee, and upon recommendation of the Audit Committee, place before the Board of Directors for their review and approval of related party transactions of the Fund distinguishing between transactions carried out on terms equivalent to those that prevail in arm's length transactions and transactions which are not executed at arm's length price and recording proper justi�cation for using such alternate pricing mechanism. We are only required and have ensured compliance of this requirement to the extent of the approval of the related party transactions by the Board of Directors upon recommendation of the Audit Committee. We have not carried out any procedures to determine whether the related party transactions were undertaken at arm's length price or not.
Based on our review, nothing has come to our attention which causes us to believe that the Statement of Compliance does not appropriately re�ect the Fund’s compliance, in all material respects, with the best practices contained in the Code as applicable to the Fund for the year ended June 30, 2017.
Further, we highlight below instances of non-compliances with the requirements of the Code as re�ected in the paragraph references where these are stated in the Statement of Compliance:
Deloitte Yousuf AdilChartered AccountantsDate: September 22, 2017Place: Karachi
Paragraph reference
Description
21
23
23A mechanism for an evaluation of the Board’s own performance is in place. However, the Management Company is in the process of completion of the annual evaluation of the Board.
As per the Code, there should be announcement of ‘closed period’ prior to the announcement of interim / �nal results and any business decisions, however a ‘closed period’ was not announced before 60th and 61st board meeting.
No register is maintained enlisting persons employed under contract or otherwise who have access to inside information.

Annual Report 2017 Page 18
NAFA INCOME OPPORTUNITY FUND
Report on the Financial Statements
We have audited the accompanying �nancial statements of NAFA Income Opportunity Fund (the Fund), which
comprise the statement of assets and liabilities as at June 30, 2017, and the related income statement, statement of
comprehensive income, cash �ow statement, distribution statement and statement of movements in unit holders’
funds for the year then ended, and a summary of signi�cant accounting policies and other explanatory information.
Management Company’s Responsibility for the Financial Statements
NBP Fullerton Asset Management Limited (the Management Company) is responsible for the preparation and fair
presentation of these �nancial statements in accordance with the approved accounting standards as applicable in
Pakistan, and for such internal control as the Management Company determines is necessary to enable the
preparation of �nancial statements that are free from material misstatement, whether due to fraud or error.
Auditors’ Responsibility
Our responsibility is to express an opinion on these �nancial statements based on our audit. We conducted our
audit in accordance with auditing standards as applicable in Pakistan. Those standards require that we comply with
ethical requirements and plan and perform the audit to obtain reasonable assurance about whether the �nancial
statements are free from material misstatement.
An audit involves performing procedures to obtain audit evidence about the amounts and disclosures in the
�nancial statements. The procedures selected depend on the auditor’s judgment, including the assessment of the
risks of material misstatement of the �nancial statements, whether due to fraud or error. In making those risk
assessments, the auditor considers internal control relevant to the Fund’s preparation and fair presentation of the
�nancial statements in order to design audit procedures that are appropriate in the circumstances, but not for the
purpose of expressing an opinion on the effectiveness of the Fund’s internal control. An audit also includes
evaluating the appropriateness of accounting policies used and the reasonableness of accounting estimates made by
the Management Company, as well as evaluating the overall presentation of the �nancial statements.
We believe that the audit evidence we have obtained is suf�cient and appropriate to provide a basis for our audit
opinion.
Independent Auditors’ Report to the Unit Holders

Annual Report 2017 Page 19
NAFA INCOME OPPORTUNITY FUND
Opinion
In our opinion, the �nancial statements give a true and fair view of the �nancial position of the Fund as at June 30,
2017, and of its �nancial performance, its cash �ows and transactions for the year then ended in accordance with
approved accounting standards as applicable in Pakistan.
Report on Other Legal and Regulatory Requirements
In our opinion, the �nancial statements have been prepared in accordance with the relevant provisions of the Non-
Banking Finance Companies (Establishment and Regulation) Rules, 2003 and Non- Banking Finance Companies
and Noti�ed Entities Regulations, 2008.
Deloitte Yousuf Adil
Chartered Accountants
Engagement Partner:
Naresh Kumar
Date: September 22, 2017
Place: Karachi
Annual Report 2017 Page 20
NAFA INCOME OPPORTUNITY FUND
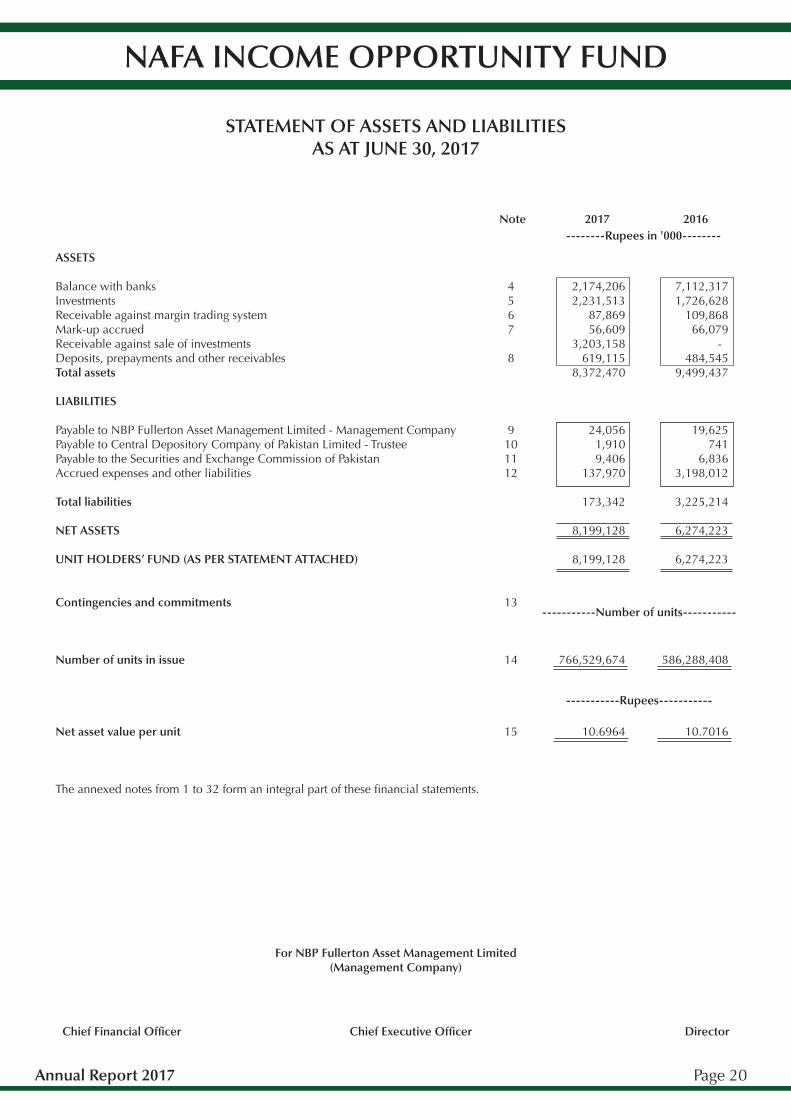
STATEMENT OF ASSETS AND LIABILITIESAS AT JUNE 30, 2017
ASSETS
Balance with banksInvestments Receivable against margin trading systemMark-up accruedReceivable against sale of investmentsDeposits, prepayments and other receivablesTotal assets
LIABILITIES
Payable to NBP Fullerton Asset Management Limited - Management CompanyPayable to Central Depository Company of Pakistan Limited - TrusteePayable to the Securities and Exchange Commission of Pakistan Accrued expenses and other liabilities
Total liabilities
NET ASSETS
UNIT HOLDERS’ FUND (AS PER STATEMENT ATTACHED)
Contingencies and commitments
Number of units in issue
Net asset value per unit
The annexed notes from 1 to 32 form an integral part of these �nancial statements.
4567
8
9101112
13
14
15
2,174,206 2,231,513
87,869 56,609
3,203,158 619,115
8,372,470
24,056 1,910 9,406
137,970
173,342
8,199,128
8,199,128
766,529,674
10.6964
Note
-----------Number of units-----------
-----------Rupees-----------
2017--------Rupees in '000--------
7,112,317 1,726,628
109,868 66,079
- 484,545
9,499,437
19,625 741
6,836 3,198,012
3,225,214
6,274,223
6,274,223
586,288,408
10.7016
2016
Chief Financial Of�cer Chief Executive Of�cer Director
For NBP Fullerton Asset Management Limited(Management Company)

Annual Report 2017 Page 21
NAFA INCOME OPPORTUNITY FUND
INCOME STATEMENTFOR THE YEAR ENDED JUNE 30, 2017
INCOME Return / mark-up on: - bank balances and term deposits - term �nance certi�cates and sukuks - government securities - letter of placement and commercial paper - margin trading system Net income on spread transactions Dividend income on spread transactions Net (loss) / gain on sale of investments Net unrealised gain on re-measurement of investments at fair value through pro�t or loss - held for trading Reversal of provision in respect of non-performing investments Reversal / (provision) against accrued mark-up Total income EXPENSES Remuneration of NBP Fullerton Asset Management Limited - Management Company Sindh Sales Tax on remuneration of the Management Company Federal Excise Duty on remuneration of the Management Company Reimbursement of operational expenses to the Management Company Remuneration of Central Depository Company of Pakistan Limited - Trustee Sindh Sales Tax on remuneration of the Trustee Annual fee to the Securities and Exchange Commission of Pakistan Securities transaction cost Settlement and bank charges Auditors' remuneration Fund rating fee Legal and professional charges Annual listing fee Printing and other charges Total expenses Net income from operating activities Net element of loss and capital losses included in prices of units issued less those in units redeemed Reversal of provision of Workers' Welfare Fund Provision for Sindh Workers' Welfare Fund Net income for the year before taxation Taxation Net income for the year after taxation Earnings per unit The annexed notes from 1 to 32 form an integral part of these �nancial statements.
5.135.168.2
9.19.2
12.19.3
10.110.211.1
16
1717
18
19
637,581 58,608 53,212 26,664 39,598 24,920 86,933 (3,394)
1,360 12,370 16,000
953,852
157,053 20,417
- 12,541 10,379 1,349 9,406
17,013 9,693
589 370 551 55 75
239,491 714,361
(444,204)
31,218 (10,469)
290,906
-
290,906
Note 2017 2016--------Rupees in '000--------
499,973 106,438
85,843 9,088
30,579 1,197
- 12,765
14,938 45,847
(14,859) 791,809
125,392 20,364 20,063
5,986 7,977 1,117 6,836
330 4,460
530 333
10 40
195
193,633 598,176
(371,589)
- -
226,587
-
226,587
Chief Financial Of�cer Chief Executive Of�cer Director
For NBP Fullerton Asset Management Limited(Management Company)

Annual Report 2017 Page 22
NAFA INCOME OPPORTUNITY FUND
STATEMENT OF COMPREHENSIVE INCOMEFOR THE YEAR ENDED JUNE 30, 2017
Net income for the year after taxation Other comprehensive income Items that may be reclassi�ed subsequently to income statement: Net unrealised gain on re-measurement of investments classi�ed as 'available for sale' Reclassi�cation to income statement relating to loss realised on maturity / disposal of investment classi�ed as 'available for sale' Total comprehensive income for the year The annexed notes from 1 to 32 form an integral part of these �nancial statements.
290,906
1,576
-
292,482
5.14
226,587
3,595
25,927
256,109
2017 2016--------Rupees in '000--------
Note
Chief Financial Of�cer Chief Executive Of�cer Director
For NBP Fullerton Asset Management Limited(Management Company)

Annual Report 2017 Page 23
NAFA INCOME OPPORTUNITY FUND
DISTRIBUTION STATEMENTFOR THE YEAR ENDED JUNE 30, 2017
Undistributed income brought forward comprising of: - realised income - unrealised income Net income for the year Final distribution for the year ended June 30, 2015: - cash distribution @ Rs. 0.8675 per unit declared on July 16, 2015 Final distribution for the year ended June 30, 2017: - cash distribution @ Rs. 0.6780 per unit declared on June 21, 2017 (2016: Rs. 0.7971 per unit declared on June 30, 2016) Net element of income and capital gains included in prices of units issued less those in units redeemed Undistributed income carried forward Undistributed income carried forward comprising of: - realised income - unrealised income The annexed notes from 1 to 32 form an integral part of these �nancial statements.
464,419 18,533
482,952
290,906
-
(300,707)
4,260
477,411
474,475 2,936
477,411
743,075 1,075
744,150
226,587
(237,655)
(263,254)
13,124
482,952
464,419 18,533
482,952
2017 2016--------Rupees in '000--------
Chief Financial Of�cer Chief Executive Of�cer Director
For NBP Fullerton Asset Management Limited(Management Company)

Annual Report 2017 Page 24
NAFA INCOME OPPORTUNITY FUND
STATEMENT OF MOVEMENT IN UNIT HOLDERS’ FUNDFOR THE YEAR ENDED JUNE 30, 2017
Net assets at the beginning of the year Issuance of 2,208,195,765 units (2016: 1,983,189,203 units) Redemption of 2,027,954,499 units (2016: 1,850,448,128 units) Net element of loss and capital losses included in prices of units issued less those in units redeemed - transferred to income statement Net element of income and capital gains included in issued less those in units redeemed - transferred to distribution statement Total comprehensive income for the year Distributions during the year Final distribution for the year ended June 30, 2015: - cash distribution @ Rs. 0.8675 per unit declared on July 16, 2015 Final distribution for the year ended June 30, 2017: - cash distribution @ Rs. 0.6780 per unit declared on June 21, 2017 (2016: Rs. 0.7971 per unit declared on June 30, 2016) Net element of income and capital gains included in prices of units issued less those in units redeemed - amount representing income that forms part of the unit holders fund Net assets as at the end of the year Net asset value per unit at the beginning of the year Net asset value per unit at the end of the year The annexed notes from 1 to 32 form an integral part of these �nancial statements.
6,274,223
24,202,206 (22,713,280)
1,488,926
444,204
(4,260)
292,482
-
(300,707) (300,707)
4,260
8,199,128
10.7016
10.6964
2017 2016--------Rupees in '000--------
5,242,537
21,929,709 (21,024,812)
904,897
371,589
(13,124)
256,109
(237,655)
(263,254) (500,909)
13,124
6,274,223
11.5590
10.7016
Chief Financial Of�cer Chief Executive Of�cer Director
For NBP Fullerton Asset Management Limited(Management Company)
Annual Report 2017 Page 25
NAFA INCOME OPPORTUNITY FUND
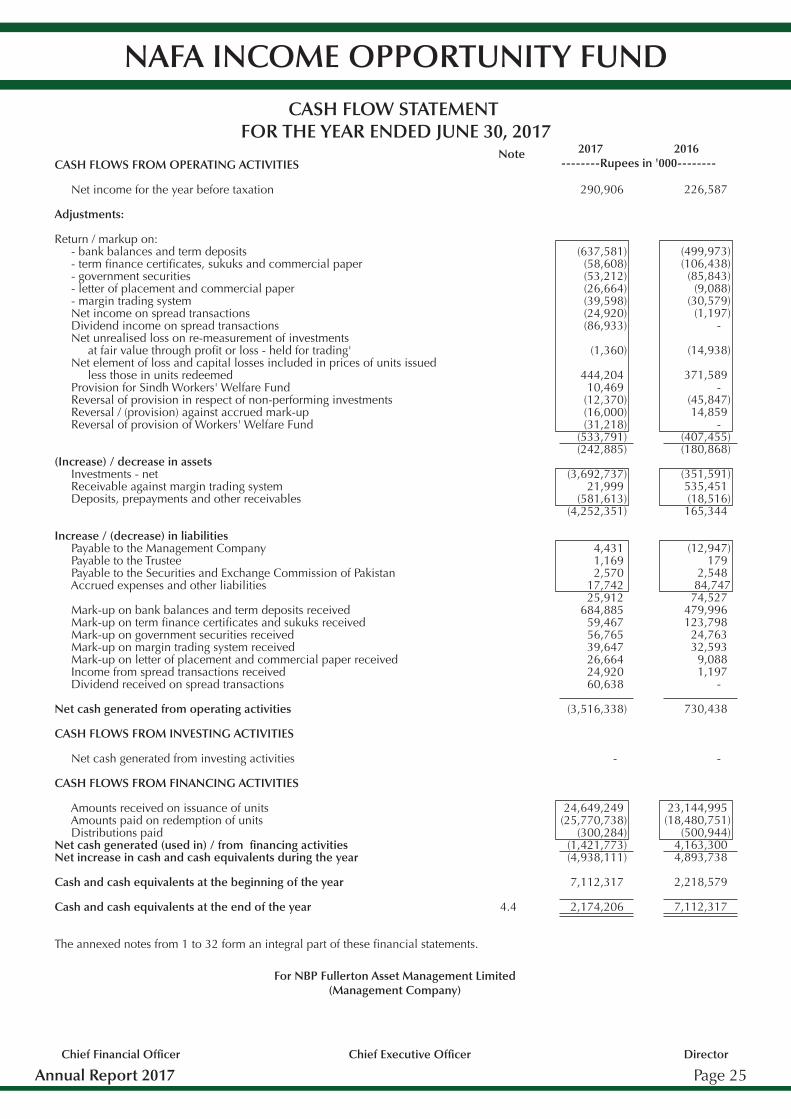
CASH FLOW STATEMENT FOR THE YEAR ENDED JUNE 30, 2017
CASH FLOWS FROM OPERATING ACTIVITIES
Net income for the year before taxation
Adjustments:
Return / markup on: - bank balances and term deposits - term �nance certi�cates, sukuks and commercial paper - government securities - letter of placement and commercial paper - margin trading system Net income on spread transactions Dividend income on spread transactions Net unrealised loss on re-measurement of investments at fair value through pro�t or loss - held for trading' Net element of loss and capital losses included in prices of units issued less those in units redeemed Provision for Sindh Workers' Welfare Fund Reversal of provision in respect of non-performing investments Reversal / (provision) against accrued mark-up Reversal of provision of Workers' Welfare Fund
(Increase) / decrease in assets Investments - net Receivable against margin trading system Deposits, prepayments and other receivables
Increase / (decrease) in liabilities Payable to the Management Company Payable to the Trustee Payable to the Securities and Exchange Commission of Pakistan Accrued expenses and other liabilities
Mark-up on bank balances and term deposits received Mark-up on term �nance certi�cates and sukuks received Mark-up on government securities received Mark-up on margin trading system received Mark-up on letter of placement and commercial paper received Income from spread transactions received Dividend received on spread transactions
Net cash generated from operating activities
CASH FLOWS FROM INVESTING ACTIVITIES
Net cash generated from investing activities
CASH FLOWS FROM FINANCING ACTIVITIES
Amounts received on issuance of units Amounts paid on redemption of units Distributions paidNet cash generated (used in) / from �nancing activitiesNet increase in cash and cash equivalents during the year
Cash and cash equivalents at the beginning of the year
Cash and cash equivalents at the end of the year
The annexed notes from 1 to 32 form an integral part of these �nancial statements.
290,906
(637,581) (58,608) (53,212) (26,664) (39,598) (24,920) (86,933)
(1,360)
444,204 10,469
(12,370) (16,000) (31,218)
(533,791) (242,885)
(3,692,737) 21,999
(581,613) (4,252,351)
4,431 1,169 2,570
17,742 25,912
684,885 59,467 56,765 39,647 26,664 24,920 60,638
(3,516,338)
-
24,649,249 (25,770,738)
(300,284) (1,421,773) (4,938,111)
7,112,317
2,174,206 4.4
2017 2016--------Rupees in '000--------
Note
226,587
(499,973) (106,438) (85,843)
(9,088) (30,579)
(1,197) -
(14,938)
371,589 -
(45,847) 14,859
- (407,455) (180,868)
(351,591) 535,451 (18,516)
165,344
(12,947) 179
2,548 84,747
74,527 479,996 123,798 24,763 32,593
9,088 1,197
-
730,438
-
23,144,995 (18,480,751)
(500,944) 4,163,300 4,893,738
2,218,579
7,112,317
Chief Financial Of�cer Chief Executive Of�cer Director
For NBP Fullerton Asset Management Limited(Management Company)
Annual Report 2017 Page 26
NAFA INCOME OPPORTUNITY FUND
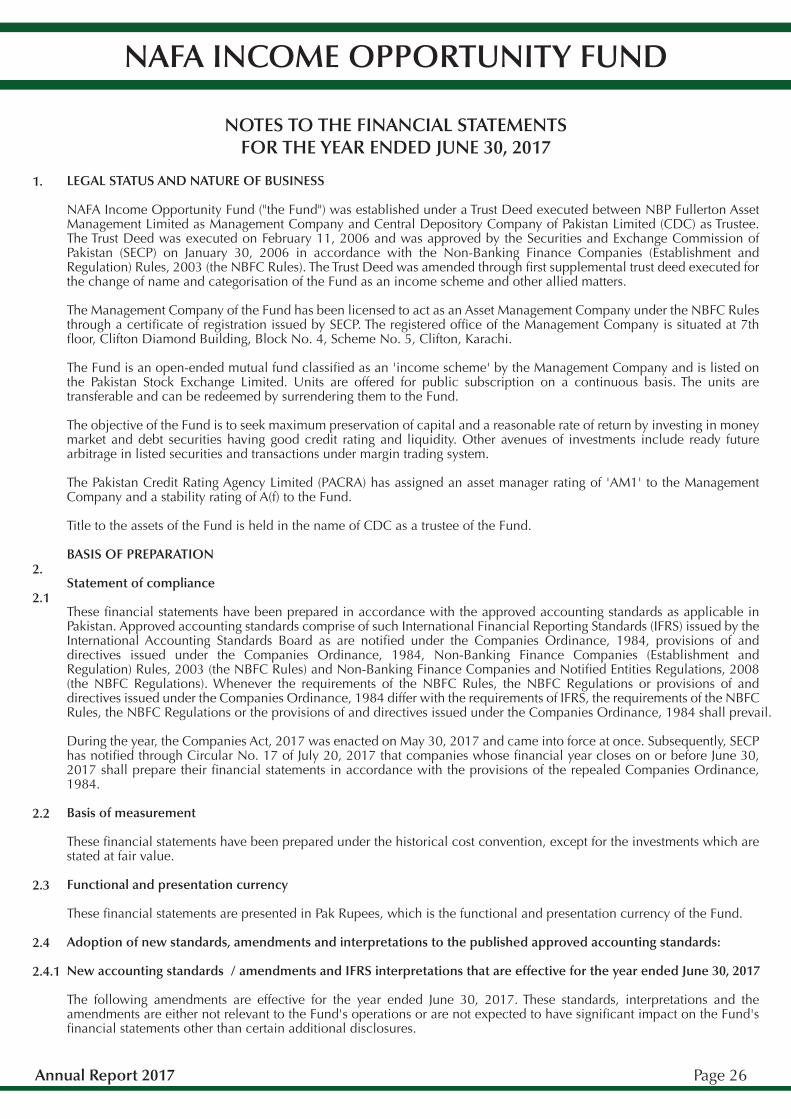
NOTES TO THE FINANCIAL STATEMENTSFOR THE YEAR ENDED JUNE 30, 2017
LEGAL STATUS AND NATURE OF BUSINESS NAFA Income Opportunity Fund ("the Fund") was established under a Trust Deed executed between NBP Fullerton Asset Management Limited as Management Company and Central Depository Company of Pakistan Limited (CDC) as Trustee. The Trust Deed was executed on February 11, 2006 and was approved by the Securities and Exchange Commission of Pakistan (SECP) on January 30, 2006 in accordance with the Non-Banking Finance Companies (Establishment and Regulation) Rules, 2003 (the NBFC Rules). The Trust Deed was amended through �rst supplemental trust deed executed for the change of name and categorisation of the Fund as an income scheme and other allied matters. The Management Company of the Fund has been licensed to act as an Asset Management Company under the NBFC Rules through a certi�cate of registration issued by SECP. The registered of�ce of the Management Company is situated at 7th �oor, Clifton Diamond Building, Block No. 4, Scheme No. 5, Clifton, Karachi. The Fund is an open-ended mutual fund classi�ed as an 'income scheme' by the Management Company and is listed on the Pakistan Stock Exchange Limited. Units are offered for public subscription on a continuous basis. The units are transferable and can be redeemed by surrendering them to the Fund. The objective of the Fund is to seek maximum preservation of capital and a reasonable rate of return by investing in money market and debt securities having good credit rating and liquidity. Other avenues of investments include ready future arbitrage in listed securities and transactions under margin trading system. The Pakistan Credit Rating Agency Limited (PACRA) has assigned an asset manager rating of 'AM1' to the Management Company and a stability rating of A(f) to the Fund. Title to the assets of the Fund is held in the name of CDC as a trustee of the Fund. BASIS OF PREPARATION Statement of compliance These �nancial statements have been prepared in accordance with the approved accounting standards as applicable in Pakistan. Approved accounting standards comprise of such International Financial Reporting Standards (IFRS) issued by the International Accounting Standards Board as are noti�ed under the Companies Ordinance, 1984, provisions of and directives issued under the Companies Ordinance, 1984, Non-Banking Finance Companies (Establishment and Regulation) Rules, 2003 (the NBFC Rules) and Non-Banking Finance Companies and Noti�ed Entities Regulations, 2008 (the NBFC Regulations). Whenever the requirements of the NBFC Rules, the NBFC Regulations or provisions of and directives issued under the Companies Ordinance, 1984 differ with the requirements of IFRS, the requirements of the NBFC Rules, the NBFC Regulations or the provisions of and directives issued under the Companies Ordinance, 1984 shall prevail.
During the year, the Companies Act, 2017 was enacted on May 30, 2017 and came into force at once. Subsequently, SECP has noti�ed through Circular No. 17 of July 20, 2017 that companies whose �nancial year closes on or before June 30, 2017 shall prepare their �nancial statements in accordance with the provisions of the repealed Companies Ordinance, 1984. Basis of measurement These �nancial statements have been prepared under the historical cost convention, except for the investments which are stated at fair value. Functional and presentation currency These �nancial statements are presented in Pak Rupees, which is the functional and presentation currency of the Fund. Adoption of new standards, amendments and interpretations to the published approved accounting standards: New accounting standards / amendments and IFRS interpretations that are effective for the year ended June 30, 2017 The following amendments are effective for the year ended June 30, 2017. These standards, interpretations and the amendments are either not relevant to the Fund's operations or are not expected to have signi�cant impact on the Fund's �nancial statements other than certain additional disclosures.
1.
2.
2.1
2.2
2.3
2.4
2.4.1

Annual Report 2017 Page 27
NAFA INCOME OPPORTUNITY FUND
Certain annual improvements have also been made to a number of IFRSs. Other than the aforesaid standards, interpretations and amendments, the International Accounting Standards Board (IASB) has also issued the following standards which have not been adopted locally by the Securities and Exchange Commission of Pakistan: - IFRS 1 – First Time Adoption of International Financial Reporting Standards - IFRS 9 – Financial Instruments - IFRS 14 – Regulatory Deferral Accounts - IFRS 15 – Revenue from Contracts with Customers - IFRS 16 – Leases - IFRS 17 – Insurance Contracts Amendment in the NBFC Regulations subsequent to the year end Subsequent to the year end on August 03, 2017, the SECP has made certain amendments in the NBFC Regulations, 2008 via SRO 756 (I)/2017. The de�nition of element of income has been inserted via said amendment which de�nes element of income as difference between net assets value on the issuance or redemption date, as the case may be, of units and the net asset value at the beginning of the relevant accounting period. The said amendment also excludes element of income from accounting income for the purpose of distribution under regulation 63 of the NBFC Regulations. The said SRO also contains amendments relating to consequential changes in the income statement and statement of movement in unitholders’ fund. The Management Company is in the process of assessing the impact of the said changes with the view that these changes will be effective for the period following the date of the said SRO.
2.5
New accounting standards / amendments and IFRS interpretations that are not yet effective The following standards, amendments and interpretations are only effective for accounting periods, beginning on or after the date mentioned against each of them. These standards, interpretations and the amendments are either not relevant to the Fund's operations or are not expected to have signi�cant impact on the Fund's �nancial statements other than certain additional disclosures.
2.4.2
IFRIC 23 'Uncertainty over Income Tax Treatments'
Amendments to IAS 12 'Income Taxes' - Recognition of deferred tax assets for unrealised losses
Amendments to IFRS 2 'Share-based Payment' - Clari�cation on the classi�cation and measurement of share-based payment transactions
IFRIC 22 'Foreign Currency Transactions and Advance Consideration' Effective from accounting period beginning on or after January 01, 2018
Effective from accounting period beginning on or after January 01, 2018
Amendments to IFRS 10 'Consolidated Financial Statements' and IAS 28 'Investments in Associates and Joint Ventures' - Sale or contribution of assets between an investor and its associate or joint venture
Effective date is deferred inde�nitely. Earlier adoption is permitted.
Effective from accounting period beginning on or after January 01, 2019
Effective from accounting period beginning on or after January 01, 2018
Amendments to IAS 40 'Investment Property': Clari�cation on transfers of property to or from investment property
Effective from accounting period beginning on or after January 01, 2017
Effective from accounting period beginning on or after January 01, 2017
Amendments to IAS 7 'Statement of Cash Flows' - Amendments as a result of the disclosure initiative
Effective from accounting period beginning on or after January 01, 2016
Amendments to IFRS 10 'Consolidated Financial Statements', IFRS 12 'Disclosure of Interests in Other Entities' and IAS 28 'Investments in Associates and Joint Ventures' - Investment Entities: Applying the consolidation exception
Effective from accounting period beginning on or after January 01, 2016
Effective from accounting period beginning on or after January 01, 2016
Amendments to IAS 27 'Separate Financial Statements' - Equity method in separate �nancial statements
Certain annual improvements have also been made to a number of IFRSs.
Effective from accounting period beginning on or after January 01, 2016
Amendments to IAS 16 'Prperty Plant and Equipment' and IAS 41 'Agriculture' - Measurement of bearer plants
Effective from accounting period beginning on or after January 01, 2016
Amendments to IAS 1 'Presentation of Financial Statements' - Disclosure initiative
Amendments to IFRS 11 'Joint Arrangements' - Accounting for acquisitions of interests in joint operations
Amendments to IAS 16 'Prperty Plant and Equipment' and IAS 38 'Intangible Assets' - Clari�cation of acceptable methods of depreciation and amortization
Effective from accounting period beginning on or after January 01, 2016
Annual Report 2017 Page 28
NAFA INCOME OPPORTUNITY FUND
a)
b)
c)
Investments at fair value through pro�t or loss - held for trading Financial assets that are acquired principally for the purpose of generating pro�t from short-term �uctuations in market prices, interest rate movements or are �nancial assets included in a portfolio in which a pattern of short term pro�t making exists.
Loans and receivables These are non-derivative �nancial assets with �xed or determinable payments that are not quoted in an active market. Available for sale Available for sale �nancial assets are those non-derivative �nancial assets that are designated as available for sale or are not classi�ed as (i) loans and receivables, (ii) held to maturity investments or (iii) �nancial assets at fair value through pro�t or loss.
1)
2)
3)
Debt securities (other than government securities)
The investment of the Fund in debt securities is valued on the basis of rates determined by the Mutual Fund Association of Pakistan (MUFAP) in accordance with the methodology prescribed by SECP for valuation of debt securities vide its circular no. 1 of 2009 dated January 6, 2009 and circular no. 33 of 2012 dated October 24, 2012. In the determination of the rates MUFAP takes into account the holding pattern of these securities and categorises them as traded, thinly traded and non-traded securities. The circular also speci�es the valuation process to be followed for each category as well as the criteria for the provisioning of non-performing debt securities. Government securities The investment of the Fund in government securities is valued on the basis of rates announced by the Financial Markets Association of Pakistan. Equity securities The investment of the Fund in equity securities are valued on the basis of closing quoted market prices available at the stock exchange.
Critical accounting estimates and judgments The preparation of �nancial statements in conformity with the approved accounting standards requires the management to make estimates, judgments and assumptions that affect the reported amounts of assets and liabilities, income and expenses. It also requires the management to exercise its judgment in the process of applying Fund's accounting policies. Estimates, judgments and assumptions are continually evaluated and are based on historical experience and other factors, including expectation of future events that are believed to be reasonable under the circumstances. Actual results may differ from those estimates.
In the process of applying Fund's accounting policies, management has made the following estimates and judgments which are signi�cant to the �nancial statements: (a) classi�cation of �nancial assets (Note 3.2.1) (b) impairment of �nancial assets (Note 3.2.5) (c) provisions (Note 3.8)
SUMMARY OF SIGNIFICANT ACCOUNTING POLICIES The principal accounting policies applied in the preparation of these �nancial statements are set out below. Cash and cash equivalents Cash comprises current and saving accounts with banks. Cash equivalents are short-term highly liquid investments that are readily convertible to known amounts of cash, are subject to insigni�cant change in value, and are held for the purpose of meeting short-term cash commitments rather than for investment or other purposes. Financial assets Classi�cation The management of the Fund determines appropriate classi�cation of investments at the time of purchase and classi�es these investments at fair value through pro�t or loss, loans and receivables or available for sale.
2.6
3.
3.1
3.2
3.2.1
Regular way contracts All regular purchases / sales of �nancial assets are recognised on the trade date i.e. the date that the Fund commits to purchase / sell the assets. Initial recognition and measurement Financial assets are initially recognised at fair value plus transaction costs except for �nancial assets carried 'at fair value through pro�t or loss'. Financial assets carried 'at fair value through pro�t or loss' are initially recognised at fair value and transaction costs are recognised in the 'income statement'. Subsequent measurement Financial assets designated by the management as 'at fair value through pro�t or loss' - held for trading and 'available for sale'
3.2.2
3.2.3
3.2.4

Annual Report 2017 Page 29
NAFA INCOME OPPORTUNITY FUND
b) Loans and receivables Subsequent to initial recognition, �nancial assets classi�ed as 'loans and receivables' are carried at amortised cost using the effective interest method. Gains or losses are also recognised in the 'income statement' when �nancial assets carried at amortised cost are derecognised or impaired and through the amortisation process.
a)
b)
c)
Debt securities Provision for non-performing debt securities is made on the basis of time based criteria as prescribed under circular no. 33 of 2012 dated October 24, 2012 issued by the SECP. Impairment losses recognised on debt securities can be reversed through the 'income statement'. As allowed under circular no. 13 of 2009 dated May 4, 2009 issued by the SECP, the management may also make provision against debt securities over and above the minimum provision requirement prescribed in the aforesaid circular, in accordance with the provisioning policy approved by the Board of Directors and disseminated by the Management Company on its website. Equity securities For equity securities classi�ed as 'available for sale', a signi�cant or prolonged decline in the fair value of the security below its cost is considered, among other indicators, as an indicator that the security is impaired. If any such evidence exists for 'available for sale' �nancial assets, the cumulative loss measured as the difference between the acquisition cost and the current fair value, less any impairment loss on that �nancial asset previously recognised in 'income statement', is reclassi�ed from other comprehensive income and recognized in the income statement. However, the decrease in impairment loss on equity securities are not reversed through the income statement. Loans and receivables For �nancial assets classi�ed as 'loans and receivables', a provision for impairment is established when there is an objective evidence that the Fund will not be able to collect all amounts due according to the original terms. The amount of the impairment is the difference between the assets carrying value and present value of estimated future cash out�ows, discounted at the original effective interest rate.
Net gains and losses arising from changes in the fair value of �nancial assets carried 'at fair value through pro�t or loss - held for trading' are taken to the 'income statement'. Net gains and losses arising from changes in fair value of 'available for sale' �nancial assets are taken to the 'statement of comprehensive income' until these are derecognised or impaired. At this time, the cumulative gain or loss previously recognised directly in the 'statement of comprehensive income' is transferred to the 'income statement'.
Impairment of �nancial assets The carrying value of the Fund's assets are reviewed at each reporting date to determine whether there is any indication of impairment. If such an indication exists, the recoverable amount of such asset is estimated. An impairment loss is recognised whenever, the carrying amount of an asset exceeds its recoverable amount. Impairment losses are recognised in the 'income statement'.
3.2.5
Derecognition Financial assets are derecognised when the rights to receive cash �ows from the �nancial assets have expired or have been transferred and the Fund has transferred substantially all risks and rewards of ownership. Offsetting of �nancial assets and �nancial liabilities Financial assets and �nancial liabilities are offset and the net amount is reported in the 'statement of assets and liabilities' when there is a legally enforceable right to set off the recognised amounts and there is an intention to settle on a net basis, or realise the assets and settle the liabilities simultaneously.
3.2.6
3.2.7

Annual Report 2017 Page 30
NAFA INCOME OPPORTUNITY FUND
3.3
3.4
3.5
3.6
3.7
Spread transactions (ready-future transactions) The Fund enters into transactions involving purchase of an equity security in the ready market and simultaneous sale of the same security in the futures market. The security purchased in ready market is classi�ed as '�nancial assets at fair value through pro�t or loss - held for trading' and carried on the statement of assets and liabilities at fair value till their eventual disposal, with the resulting gain / loss taken to the income statement. The forward sale of the security in the futures market is treated as a separate derivative transaction and is carried at fair value with the resulting gain / loss taken to the income statement in accordance with the requirements of International Accounting Standard (IAS) 39 'Financial Instruments: Recognition and Measurement.' Securities under margin trading system Securities purchased under margin �nancing are included as 'receivable against Margin Trading System (MTS)' at the fair value of consideration given. All MTS transactions are accounted for on the settlement date. Income on MTS is calculated on outstanding balance at agreed rates and recorded in the income statement. Transaction costs are expensed in the income statement. Financial liabilities All �nancial liabilities are recognised at the time when the Fund becomes a party to the contractual provisions of the instrument. These are initially recognised at fair value and subsequently stated at amortised cost. Issuance and redemption of units Units issued are recorded at the offer price, determined by the Management Company for the applications received by the distributors during business hours on that date. The offer price represents the net asset value per unit as of the close of the business day plus the allowable sales load, provision for transaction costs and any provision for duties and charges, if applicable. Sales load collected, if any, is payable to the Management Company. Units redeemed are recorded at the redemption price, applicable to units for which the distributors receive redemption applications during business hours of that day. The redemption price represents the net asset value per unit as of the close of the business day less any back-end load, any duties, taxes, charges on redemption and any provision for transaction costs, if applicable.
Element of income / (loss) and capital gains / (losses) included in prices of units issued less those in units redeemed An equalisation account called the 'element of income / (loss) and capital gains / (losses) included in prices of units issued less those in units redeemed' is created, in order to prevent the dilution of per unit income and distribution of income already paid out on redemption.
Element of income / (loss) and capital gains / (losses) included in the prices of units issued less those in units redeemed is determined based on the income earned and on unrealised appreciation / (diminution) arising during an accounting year on available for sale securities. The element of income / (loss) and capital gains / (losses) included in the prices of units issued less those redeemed is apportioned between the income statement and the distribution statement in proportion of the relative change in net assets for the period of available for sale investments and other net assets.
-
-
-
-
Realised capital gains / (losses) arising on sale of investments are included in the 'income statement' on the date at which the transaction takes place. Unrealised capital gains / (losses) arising on re-measurement of investments classi�ed as �nancial assets 'at fair value through pro�t or loss' are included in the income statement in the period in which they arise. Mark-up / return on bank balances and term deposits, term �nance certi�cates and sukuks, government securities, letter of placement and commercial papers are recognised on a time apportionment basis using the effective interest method. Income on transactions under margin trading system is recognised on an accrual basis.
3.8
3.9
Provisions Provisions are recognised when the Fund has a present, legal or constructive, obligation as a result of past events, it is probable that an out�ow of resources embodying economic bene�ts will be required to settle the obligation and a reliable estimate of the obligation can be made. Provisions are regularly reviewed and adjusted to re�ect the current best estimate. Revenue recognition

Annual Report 2017 Page 31
NAFA INCOME OPPORTUNITY FUND
3.10
3.11
3.12
Taxation The income of the Fund is exempt from income tax under clause 99 of Part I of the Second Schedule to the Income Tax Ordinance, 2001 subject to the condition that not less than ninety percent of its accounting income for the year, as reduced by capital gains, whether realised or unrealised, is distributed amongst the unit holders (excluding distribution made by issuance of bonus units). The Fund is also exempt from the provisions of section 113 (minimum tax) under clause 11A of Part IV of the Second Schedule to the Income Tax Ordinance, 2001. Proposed distributions Distributions declared subsequent to the year end are considered as non-adjusting events and are recognised in the �nancial statements of the period in which such distributions are declared. Earnings per unit Earnings per unit (EPU) has not been disclosed as in the opinion of the management, determination of weighted average units for calculating EPU is not practicable.
4
4.1
4.2
4.3
4.4
BALANCES WITH BANKS
Current accountsSaving accountsTerm deposits
These saving accounts carry mark-up at the rates ranging from 4.5% to 10.25% per annum (2016: 4.5% to 9% per annum). These represent short-term deposits having original maturity of less than three months. These carry mark-up rate of Nil (2016: 7.35% to11.10% per annum) This includes impact of cheques amounting to Rs. 25.6 million issued on account of redemption of units and cheques amounting toRs. 59.97 million received on account of issuance of units as at year end.
4.14.2
14,609 2,159,597
- 2,174,206
17,8665,989,5251,104,926
7,112,317
2017Notes------(Rupees in '000)------
2016
Cash and cash equivalents Current accounts Saving accounts Term deposits - with original maturity of less than three months
14,609 2,159,597 1,100,000 3,274,206
17,8665,989,525
1,104,926 7,112,317
2017------(Rupees in '000)------
2016

Annual Report 2017 Page 32
NAFA INCOME OPPORTUNITY FUND
5 INVESTMENTS
At fair value through pro�t or loss - held for trading Equity securities - listed Equity securities - listed (spread transactions) Government securities Term �nance certi�cates - listed Term �nance certi�cates - unlisted Sukuks Available for sale Equity securities - listed Term �nance certi�cates - listed Term �nance certi�cates - unlisted Sukuks Loans and receivables Term deposits Commercial paper
5.15.25.35.45.55.6
5.75.85.9
5.10
5.125.13
- -
282,911 167,128 449,941
- 899,980
36,281 - - -
36,281
1,100,000 195,252
1,295,252 2,231,513
- -
350,875 165,861 160,014 215,174 891,924
34,704 - - -
34,704
800,000 -
800,000 1,726,628
2017Notes------(Rupees in '000)------
2016
5.1 Equity securities - listed at fair value through pro�t or loss - held for trading
5.2 Equity securities - listed (spread transactions) at fair value through pro�t or loss - held for trading
The movement in equity securities represent spread transactions entered into by the Fund. The Fund purchases equity securities in ready market and sells them in future market on the same day, resulting in spread income due to difference in ready and future stock prices. This way the Fund has no open exposure to the stock market.
As a t July 1, 2 0 16
Purc ha sed during the ye a r
Bonus / Right
sha re s
Sold during
the ye a r
As a t June 3 0 ,
2 0 17
Ne t a sse ts
Ma rke t va lueof tota l
inve stme nts
Pa id- up c a pita l of the
inve ste e c ompa ny
All shares have a nominal face value of Rs 10 each.
P ER SON A L GOOD S
Azgard Nine Limited - Non- voting 3 0 8 - - - 3 0 8 - - - -
Ca rrying va lue be fore ma rk to ma rke t a s a t June 3 0 , 2 0 17 13
Ac c umula te d impa irme nt 13
Inve stme nt a s a pe rc e nta ge ofNumbe r of sha re s
Na me of the inve ste e c ompa ny
Ma rke t va lue a s a t June
3 0 , 2 0 17
Rs in '0 0 0
- - - - - - - - - - - - - - - - - - - - - % - - - - - - - - - - - - - - - - - - - - -- - - - - - - - - - - - - - - - - - - - - Numbe r of sha re s - - - - - - - - - - - - - - - - - - - - -
A s atJuly 1, 2016
P urchased during the
year
So ldduring the
year
A s atJune 30,
2017
M arket va lueo f to ta l
investments
P aid-up capita l o f the
investee co mpany
R s in '000
A ll shares have a no minal face va lue o f R s . 10 each except fo r K-Electric Limited which have a face va lue o f R s . 3 each.
C EM EN TD.G Khan Cement Company Limited - 4,575,500 4,575,500 - - - - - M aple Leaf Cement Factory Limited - 6,812,500 6,812,500 - - - - - P ioneer Cement Limited - 3,362,000 3,362,000 - - - - - Fauji Cement Company Limited - 232,000 232,000 - - - - -
C OM M ER C IA L B A N KSUnited Bank Limited - 64,500 64,500 - - - - - Bank Al Falah Limited - 1,217,000 1,217,000 - - - - - Askari Bank Limited - 9,679,500 9,679,500 - - - - - Bank Al Habib Limited - 500 500 - - - - - Faysal Bank Limited - 280,000 280,000 - - - - - Habib Bank Limited - 172,500 172,500 - - - - - M uslim Commercial Bank Limited - 611,000 611,000 - - - - -
N etassets
N ame o f the investee co mpany
M arket va lue as
atJune 30,
2017
Investment as a percentage o fN umber o f shares
------------------------------- % -------------------------------- - - - - - - - - - - - - - - - - - - - - N umber o f shares - - - - - - - - - - - - - - - - - - - - -

Annual Report 2017 Page 33
NAFA INCOME OPPORTUNITY FUND
5.3 Government Securities at fair value through pro�t or loss - held for trading
Market Treasury Bills January 8, 2015 September 3, 2015 January 21, 2016 May 12, 2016 July 11, 2016 August 18, 2016 September 1, 2016 October 27, 2016 November 10, 2016 February 2, 2017 March 17, 2016 April 13, 2017 April 27, 2017 June 22, 2017 Pakistan investment bonds July 22, 2010 March 26, 2015 Carrying value before mark to market as at June 30, 2017
12 Months12 Months6 Months3 Months3 Months6 Months3 Months3 Months3 Months
12 Months12 Months12 Months3 Months
10 Years03 Years
75,000 - - - - - - - - - - - -
100,000 150,000
- 70,000
250,000 125,000
75,000 320,000 250,000 320,000 320,000
4,402,000 170,000
1,500,000 170,000
- -
75,000 70,000
250,000 125,000
75,000 320,000 250,000 320,000 320,000
4,402,000 170,000
1,500,000 -
- 150,000
- - - - - - - - - - - -
170,000
100,000 -
- - - - - - - - - - - -
167,906
115,005 -
282,911
287,872
- - - - - - - - - - - -
2.05%
1.40% -
- - - - - - - - - - - -
7.52%
5.15% -
A s atJuly 1, 2016
P urchased during the
year
So ldduring the
year
A s atJune 30,
2017
M arket va lueo f to ta l
investments
P aid-up capita l o f the
investee co mpany
R s in '000
N etassets
N ame o f the investee co mpany
M arket va lue as
atJune 30,
2017
Investment as a percentage o fN umber o f shares
------------------------------- % -------------------------------- - - - - - - - - - - - - - - - - - - - - N umber o f shares - - - - - - - - - - - - - - - - - - - - -F ER T ILIZ EREngro Fertilizers Limited - 15,264,000 15,264,000 - - - - - Engro Corporation Limited - 5,653,500 5,653,500 - - - - - Fauji Fertilizer Company Limited - 10,220,000 10,220,000 - - - - - Fauji Fertilizer Bin Qasim Limited - 8,031,000 8,031,000 - - - - - Fatima Fertilizer Limited - 4,493,500 4,493,500 - - - - -
P OWER GEN ER A T ION A N D D IST R IB UT IONHub Power Company Limited - 153,500 153,500 - - - - - K-Electric Limited - 47,012,000 47,012,000 - - - - -
OIL A N D GA S EXP LOR A T ION C OM P A N IESOil and Gas Development Company Limited - 6,752,500 6,752,500 - - - - - Pakistan Petroleum Limited - 255,000 255,000 - - - - - Pakistan Oil�elds Limited - 271,500 271,500 - - - - -
OIL A N D GA S EXP LOR A T ION C OM P A N IESHascol Petro leum Limited - 1,500 1,500 - - - - - Pakistan State Oil Company Limited - 2,488,000 2,488,000 - - - - - Sui Northern Gas Pipelines Limited - 128,000 128,000 - - - - - Sui Southern Gas Company Limited - 212,500 212,500 - - - - -
P ER SON A L GOOD S (T EXT ILE)Nishat M ills Limited - 5,203,000 5,203,000 - - - - - Nishat (Chunian) Limited - 9,095,500 9,095,500 - - - - -
C A B LE & ELEC T R IC A L GOOD SPak Elektron Limited - 19,702,500 19,702,500 - - - - -
F OOD & P ER SON A L C A R E P R OD UC T SEngro Foods Limited - 5,083,000 5,083,000 - - - - -
P H A R M A C EUT IC A LSThe Searle Company Limited - 500 500 - - - - -
R EF IN ER YAttock Re�nery Limited - 3,768,000 3,768,000 - - - - -
T EC H N OLOGY A N D C OM M UN IC A T IONPakistan Telecommunication Limited - 4,354,000 4,354,000 - - - - -
-
Ca rrying va lue be fore ma rk to ma rke t a s a t June 3 0 , 2 0 17 -
As atJuly 1,2016
Purchasedduring the
year
Sold /matured
during theyear
As at June 30,
2017
Netassets
Issue Date Tenor
Face value Market value
as at June 30,
2017
Investment as a percentage of
Marketvalue of totalinvestments
------------------------------------------------------Rupees in '000-------------------------------------------------------------------------------- % ---------------------

Annual Report 2017 Page 34
NAFA INCOME OPPORTUNITY FUND
5.3.1
5.3.2
5.3.3
5.4
The effective yield on market treasury bills is 5.84% per annum (June 30, 2016: 5.91% per annum). These Pakistan investment bonds carry coupon interest at the rates of 12.00% per annum. Investments include treasury bills with market value of Rs. 167.906 million (June 30, 2016: 74.246 million) which have been pledged with National Clearing Company of Pakistan Limited for guaranteeing settlement of the Fund's trades in accordance with circular no. 11 dated October 23, 2007 issued by SECP. Term �nance certi�cates - listed at fair value through pro�t or loss - held for trading
All term �nance certi�cates have a face value of Rs. 5,000 each unless stated otherwise. Bank Alfalah Limited - V Pace (Pakistan) Limited (note 5.4.1) Saudi Pak Leasing Company Limited (note 5.4.2) Carrying value before mark to market as at June 30, 2017 Accumulated impairment
32,550 30,000 15,000
- - -
- - -
32,550 30,000 15,000
167,128 - -
167,128
356,935
191,141
2.04% - -
7.49% - -
3.26%10.00%10.00%
All term �nance certi�cates have a face value of Rs 5,000 each unless stated otherwise. JS Bank Limited (December 14, 2016) Jahangir Siddiqui and Company Limited (April 08, 2014) Jahangir Siddiqui and Company Limited (June 24, 2016) Carrying value before mark to market as at June 30, 2017
- 15,000 20,000
60,000 - -
- - -
60,000 15,000 20,000
302,141 45,212
102,588
449,941
444,954
3.95%0.59%1.25%
17.89%2.68%4.60%
10.00%10.00%10.00%
As a tJuly 1,2 0 15
Purc ha se dduring the
ye a r
Sold /ma ture d
during theye a r
As a t June 3 0 ,
2 0 16
Ne ta sse ts
Rs in '0 0 0
Ma rke t va lue
a s a t June 3 0 ,
2 0 16
Inve stme nt a s a pe rc e nta ge of
Ma rke t Issuesizeva lue of tota l
inve stme nts
- - - - - - - - - - - - - - - - - - - - - - - - - - - - - - - - - - - - - - - - - - - - - - - - - - - - - - Rupe e s in '0 0 0 - - - - - - - - - - - - - - - - - - - - - - - - - - - - - - - - - - - - - - - - - - - - - - - - - - - - - -- - - - - - - - - - - - - - - - - - - - - - - - - - % - - - - - - - - - - - - - - -- - - - - - - - - -
Name of the investee company
Number of certi�cates
5.5 Term �nance certi�cates - unlisted at fair value through pro�t or loss - held for trading
5.4.1
5.4.2
This represents investment in listed term �nance certi�cates with a term of �ve years. The investee company had defaulted on its obligation on account of principal and pro�t payment and accordingly has been classi�ed as a non performing asset by Mutual Funds Association of Pakistan (MUFAP) since September 5, 2011. The amount of provision as per circular no. 1 of 2009 and circular no. 33 of 2012 has been maintained by valuing the investment in terms of the said circulars. This represents investment in term �nance certi�cates with original term of nine years. On October 13, 2011 the investee company defaulted on its obligation on account of principal and pro�t payment. The investee company rescheduled its term on December 26, 2011 with a new maturity in March 2017. The said term �nance certi�cates complied with repayment terms since it was rescheduled and had been reclassi�ed as performing as per criteria de�ned in circular no. 1 of 2009. However, the investee company again defaulted on its obligation on account of principal and pro�t payment for the month of April 2014 and was therefore declared as non performing asset by MUFAP since April 30, 2014. The amount of provision as per circular no. 1 of 2009 and circular no. 33 of 2012 has been maintained by valuing the investment in terms of the said circulars.
5.4.3 Other particulars of term �nance certi�cates - listed outstanding as at June 30, 2017 are as follows:
Bank Alfalah Limited - V Pace (Pakistan) Limited Saudi Pak Leasing Company Limited
4,994 4,994 2,755
6 months KIBOR offer rate + 1.25% 6 months KIBOR offer rate + 2.00%
6.87% �xed rate
20-Feb-1315-Feb-0813-Mar-08
20-Feb-2115-Feb-1713-Mar-17
AA-Not ratedNot rated
Name of the investee company Mark-up rate per annumFace value(unredeemed)
Rating Issue date Maturity date
As atJuly 1,2016
Purchasedduring the
year
Sold /matured
during theyear
As atJune 30,
2017
Netassets
Market value of totalinvestments
Issuesize
Rs in '000---------------------------- % ----------------------------
Market valueas at
June 30, 2017
Investment as a percentage of
Name of the investee company
Number of certi�cates

Annual Report 2017 Page 35
NAFA INCOME OPPORTUNITY FUND
5.7.1 On April 12, 2012, a share transfer and debt swap agreement was entered into between the Financial Institutions and Azgard Nine Limited (the issuer), whereby the issuer agreed to transfer its entire holding in Agritech Limited to the existing lenders / creditors, including the Term Finance Certi�cate (TFC) holders at the agreed settlement price, in partial settlement of the outstanding principal / redemption obligations. As part of the above arrangement, the Fund settled its investment in TFC of Azgard Nine Limited amounted to Rs. 141,403,150 in consideration of 4,040,090 ordinary shares at the value of Rs. 35 per share of Agritech Limited against the partial settlement of its outstanding exposure. The fair value of an ordinary share was Rs. 12.30 at transaction date i.e. October 31, 2012. Accordingly, the same have been recorded at fair value and the resultant effect recorded through income statement as recovery on partial settlement of investment. As per the terms of the Share Transfer and Debt Swap Agreement, Agritech Limited shares shall be held by the respective trustees for the TFC issues in their name for and on behalf of the TFC holders who shall be the bene�cial owners of the subjected shares in proportion to their holdings. Accordingly, the trustees for the TFC issue pursuant to shareholders investors agreement hold the said ordinary shares for and on behalf of TFC holders for a period of �ve years from the date of transfer. During the lock in period of �ve years, shares can be sold to an outside buyer subject to a prior written approval of the investors, however, no such approval is required for inter �nancier sale.
All term �nance certi�cates have a face value of Rs. 5,000 each unless stated otherwise. K-Electric Azm Sukuk 43,120 43,120 - - - - - -
As a tJuly 1,2 0 16
Purc ha se dduring the
ye a r
Sold /ma ture d
during theye a r
As a t June 3 0 ,
2 0 17
Ne ta sse ts
Rs in '0 0 0
Ma rke t va lue
a s a t June 3 0 ,
2 0 17
Inve stme nt a s a pe rc e nta ge of
Ma rke t Issuesizeva lue of tota l
inve stme nts
- - - - - - - - - - - - - - - - - - - - - - - - - - - - - - - - - - - - - - - - - - - - - - - - - - - - - - Rupe e s in '0 0 0 - - - - - - - - - - - - - - - - - - - - - - - - - - - - - - - - - - - - - - - - - - - - - - - - - - - - - -- - - - - - - - - - - - - - - - - - - - - - - - - - % - - - - - - - - - - - - - - -- - - - - - - - - -
Name of the investee company
Number of certi�cates
5.6 Sukuks - at fair value through pro�t or loss - held for trading
Worldcall Telecom Limited (note 5.8.1) Carrying value as at June 30, 2017 Accumulated impairment
45,000 - - 45,000
- -
88,456
88,456
- - 5.63%
As a tJuly 1,2 0 16
Purc ha se dduring the
ye a r
Sold /ma ture d
during theye a r
As a t June 3 0 ,
2 0 17
Ne ta sse ts
Rs in '0 0 0
Ma rke t va lue
a s a t June 3 0 ,
2 0 17
Inve stme nt a s a pe rc e nta ge of
Ma rke t Issuesizeva lue of tota l
inve stme nts
- - - - - - - - - - - - - - - - - - - - - - - - - - - - - - - - - - - - - - - - - - - - - - - - - - - - - - Rupe e s in '0 0 0 - - - - - - - - - - - - - - - - - - - - - - - - - - - - - - - - - - - - - - - - - - - - - - - - - - - - - -- - - - - - - - - - - - - - - - - - - - - - - - - - % - - - - - - - - - - - - - - -- - - - - - - - - -
Name of the investee company
Number of certi�cates
5.8 Term �nance certi�cate - listed - available for sale
All shares have a nominal face value of Rs. 10 each. CHEMICALS Agritech Limited (note 5.7.1) Carrying value before mark to market as at June 30, 2017 Accumulated impairment
4,040,090
-
-
4,040,090
36,281
34,704
18,584
0.44% 1.63% 1.03%
As a tJuly 1,2 0 16
Purc ha se dduring the
ye a r
Sold /ma ture d
during theye a r
As a t June 3 0 ,
2 0 17
Ne ta sse ts
Rs in '0 0 0
Ma rke t va lue
a s a t June 3 0 ,
2 0 17
Inve stme nt a s a pe rc e nta ge of
Ma rke t Paid-upcapital of investeecompany
va lue of tota linve stme nts
- - - - - - - - - - - - - - - - - - - - - - - - - - - - - - - - - - - - - - - - - - - - - - - - - - - - - - Rupe e s in '0 0 0 - - - - - - - - - - - - - - - - - - - - - - - - - - - - - - - - - - - - - - - - - - - - - - - - - - - - - -- - - - - - - - - - - - - - - - - - - - - - - - - - % - - - - - - - - - - - - - - -- - - - - - - - - -
Name of the investee company
Number of shares
5.7 Equity securities - listed - available for sale
5.5.1 Other particulars of term �nance certi�cates - unlisted outstanding as at June 30, 2017 are as follows:
JS Bank Limited (December 14, 2016) 4,999 A+ 14-Dec-16 14-Dec-23Jahangir Siddiqui and Company Limited (April 08, 2014) 3,000 AA+ 8-Apr-14 8-Apr-19Jahangir Siddiqui and Company Limited (June 24, 2016) 5,000 AA+ 24-Jun-16 24-Jun-21
6 months KIBOR offer rate + 1.75%
RatingMark-up rate per annum Issue date Maturity date
6 months KIBOR offer rate + 1.4%
Name of the investee company Face value (unredeemed)
6 months KIBOR offer rate + 1.65%

Annual Report 2017 Page 36
NAFA INCOME OPPORTUNITY FUND
5.8.1
5.8.2
This represents investment in listed term �nance certi�cates with a term of 5 years. On April 07, 2012, the investee company defaulted on its obligation on account of principal and pro�t payment and accordingly has been classi�ed as a non performing asset by MUFAP since November 8, 2012. The amount of provision required as per SECP circular no. 1 of 2009 and circular no. 33 of 2012 has been maintained by valuing the investment in terms of the said circulars. Other particulars of term �nance certi�cate - listed outstanding as at June 30, 2017 are as follows:
Azgard Nine Limited III (note 5.9.1) Azgard Nine Limited V (note 5.9.1) Dewan Cement Limited (note 5.9.2) New Allied Electronics Industries (Private) Limited (note 5.9.3) Agritech Limited I (note 5.9.4) Agritech Limited V (note 5.9.5) Carrying value as at June 30, 2017 Accumulated impairment
50,000 16,436 30,000 15,000 30,000 6,464
- - - - - -
- - - - - -
50,000 16,436 30,000 15,000 30,000
6,464
- - - - - -
-
554,444
554,444
- - - - - -
- - - - - -
10.00%2.35%7.50%8.33%
10.00%10.00%
As a tJuly 1,2 0 16
Purc ha se dduring the
ye a r
Sold /ma ture d
during theye a r
As a t June 3 0 ,
2 0 17
Ne ta sse ts
Rs in '0 0 0
Ma rke t va lue
a s a t June 3 0 ,
2 0 17
Inve stme nt a s a pe rc e nta ge of
Ma rke t Issuesizeva lue of tota l
inve stme nts
- - - - - - - - - - - - - - - - - - - - - - - - - - - - - - - - - - - - - - - - - - - - - - - - - - - - - - Rupe e s in '0 0 0 - - - - - - - - - - - - - - - - - - - - - - - - - - - - - - - - - - - - - - - - - - - - - - - - - - - - - -- - - - - - - - - - - - - - - - - - - - - - - - - - % - - - - - - - - - - - - - - -- - - - - - - - - -
Name of the investee company
Number of certi�cates
5.9 Term �nance certi�cate - unlisted - Available for sale
5.9.1
5.9.2
5.9.3
5.9.4
5.9.5
5.9.6
These zero coupon privately placed term �nance certi�cates were issued against the interest receivable on TFCs of Azgard Nine Limited (disclosed in note 5.9.1) under an agreement dated June 28, 2012 between the Management Company of the Fund and Azgard Nine Limited. These privately placed term �nance certi�cates were issued against non performing securities, therefore the management, as a matter of prudence has recognized these at nil value. MUFAP classi�ed these as non-performing since June 21, 2010 and December 7, 2012 respectively. The amount of provision as per circular no. 1 of 2009 and circular no. 33 of 2012 has been maintained by valuing the investment in terms of the said circulars. The Fund had advanced an amount of Rs. 150 million in respect of Pre-IPO placement of Dewan Cement Limited (DCL) under an agreement, which required public offering to be completed within 270 days of the date of agreement (which was 09 January 2008). DCL failed to complete the public offering within the said time period and has also defaulted in payment of principal and pro�t. The amount of provision as per circular no. 1 of 2009 and circular no. 33 of 2012 has been maintained by valuing the investment in terms of the said circulars. These represent investments in privately placed term �nance certi�cates (term: 4 years) and sukuks (term: 5 years) of the investee company. The investee company had defaulted on its obligation on account of principal and pro�t payment and accordingly had been classi�ed as non performing asset by MUFAP since January 9, 2009. The amount of provision as per circular no. 1 of 2009 and circular no. 33 of 2012 has been maintained by valuing the investment in terms of the said circulars. This represents investment in listed term �nance certi�cates with a term of seven years. On May 30, 2010, Agritech Limited defaulted in payment of principal and mark-up due and accordingly has been classi�ed as non performing asset by MUFAP since June 14, 2010. The amount of provision as per circular no. 1 of 2009 and circular no. 33 of 2012 has been maintained by valuing the investment in terms of the said circulars. This represents investment in privately placed term �nance certi�cates of Agritech V received against due markup of Agritech I. MUFAP classi�ed these as non-performing on January 17, 2012. The amount of provision as per circular no. 1 of 2009 and circular no. 33 of 2012 has been maintained by valuing the investment in terms of the said circulars. Other particulars of term �nance certi�cate - unlisted outstanding as at June 30, 2017 are as follows:
Azgard Nine Limited III 2,168 Not rated
4-Dec-07 4-Dec-14
Azgard Nine Limited V 5,000Not
rated31-Mar-12 31-Mar-17
Dewan Cement Limited 5,000 Not rated
14-Jan-08 14-Jan-14
New Allied Electronics Industries (Private) Limited 2,114 Not rated
15-May-07 15-May-11
Agritech Limited I 4,995 Not rated
29-Nov-07 29-Nov-14
Agritech Limited V 5,000 Not rated
28-Oct-11 28-Apr-17
6 months KIBOR offer rate + 2%
Rating Issue date Maturity dateMark-up rate per annum
6 months KIBOR offer rate + 2.25%
Face value (unredeemed)
Name of the investee company
6 months KIBOR offer rate + 1.75%
11% �xed rate
-
3 months KIBOR offer rate + 3%
Other particulars of term �nance certi�cates - unlisted outstanding as at June 30, 2017 are as follows:
Worldcall Telecom Limited 1,966Not
rated7-Oct-08 7-Oct-13
RatingFace value
(unredeemed)Name of the investee company Issue date Maturity dateMark-up rate per annum
6 months KIBOR offer rate + 1.6%

Annual Report 2017 Page 37
NAFA INCOME OPPORTUNITY FUND
5.13
5.14
Net unrealised gain / (loss) on re-measurement of investments at fair value through pro�t or loss - held for trading Market value of investments Less: Carrying value of investments Provision against investments Net unrealised gain / (loss) on re-measurement of investments classi�ed as available for sale Market value of investments Less: Carrying value of investments Provision against investments
5.1, 5.2, 5.3, 5.4, 5.5, 5.6 & 5.75.1, 5.2, 5.3, 5.4, 5.5, 5.6 & 5.7
5.15
5.7, 5.8, 5.9 & 5.105.7, 5.8, 5.9 & 5.10
5.15
899,980 (1,089,761)
(189,781) 191,141
1,342
36,281 (763,586)
(727,305) 728,881
1,576
891,924 (1,068,127)
(176,203) 191,141
14,938
34,704 (772,360)
(737,656) 741,251
3,595
2017Notes------(Rupees in '000)------
2016
New Allied Electronics Industries (Private) Limited (note 5.9.3) Eden Housing Limited (note 5.10.1) BRR Guardian Modaraba (note 5.10.2) Carrying value as at June 30, 2017 Accumulated impairment
9,000 9,200
10,000
- - -
- - -
9,000 9,200
10,000
- - - -
67,398
67,398
0.00%0.00%0.00%
0.00%0.00%0.00%
6.00%2.30%6.25%
As a tJuly 1,2 0 16
Purc ha se dduring the
ye a r
Sold /ma ture d
during theye a r
As a t June 3 0 ,
2 0 17
Ne ta sse ts
Rs in '0 0 0
Ma rke t va lue
a s a t June 3 0 ,
2 0 17
Inve stme nt a s a pe rc e nta ge of
Ma rke t Issuesizeva lue of tota l
inve stme nts
- - - - - - - - - - - - - - - - - - - - - - - - - - - - - - - - - - - - - - - - - - - - - - - - - - - - - - Rupe e s in '0 0 0 - - - - - - - - - - - - - - - - - - - - - - - - - - - - - - - - - - - - - - - - - - - - - - - - - - - - - -- - - - - - - - - - - - - - - - - - - - - - - - - - % - - - - - - - - - - - - - - -- - - - - - - - - -
Name of the investee company
Number of certi�cates
5.10 Sukuks - available for sale
5.10.1
5.10.2
5.10.3
This represents investment in privately placed sukuks with a term of �ve years. The investee company had defaulted on its obligation on account of principal and pro�t payment and accordingly has been classi�ed as non performing asset by MUFAP since January 9, 2009. The amount of provision as per circular no. 1 of 2009 and circular no. 33 of 2012 has been maintained by valuing the investment in terms of the said circulars. This represents investment in privately placed sukuks. The investee company had defaulted on its obligation on account of principal and pro�t payment and accordingly has been classi�ed as non performing asset by MUFAP since January 26, 2015. The investment has been fully provided. The amount of provision as per circular no 1 of 2009 and circular 33 of 2012 has been maintained by valuing the investment in terms of the said circular.
Other particulars of sukuks - available for sale outstanding as at June 30, 2017 are as follows:
5.11
5.12
5.13
The term �nance certi�cates and sukuks held by the Fund are generally secured against hypothecation of stocks and receivables and mortgage / pledge of �xed assets of the investee company. These represents long term deposits having original maturity period of more than three months. These carry mark-up rate of 8.35% per annum. This carries return of 7.92% per annum (June 30, 2016: Nil).
New Allied Electronics Industries (Private) Limited Not rated
3-Dec-07 3-Dec-12
Eden Housing Limited Not rated
29-Mar-08 29-Sep-15
BRR Guardian Modaraba Not rated
7-Jun-08 7-Dec-16
984
1,419 1 month KIBOR offer rate
6 months KIBOR offer rate + 2.2%
6 months KIBOR offer rate + 2.5%
RatingName of the investee companyFace value
(unredeemed)
4,905
Issue date Maturity dateMark-up rate per annum

Annual Report 2017 Page 38
NAFA INCOME OPPORTUNITY FUND
5.15
5.16
Details of provision against investments Provisions related to investments classi�ed as "fair value through pro�t or loss - held for trading" Provisions related to investments classi�ed as "available for sale" Movement in provision against non performing investments Opening balance Add: Charge for the year Less: Reversal of provision due to recovery Closing balance
191,141
728,881
920,022
932,392 -
(12,370)
920,022
191,141
741,251
932,392
978,239 -
(45,847)
932,392
2017------(Rupees in '000)------
2016
7.
8.
MARK-UP ACCRUED Mark-up accrued on bank balances and term deposits Mark-up accrued on margin trading system Dividend receivable on spread transactions Mark-up accrued on: - Term �nance certi�cate and sukuks - Pakistan Investment Bonds Less: Income suspended over non-performing debt securities Less: Provision against accrued mark-up DEPOSITS, PREPAYMENTS AND OTHER RECEIVABLES Receivable against transfer of units Security deposits with: - Central Depository Company of Pakistan Limited - National Clearing Company of Pakistan Limited Advance tax Prepayments Receivable from NCCPL against exposure margin for RFS Receivable from KASB Bank Limited (now BankIslami Pakistan Limited)
8.2
8.1
18,354 363
26,295
611,625 5,260
(605,288) 11,597
-
56,609
16,942
100 2,750 2,850 6,572
174 592,577
-
619,115
81,529412 -
562,3388,813
(555,142) 16,009
(31,871)
66,079
760
100 17,750 17,850
2,539 171
- 463,225
484,545
2017Notes------(Rupees in '000)------
2016
6.
6.1
RECEIVABLE AGAINST MARGIN TRADING SYSTEM This carries average mark-up rate of 9.61% (June 30, 2016: 8.63%) and are matured at the option of �nancee subject to maximum period of 60 days.
This represents amount receivable from other collective investment scheme being managed by the Management Company of the Fund. This amount is receivable in respect of units issued to various unit holders based on their request for transfer of units from other collective investment scheme to the Fund. This represented receivable of Rs. 463.225 million on account of deposit maintained with KASB Bank Limited (now BankIslami Pakistan Limited) (""the Bank"").

Annual Report 2017 Page 39
NAFA INCOME OPPORTUNITY FUND
9 PAYABLE TO THE NBP FULLERTON MANAGEMENT LIMITED - MANAGEMENT COMPANY Remuneration of the Management Company Sindh Sales Tax on remuneration of the Management Company Operational expenses Sales load Sindh Sales Tax and Federal Excise Duty on sales load
9.19.29.3
8,475 1,102
12,541 336
1,602
24,056
9,6791,5705,986
7261,664
19,625
2017Notes(Rupees in '000)
2016
The Fund claimed pro�t at the rate of thirteen percent on its Mahana Khazana account maintained with the Bank, since June 23, 2008 till February 10, 2011. Whereas, the Bank did not credit / pay the due mark up at agreed rate, as the Bank did not get expected pro�t on its investment in units of the Fund for the same period. Based on said presumption, the Bank credited pro�t at the rate of �ve percent per annum, whereas, no guarantee / commitment was given to the Bank by the Fund in respect of rate of return. The Fund, on a prudent basis, accrued the mark up for the said period at eight percent per annum, a minimum rate which the Bank offered to all its corporate customers. Subsequently, the management has been engaged in continuous efforts for recovery of pro�t at the rate of thirteen percent and had several meeting with the of�cials of the Bank.
On February 10, 2011, the Fund requested the Bank to withdraw its entire deposit. The Bank also �led for the redemption of its entire investment in the Fund on the same date. The Bank declined to honor the Fund’s withdrawal request linking it with paying its redemption amount before releasing the Fund’s deposit. On April 1, 2011, the Bank unilaterally set off the redemption value of the Bank’s investment in the Fund with the Fund’s deposit with the Bank and credited the principal of Rs. 187.008 million plus pro�t of Rs. 24.64 million at the rate of around �ve percent after making an adjustment of Rs. 463.225 million on account of redemption of its units which includes contingent load of Rs. 23.161 million. The Fund accepted the amount under protest, being part payment of total amount receivable and referred this case to the Banking Mohtasib Pakistan for resolution while claiming pro�t at the rate of thirteen percent. The management, at parallel, continued its negotiation with the Bank through the Trustee. The Trustee informed the Fund that the Bank offered the rate of seven percent from retrospective affect to settle the transaction. The Trustee advised the management to meet with Bank of�cials once again on this issue and try to recover the pro�t at a better rate. The Management Company �led a recovery suit against the Bank in the High Court of Sindh (the Court).
The Securities and Exchange Commission of Pakistan (SECP) vide its Order dated August 12, 2011 under Section 282J (1) and 282J (2) of the Companies Ordinance, 1984, required the Management Company to make the loss of Rs.19 million good to the Fund’s unit holders in addition to a penalty of Rs. 1 million.
The Management Company led an appeal with the Appellate Bench of SECP on August 26, 2011.The bench vide its Order dated November 11, 2015 disposed of the said appeal and directed SECP to determine the timelines for compliance of the said order. On June 20, 2016, SECP directed the Management Company to provide the current status regarding the indemni�cation of Rs. 19 million from the Management Company to the Fund through management fee for implementation of the above order. The Management Company adjusted provision against accrued mark-up amounting to Rs. 19 million from management fee payable to the Management Company by the Fund. Further, the Management Company has fully provided the accrued mark-up amounting to Rs. 31.871 million last year.
During the year, the Bank entered into settlement agreement with the Management Company and Trustee of the Fund, whereby, it has been agreed to �le with the Court joint compromise application for settlement and disposal of the recovery suit �led by the Management Company against the Bank. Accordingly, the Bank has settled outstanding obligation in full and �nal by making payment of Rs. 35 million to the Fund, out of which, Rs. 19 million have been paid back to the Management Company, which have earlier been adjusted from accrued mark-up and remaining Rs. 16 million have been recognised in the income statement as reversal of provision against accrued mark-up. Further, liability of the Fund amounting to Rs. 440.064 million and Rs. 23.161 million on account of redemption of units made by the Bank and contingent load on redemption of units by the Bank has been adjusted with the amount receivable from the Bank amounting to Rs. 463.225 million.
9.1 Under the provisions of the NBFC Regulations, the Management Company of the Fund was entitled to a remuneration during the �rst �ve years of the Fund, of an amount not exceeding three percent of the average annual net assets of the Fund and thereafter of an amount equal to two percent of such assets provided that Management Company may charge performance based or �xed fee or a combination of both which shall not exceed the limit prescribed in the NBFC Regulations and such fee structure shall be disclosed in the offering document.
On November 25, 2015, SECP had made certain amendments in the NBFC Regulations through S.R.O 1160(1)/2015. As per the provision of amended NBFC Regulations, the applicable rate has been changed from 2% to 1.5%.
The Management Company has charged management remuneration at the rate of 1.5% per annum untill December 06, 2015. Thereafter from December 07, 2015, the Management Company has charged manangement remuneration at the rate of 1.3% per annum. Presently, from May 02, 2017 the Management Company has been charging management remuneration at the rate of 1% per annum.

Annual Report 2017 Page 40
NAFA INCOME OPPORTUNITY FUND
10 PAYABLE TO THE CENTRAL DEPOSITORY COMPANY OF PAKISTAN LIMITED - TRUSTEE Remuneration of the trustee Sindh Sales Tax on remuneration of the trustee
10.110.2
1,690 220
1,910
650 91
741
2017Notes(Rupees in '000)
2016
Net Assets
Upto Rs 1,000 million
On an amount Rs 1,000 million to 5,000 million
On an amount exceeding Rs 5,000 million
0.17% of net asset value
Rs 1.7 million plus 0.085% p.a. of net asset value exceeding Rs 1,000 million.
Rs 5.1 million plus 0.07% p.a. of net asset value exceeding Rs 5,000 million.
Tariff per annum
9.2
9.3
This represents amount payable in respect of Sindh Sales Tax at the rate of 13% (June 30, 2016: 14%) on the services provided by the Management Company as required by the Sindh Sales Tax on Services Act, 2011. This represents reimbursement of certain expenses to the Management Company. As per regulation 60(3)(s) of the NBFC Regulations, fee and expense pertaining to registrar services, accounting, operation and valuation services related to a Collective Investment Scheme (CIS) are chargeable to the scheme, maximum up to 0.1% of the average annual net assets or the actual cost whichever is lower. Accordingly, the Management Company has charged 0.1% of the average annual net assets, being lower amount, to the Fund.
10.1 The Trustee is entitled to a monthly remuneration for services rendered to the Fund under the provisions of the Trust Deed as per the tariff speci�ed therein, based on the daily net assets of the Fund. The remuneration is payable to the Trustee monthly in arrears. Tariff structure applicable to the Fund as at June 30, 2017 is as follows:
10.2 This represents amount payable in respect of Sindh Sales Tax at the rate of 13% (June 30, 2016: 14%) on remuneration of the Trustee through the Sindh Sales Tax on Services Act, 2011.
11 PAYABLE TO THE SECURITIES AND EXCHANGE COMMISSION OF PAKISTAN Annual fee 11.1 9,406 6,836
2017Notes(Rupees in '000)
2016
ACCRUED EXPENSES AND OTHER LIABILITIES
Auditors' remuneration Provision for Workers' Welfare Fund Provision for Sindh Workers' Welfare Fund Federal Excise Duty on remuneration of the Management Company Brokerage charges Settlement charges Printing charges Withholding tax Capital gain tax Legal and professional charges Payable against redemption of units Payable to KASB Bank Limited (now BankIslami Pakistan Limited) Contingent load Dividend payable Others
1717
12.1 & 12.2
12.38.28.2
422 -
10,469 39,241 3,963 1,410
201 21,466 58,399
3 362
- -
1,554 480
137,970
410
31,218 -
39,241204203
200 24,97342,118
10 2,594,595
440,06423,161
1,131484
3,198,012
2017(Rupees in '000)
201612
11.1 Under the provisions of the NBFC Regulations, a collective investment scheme categorised as Income Scheme is required to pay as annual fee to the Securities and Exchange Commission of Pakistan, an amount equal to 0.075 percent of the average annual net assets of the Fund. The fee is paid annually in arrears.

Annual Report 2017 Page 41
NAFA INCOME OPPORTUNITY FUND
16 AUDITORS' REMUNERATION
Annual audit fee Half yearly review feeOut of pocket expenses including government levies
330 155 104 589
300 141
89 530
2017------(Rupees in '000)------
2016
13.2
14
15
Commitments Margin trading system transactions entered into by the Fund in respect of which release transactions have not been settled 9,836 22,530
2017------(Rupees in '000)------
2016
2017--------Number of Units---------
2016
NUMBER OF UNITS IN ISSUE Total units in issue at the beginning of the yearAdd: units issued during the yearLess: units redeemed during the year
Total units in issue at the end of the year
NET ASSET VALUE PER UNIT The net asset value per unit as disclosed in the statement of assets and liabilities is calculated by dividing the net assets of the Fundby the number of units in issue at the year end.
586,288,408 2,208,195,765
(2,027,954,499)
766,529,674
453,547,333 1,983,189,203
(1,850,448,128)
586,288,408
12.1
12.2
12.3
13.
13.1
As per the requirement of the Finance Act, 2013, Federal Excise Duty (FED) at the rate of 16% on the remuneration of the Management Company has been applied effective from June 13, 2013. The Management Company is of the view that since the remuneration is already subject to the provincial sales tax, further levy of FED may result in double taxation, which does not appear to be the spirit of the law, hence, a petition was collectively �led by the Mutual Funds Association of Pakistan with the Sindh High Court (SHC). While disposing the above petition, the SHC declared the said provisions to be ultra vires and as a result no FED is payable with effect from July 01, 2011. However, the tax authorities subsequently �led appeal against the decision of the SHC in the Supreme Court of Pakistan, which is pending for the decision. Further, the Finance Act 2016, also introduced an amendment to the Federal Excise Act, 2005 whereby FED was withdrawn on services of different industries including Non-Banking Financial Institutions, which are already subject to provisional sales tax. However, since the appeal is pending in the Supreme Court of Pakistan, the Management Company, as a matter of abundant caution, is carrying provision for FED aggregating to Rs. 39.241 million as at June 30, 2017. Had the provision not been made, the net asset value per unit as at June 30, 2017 would have been higher by Rs.0.0408 per unit (June 30, 2016: Rs. 0.0669 per unit). The amount of FED accrued on remuneration of the Management Company will be paid via Management Company to the taxation authority, if required. This mainly represents amounts payable to other collective investment schemes being managed by the Management Company of the Fund. These amounts are payable in respect of units redeemed by various unit holders based on their request for transfer of units from the Fund to the other collective investment schemes. CONTINGENCIES AND COMMITMENTS Contingencies There are no contingencies as at June 30, 2017 and as at June 30, 2016.

Annual Report 2017 Page 42
NAFA INCOME OPPORTUNITY FUND
17.
18.
19.
20.
21.
WORKERS WELFARE FUND AND SINDH WORKER'S WELFARE FUND
The Finance Act, 2008 introduced amendments to the Workers' Welfare Fund Ordinance, 1971 whereby the de�nition of industrial establishment was extended. The amendments were challenged at various levels and con�icting judgments were rendered by the Lahore High Court, Sindh High Court and Peshawar High Court. The Honorable Supreme Court of Pakistan vide its judgment dated November 10 ,2016, has upheld the view of Lahore High Court and decided that Workers’ Welfare Fund (WWF) is not a tax and hence the amendments introduced through Finance Act, 2008 are ultra-vires to the Constitution. The Federal Board of Revenue has led Civil Review Petitions in respect of above judgment with the prayer that the judgment dated November 10, 2016 passed in the Civil Appeal may kindly be reviewed in the interest of justice. Furthermore, the Sindh Revenue Board (SRB) had written to few mutual funds in January 2016 to register and pay Sindh Workers Welfare Fund (SWWF) for the accounting year closing on or after December 31, 2013. MUFAP reviewed the issue and based on an opinion decided that SWWF is not applicable on mutual funds as they are not �nancial institutions as required by SWWF Act, 2014. The MUFAP wrote to the SRB that mutual funds are not establishments and are pass through vehicles hence, they do not have any worker and no SWWF is payable by them. SRB responded back that as mutual funds are included in de�nition of �nancial institutions in the Financial Institutions (Recovery of Finance) Ordinance, 2001, therefore SWWF is applicable on mutual funds. The MUFAP has taken up this matter before the Sindh Finance Ministry to exclude mutual funds from SWWF. In view of the above developments regarding the applicability of WWF and SWWF on mutual funds, MUFAP has recommended the following to all its members on January 12, 2017: - the entire provision against WWF held by the mutual funds till June 30, 2015, to be reversed on January 12, 2017; and - the provision in respect of SWWF should be made on a prudent basis on January 12, 2017 with effect from the date of enactment of the Sindh Workers’ Welfare Fund Act, 2014 (i.e. starting from May 21, 2015). The above decisions were communicated to the SECP and the Pakistan Stock Exchange Limited on January 12, 2017 and the SECP vide its letter dated February 1, 2017 has advised MUFAP that the adjustments relating to the above should be prospective and supported by adequate disclosures in the �nancial statements of the mutual funds.
As a result of the above recommendations of the MUFAP, the Fund on January 12, 2017, reversed the provision of WWF and recognized provision for SWWF from May 21, 2015. Had the provision not being made, the net asset value per unit as at June 30, 2017 would have been higher by Rs.0.0137 per unit. TAXATION The Fund's income is exempt from income tax as per clause 99 of Part I of the Second Schedule of the Income Tax Ordinance, 2001 subject to the condition that not less than ninety percent of its accounting income for the year, as reduced by capital gains whether realised or unrealised is distributed amongst the unit holders (excluding distribution made by issuance of bonus units). Furthermore, as per regulation 63 of the Non-Banking Finance Companies and Noti�ed Entities Regulations, 2008 the Fund is required to distribute ninety percent of accounting income other than capital gains whether realised or unrealised to the unit holders. The Fund has distributed such accounting income for the year ended June 30, 2017 to its unit holders. Accordingly, no provision in respect of taxation has been made in these �nancial statements. The Fund is also exempt from the provision of Section 113 (minimum tax) under clause 11A of Part IV of the Second Schedule to the Income Tax Ordinance, 2001. EARNINGS PER UNIT Earnings Per Unit (EPU) has not been disclosed as in the opinion of the management determination of weighted average units for calculating EPU is not practicable. TOTAL EXPENSE RATIO Total expense ratio (all the expenses incurred during the period divided by average net asset value for the period) is 1.99% per annum including 0.33% representing government levies on Collective Investment Scheme such as sales tax, provision for SWWF and SECP fee for the year.
DETAILS OF NON-COMPLIANT INVESTMENTS The SECP vide circular no. 7 of 2009 dated March 6, 2009, required all asset management companies to categorize funds under their management on the basis of criteria laid down in the circular. The Board has approved the category of the fund as 'Income Scheme'.
The SECP vide circular no. 16 dated July 07, 2010, prescribed speci�c disclosures for the scheme holding investments that are non-compliant either with the minimum investment criteria speci�ed for the category assigned to such schemes or with investment requirements of their constitutive documents.
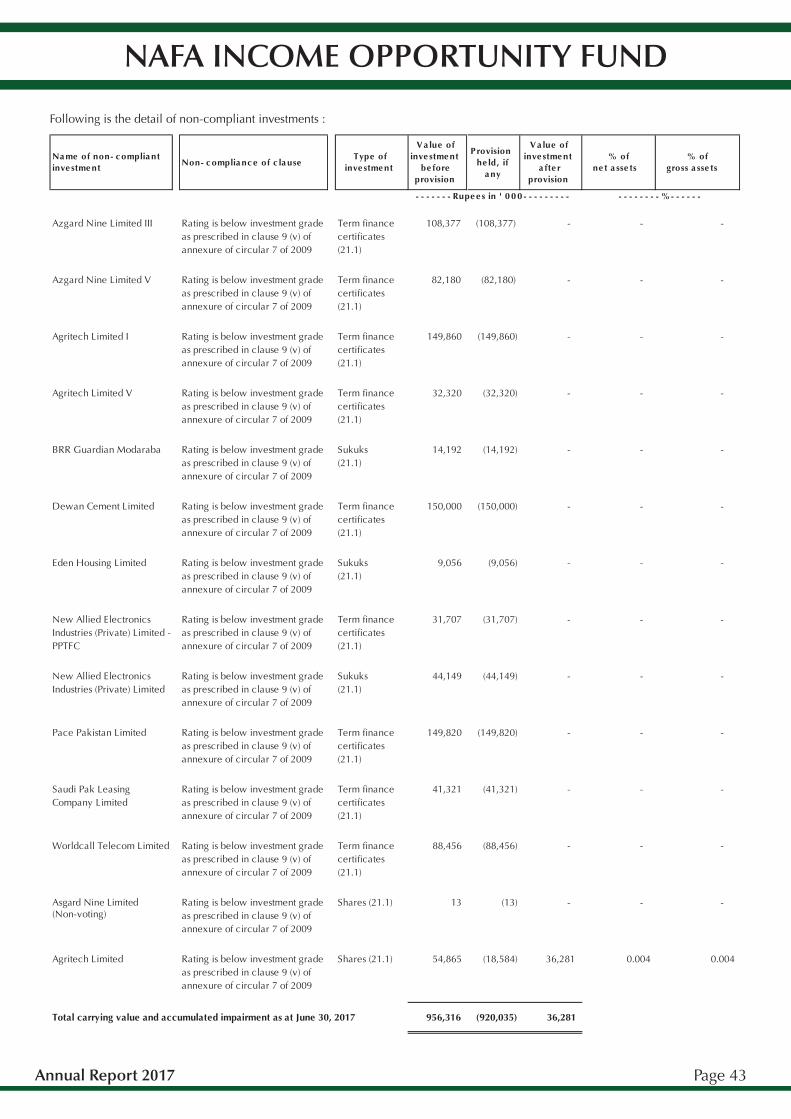
Annual Report 2017 Page 43
NAFA INCOME OPPORTUNITY FUND
Following is the detail of non-compliant investments :
Azgard Nine Limited III 108,377 (108,377) - - -
Azgard Nine Limited V 82,180 (82,180) - - -
Agritech Limited I 149,860 (149,860) - - -
Agritech Limited V 32,320 (32,320) - - -
BRR Guardian Modaraba 14,192 (14,192) - - -
Dewan Cement Limited 150,000 (150,000) - - -
Eden Housing Limited 9,056 (9,056) - - -
31,707 (31,707) - - -
44,149 (44,149) - - -
Pace Pakistan Limited 149,820 (149,820) - - -
41,321 (41,321) - - -
88,456 (88,456) - - -
13 (13) - - -
Agritech Limited Shares (21.1) 54,865 (18,584) 36,281 0.004 0.004
Total carrying value and accumulated impairment as at June 30, 2017 956,316 (920,035) 36,281
Rating is below investment grade as prescribed in clause 9 (v) of annexure of circular 7 of 2009
Rating is below investment grade as prescribed in clause 9 (v) of annexure of circular 7 of 2009
Term �nance certi�cates (21.1)
Worldcall Telecom Limited
Rating is below investment grade as prescribed in clause 9 (v) of annexure of circular 7 of 2009
Asgard Nine Limited(Non-voting)
Shares (21.1)
Rating is below investment grade as prescribed in clause 9 (v) of annexure of circular 7 of 2009
Term �nance certi�cates (21.1)
Rating is below investment grade as prescribed in clause 9 (v) of annexure of circular 7 of 2009
Term �nance certi�cates (21.1)
Saudi Pak Leasing Company Limited
Rating is below investment grade as prescribed in clause 9 (v) of annexure of circular 7 of 2009
Term �nance certi�cates (21.1)
New Allied Electronics Industries (Private) Limited - PPTFC
Rating is below investment grade as prescribed in clause 9 (v) of annexure of circular 7 of 2009
New Allied Electronics Industries (Private) Limited
Sukuks (21.1)
- - - - - - - - %- - - - - - - - - - - - - Rupe e s in ' 0 0 0 - - - - - - - - -
Rating is below investment grade as prescribed in clause 9 (v) of annexure of circular 7 of 2009
Term �nance certi�cates (21.1)
Rating is below investment grade as prescribed in clause 9 (v) of annexure of circular 7 of 2009
Term �nance certi�cates (21.1)
Rating is below investment grade as prescribed in clause 9 (v) of annexure of circular 7 of 2009
Term �nance certi�cates (21.1)
Rating is below investment grade as prescribed in clause 9 (v) of annexure of circular 7 of 2009
Sukuks (21.1)
Non- c omplia nc e of c la useNa me of non- c omplia nt inve stme nt
Type of inve stme nt
% ofgross a sse ts
Va lue of inve stme nt
be fore provision
Va lue of inve stme nt
a fte r provision
Provision he ld, if
a ny
% ofne t a sse ts
Term �nance certi�cates (21.1)
Rating is below investment grade as prescribed in clause 9 (v) of annexure of circular 7 of 2009
Sukuks (21.1)
Rating is below investment grade as prescribed in clause 9 (v) of annexure of circular 7 of 2009
Term �nance certi�cates (21.1)
Rating is below investment grade as prescribed in clause 9 (v) of annexure of circular 7 of 2009

Annual Report 2017 Page 44
NAFA INCOME OPPORTUNITY FUND
21.1
22
22.1
22.2
22.3
22.4
22.5
At the time of purchase, these term �nance certi�cates and sukuks were in compliance with the aforementioned circular. However, they either subsequently defaulted or were downgraded to non investment grade.
TRANSACTIONS WITH CONNECTED PERSONS AND RELATED PARTIES Connected persons and related parties include NBP Fullerton Asset Management Limited being the Management Company, Central Depository Company of Pakistan Limited being the Trustee, National Bank of Pakistan being the Parent of the Management Company and Alexandra Fund Management Pte. Limited being the sponsor of the Management Company. It also includes associated companies of Management Company due to common directorship, post-employment bene�t funds of the Management Company, its parent and sponsor. It also includes subsidiaries and associated companies of the Parent of the Management Company and other collective investment schemes (CIS) managed by the Management Company, directors and key management personnel of the Management Company and any person or company bene�cially owning directly or indirectly 10% or more of the units in issue / net assets of the Fund. The transactions with connected persons are carried out in the normal course of business, at contracted rates and terms determined in accordance with the market norms. Remuneration of the Management Company is determined in accordance with the provisions of the NBFC Regulations. Remuneration of the Trustee is determined in accordance with the provisions of the Trust Deed.
2017 2016
(Rupees in '000)Details of the transactions with connected persons are as follows: NBP Fullerton Asset Management Limited (Management Company) Remuneration of the Management Company Sindh Sales Tax on remuneration of the Management Company Federal Excise Duty on remuneration of the Management Company Reimbursement of operational expenses to the Management Company Sales load and related Sindh Sales Tax and Federal Excise Duty Central Depository Company of Pakistan Limited (Trustee) Remuneration of the Trustee Sindh sales tax on remuneration of the Trustee CDS charges National Bank of Pakistan (Parent of the Management Company) T-Bills purchased Mark-up on bank balances Units redeemed / transferred out Nil units (2016: Nil) Chief Operating Of�cer and Company Secretary of the Management Company Units issued / transferred in Nil units (2016: Nil) Units redeemed / transferred out Nil units (2016: Nil) Summit Bank Limited (Common Directorship with the Management Company) Mark-up on bank balances Dividend re-invest Nil units (2016: 169,080 units) Mark-up on term deposit receipts Placement of term deposit receipts Units issued / transferred in 905,674 units (2016: Nil) Units redeemed / transferred out 2,125,209 units (2016: Nil) Employees of the Management Company Units issued / transferred in 11,448,015 units (2016: 8,870,377 units) Units redeemed / transferred out 12,704,445 units (2016: 10,144,897 units) Dividend re-invest 42,439 units (2016: 130,737 units) Cherat Cement Company Limited (Common Directorship with the Management Company) Units issued / transferred in 4,567,253 units (2016: 14,550,860 units) Units redeemed / transferred out 4,567,253 units (2016: 14,550,860 units)
157,053 20,417
- 12,541 6,709
10,379 1,349 3,211
4,373,594 186
-
- -
49 - - -
10,000 23,470
125,793 140,185
454
50,000 50,262
125,392 20,364 20,063
5,986 6,709
7,977 1,117
631
- 5 -
- -
7 1,816 1,964
250,000 - -
98,126 114,909
1,401
164,672 165,230

Annual Report 2017 Page 45
NAFA INCOME OPPORTUNITY FUND
2017 2016
(Rupees in '000)
*BankIslami Pakistan Limited (Common Directorship with the Management Company) Mark-up on bank balances NAFA Income Fund (CIS managed by the Management Company) Purchase of Market Treasury Bill NAFA Government Securities Savings Fund (CIS managed by the Management Company) Purchase of market treasury bills NAFA Financial Sector Income Fund (CIS managed by the Management Company) Purchase of Market Treasury Bill NAFA Government Securities Liquid Fund (CIS managed by the Management Company) Sale of Market Treasury Bill NBP Employees Benevolent Fund Trust (Benevolent Fund of the parent of the Management Company) Dividend re-invest 130 units (2016: 378 units) NBP Employees Pension Fund (Pension Fund of the parent of the Management Company) Units issued / transferred in 5,018,073 units (2016: 10,970,511 units) Al-Shifa Trust (Portfolio managed by the Management Company) Units issued / transferred in 7,765,181 units (2016: Nil) Units redeemed / transferred out 7,765,181 units (2016: Nil) Telenor Employees Gratuity Fund (Portfolio managed by the Management Company) Units issued / transferred In 27,412,529 units (2016: Nil) Units redeemed / transferred out 14,727,144 units (2016: Nil) Pakistan Centre for Philanthropy (Portfolio managed by the Management Company) Units issued / transferred in 1,032,247 units (2016: Nil) Units redeemed / transferred out 543,642 units (2016: Nil) Thal Limited Employees Provident Fund (Portfolio managed by the Management Company) Purchase of Market Treasury Bill Pak Arab Re�nery Limited Supervisory Staff Gratuity Fund (Portfolio managed by the Management Company) Purchase of Market Treasury Bill
* Prour year transations with these parties have not been disclosed as they did not remain conected perssons and related parties during the years.
468
-
68,308
-
324,495
1
53,649
85,000 85,807
299,621 167,191
11,335 6,176
-
-
-
45,738
4,780
94,538
-
4
117,827
- -
- -
- -
4,767
5,406

Annual Report 2017 Page 46
NAFA INCOME OPPORTUNITY FUND
2017 2016
(Rupees in '000)Amounts outstanding as at year end are as follows: NBP Fullerton Asset Management Limited (Management Company) Remuneration of the Management Company Sindh Sales Tax on remuneration of the Management Company Federal Excise Duty on remuneration of the Management Company Operational expenses Sales load Contingent load Central Depository Company of Pakistan Limited (Trustee) Remuneration of the trustee Sindh sales tax on remuneration of the trustee CDS charges Security deposit National Bank of Pakistan (Parent of the Management Company) Bank balance Accrued mark-up on bank balance Summit Bank Limited (Common Directorship with the Management Company) Investment held in the Fund: Nil units (2016: 1,219,535 units) Bank balance *BankIslami Pakistan Limited (Common Directorship with the Management Company) Bank Balance Accrued markup on bank balance Askari Bank Limited (Common Directorship with the Management Company) Bank Balance Accrued markup on bank balance Pakistan Centre for Philanthropy (Portfolio managed by the Management Company) Investment held in the Fund: 488,605 units (June 30, 2016: Nil units) Telenor Employees Gratuity Fund (Portfolio managed by the Management Company) Investment held in the Fund: 12,685,385 units (June 30, 2016: Nil units) NBP Employees Pension Fund (Pension Fund of the parent of the Management Company) Investment held in the Fund: 84,145,983 units (June 30, 2016: 79,127,910 units) NBP Employees Benevolent Fund Trust (Benevolent Fund of the parent of the Management Company) Investment held in the Fund: 2,856 units (June 30, 2016: 2,726 units) Employees of the Management Company Investment held in the Fund: 8,125,786 units (June 30, 2016: 1,942,017 units) Amount receivable / (payable) against issue of units from: NAFA Financial Sector Income Fund NAFA Islamic Income Fund NAFA Islamic Asset Allocation Fund NAFA Islamic Asset Allocation Fund Plan-II NAFA Islamic Stock Fund NAFA Money Market Fund NAFA Multi Asset Fund NAFA Savings Plus Fund NAFA Stock Fund
* Prour year transations with these parties have not been disclosed as they did not remain conected perssons and related parties during the years.
22.6
8,475 1,102
39,241 12,541
336 -
1,690 220
1,394 100
25,691 -
- 16,732
1,596 0
2,247 1
5,226
135,688
900,059
31
760
9,009 -
1,440 -
3,212 - - -
3,281
9,679 1,570
39,241 5,986 2,390
23,161
650 91
112 100
2,220 1
13,051 19,927
3,822 -
1,202 -
-
-
846,795
29
20,783
(423,934) (51,671) (35,775)
760 (1,653)
(2,070,745) (655)
(1,529) (8,501)

Annual Report 2017 Page 47
NAFA INCOME OPPORTUNITY FUND
Certain annual improvements have also been made to a number of IFRSs. Other than the aforesaid standards, interpretations and amendments, the International Accounting Standards Board (IASB) has also issued the following standards which have not been adopted locally by the Securities and Exchange Commission of Pakistan: - IFRS 1 – First Time Adoption of International Financial Reporting Standards - IFRS 9 – Financial Instruments - IFRS 14 – Regulatory Deferral Accounts - IFRS 15 – Revenue from Contracts with Customers - IFRS 16 – Leases - IFRS 17 – Insurance Contracts Amendment in the NBFC Regulations subsequent to the year end Subsequent to the year end on August 03, 2017, the SECP has made certain amendments in the NBFC Regulations, 2008 via SRO 756 (I)/2017. The de�nition of element of income has been inserted via said amendment which de�nes element of income as difference between net assets value on the issuance or redemption date, as the case may be, of units and the net asset value at the beginning of the relevant accounting period. The said amendment also excludes element of income from accounting income for the purpose of distribution under regulation 63 of the NBFC Regulations. The said SRO also contains amendments relating to consequential changes in the income statement and statement of movement in unitholders’ fund. The Management Company is in the process of assessing the impact of the said changes with the view that these changes will be effective for the period following the date of the said SRO.
PARTICULARS OF INVESTMENT COMMITTEE AND FUND MANAGER
Details of members of the investment committee of the Fund are as follows:
23
23.1 Mr. Muhammad Ali Bhabha is the manager of the Fund. Other funds being managed by the Fund Manager are as follows:
- NAFA Government Securities Savings Fund- NAFA Income Opportunity Fund- NAFA Income Fund- NAFA Islamic Income Fund- NAFA Active Allocation Riba Free Savings Fund- NAFA Money Market Fund- NAFA Riba Free Savings Fund- NAFA Government Securities Liquid Fund- NAFA Savings Plus Fund- NAFA Financial Sector Income Fund
12345
Dr. Amjad WaheedSajjad AnwarHasan RazaMuhammad Ali BhabhaTaha Khan Javed
2917
62211
MBA, Doctorate in Business Administration, CFA MBA & CFAMBA & CFA
CFA, FRM, MBA & MS(CS)MBA & CFA
S.No.Experience in
yearsName Quali�cation
24 TRANSACTIONS WITH BROKERS / DEALERS
List of top ten brokers by percentage of commission charged during the year June 30, 2017
12345678910
M.R.A SecuritiesAdam Securities (Private) LimitedJ.S Global Capital LimitedEFG Hermes Pakistan Limited (Formerly Invest & Finance Securities Limited)First Capital Equities LimitedSherman Securities (Private) LimitedAl-Falah Securities (Private) LimitedTopline Securities (Private) LimitedIntermarket SecuritiesIsmail Iqbal Securities (Private) Limited
38.74%25.51%13.10%9.18%6.36%4.56%1.16%1.07%0.25%0.07%
S. No.
Particulars Percentage
List of top ten brokers by percentage of commission charged during the year June 30, 2016
12345678910
BMA Capital Management LimitedInvest & Finance Securities (Private) LimitedKASB Securities LimitedMangenta Capital Private LimitedVector Capital (Private) LimitedInvest Capital Markets LimitedInvest One Markets LimitedNext Capital LimitedCurrency Market Associates Private LimitedPearl Securities (Private) Limited
34.55%17.65%12.20%11.72%10.76%5.21%3.21%3.14%0.92%0.65%
S. No.
Particulars Percentage
25
Rupees in '000
-------------------- As at June 30, 2017--------------------
IndividualsAssociated companies and directorsInsurance companiesRetirement fundsBank / development �nance institutionPublic listed companiesOthers
1,682 3 6
57 1 6
1141869
1,652,287 900,649 317,187
1,232,759 213,032
1,752,675 2,130,539 8,199,128
20.15%10.98%
3.87%15.04%
2.60%21.38%25.98%
100%
Percentage of invesment
Net asset value ofthe amount invested
Category Number of unit holders
PATTERN OF UNIT HOLDING

Annual Report 2017 Page 48
NAFA INCOME OPPORTUNITY FUND
Rupees in '000
-------------------- As at June 30, 2016--------------------
IndividualsAssociated companies and directorsInsurance companiesRetirement fundsBank / development �nance institutionPublic listed companiesOthers
1,936 2 6
39 3 2
110 2,098
1,752,377 846,824 398,562 984,263 403,217
30 1,888,950 6,274,223
27.93%13.50%
6.35%15.69%
6.43%0.00%
30.11%100%
Percentage of invesment
Net asset value ofthe amount invested
Category Number of unit holders
ATTENDANCE AT MEETINGS OF BOARD OF DIRECTORS
The 60th, 61st, 62nd, 63rd Board meetings were held on September 23, 2016, October 28, 2016, February 28, 2017, April 28, 2017, respectively. Information in respect of attendance by directors in the meetings is given below:
26
Mr. Nausherwan Adil Mr. Aamir Sattar Mr. Abdul Hadi Palekar Mr. Koh Boon San [note 26] Mr. Lui Mang Yin (Martin Lui) Dr. Foo Chiah Shiung (Kelvin Foo) [note 26] Mr. Kamal Amir Chinoy Mr. Shehryar Faruque Mr. Saiyed Hashim Ishaque [note 26] Mr. Humayun Bashir [note 26] Dr. Amjad Waheed
444 2* 4
2* 44 3* 1* 4
44324
143314
--1--
1-1---
--
61st Meeting--
63rd Meeting-
62nd Meeting---
Name of DirectorsHeld Attended
Number of meetings
Leavegranted
Meeting not attended
Mr. Koh Boon San retired in Extra Ordinary General Meeting held on 21 November 2016. Dr. Foo Chiah Shiung (Kelvin Foo) opted as director on the Board with effect from 21 November 2016. Mr. Saiyed Hashim Ishaque retired in Extra Ordinary General Meeting held on 17 March 2017. Mr. Humayun Bashir opted as director on the Board with effect from 17 March 2017. *These directors were appointed and retired during the year, therefore the number of meetings held in respect of these directors is less than the total number of meetings held during the year.
26.1
26.2
26.3
26.4
FINANCIAL INSTRUMENTS BY CATEGORY27
Particulars
Financial assets Balance with banksInvestments Receivable against margin trading systemMark-up accruedReceivable against sale of investmentsDeposits and other receivables
2,174,206 1,295,252
87,869 56,609
3,203,158 612,369
7,429,463
-
899,980 - - - -
899,980
- 36,281
- - - -
36,281
2,174,206 2,231,513
87,869 56,609
3,203,158 612,369
8,365,724
At fairvalue throughpro�t or loss -
held for trading
Loans andreceivables
Availablefor sale Total
--------------------------June 30, 2017--------------------------
--------------------------Rupees in '000--------------------------
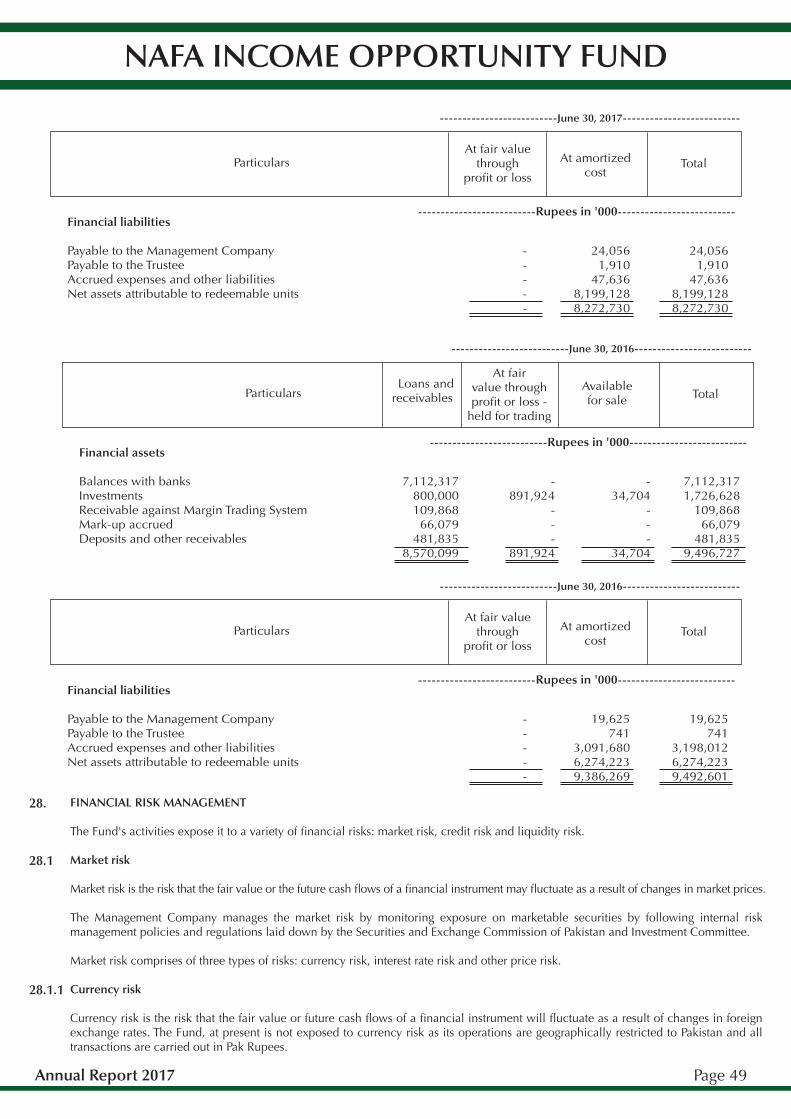
Annual Report 2017 Page 49
NAFA INCOME OPPORTUNITY FUND
FINANCIAL RISK MANAGEMENT The Fund's activities expose it to a variety of �nancial risks: market risk, credit risk and liquidity risk. Market risk Market risk is the risk that the fair value or the future cash �ows of a �nancial instrument may �uctuate as a result of changes in market prices.
The Management Company manages the market risk by monitoring exposure on marketable securities by following internal risk management policies and regulations laid down by the Securities and Exchange Commission of Pakistan and Investment Committee. Market risk comprises of three types of risks: currency risk, interest rate risk and other price risk. Currency risk Currency risk is the risk that the fair value or future cash �ows of a �nancial instrument will �uctuate as a result of changes in foreign exchange rates. The Fund, at present is not exposed to currency risk as its operations are geographically restricted to Pakistan and all transactions are carried out in Pak Rupees.
28.
28.1
28.1.1
Particulars
Financial assets Balances with banksInvestments Receivable against Margin Trading SystemMark-up accruedDeposits and other receivables
7,112,317 800,000 109,868
66,079 481,835
8,570,099
-
891,924 - - -
891,924
-
34,704 - - -
34,704
7,112,317 1,726,628
109,868 66,079
481,835 9,496,727
At fairvalue throughpro�t or loss -
held for trading
Loans andreceivables
Availablefor sale Total
--------------------------June 30, 2016--------------------------
--------------------------Rupees in '000--------------------------
Particulars
Financial liabilities
Payable to the Management CompanyPayable to the TrusteeAccrued expenses and other liabilitiesNet assets attributable to redeemable units
- - - - -
24,056
1,910 47,636
8,199,128 8,272,730
24,056
1,910 47,636
8,199,128 8,272,730
At fair valuethrough
pro�t or loss
At amortizedcost
Total
--------------------------June 30, 2017--------------------------
--------------------------Rupees in '000--------------------------
Particulars
Financial liabilities
Payable to the Management CompanyPayable to the TrusteeAccrued expenses and other liabilitiesNet assets attributable to redeemable units
- - - - -
19,625
741 3,091,680 6,274,223 9,386,269
19,625
741 3,198,012 6,274,223 9,492,601
At fair valuethrough
pro�t or loss
At amortizedcost
Total
--------------------------June 30, 2016--------------------------
--------------------------Rupees in '000--------------------------
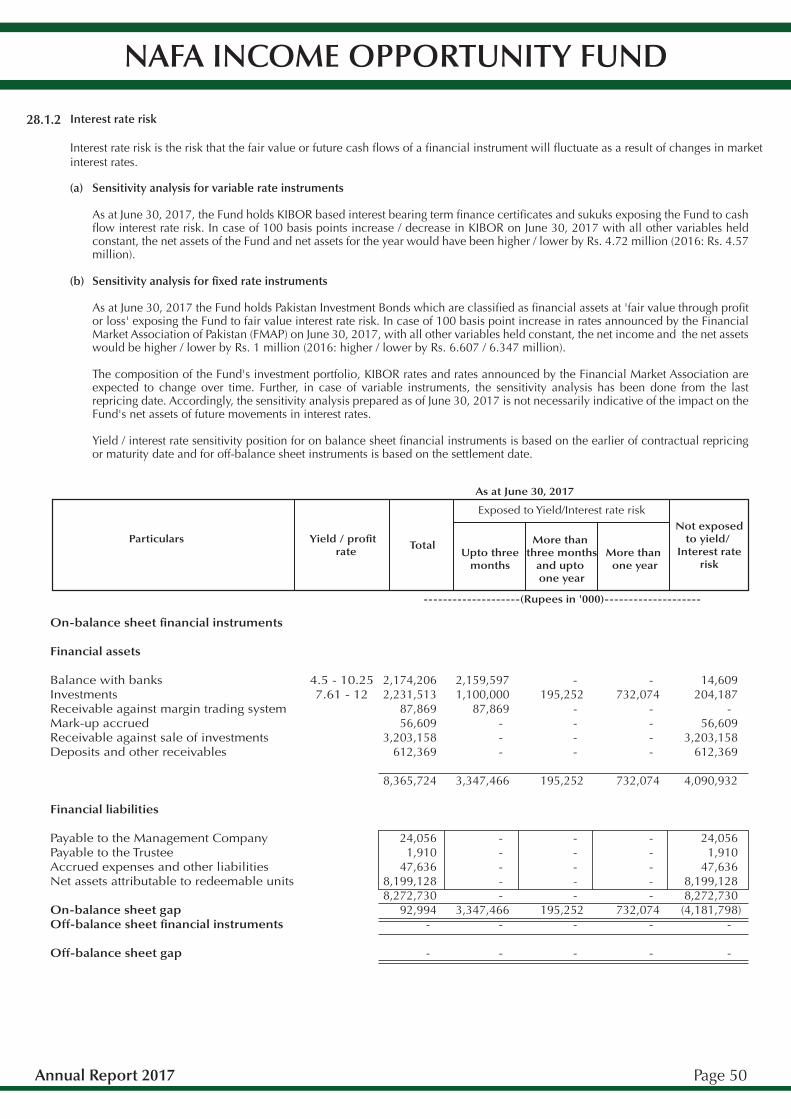
Annual Report 2017 Page 50
NAFA INCOME OPPORTUNITY FUND
(a)
(b)
Sensitivity analysis for variable rate instruments As at June 30, 2017, the Fund holds KIBOR based interest bearing term �nance certi�cates and sukuks exposing the Fund to cash �ow interest rate risk. In case of 100 basis points increase / decrease in KIBOR on June 30, 2017 with all other variables held constant, the net assets of the Fund and net assets for the year would have been higher / lower by Rs. 4.72 million (2016: Rs. 4.57 million). Sensitivity analysis for �xed rate instruments As at June 30, 2017 the Fund holds Pakistan Investment Bonds which are classi�ed as �nancial assets at 'fair value through pro�t or loss' exposing the Fund to fair value interest rate risk. In case of 100 basis point increase in rates announced by the Financial Market Association of Pakistan (FMAP) on June 30, 2017, with all other variables held constant, the net income and the net assets would be higher / lower by Rs. 1 million (2016: higher / lower by Rs. 6.607 / 6.347 million). The composition of the Fund's investment portfolio, KIBOR rates and rates announced by the Financial Market Association are expected to change over time. Further, in case of variable instruments, the sensitivity analysis has been done from the last repricing date. Accordingly, the sensitivity analysis prepared as of June 30, 2017 is not necessarily indicative of the impact on the Fund's net assets of future movements in interest rates. Yield / interest rate sensitivity position for on balance sheet �nancial instruments is based on the earlier of contractual repricing or maturity date and for off-balance sheet instruments is based on the settlement date.
Interest rate risk Interest rate risk is the risk that the fair value or future cash �ows of a �nancial instrument will �uctuate as a result of changes in market interest rates.
28.1.2
On-balance sheet �nancial instruments Financial assets Balance with banks Investments Receivable against margin trading system Mark-up accrued Receivable against sale of investments Deposits and other receivables Financial liabilities Payable to the Management Company Payable to the Trustee Accrued expenses and other liabilities Net assets attributable to redeemable units On-balance sheet gap Off-balance sheet �nancial instruments Off-balance sheet gap
4.5 - 10.257.61 - 12
2,174,206 2,231,513
87,869 56,609
3,203,158 612,369
8,365,724
24,056 1,910
47,636 8,199,128 8,272,730
92,994 -
-
2,159,597 1,100,000
87,869 - - -
3,347,466
- - - - -
3,347,466 -
-
- 195,252
- - - -
195,252
- - - - -
195,252 -
-
- 732,074
- - - -
732,074
- - - - -
732,074 -
-
14,609 204,187
- 56,609
3,203,158 612,369
4,090,932
24,056 1,910
47,636 8,199,128 8,272,730
(4,181,798) -
-
Yield / pro�t rate
ParticularsTotal
Upto threemonths
More than one year
Not exposedto yield/
Interest raterisk
More than three months
and upto one year
Exposed to Yield/Interest rate risk
As at June 30, 2017
--------------------(Rupees in '000)--------------------

Annual Report 2017 Page 51
NAFA INCOME OPPORTUNITY FUND
On-balance sheet �nancial instruments Financial assets Balances with banks Investments - net Receivable against Margin Trading System Mark-up accrued Deposits and other receivables Financial liabilities Payable to the Management Company Payable to the Trustee Accrued expenses and other liabilities Net assets attributable to redeemable units On-balance sheet gap Off-balance sheet �nancial instruments Off-balance sheet gap
4.5 - 97.61 - 12
7,112,317 1,726,628
109,868 66,079
481,835
9,496,727
19,625 741
3,198,012 6,274,223 9,492,601
4,126
-
-
7,094,451 800,000 109,968
- -
8,004,419
- - - - -
8,004,419
-
-
- 541,049
- - -
541,049
- - - - -
541,049
-
-
- - - - -
-
- - - - -
-
-
-
17,866 385,579
- 66,079
481,835
951,359
19,625 741
3,198,012 6,274,223 9,492,601
(8,541,242)
-
-
Yield / pro�t rate
ParticularsTotal
Upto threemonths
More than one year
Not exposedto yield/
Interest raterisk
More than three months
and upto one year
Exposed to Yield/Interest rate risk
As at June 30, 2016
--------------------(Rupees in '000)--------------------
Price risk Price risk is the risk that the fair value or future cash �ows of a �nancial instrument will �uctuate as a result of changes in market prices (other than those arising from interest rate risk or currency risk) whether those changes are caused by factors speci�c to the individual �nancial instrument or its issuer, or factors affecting all instruments traded in the market. The fund is exposed to equity price risk because of investment held by the Fund and classi�ed in the statement of assets and liabilities as 'available for sale' and 'at fair value through pro�t and loss'. In case of 5% increase / decrease in fair value on June 30, 2017, the net income for the year would increase / decrease by Rs. 1.814 million (2016: Rs 1.735 million) and net assets of the Fund would increase / decrease by the same amount as a result of gains / losses on equity securities classi�ed as 'available for sale'. The sensitivity analysis is based on the Fund's equity security as at the statements of assets and liabilities date with all other variables held constant. Credit risk Credit risk represents the risk of a loss if counter parties fail to perform as contracted. The Fund's credit risk is primarily attributable to its investment in debt securities. The Fund is also exposed to counter party credit risks on loans and receivables, balances with banks, pro�t receivable, advances, deposits and other receivables. The credit risk on liquid funds is limited because the counter parties are �nancial institutions with reasonably high credit ratings. The analysis below summarises the credit quality of the Fund's �nancial assets:
28.1.3
28.2
June 30,Bank balances by rating category 2017
24.31%1.03%
16.38%0.36%
28.95%25.98%2.99%
A-
AAAA-AA+AAA
A
A+

Concentration of credit risk Concentration of credit risk exists when changes in economic or industry factors similarly affect groups of counterparties whose aggregate credit exposure is signi�cant in relation to the Fund's total credit exposure. The Fund’s portfolio of �nancial instruments is broadly diversi�ed and transactions are entered into with diverse credit-worthy counterparties thereby mitigating any signi�cant concentrations of credit risk.
Liquidity risk Liquidity risk is the risk that the Fund may not be able to generate suf�cient cash resources to settle its obligation in full as they fall due or can only do so on terms that are materially disadvantageous to the Fund. The Fund is exposed to daily cash redemptions at the option of unit holders. The Fund's approach to managing liquidity is to ensure, as far as possible, that the Fund will always have suf�cient liquidity to meet its liabilities when due under both normal and stressed conditions, without incurring unacceptable losses or risking damages to the Fund's reputation. Its policy is therefore to invest the majority of its assets in investments that are traded in an active market and can be readily disposed and are considered readily realisable. For the purpose of making redemptions, the Fund has the ability to borrow in the short term. However, such need did not arise during the year. The maximum amount available to the Fund from the borrowing would be limited to �fteen percent of the net assets upto 90 days and would be secured by the assets of the Fund. The facility would bear interest at commercial rates. In order to manage the Fund's overall liquidity, the Fund may also withhold daily redemption requests in excess of ten percent of the units in issue and such requests would be treated as redemption requests qualifying for being processed on the next business day. Such procedure would continue until the outstanding redemption requests come down to a level below ten percent of the units then in issue. The Fund did not withhold any signi�cant redemptions during the year. The table below analyses the Fund's �nancial liabilities into relevant maturity groupings based on the remaining period at the reporting date to the contractual maturity date. The amounts in the table are the contractual undiscounted cash �ows.
28.3
Annual Report 2017 Page 52
NAFA INCOME OPPORTUNITY FUND
Term �nance certi�cates and sukuks by rating category
40.26%59.74%
The maximum exposure to credit risk before any credit enhancement as at June 30, 2017 is as follows:
Un-ratedA+, AA-,AA+
Balances with banks 2,174,206 2,174,206 7,112,317 7,112,317 Investments 2,231,513 1,948,602 1,726,628 1,375,753 Receivable against margin trading system 87,869 87,869 109,868 109,868 Mark-up accrued 56,609 51,349 66,079 57,266 Receivable against sale of investments 3,203,158 3,203,158 - - Deposits and other receivables 612,369 612,369 481,835 481,835
8,365,724 8,077,553 9,496,727 9,137,039
Maximumexposure
-----------Rupees in '000 --------- -----------Rupees in '000 ---------
June 30, 2017 June 30, 2016
Amount of�nancial assets
Maximumexposure
Amount of�nancial assets
Financial liabilities Payable to the Management CompanyPayable to the TrusteeAccrued expenses and other liabilitiesNet assets attributable to redeemable units
24,056 1,910
47,636 8,199,128 8,272,730
24,056 1,910
47,636 8,199,128 8,272,730
- - - - -
- - - - -
TotalUpto three
months
Over three months and upto
oneyear
Over one year
------------------------------------------Rupees in '000-------------------------------------------
--------------------------------------- June 30, 2017 -----------------------------------
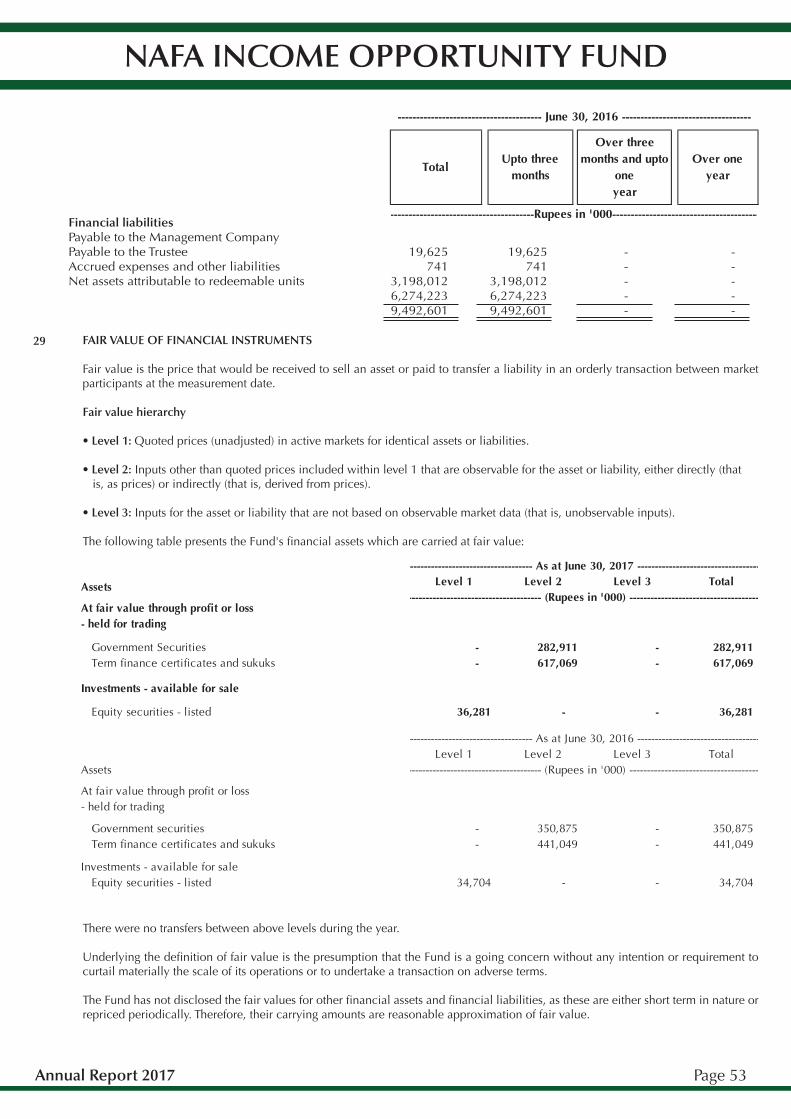
Annual Report 2017 Page 53
NAFA INCOME OPPORTUNITY FUND
FAIR VALUE OF FINANCIAL INSTRUMENTS Fair value is the price that would be received to sell an asset or paid to transfer a liability in an orderly transaction between market participants at the measurement date. Fair value hierarchy • Level 1: Quoted prices (unadjusted) in active markets for identical assets or liabilities. • Level 2: Inputs other than quoted prices included within level 1 that are observable for the asset or liability, either directly (that is, as prices) or indirectly (that is, derived from prices). • Level 3: Inputs for the asset or liability that are not based on observable market data (that is, unobservable inputs). The following table presents the Fund's �nancial assets which are carried at fair value:
29
There were no transfers between above levels during the year. Underlying the de�nition of fair value is the presumption that the Fund is a going concern without any intention or requirement to curtail materially the scale of its operations or to undertake a transaction on adverse terms. The Fund has not disclosed the fair values for other �nancial assets and �nancial liabilities, as these are either short term in nature or repriced periodically. Therefore, their carrying amounts are reasonable approximation of fair value.
Financial liabilities Payable to the Management CompanyPayable to the TrusteeAccrued expenses and other liabilitiesNet assets attributable to redeemable units
19,625 741
3,198,012 6,274,223 9,492,601
19,625 741
3,198,012 6,274,223 9,492,601
- - - - -
- - - - -
TotalUpto three
months
Over three months and upto
oneyear
Over one year
------------------------------------------Rupees in '000-------------------------------------------
--------------------------------------- June 30, 2016 -----------------------------------
Level 1 Level 2 Level 3 TotalAssets
At fair value through pro�t or loss- held for trading
Government Securities - 282,911 - 282,911 Term �nance certi�cates and sukuks - 617,069 - 617,069
Investments - available for sale
Equity securities - listed 36,281 - - 36,281
Level 1 Level 2 Level 3 TotalAssets
At fair value through pro�t or loss- held for trading
Government securities - 350,875 - 350,875 Term �nance certi�cates and sukuks - 441,049 - 441,049
Investments - available for saleEquity securities - listed 34,704 - - 34,704
------------------------------------------------------------ (Rupees in '000) ------------------------------------------------------------
------------------------------------------------------------ As at June 30, 2017 ------------------------------------------------------------
------------------------------------------------------------ (Rupees in '000) ------------------------------------------------------------
------------------------------------------------------------ As at June 30, 2016 ------------------------------------------------------------

Annual Report 2017 Page 54
NAFA INCOME OPPORTUNITY FUND
UNIT HOLDERS' FUND RISK MANAGEMENT The unit holders' fund is represented by redeemable units. These units are entitled to distributions and to payment of a proportionate share, based on the Fund's net asset value per unit on the redemption date. The relevant movements are shown in the statement of movement in unit holders' fund. The Fund has no restrictions on the issuance and redemption of units. There is no speci�c capital requirement which is applicable on the Fund. The Fund's objectives when managing unit holders' fund are to safeguard its ability to continue as a going concern so that it can continue to provide returns to unit holders and to maintain a strong base of assets under management. In accordance with the risk management policies stated in note 28, the Fund endeavours to invest the subscriptions received in appropriate investments while maintaining suf�cient liquidity to meet redemption requests which would be augmented by short-term borrowings or disposal of investments where necessary. DATE OF AUTHORISATION FOR ISSUE These �nancial statements were authorised for issue by the Board of Directors of the Management Company on September 15, 2017. GENERAL Figures have been rounded off to the nearest thousand rupees. Corresponding �gures have been rearranged and reclassi�ed to re�ect more appropriate presentation of events and transactions for the purpose of comparison, which are as follows:
30.
31.
32.
32.1
32.2
Statement Rupees in '000From To
Statement of assets and liabilities 39,241 Payable to NBP Fullerton Asset Management Limited - Management Company
Accrued expenses and
other liabilities
Reclassi�ed
Chief Financial Of�cer Chief Executive Of�cer Director
For NBP Fullerton Asset Management Limited(Management Company)
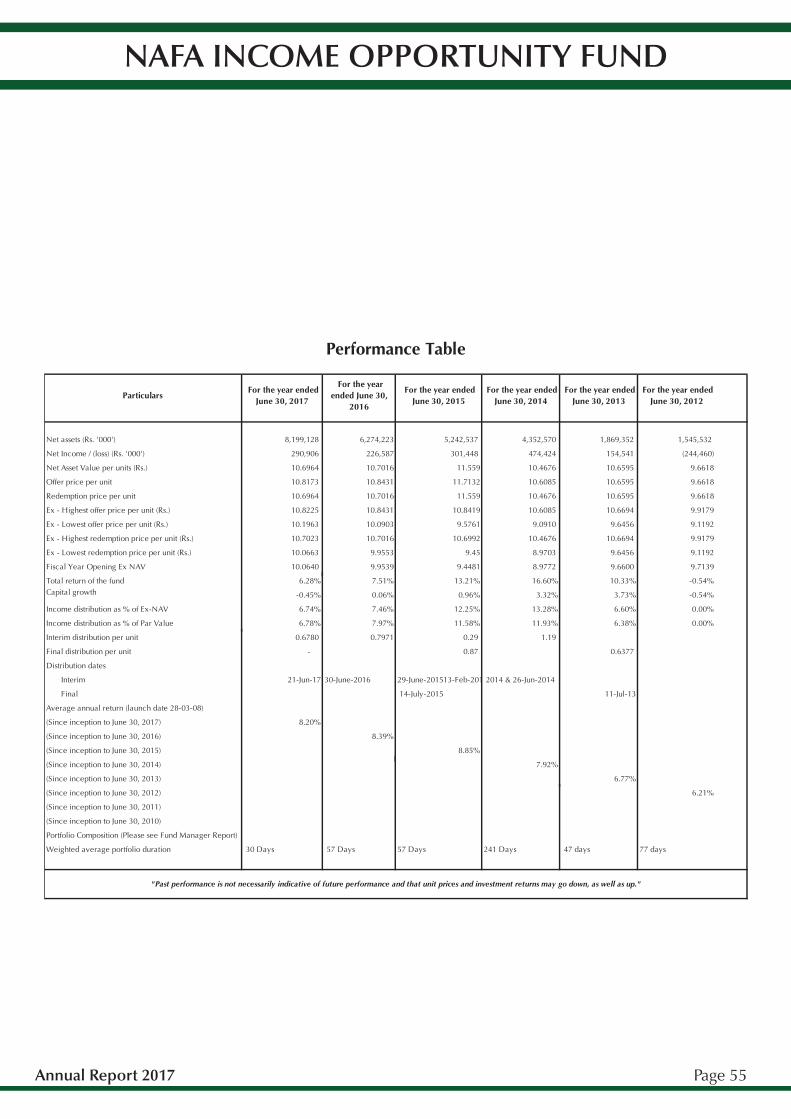
Annual Report 2017 Page 55
NAFA INCOME OPPORTUNITY FUND
Net assets (Rs. '000') 8,199,128 6,274,223 5,242,537 4,352,570 1,869,352 1,545,532
Net Income / (loss) (Rs. '000') 290,906 226,587 301,448 474,424 154,541 (244,460)
Net Asset Value per units (Rs.) 10.6964 10.7016 11.559 10.4676 10.6595 9.6618
Offer price per unit 10.8173 10.8431 11.7132 10.6085 10.6595 9.6618
Redemption price per unit 10.6964 10.7016 11.559 10.4676 10.6595 9.6618
Ex - Highest offer price per unit (Rs.) 10.8225 10.8431 10.8419 10.6085 10.6694 9.9179
Ex - Lowest offer price per unit (Rs.) 10.1963 10.0903 9.5761 9.0910 9.6456 9.1192
Ex - Highest redemption price per unit (Rs.) 10.7023 10.7016 10.6992 10.4676 10.6694 9.9179
Ex - Lowest redemption price per unit (Rs.) 10.0663 9.9553 9.45 8.9703 9.6456 9.1192
Fiscal Year Opening Ex NAV 10.0640 9.9539 9.4481 8.9772 9.6600 9.7139
Total return of the fund 6.28% 7.51% 13.21% 16.60% 10.33% -0.54%Capital growth -0.45% 0.06% 0.96% 3.32% 3.73% -0.54%
Income distribution as % of Ex-NAV 6.74% 7.46% 12.25% 13.28% 6.60% 0.00%
Income distribution as % of Par Value 6.78% 7.97% 11.58% 11.93% 6.38% 0.00%
Interim distribution per unit 0.6780 0.7971 0.29 1.19
Final distribution per unit - 0.87 0.6377
Distribution dates
Interim 21-Jun-17 30-June-2016 29-June-201513-Feb-2014, 30-Apr-2014 & 26-Jun-2014
Final 14-July-2015 11-Jul-13
Average annual return (launch date 28-03-08)
(Since inception to June 30, 2017) 8.20%
(Since inception to June 30, 2016) 8.39%
(Since inception to June 30, 2015) 8.85%
(Since inception to June 30, 2014) 7.92%
(Since inception to June 30, 2013) 6.77%
(Since inception to June 30, 2012) 6.21%
(Since inception to June 30, 2011)
(Since inception to June 30, 2010)
Portfolio Composition (Please see Fund Manager Report)
Weighted average portfolio duration 30 Days 57 Days 57 Days 241 Days 47 days 77 days
Performance Table
For the year ended June 30, 2012
"Past performance is not necessarily indicative of future performance and that unit prices and investment returns may go down, as well as up."
Particulars For the year ended
June 30, 2017
For the year ended June 30,
2016
For the year ended June 30, 2015
For the year ended June 30, 2014
For the year ended June 30, 2013