Nadia Campaniello University of Turin and Collegio Carlo ... · Nadia Campaniello University of...
23
Working Paper no. 116 Beggar-thy-neighbor in Art Consumption: Evidence from the “Bel Paese” Nadia Campaniello University of Turin and Collegio Carlo Alberto Matteo G. Richiardi University of Turin, and LABORatorio R. Revelli, Turin December, 2011 Laboratorio R. Revelli, Collegio Carlo Alberto Tel. +39 011 670.50.60 - Fax +39 011 670.50.61 Via Real Collegio, 30 - 10024 Moncalieri (TO) www.laboratoriorevelli.it - [email protected]
-
Upload
vuongnguyet -
Category
Documents
-
view
214 -
download
1
Transcript of Nadia Campaniello University of Turin and Collegio Carlo ... · Nadia Campaniello University of...

Working Paper no. 116
Beggar-thy-neighbor in Art Consumption: Evidence from the “Bel Paese”
Nadia Campaniello
University of Turin and Collegio Carlo Alberto
Matteo G. Richiardi
University of Turin, and LABORatorio R. Revelli, Turin
December, 2011
Laboratorio R. Revelli, Collegio Carlo Alberto Tel. +39 011 670.50.60 - Fax +39 011 670.50.61
Via Real Collegio, 30 - 10024 Moncalieri (TO) www.laboratoriorevelli.it - [email protected]

Beggar-thy-neighbor in Art Consumption:
Evidence from the “Bel Paese”
Nadia Campaniello a*
Matteo G. Richiardi b
a University of Turin and Collegio Carlo Alberto, Via Real Collegio 30,10024
Moncalieri (Turin), Italy b
University of Turin, Department of Economics, and LABORatorio Revelli
Centre for Employment Studies
* Corresponding author. E-mail: [email protected]
Abstract
This paper contributes to the relatively underdeveloped empirical literature on the
demand for culture, testing whether the existence of cultural goods located in one
region increases the demand for cultural goods in other regions. The measurement
of such spillovers is important to determine the efficient allocation of cultural
resources. We develop an empirical test based on aggregate data on the demand
and supply of tourism in twenty Italian regions, that we complement with survey
data collected data on museums’ visitors in the city of Turin (Piedmont, Italy). We
find strong evidence that local supply of culture stimulates the demand for foreign
cultural goods, which is coherent with the Theories of Addiction and of
“Learning by Consuming.” Given our data the two theories are observationally
equivalent. The positive spillovers are large and call for coordinated interventions
among the many local governments that finance the supply of cultural attractions.
Acknowledgements: We thank Alan Collins, Giovanni Mastrobuoni, Juan Prieto-
Rodriguez, Ilde Rizzo, Roberto Zanola and all the participants to the 4th European
Workshop on Applied Cultural Economics, Aydin, Turkey for their comments.

2
I. Introduction
Culture is widely known to be an important determinant for tourism
within a country (Richards, 2001). Municipalities compete to attract “culture
driven tourists” by increasing their supply of cultural goods. But they might not
realize that by offering more art they might also induce their own residents to
visit other places in search for more cultural goods.
In other words, the economic importance of culture lies not only in the
ability to attract visitors that spend their money in the region to buy many other
services and goods, but also, possibly, in the retention of outgoing tourism. The
availability of cultural attractions might induce residents to stay and spend
money within the borders of the local area instead of looking for culture abroad.
If this is the case, expenditures remaining in the local area could be attributable
to the local supply of cultural goods. But the local supply might also stimulate
the overall demand for culture, thus increasing the demand for outside cultural
goods. If this is the case, the cultural supply in the area of reference induces
residents to spend abroad part of their income that, otherwise, would have been
spent locally.
Hence, the question whether cultural goods located in one region increase
the demand for cultural goods in other regions has important implications on the
flows of cultural tourism, which in turn have a significant economic impact. The
net effect of the supply of cultural goods on tourist flows is a priori ambiguous,
its sign and size being ultimately an empirical question.
In this paper we investigate this issue using an empirical model based on
region-level data. We complement the analysis using field data that we collected

3
in three museums in 2007 in Turin1 (Piedmont, Italy). The scarce availability of
individual data is a well-known problem for empirical cultural economics
(Favaro and Frateschi, 2007).
The last twenty years have seen an increase in financing the arts with
local (C. Bodo, G. Stumpo, 2004) instead of national funding (Osservatorio per
lo Spettacolo, 2005). If there were spillovers policy makers would have to re-
consider this trend and push for coordinating at the central level the supply of
culture.
II. Theoretical framework
There are two competing theories that predict an increase in the demand
for foreign cultural goods due to the increase in their local supply: the “Theory of
Addiction” and the one of “Learning by Consuming.”
According to the former, people get addicted not only to alcohol, cocaine,
and cigarettes but also to work, eating, music, television, their standard of living,
other people, religion, and many other activities (Becker and Murphy, 1988). The
theory of addiction implies that the consumption of a good is deterministic and
the formation of habits predictable.
Throsby (1994) applied this theory to the arts saying that “the arts can be
distinguished in this theory by their being addictive, in the sense that an increase
1 Turin, the historical first capital of Italy, is the 4th largest Italian city (after Rome, Milan and
Naples), with a population of almost one million inhabitants. It is the capital of Piedmont, which
accounts for 8% of the Italian GDP. In the past decade, Turin has invested heavily in cultural
activities, regarded by policymakers as a fundamental element to foster tourism and to give a
renovated identity to the once mainly industrial city.
4
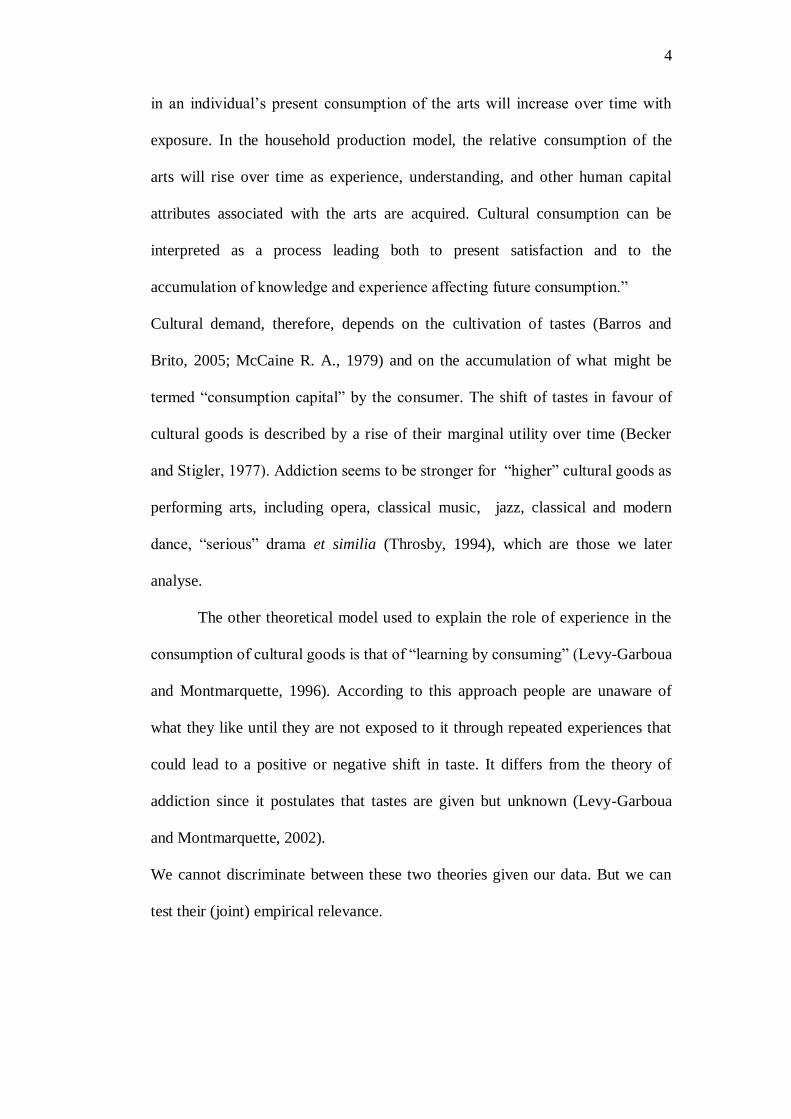
in an individual’s present consumption of the arts will increase over time with
exposure. In the household production model, the relative consumption of the
arts will rise over time as experience, understanding, and other human capital
attributes associated with the arts are acquired. Cultural consumption can be
interpreted as a process leading both to present satisfaction and to the
accumulation of knowledge and experience affecting future consumption.”
Cultural demand, therefore, depends on the cultivation of tastes (Barros and
Brito, 2005; McCaine R. A., 1979) and on the accumulation of what might be
termed “consumption capital” by the consumer. The shift of tastes in favour of
cultural goods is described by a rise of their marginal utility over time (Becker
and Stigler, 1977). Addiction seems to be stronger for “higher” cultural goods as
performing arts, including opera, classical music, jazz, classical and modern
dance, “serious” drama et similia (Throsby, 1994), which are those we later
analyse.
The other theoretical model used to explain the role of experience in the
consumption of cultural goods is that of “learning by consuming” (Levy-Garboua
and Montmarquette, 1996). According to this approach people are unaware of
what they like until they are not exposed to it through repeated experiences that
could lead to a positive or negative shift in taste. It differs from the theory of
addiction since it postulates that tastes are given but unknown (Levy-Garboua
and Montmarquette, 2002).
We cannot discriminate between these two theories given our data. But we can
test their (joint) empirical relevance.

5
III. Empirical analysis
We use aggregate data on tourism inflows and outflows for the twenty
Italian regions, complement them with other geographic data, and with data on
the supply of cultural goods, in order to estimate a model of tourism demand.
Tourist flows consist of an origin, the demand side, and a destination, the supply
side.
For our empirical application we need to define cultural tourism (Mchone
and Rungeling, 1999). Most authors (McKercher and Chow So Ming, 2001;
Burns and McGettigan, 2001; Mchone and Rungeling, 1999; Siberberg, 1995)
define cultural tourism as visits by people from outside the host community
motivated by the cultural supply, e.g. festivals, performances, events and heritage
attractions like museums, galleries, architecture, and historic sites. We adopt this
definition.
Despite the universally recognized importance of culture as a source of
attraction for tourism, data on cultural tourism are still very limited. The main
reason is that international institutions such as the World Tourism Organization,
the Organisation for Economic Co-operation and Development, and the
European Commission, that developed methodological recommendations for the
implementation of Tourism Satellite Accounts (WTO, 2000), do not distinguish
between “leisure” and “culture” as a motivation for tourism.2 Hence, information
2 The classification of the different motivations for travelling is (i) leisure, recreation and
holidays, (ii) visiting friends and relatives, (iii) business and professional travel, (iv) health
treatment, (v) religion, pilgrimages and other purposes.

6
on the relevance of cultural tourism is scattered and indirect, and often based on
ad hoc surveys.3
To isolate the effect of the cultural goods on tourism we control for
factors, i.e. income, landscape features, etc., that might be correlated with both,
the supply of culture and with tourism, that would otherwise bias our result.
Lim (1997) compares all methods used in around 100 published studies of
empirical international tourism demand models and identifies the most widely
used specification. The dependent variable is generally classified as tourist
arrivals and/or departures, tourist expenditures and/or receipts and length of stay,
while the explanatory variables are usually income, transportation costs, relative
prices, exchange rates and qualitative factors such as destination attractiveness,
tourists attributes, the presence of political, social, and sport events.
3 Different multi-choice surveys show that about 25% of European holiday-makers choose towns
of art, where culture is presumably an important factor of attraction, as their destination (Bellini
et al., 2007). Following a survey of the European Commission, roughly 30% of tourist
destinations are chosen based on the presence of heritage sites, and this number increases up to
45-50% if the wider cultural sector, including festivals and other important cultural events, are
considered (Klein, 2001). According to other estimates, more than 50% of tourist activity in
Europe is driven by cultural heritage (Europa Nostra, 2006). Of course, the importance of cultural
tourism differs greatly depending on the area considered. Culture appears to be the single most
important motivation for city trips (WTO-ETC, 2005 ), with a steady increase in the proportion of
cultural tourists; however, only a minor share of visitors to cultural sites (around 20%) report
culture as the prime motivation for their journey (ATLAS Cultural Tourism Project, 2007). In a
related study, the local Chamber of Commerce in Turin, Italy, estimates that cultural tourism
represents 36.4 percent of the total flow of tourists in the area (CCIAA, 2003).

7
In this paper tourism demand is measured by the region by region-level
tourist flows. Hence, we have a 20 by 20 matrix, i.e. 400 observations. We allow
for intra-regional (own) tourism as we have data about it too.
The population of the region of origin represents the potential demand for
tourism. The population of the region of destination is likely to influence its
attractiveness as well, at least through visits by friends and relatives.
The budget constraint of tourists depends on the distribution of income in
the region of origin, thus we control for their average income and for their
poverty index. We also include two other socio-demographic variables of the
region of origin in the model: the level of education, measured by the percentage
of people with at least a middle school diploma, and the demographic
dependency ratio, equal to the ratio between the population aged 65 or over and
the population aged 20-64. The level of education is expected to be positively
correlated with tourism, while the demographic dependency ratio has an a priori
ambiguous effect on tourist flows, (travelling for business being more likely for
prime age individuals, while pilgrimages being more frequently associated with
the elderly). The price of tourism is generally based on travel cost and on relative
prices, that is the difference in the price levels in the regions of origin and
destination. We measure travel cost with the distance between the capital cities
of the regions of origin and destination (Walsh, 1997). Since it is plausible that
the relation is not linear, we control for a second order polynomial. To proxy for
relative prices across regions we use the ratio between their Parity Purchase
Power Indices. Destination attractiveness like landscape characteristics
(possibility of sea and mountain tourism and presence of natural parks) can
influence the decision to spend time in a region. The first two characteristics are

8
measured by two dummy variables, while natural parks are measured by their
surface. We use three different variables to measure cultural endowment:
museums, theatrical performances, concerts.
Table 1 shows the descriptive statistics of the variables and the appendix
the data source.
<Table 1>
The Table outlines some characteristics of the Italian regions: population
varies considerably; most have access to the sea but just a few have mountains;
income is distributed unevenly, in particular, the South is relatively poor (the
poverty index is as high as 31%) and the North is relatively rich, despite similar
levels of education; Italy’s dramatic population aging drives the dependency ratio
up to almost 57%.
Model specification
Using the origin and destination matrix of the tourist flows, we estimate
an econometric model where the logarithm of the tourist flows from region i to
region j is a function of the logarithm of cultural endowments of the two regions,
controlling for population, demographic characteristics, income, distance
between the capital cities, and characteristics of the territory (possibility of sea
and mountain tourism, the dimension of natural parks). The econometric
specification chosen is a variation of the gravity equation model, a spatial model
where the degree of interaction between two geographic areas varies directly
with the size of population in the two areas and inversely with the square of the
distance between them (Witt and Witt, 1995).

9
Tij = f(Xi, Xj, Cik, Cjk, dij)
where i is the region of origin, j the region of destination and k the type
of cultural good taken into account in the investigation (museums, theatrical
performances and concerts). Tij is the tourist flow from region i (origin) to region
j (destination), Ci and Cj are, respectively, indicators of the cultural endowment
of the region of origin and destination (theatres, concerts, museums), Xi and Xj
are other characteristics of the two regions (like income, opportunity for
mountain or sea tourism, etc.), and dij is the distance between the capital cities in
the two regions.
Our focus is on the sign of the coefficients of cultural endowments. A
positive sign for Ci indicates that a higher cultural supply in the region of origin
increases the outgoing tourist flows; on the contrary, a negative sign indicates
that the higher the cultural supply of the region of origin, the lower the outgoing
tourist flows.
We use the following log-linear specification:
Log Tij = β0 + β1 Popi + β2 Popj + β3 Seaj+ β4 Mountj + β5 Inci + β6 Incj +β7 Educi + + β8 Educi
+ β9 Povi + β10 Povij + β11 CPIi / CPIj + β12 Depi + β13 Depi + β14 Dist + + β15 Dist^2 +
+ β15 Parki + β16 Parkj + β17 Log Ci + β18 Log C j+ uij
where:
Pop is the population of the region (divided by 100 000); Sea a dummy variable
for the presence of sea; Mount a dummy variable for the presence of mountains;
Inc measures the region’s average income (in Euro, divided by 100 000); Educ
measures the share of people with at least middle school education; Pov is the
Poverty Index, CPIi / CPIj is the ratio between the Power Purchase Parity in the

10
region i and that of region j; Dep is the dependency ratio; Dist is the distance
between the capital cities in the two regions (in km,divided by 100); Dist2 its
squared value; Park measures the surface covered by parks (in hectares, divided
by 100 000); C measures the supply of different types of cultural goods; and,
finally, u is a stochastic disturbance term. We use three different proxies for C,
the supply of museums, theatrical performances, and concerts. Since these three
cultural goods are highly correlated with each other we cannot simultaneously
control for all three of them, but later we use an aggregated measure, a cultural
index, which is a normalized sum of the three.
Given the log-log specification the coefficients of the variables
representing the cultural endowments can be interpreted in terms of elasticities.
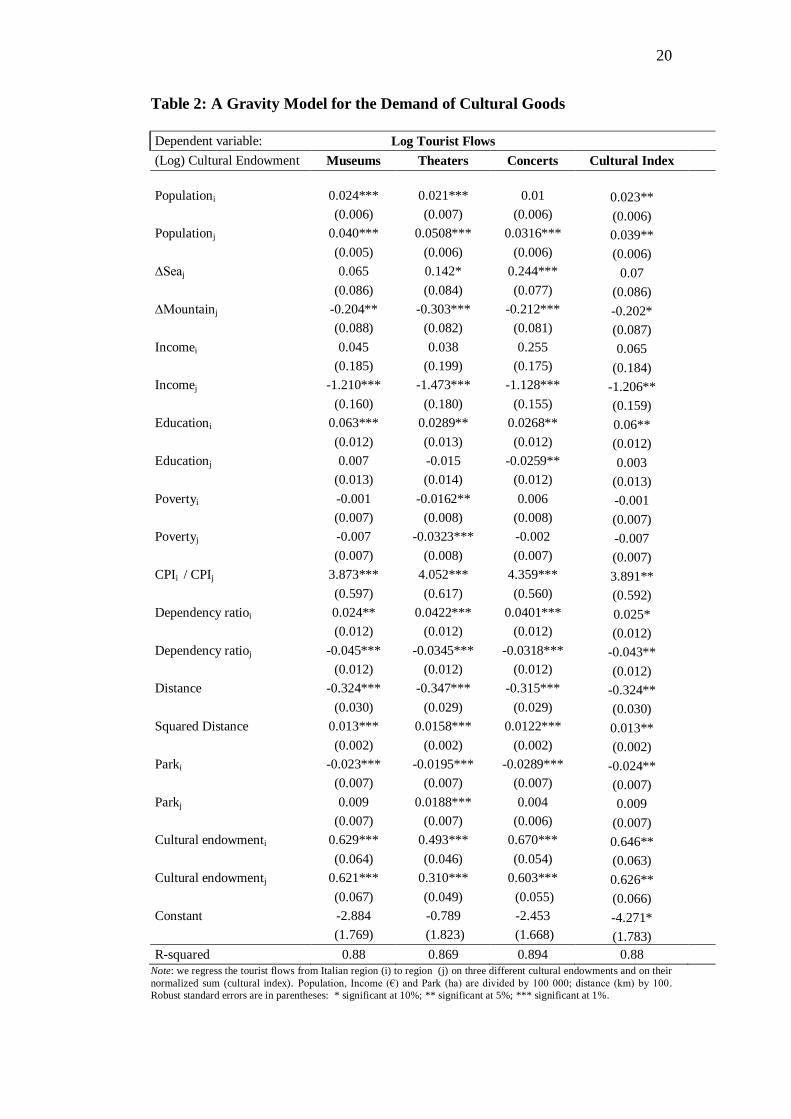
The results of the regressions are reported in Table 2.
<Table 2>
IV. Discussion of the results
The results show the existence of spillovers between foreign and local
consumption of cultural goods, for all the typologies of cultural goods selected
(museums, theatrical performances, concerts) and for their sum (cultural index).
In the equations, the elasticities of foreign (origin) and local (destination) cultural
goods are always close in value: respectively, 0.63 and 0.62 for museums, 0.49
and 0.31 for theatrical performances, 0.67 and 0.60 for concerts, 0.65 and 0.63
for the cultural index, and we could hardly reject their equality. In other words, a
1 percentage increase in the cultural endowments in the region of origin has on

11
the flow of tourists the same effect as a 1 percentage increase in the cultural
endowments in the region of destination!
All measures appear to be good proxies for the supply of culture, which is also
why their normalized sum gives very similar results.
We now briefly comment the estimates for the coefficients of the other
variables. Population of both the region of origin and destination is significant
and with the expected positive sign. The ratio between the Purchasing Power
Parity in the region of origin and that of destination has the expected positive
sign. The higher the difference in prices the higher the tourist flows from the
most expensive to the least one. The level of education of the region of origin is
significant and positively correlated with the tourist flows. The demographic
dependence ratio is significant and positive for the region of origin and negative
for that of destination. This may be due to the fact that retired people travel more
(for all motivations for tourism except business), while a higher share of active
population is likely to characterize a region as more attractive as a business
destination. Distance discourage tourism but, as predicted by the gravitational
theory, with decreasing marginal effects. Landscape characteristics are
significant in all the regressions. Being a maritime destination increases inflows,
while the presence of mountains has a negative effect. This reflects the fact that
the biggest flows occur in summertime, when sea tourism is more important. A
low endowment of natural parks encourages outflows, while a high endowment
encourages inflows.

12
V. Evidence from the survey in the museums
Despite these very strong results our measure of cultural tourism is not
perfect. In order to have a better measure of cultural tourism between April and
June 2007 we surveyed visitors to three different museums in Turin: the Museo
Nazionale del Cinema (National Cinema Museum), the Museo Egizio (Egyptian
Art Museum) and the Palazzo Bricherasio (which hosted a temporary art
exhibition – on the Macchiaioli movement at the time). The museums were
chosen on the basis of their prominence: the first two are the most famous of
Turin, while Palazzo Bricherasio hosted, in the year of the collection of the data,
the most important temporary art exhibition of the city.
The cost of running a survey is high, which is why we had to focus on a
few museums located in just one city.
People interviewed were asked about where they came from (the city of
Turin, other areas of the province of Turin, other areas of the Piedmont region,
other Italian regions, other countries), the purpose of their visit (Tourism,
Job/Business, Studying, Visiting relatives/friends), the expected length of their
stay, the expected number of art exhibitions and museums to be visited during
their stay. In total, we collected more than 12,000 questionnaires: 4,498 in the
Palazzo Bricherasio, 1,957 in the Museo Nazionale del Cinema, and the rest in
the Museo Egizio.
If we divide the visitors according to their type we have that the total
number of visitor V, might (T) or might not (O) be in Turin just because of
tourism:
V = T + O.

13
Starting from the consideration that all the people who declare to be
tourists are almost certainly cultural tourists we can calculate the probability of
being a cultural tourist:4
V
TT Pr .
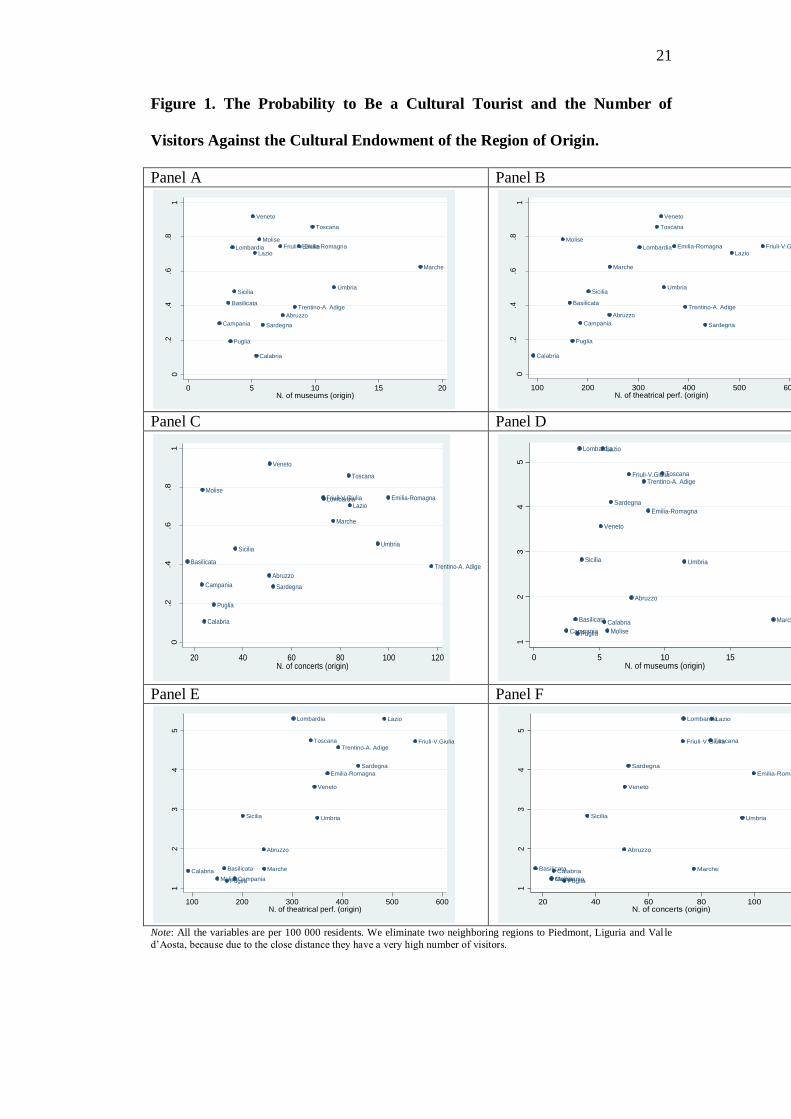
In Figure 1 (Panel A-C) we plot this probability against cultural
endowment of the region of origin and find a strong and positive correlation.
Regions that supply more culture generate visitors that are more likely to be
cultural tourists, which we interpret as additional evidence for the existence of
spillovers.
The number of visitors (per capita) (V) is also positively correlated with
cultural endowment (Figure 1, Panel D-F), mainly driven by the correlation
between strictly speaking cultural tourists and cultural endowment.
<Figure 1>
Using more precise measures of cultural tourism based on field data leads
to the same results found in Section IV.
VI. Conclusions
In this paper we analyse the relationship between local supply and foreign
demand of cultural goods. We find that the more people are exposed to the arts in
their region the more they will travel to other regions to satisfy their need for the
arts.
4 City tourism is generally “art oriented,” and Turin has no sea. The mountains are quite close,
but in April it is too late to ski
14
The strategy we use suffers from not distinguishing between cultural
tourism and other forms of tourism, thus requiring the inclusion of controls for
explaining the different touristic motivations. Using more precise measures of
cultural tourism, based on field work done in three different museums we
confirm the previous findings.
Our finding that the local cultural supply stimulates the demand for
culture, increasing the demand for outside cultural goods and inducing the
residents to spend abroad a part of income that, without the cultural supply,
would probably be spent locally in other leisure activities, suggests that a
coordination strategy across regions could be beneficial. Moreover our result also
brings support to the idea of national funding of the arts. This calls for reverting
the current trend towards local funding.
15
Bibliography
ATLAS Cultural Tourism Project (2007), Summary Report 2007,
www.tram-research.com/atlas
Barros, C. and Brito P. (2005), Learning by consuming and the dynamics
of the demand and prices of cultural goods, Journal of Cultural Economics, 29,
pp. 83-106.
Becker, G. S. and Murphy, K. M. (1988), A Theory of Rational
Addiction, Journal of Political Economy, 96-4, pp. 675-700.
Becker G. S. and Stigler G. J. (1977), De gustibus non est disputandum,
The American Economic Review, 67-2, pp. 76-90
Bellini E., Gasparino U., Del Corpo B., Malizia W. (2007), Impact of
Cultural Tourism upon Urban Economies: An Econometric Exercise, Fondazione
Eni Enrico Mattei, Nota di lavoro 85
Bodo, C. and Stumpo, G. (2004), “Le risorse finanziarie per lo
spettacolo” in Rapporto sull’economia della cultura in Italia – 1990-2000, C.
Bodo, C. Spada (eds.), Il Mulino, Bologna, pp. 365-374
Burns, K. and McGettigan, F. (2001), Clonmacnoise: a Monastic Site,
Burial Ground and Tourist Attraction, in Cultural attractions and European
Tourism, pp. 135-158. New York: CABI Publishing.
16
CCIAA, Camera di Commercio, Industria, Artigianato e Agricoltura di
Turin (2003), Turismo a Turin: perché si soggiorna e quanto si spende, Turin,
CCIAA
Chow So-Ming, B., McKercher, B. (2001), Cultural distance and
participation in cultural tourism, Pacific Tourism Review, 5, pp. 23-32.
Europa Nostra (2006), The encouragement and control of cultural tourism
in Europe position paper, http://www.europanostra.org/downloads/documents
Favaro, D. and Frateschi C. (2007), A discrete choice model of
consumption of cultural goods: the case of music, Journal of Cultural
Economics, 31, pp. 205-234.
Klein R. (2001), Public policies and cultural tourism: EU activities.
Proceedings of the 1st Conference on Cultural Tourism Economy and Values in
the XXI Century, Barcelona, March 29–31
Levy-Garboua, L. (1996), A microeconometric Study of Theatre Demand,
Journal of Cultural Economics, 20, pp. 25-50.
Lévy-Garboua, L. and Montmarquette, C. (2002), The demand for the art,
Centre interuniversitaire de recherché en analyse des organizations Scientific
Series, 10, pp. 1-18

17
Lim, C. (1997), Review of international tourism demand models, Annals
of Tourism Research, 24-4, pp. 835-849.
Mchone W. Warren, Rungeling B. (1999), Special cultural events: do
they attract leisure tourists?, Hospitality Management, 18, pp. 215-219.
McCaine R.A. (1979), Reflections on the cultivation of taste, Journal of
Cultural Economics, 3-1, pp. 30-52.
Osservatorio per lo Spettacolo (2005), Relazione sull’Utilizzazione del
Fondo Unico per lo Spettacolo, pp. 375
Richards, R. (2001), European Cultural Attractions: Trends and Prospects
in Cultural attractions and European Tourism, pp. 55-69.
Throsby, D. (1994), The production and consumption of the arts: a view
of cultural economics, Journal of Economic Literature, 32-1, pp. 1-29.
Walsh, M. (1997), Demand analysis in Irish tourism, Journal of the
Statistical and Social Inquiry Society of Ireland, Vol. XXVII- IV, pp 1-35.
Witt, S.F. and Witt, C.A. (1995), Forecasting tourism demand: A review
of empirical research, International Journal of Forecasting, 11, pp. 447-475.

18
WTO, World Tourism Organisation (2000), Tourism Satellite Account
(TSA): Methodological References, Madrid, WTO
WTO-ETC (2005), City Tourism and Culture. The European Experience,
ETC Research Report 2005/1

19
Table 1. Summary statistics
Variable Obs Mean Std. Dev. Min Max
Log Tourist Flows 400 10.633 1.527 4.691 14.609
Population
(divided by 100 000)
400 28.497 22.545 1.195 90.325
Sea (dummy) 400 0.7 0.458 0 1
Mountain (dummy) 400 0.35 0.477 0 1
Income
(divided by 100 000)
400 0.707 0.681 0.0394 2.962
Education 400 72.942 2.849 69.11 79.47
Poverty Index 400 13.507 8.901 4.01 31.51
CPIi / CPIj 400 1.005 0.104 0.776 1.287
Dependency Ratio 400 50.185 3.331 42.75 56.71
Distance
(in km and divided by 100)
400 5.688 3.566 0 16.42
Squared Distance (Km) 400 45.038 51.763 0 269.616
Park
(in He divided by 100 000)
400 2.866 3.829 0.0645 17.999
Log Museums 400 4.780 .8724 2.890 5.852
Log Theatrical Performances 400 8.495 1.248 5.303 10.216
Log Concerts 400 6.927 1.175 4.317 8.797
20
Table 2: A Gravity Model for the Demand of Cultural Goods
Dependent variable: Log Tourist Flows
(Log) Cultural Endowment Museums Theaters Concerts Cultural Index
Populationi 0.024*** 0.021*** 0.01 0.023**
(0.006) (0.007) (0.006) (0.006)
Populationj 0.040*** 0.0508*** 0.0316*** 0.039**
(0.005) (0.006) (0.006) (0.006)
∆Seaj 0.065 0.142* 0.244*** 0.07
(0.086) (0.084) (0.077) (0.086)
∆Mountainj -0.204** -0.303*** -0.212*** -0.202*
(0.088) (0.082) (0.081) (0.087)
Incomei 0.045 0.038 0.255 0.065
(0.185) (0.199) (0.175) (0.184)
Incomej -1.210*** -1.473*** -1.128*** -1.206**
(0.160) (0.180) (0.155) (0.159)
Educationi 0.063*** 0.0289** 0.0268** 0.06**
(0.012) (0.013) (0.012) (0.012)
Educationj 0.007 -0.015 -0.0259** 0.003
(0.013) (0.014) (0.012) (0.013)
Povertyi -0.001 -0.0162** 0.006 -0.001
(0.007) (0.008) (0.008) (0.007)
Povertyj -0.007 -0.0323*** -0.002 -0.007
(0.007) (0.008) (0.007) (0.007)
CPIi / CPIj 3.873*** 4.052*** 4.359*** 3.891**
(0.597) (0.617) (0.560) (0.592)
Dependency ratioi 0.024** 0.0422*** 0.0401*** 0.025*
(0.012) (0.012) (0.012) (0.012)
Dependency ratioj -0.045*** -0.0345*** -0.0318*** -0.043**
(0.012) (0.012) (0.012) (0.012)
Distance -0.324*** -0.347*** -0.315*** -0.324**
(0.030) (0.029) (0.029) (0.030)
Squared Distance 0.013*** 0.0158*** 0.0122*** 0.013**
(0.002) (0.002) (0.002) (0.002)
Parki -0.023*** -0.0195*** -0.0289*** -0.024**
(0.007) (0.007) (0.007) (0.007)
Parkj 0.009 0.0188*** 0.004 0.009
(0.007) (0.007) (0.006) (0.007)
Cultural endowmenti 0.629*** 0.493*** 0.670*** 0.646**
(0.064) (0.046) (0.054) (0.063)
Cultural endowmentj 0.621*** 0.310*** 0.603*** 0.626**
(0.067) (0.049) (0.055) (0.066)
Constant -2.884 -0.789 -2.453 -4.271*
(1.769) (1.823) (1.668) (1.783)
R-squared 0.88 0.869 0.894 0.88
Note: we regress the tourist flows from Italian region (i) to region (j) on three different cultural endowments and on their
normalized sum (cultural index). Population, Income (€) and Park (ha) are divided by 100 000; distance (km) by 100.
Robust standard errors are in parentheses: * significant at 10%; ** significant at 5%; *** significant at 1%.
21
Figure 1. The Probability to Be a Cultural Tourist and the Number of
Visitors Against the Cultural Endowment of the Region of Origin.
Panel A Panel B
Abruzzo
Basilicata
Calabria
Campania
Emilia-RomagnaFriuli-V.GiuliaLazio
Lombardia
Marche
Molise
Puglia
Sardegna
Sicilia
Toscana
Trentino-A. Adige
Umbria
Veneto
0.2
.4.6
.81
P(c
ultura
l to
uri
st)
0 5 10 15 20N. of museums (origin)
Abruzzo
Basilicata
Calabria
Campania
Emilia-Romagna Friuli-V.GiuliaLazio
Lombardia
Marche
Molise
Puglia
Sardegna
Sicilia
Toscana
Trentino-A. Adige
Umbria
Veneto
0.2
.4.6
.81
P(c
ultura
l to
uri
st)
100 200 300 400 500 600N. of theatrical perf. (origin)
Panel C Panel D
Abruzzo
Basilicata
Calabria
Campania
Emilia-RomagnaFriuli-V.GiuliaLazio
Lombardia
Marche
Molise
Puglia
Sardegna
Sicilia
Toscana
Trentino-A. Adige
Umbria
Veneto
0.2
.4.6
.81
P(c
ultura
l to
uri
st)
20 40 60 80 100 120N. of concerts (origin)
Abruzzo
Basilicata Calabria
Campania
Emilia-Romagna
Friuli-V.Giulia
LazioLombardia
Marche
MolisePuglia
Sardegna
Sicilia
ToscanaTrentino-A. Adige
Umbria
Veneto1
23
45
Vis
itors
(pe
r ca
pita
)
0 5 10 15 20N. of museums (origin)
Panel E Panel F
Abruzzo
BasilicataCalabria
Campania
Emilia-Romagna
Friuli-V.Giulia
LazioLombardia
Marche
MolisePuglia
Sardegna
Sicilia
ToscanaTrentino-A. Adige
Umbria
Veneto
12
34
5
Vis
itors
(pe
r ca
pita
)
100 200 300 400 500 600N. of theatrical perf. (origin)
Abruzzo
BasilicataCalabria
Campania
Emilia-Romagna
Friuli-V.Giulia
LazioLombardia
Marche
MolisePuglia
Sardegna
Sicilia
ToscanaTrentino-A. Adige
Umbria
Veneto
12
34
5
Vis
itors
(pe
r ca
pita
)
20 40 60 80 100 120N. of concerts (origin)
Note: All the variables are per 100 000 residents. We eliminate two neighboring regions to Piedmont, Liguria and Val le
d’Aosta, because due to the close distance they have a very high number of visitors.

22
Data Appendix
Variable Source
Population Reconstruction of the resident population- Regional demographic
balance by gender from 20th October 1991 to 21st October 2001 -
ISTAT
Income of the region ISTAT –2005
Education
Health for all Italia –2006
http://www.istat.it/sanita/Health/
Poverty Index
Health for all Italia- 2006
http://www.istat.it/sanita/Health/
CPIi / CPIj ISTAT
Dependency demographic ratio
Health for all-Italia -Year 2006
http://www.istat.it/sanita/Health/
Distance from the chief city of
the regions
Touring Club Italiano, Italian Road Atlas, 2004
Surface covered by reserves
Ministry of Environment and Natural Resources Protection –
Direction for the Nature Protection - 2003
Theatrical performances and
concert
Data on Performances 2006 –– SIAE
http://www.siae.it/statistica.asp?link_page=Statistica_BibliotecaDell
oSpettacoloDal2006.htm
Museums
Museionline http://www.museionline.it/