
NACP’s Mid-Continent Intensive: Atmospheric Resultsring2.psu.edu/NACP09_day2_Miles_132.pdf · •...
45
Natasha Miles, Arlyn Andrews, Kathy Corbin, Kenneth Davis, Scott Denning, Douglas Martins, Scott Richardson, Paul Shepson, and Colm Sweeney NACP All-Investigators Meeting: 18 Feb 2009 NACP’s Mid-Continent Intensive: Atmospheric Results
Transcript of NACP’s Mid-Continent Intensive: Atmospheric Resultsring2.psu.edu/NACP09_day2_Miles_132.pdf · •...
Natasha Miles, Arlyn Andrews, Kathy Corbin, Kenneth Davis, Scott Denning, Douglas Martins, Scott Richardson, Paul Shepson, and Colm Sweeney
NACP All-Investigators Meeting: 18 Feb 2009
NACP’s Mid-Continent Intensive: Atmospheric Results
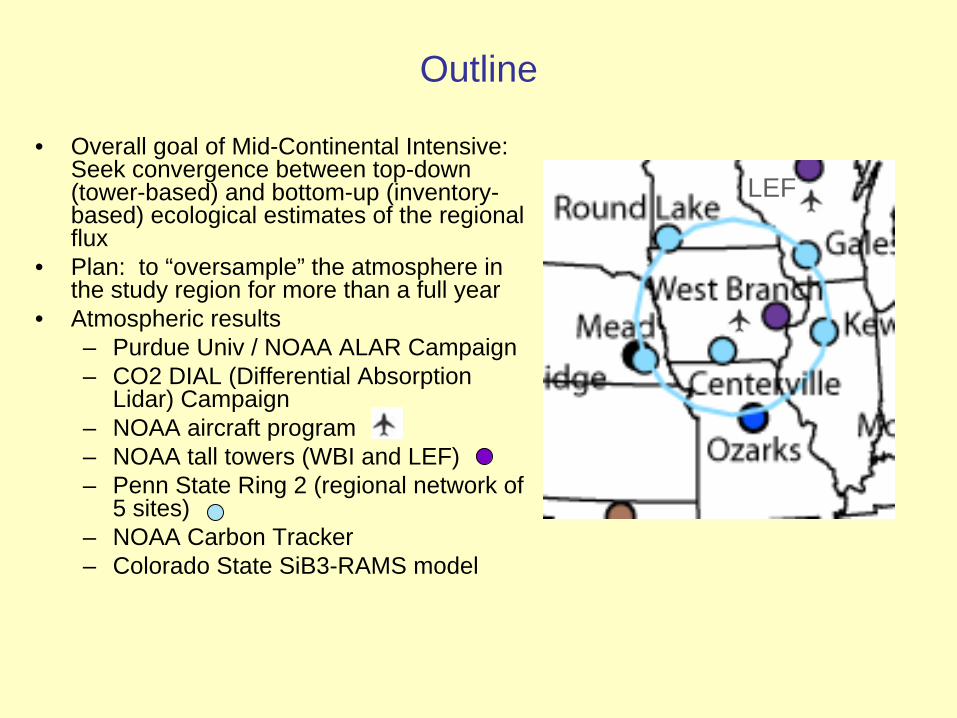
Outline
• Overall goal of Mid-Continental Intensive: Seek convergence between top-down (tower-based) and bottom-up (inventory- based) ecological estimates of the regional flux
• Plan: to “oversample” the atmosphere in the study region for more than a full year
• Atmospheric results– Purdue Univ / NOAA ALAR Campaign– CO2 DIAL (Differential Absorption
Lidar) Campaign– NOAA aircraft program– NOAA tall towers (WBI and LEF)– Penn State Ring 2 (regional network of
5 sites)– NOAA Carbon Tracker– Colorado State SiB3-RAMS model
LEF
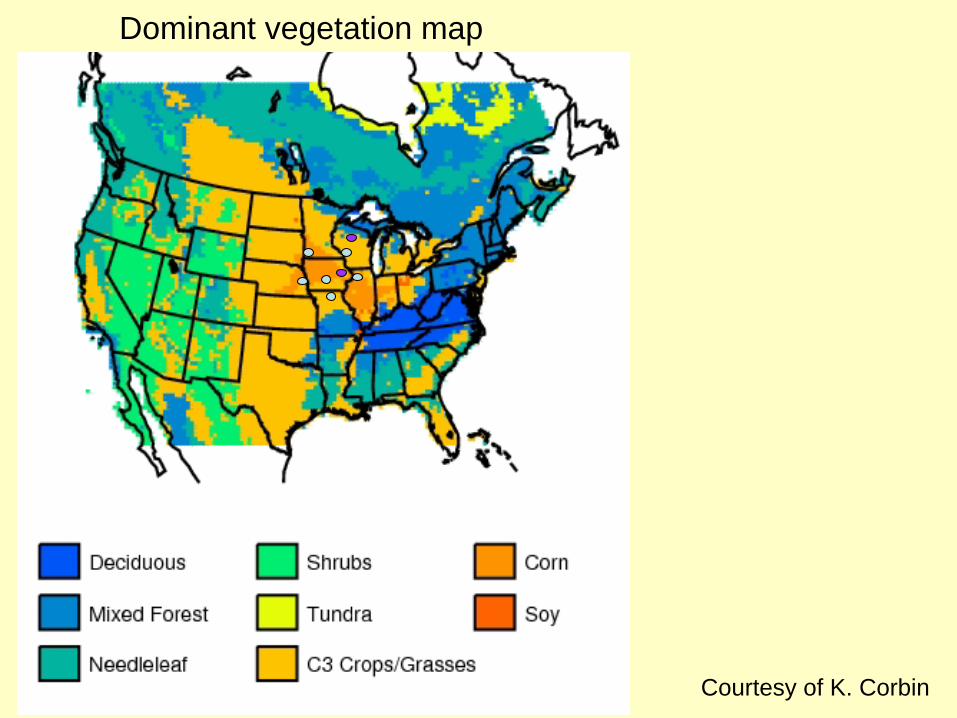
Courtesy of K. Corbin
Dominant vegetation map
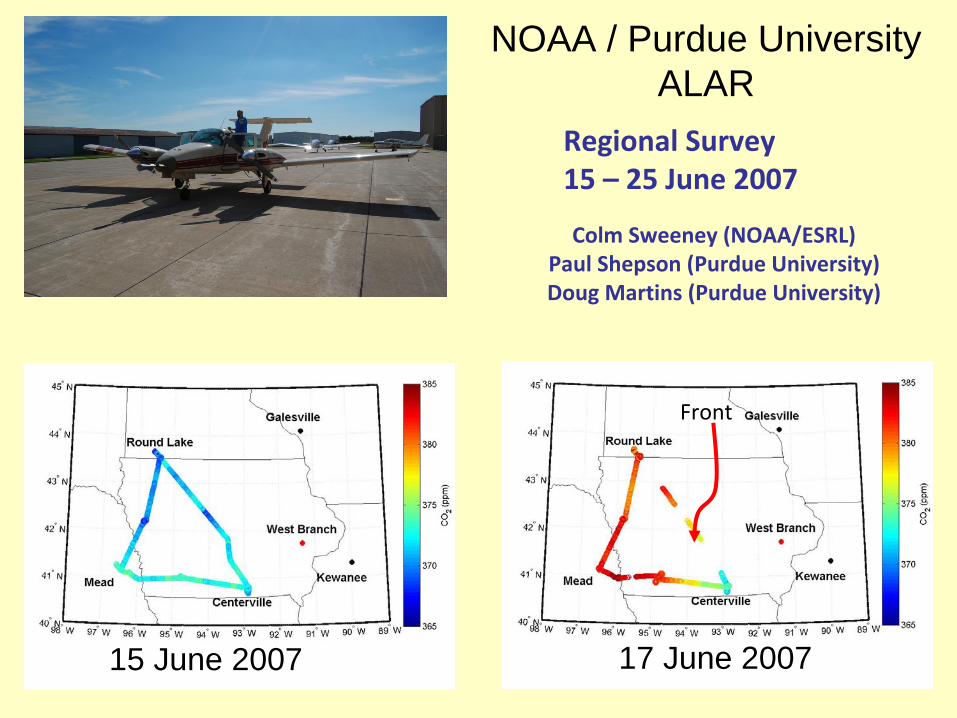
NOAA / Purdue University ALAR
Regional Survey15 – 25 June 2007
Colm
Sweeney (NOAA/ESRL)Paul Shepson
(Purdue University)Doug Martins (Purdue University)
Front
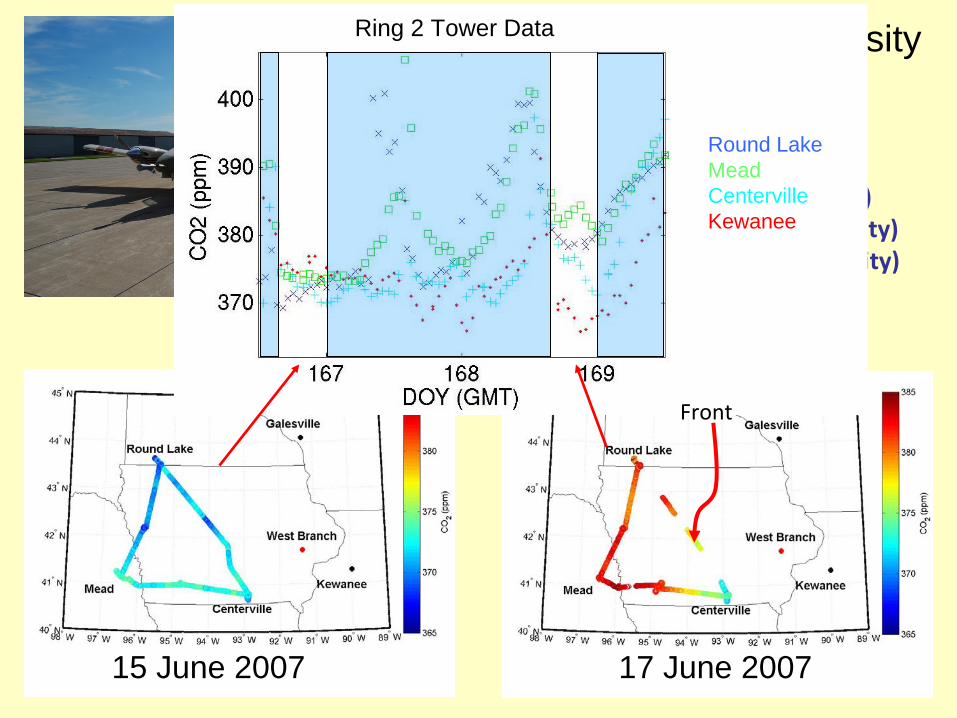
15 June 2007 17 June 2007
NOAA / Purdue University ALAR
Regional SurveyColm
Sweeney (NOAA/ESRL)Paul Shepson
(Purdue University)Doug Martins (Purdue University)
15 June 2007 17 June 2007
Round LakeMeadCentervilleKewanee
Ring 2 Tower Data
Front
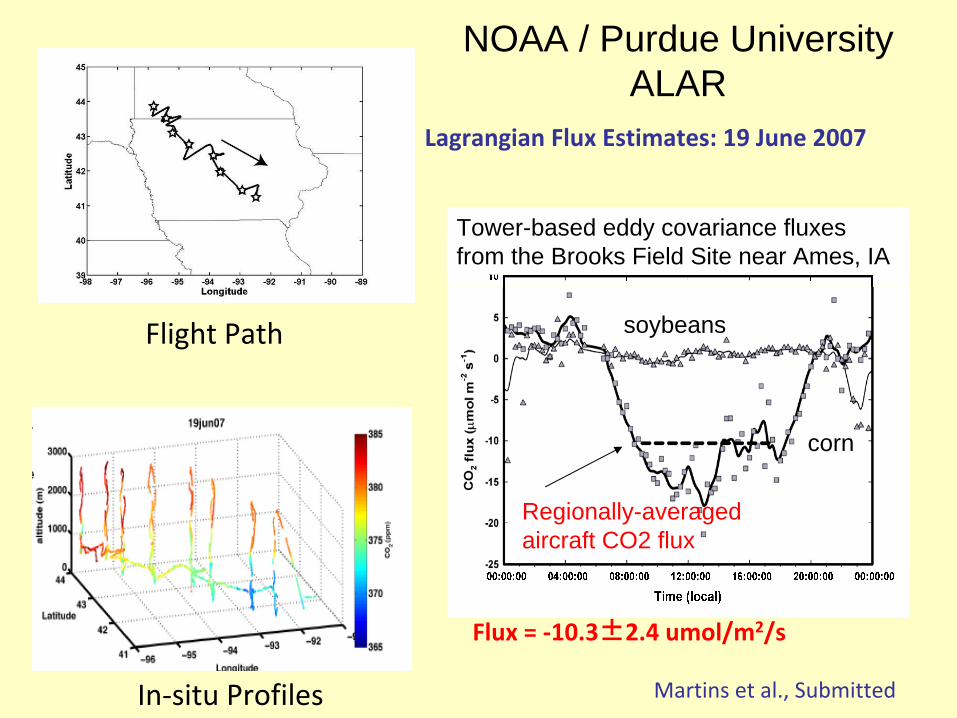
NOAA / Purdue University ALAR
Lagrangian
Flux Estimates: 19 June 2007
In‐situ Profiles
Flight Path
Flux = ‐10.3±2.4 umol/m2/s
Martins et al., Submitted
Regionally-averaged aircraft CO2 flux
soybeans
corn
Tower-based eddy covariance fluxes from the Brooks Field Site near Ames, IA

7
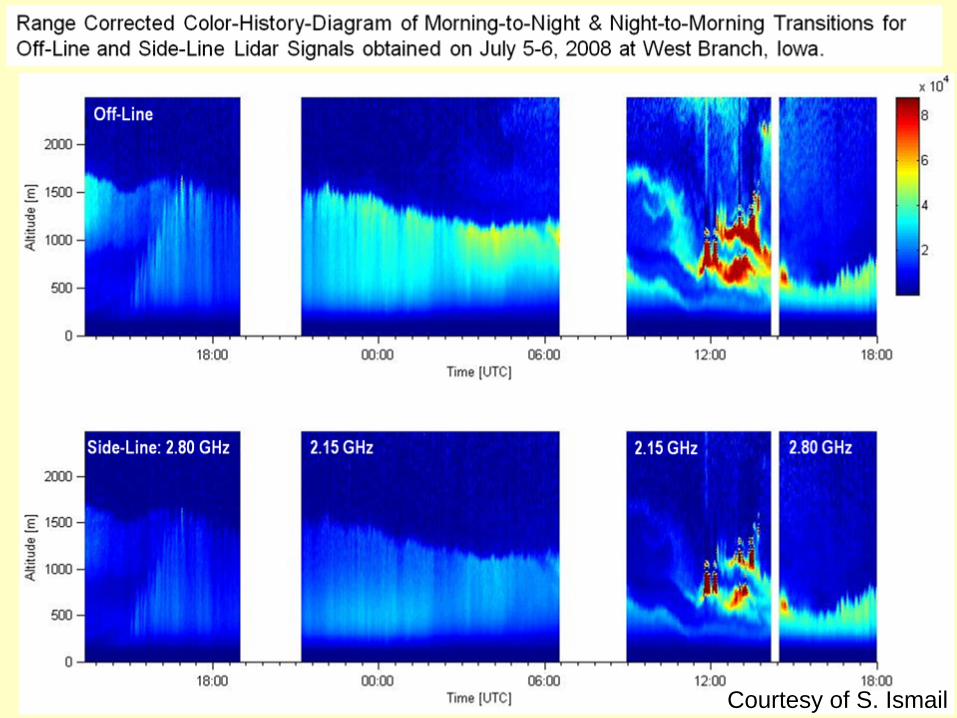
System Deployment at West Branch, IA(June 18 – July 7, 2008)
• Field experiment conducted at West Branch, IA
• NASA Differential Absorption Lidar (DIAL) system, installed in a trailer
• CO2 cross section computed using meteorological data obtained from balloon sonde
• DIAL standard error, compared with WBI tall tower (morning averages)
• 4.7 ppm at 379 m AGL• 3.4 ppm at 99 m AGL
Courtesy of S. Ismail
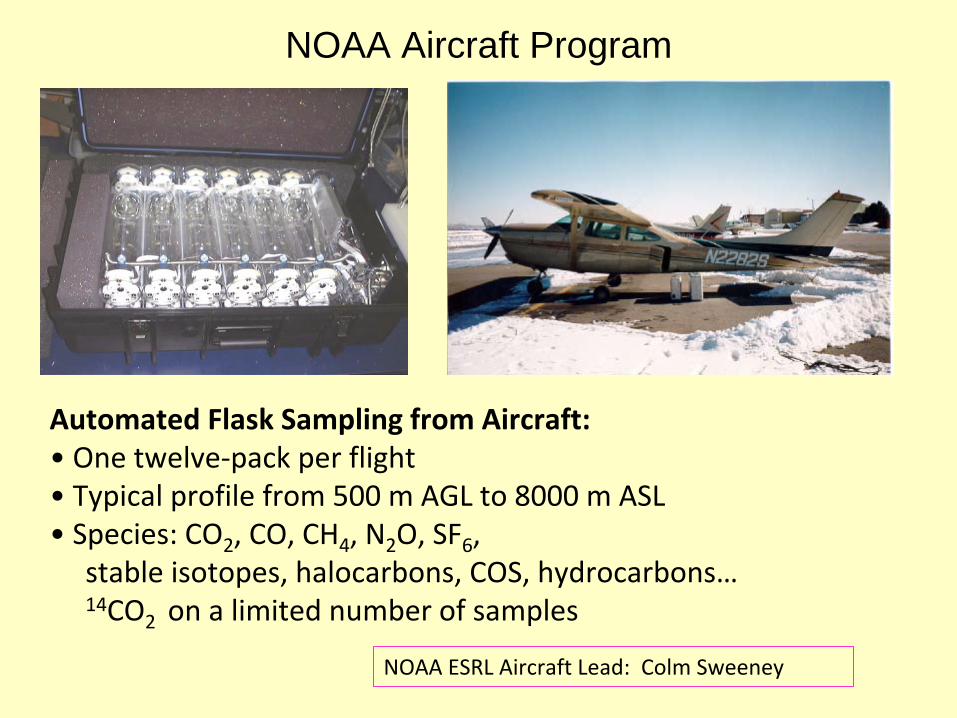
Automated Flask Sampling from Aircraft:• One twelve‐pack per flight• Typical profile from 500 m AGL to 8000 m ASL• Species: CO2
, CO, CH4
, N2
O, SF6
,stable isotopes, halocarbons, COS, hydrocarbons…14CO2
on a limited number of samples
NOAA ESRL Aircraft Lead: Colm
Sweeney
NOAA Aircraft Program

PSU Ring 2• Regional network of 5 cavity ring-down
spectroscopy (Picarro, Inc.) instruments– Centerville, IA– Galesville, WI– Kewanee, IL– Mead, NE– Round Lake, MN
• Sampling heights: 30 and 110-140 m AGL• In operation: April 2007 - current
NOAA tall towers in MCI region• Non-dispersive infrared spectroscopy (LiCor, Inc.)
instruments• LEF
– Sampling heights: 11, 30, 76, 122, 244, 396 m AGL– In operation: 1994 - current
• WBI– Sampling heights: 31, 99, 379 m AGL– In operation: July 2007 - current

Synoptic variability in boundary-layer CO2 mixing ratios

• Difference in daily value from one day to the next: as large as 10-30 ppm
• Due to changes in advection -> important to get transport correct in models!
Synoptic variability in boundary-layer CO2 mixing ratios
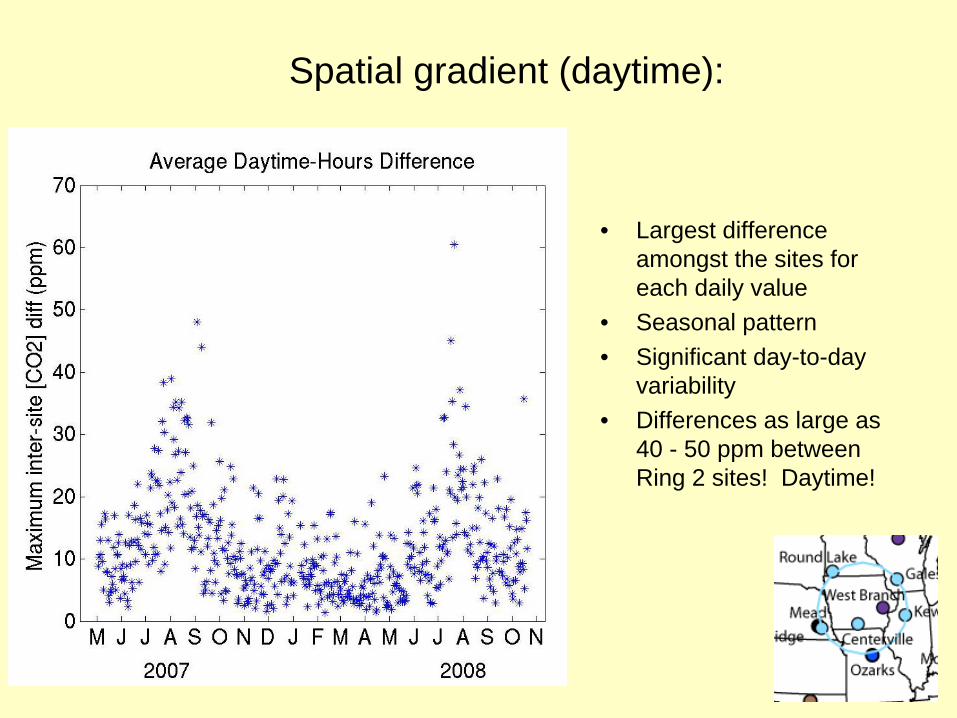
Spatial gradient (daytime):
• Largest difference amongst the sites for each daily value
• Seasonal pattern• Significant day-to-day
variability• Differences as large as
40 - 50 ppm between Ring 2 sites! Daytime!
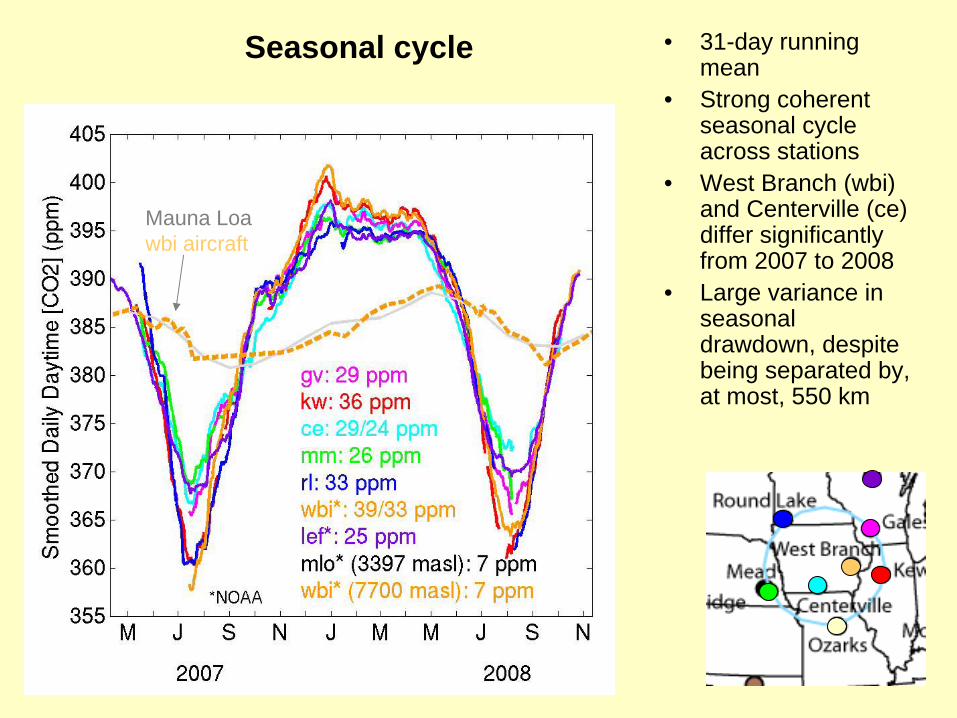
Seasonal cycle • 31-day running mean
• Strong coherent seasonal cycle across stations
• West Branch (wbi) and Centerville (ce) differ significantly from 2007 to 2008
• Large variance in seasonal drawdown, despite being separated by, at most, 550 km
Mauna Loawbi aircraft

Seasonal cycle • 31-day running mean
• Strong coherent seasonal cycle across stations
• West Branch (wbi) and Centerville (ce) differ significantly from 2007 to 2008
• Large variance in seasonal drawdown, despite being separated by, at most, 550 km
Mauna Loawbi aircraft

Seasonal cycle • 31-day running mean
• Strong coherent seasonal cycle across stations
• West Branch (wbi) and Centerville (ce) differ significantly from 2007 to 2008
• Large variance in seasonal drawdown, despite being separated by, at most, 550 km
Mauna Loawbi aircraft

MCI Corn NPP
RL
KWWBI
CE
GV
MM
LEF
Courtesy of T. West
2005

NOAA-ESRL Carbon Tracker
Ring 2 sites not included as input for 2007
http://carbontracker.noaa.gov

Observations vs Carbon Tracker: 2007
• Overall drawdown in CT 2008 is too weak• But some features of modeled variability are consistent with obs
- large variability - mm has less drawdown than wbi, rl, and kw in both model and obs
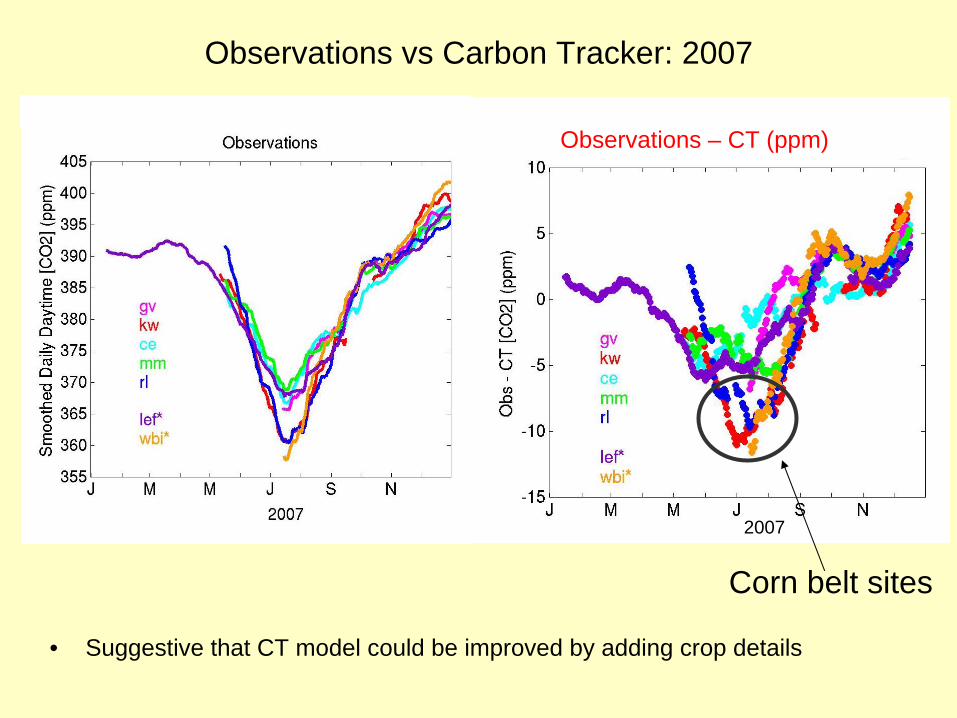
Observations – CT (ppm)
2007
Observations vs Carbon Tracker: 2007
• Suggestive that CT model could be improved by adding crop details
Corn belt sites

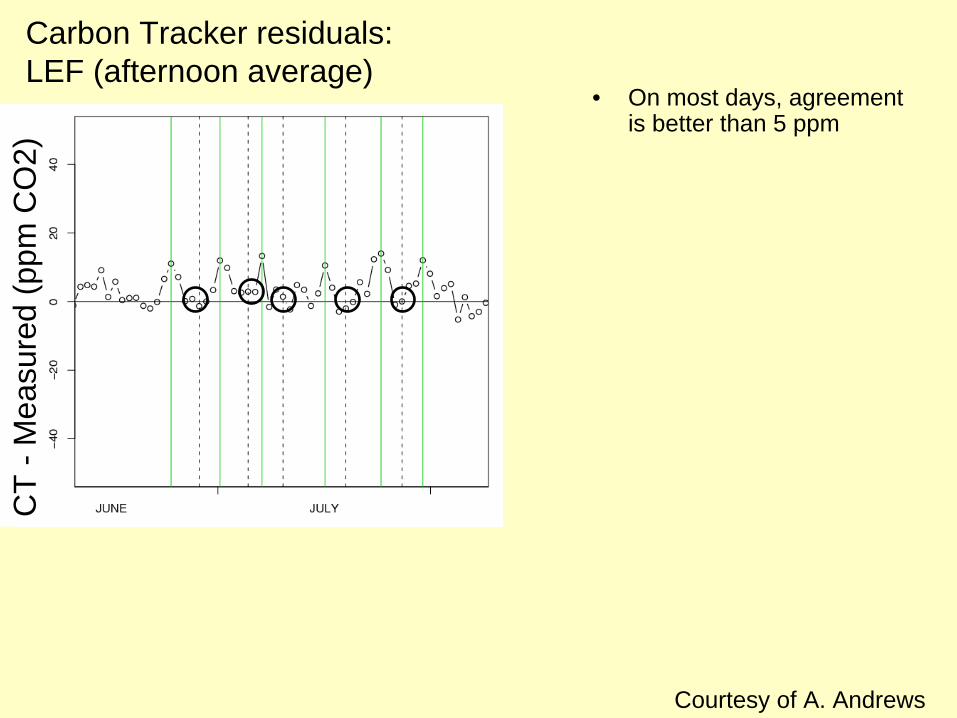
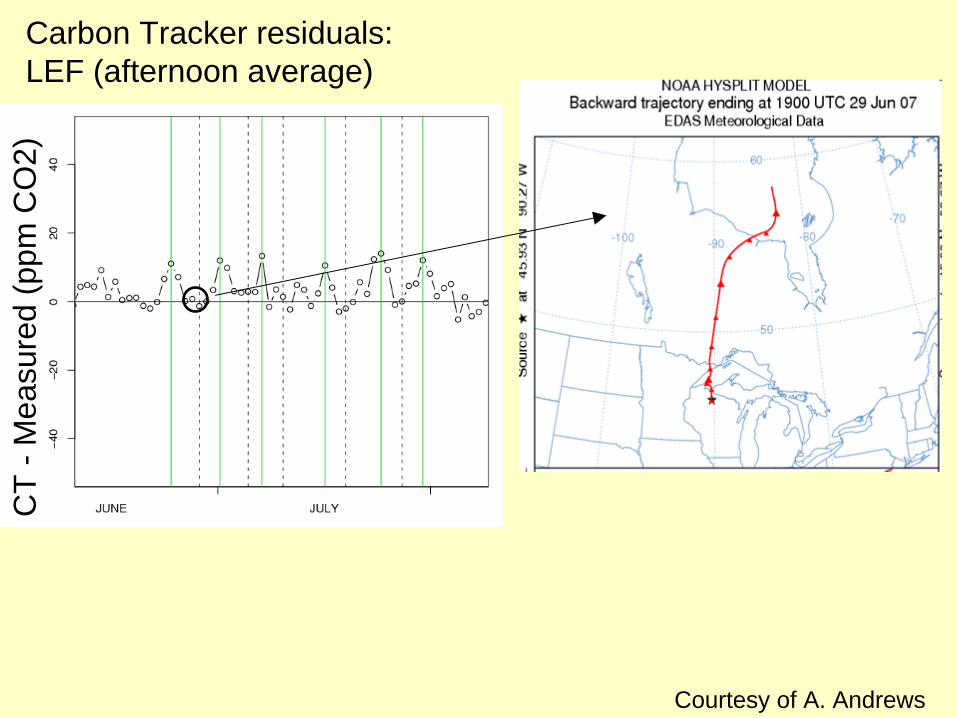
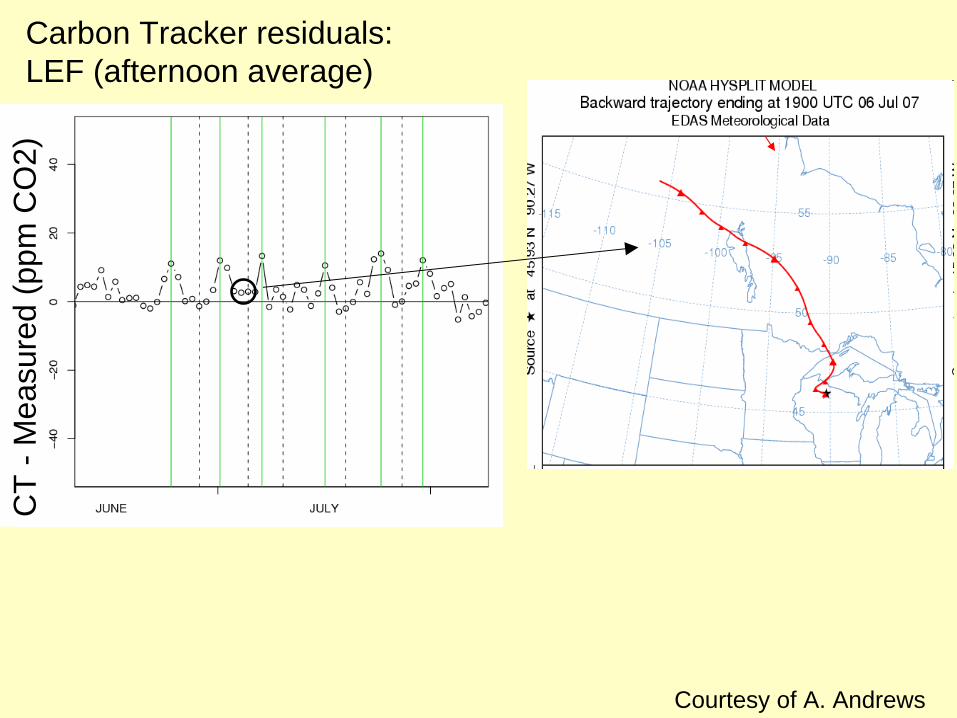
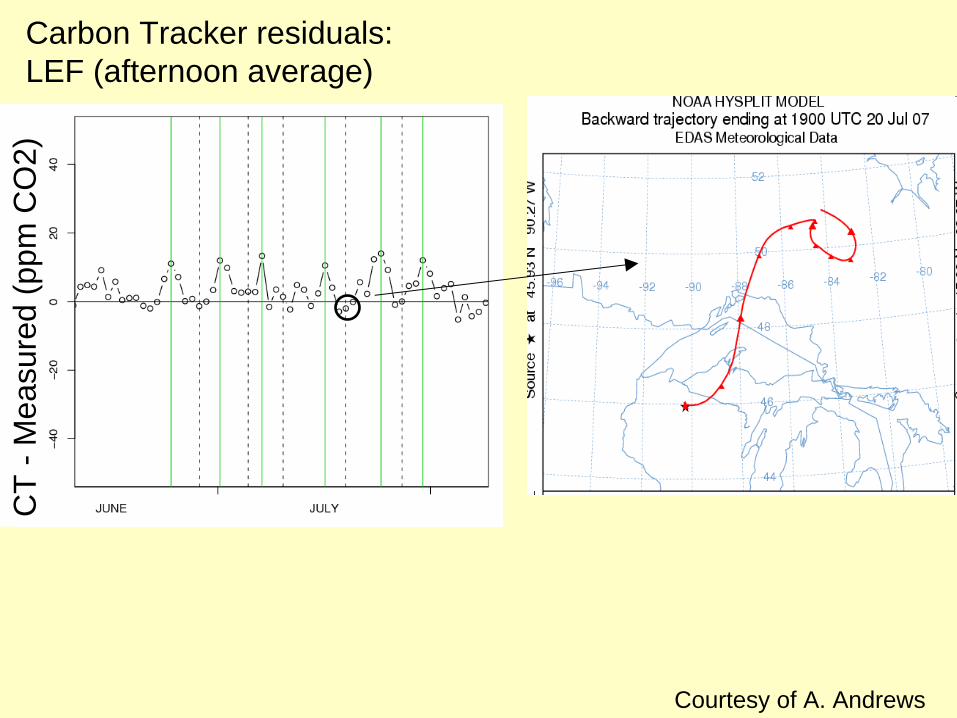
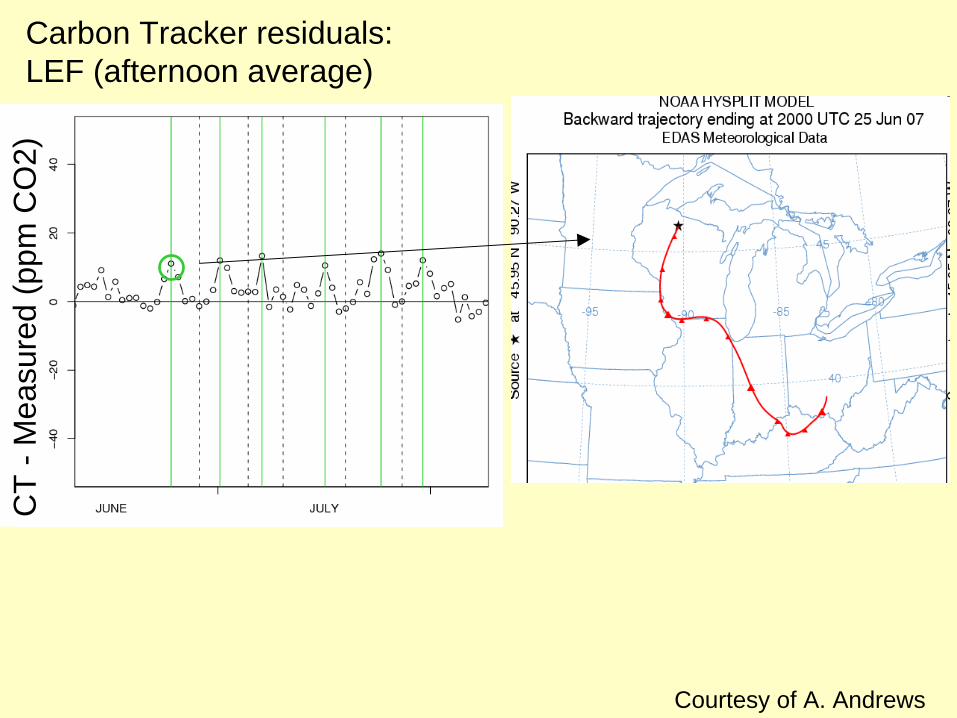
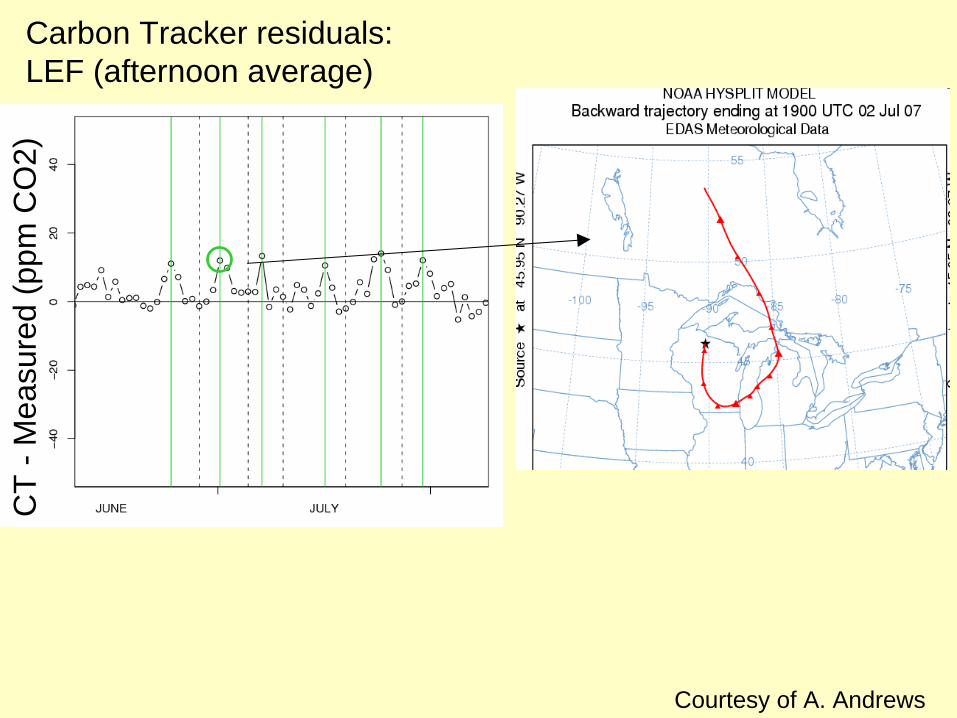
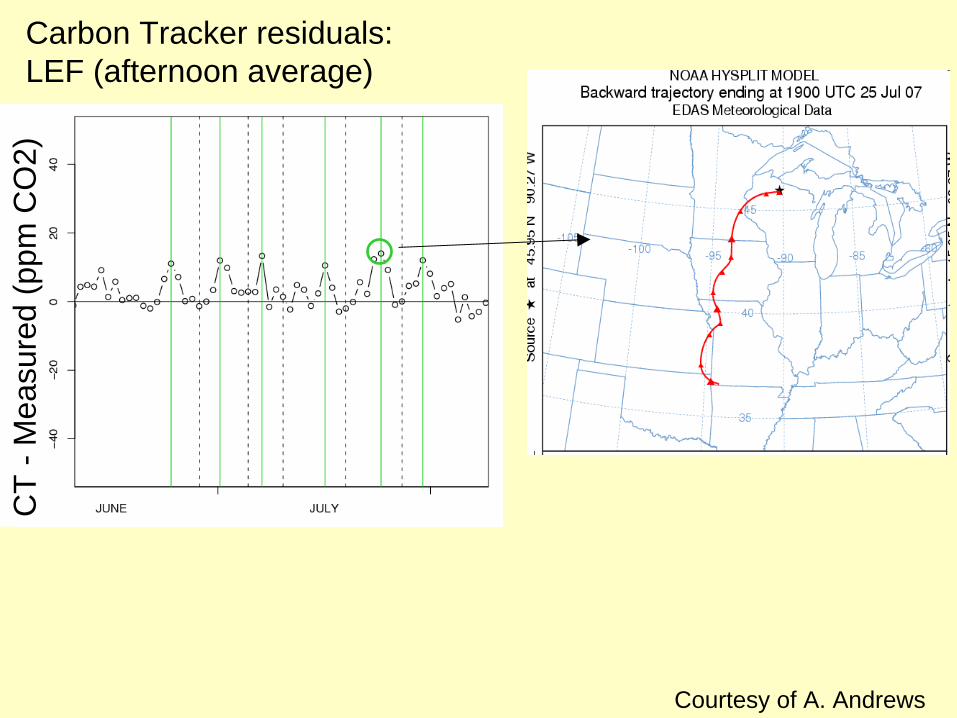
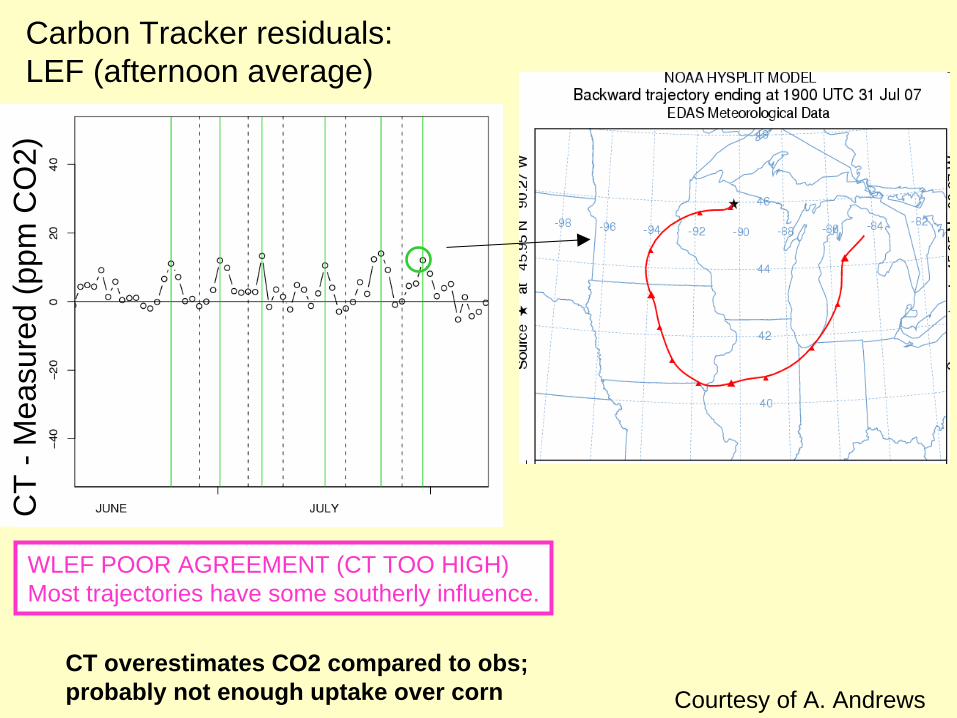
Carbon Tracker residuals: LEF (afternoon average)
CT
-Mea
sure
d (p
pmC
O2)
Courtesy of A. Andrews
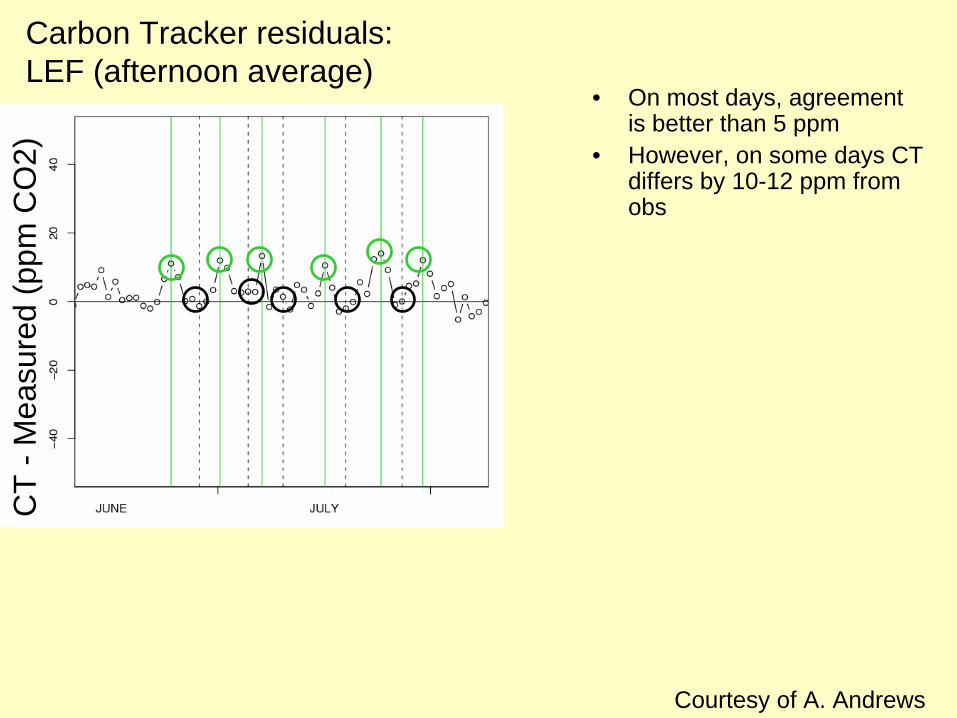
Carbon Tracker residuals: LEF (afternoon average)
CT
-Mea
sure
d (p
pmC
O2)
• On most days, agreement is better than 5 ppm
Courtesy of A. Andrews
Carbon Tracker residuals: LEF (afternoon average)
CT
-Mea
sure
d (p
pmC
O2)
• On most days, agreement is better than 5 ppm
• However, on some days CT differs by 10-12 ppm from obs
Courtesy of A. Andrews
Carbon Tracker residuals: LEF (afternoon average)
CT
-Mea
sure
d (p
pmC
O2)
Courtesy of A. Andrews
Carbon Tracker residuals: LEF (afternoon average)
CT
-Mea
sure
d (p
pmC
O2)
Courtesy of A. Andrews

Carbon Tracker residuals: LEF (afternoon average)
CT
-Mea
sure
d (p
pmC
O2)
Courtesy of A. Andrews
Carbon Tracker residuals: LEF (afternoon average)
CT
-Mea
sure
d (p
pmC
O2)
Courtesy of A. Andrews

Carbon Tracker residuals: LEF (afternoon average)
CT
-Mea
sure
d (p
pmC
O2)
Courtesy of A. Andrews

Carbon Tracker residuals: LEF (afternoon average)
CT
-Mea
sure
d (p
pmC
O2)
WLEF GOOD AGREEMENTPredominant northerly influence
Courtesy of A. Andrews
Carbon Tracker residuals: LEF (afternoon average)
CT
-Mea
sure
d (p
pmC
O2)
Courtesy of A. Andrews
Carbon Tracker residuals: LEF (afternoon average)
CT
-Mea
sure
d (p
pmC
O2)
Courtesy of A. Andrews

Carbon Tracker residuals: LEF (afternoon average)
CT
-Mea
sure
d (p
pmC
O2)
Courtesy of A. Andrews

Carbon Tracker residuals: LEF (afternoon average)
CT
-Mea
sure
d (p
pmC
O2)
Courtesy of A. Andrews
Carbon Tracker residuals: LEF (afternoon average)
CT
-Mea
sure
d (p
pmC
O2)
Courtesy of A. Andrews

Carbon Tracker residuals: LEF (afternoon average)
CT
-Mea
sure
d (p
pmC
O2)
Courtesy of A. Andrews
Carbon Tracker residuals: LEF (afternoon average)
CT
-Mea
sure
d (p
pmC
O2)
WLEF POOR AGREEMENT (CT TOO HIGH)Most trajectories have some southerly influence.
CT overestimates CO2 compared to obs; probably not enough uptake over corn Courtesy of A. Andrews
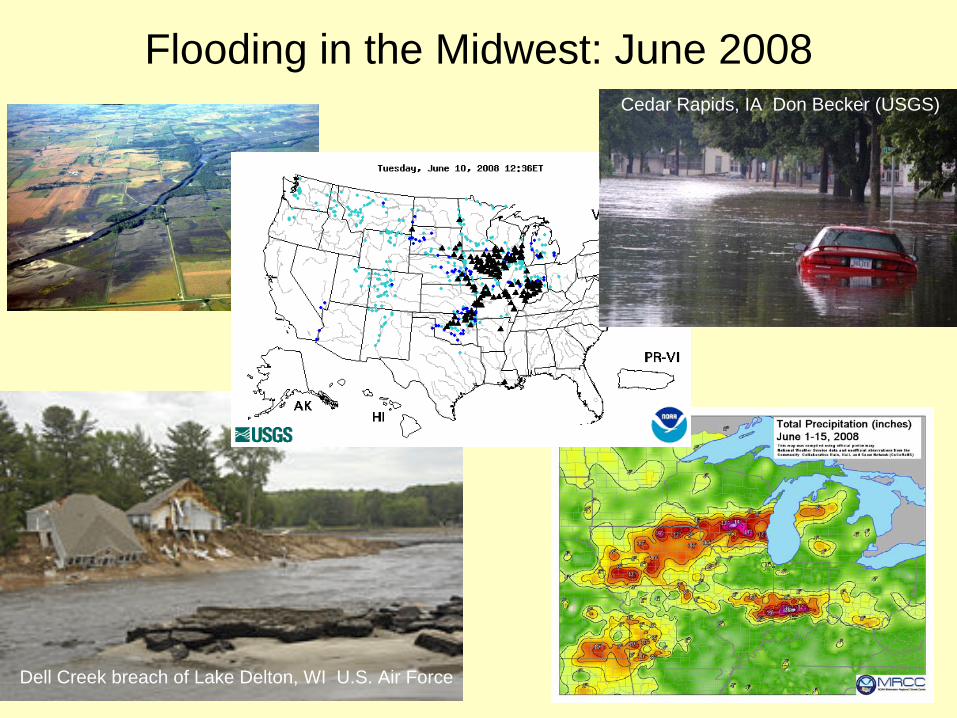
Flooding in the Midwest: June 2008
Dell Creek breach of Lake Delton, WI U.S. Air Force
Cedar Rapids, IA Don Becker (USGS)

Delay in seasonal drawdown• 2008 growing
season is uniformly delayed by about one month, compared to 2007
• Effect of June 2008 flood?
• Recovery: increased uptake later in the growing season
2007 solid2008 dashed
2007 2008
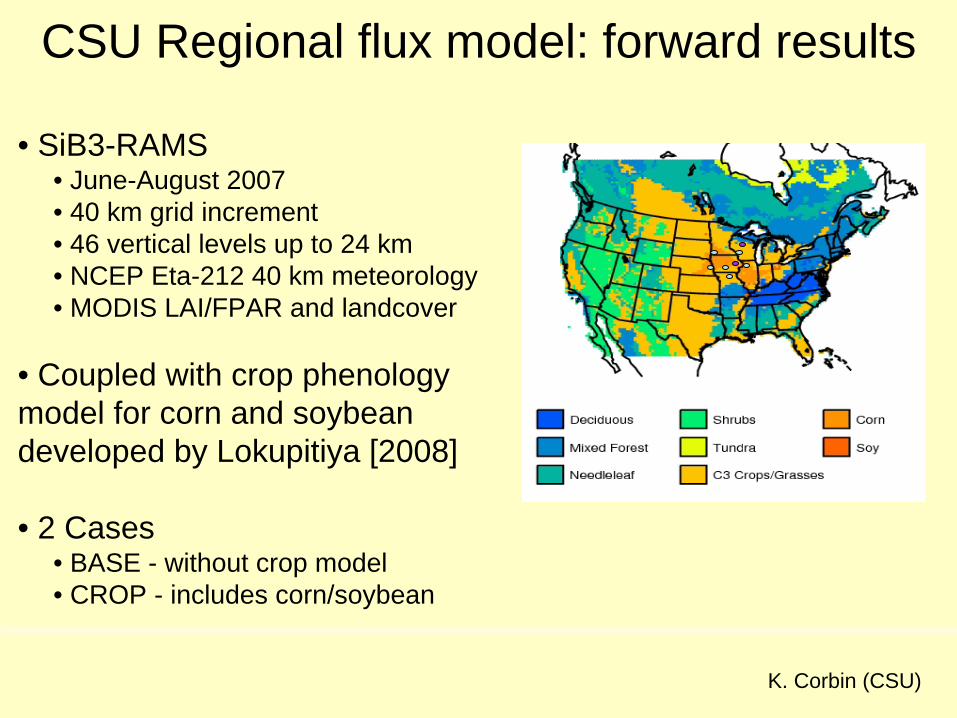
CSU Regional flux model: forward results
• SiB3-RAMS • June-August 2007• 40 km grid increment• 46 vertical levels up to 24 km• NCEP Eta-212 40 km meteorology• MODIS LAI/FPAR and landcover
• Coupled with crop phenology model for corn and soybean developed by Lokupitiya [2008]
• 2 Cases• BASE - without crop model • CROP - includes corn/soybean
Dominant Vegetation Class
K. Corbin (CSU)
K. Corbin (CSU)
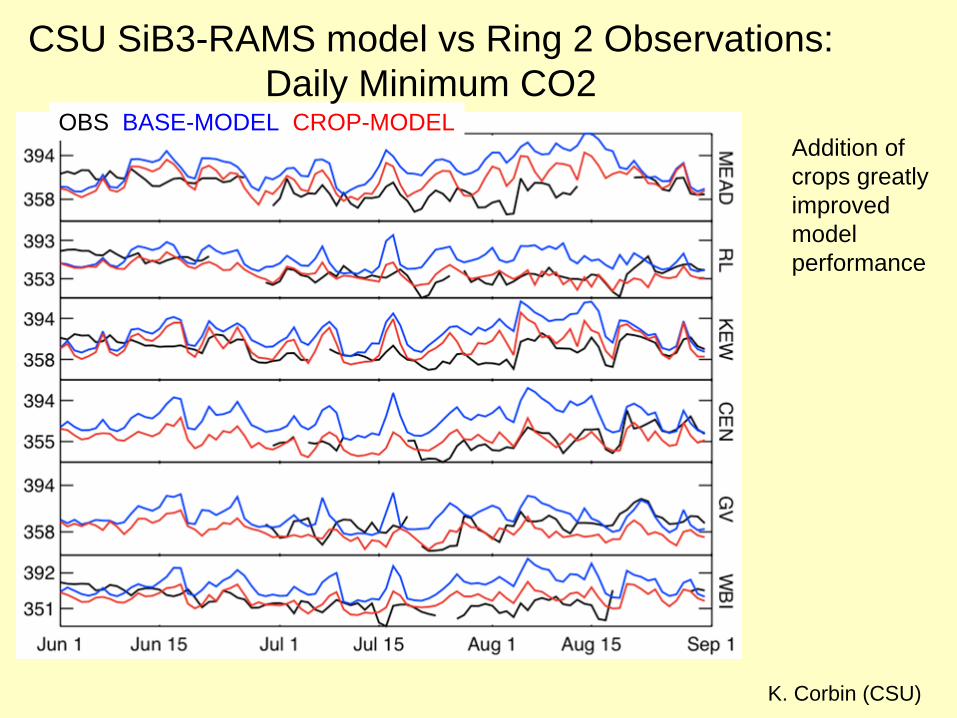
Addition of crops greatly improved model performance
OBS BASE-MODEL CROP-MODEL
CSU SiB3-RAMS model vs Ring 2 Observations: Daily Minimum CO2
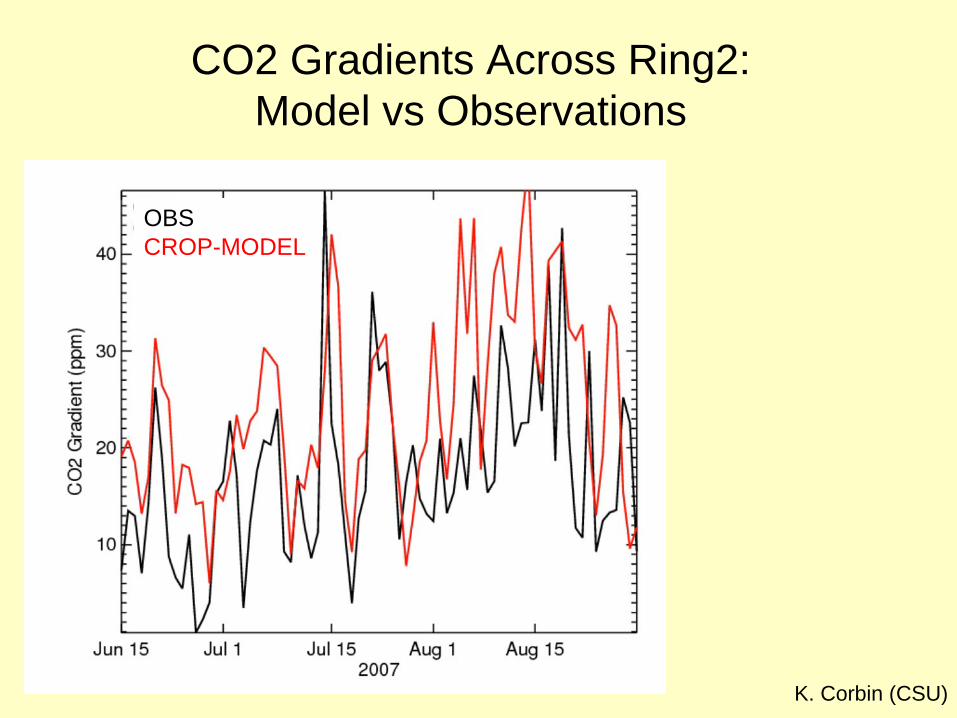
CO2 Gradients Across Ring2: Model vs Observations
K. Corbin (CSU)
OBSCROP-MODEL
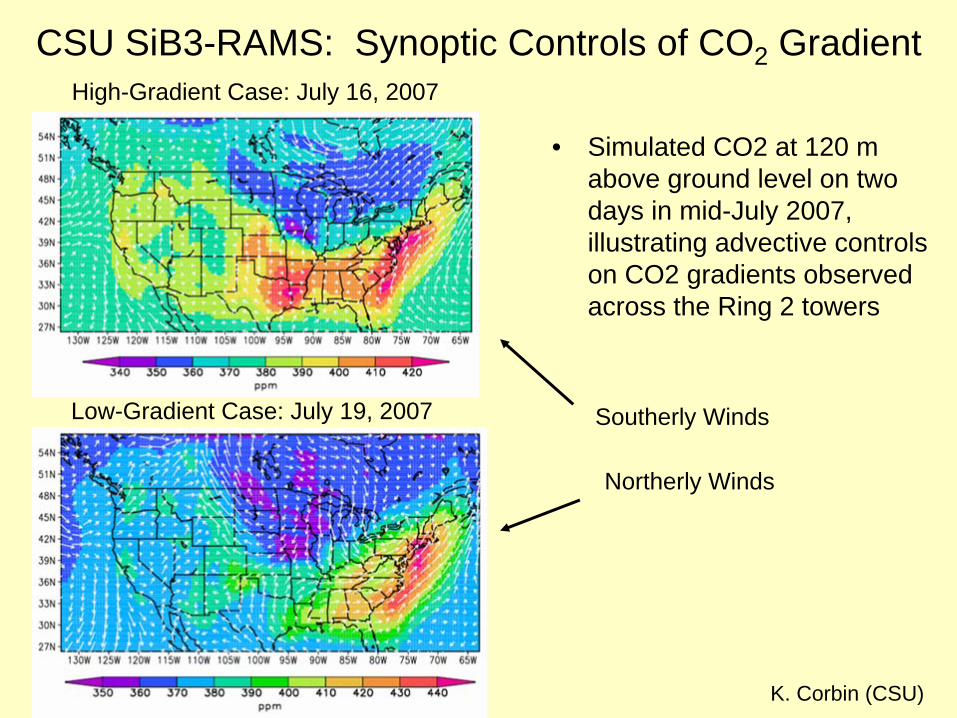
CSU SiB3-RAMS: Synoptic Controls of CO2 Gradient
• Simulated CO2 at 120 m above ground level on two days in mid-July 2007, illustrating advective controls on CO2 gradients observed across the Ring 2 towers
High-Gradient Case: July 16, 2007
Low-Gradient Case: July 19, 2007
K. Corbin (CSU)
Southerly Winds
Northerly Winds
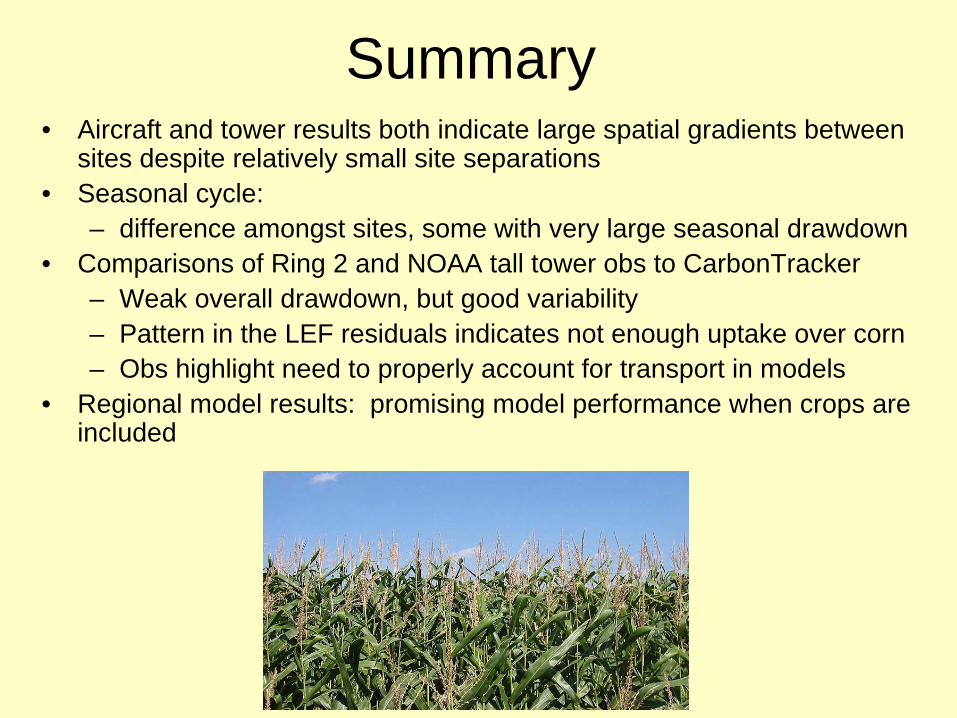
Summary• Aircraft and tower results both indicate large spatial gradients between
sites despite relatively small site separations • Seasonal cycle:
– difference amongst sites, some with very large seasonal drawdown• Comparisons of Ring 2 and NOAA tall tower obs to CarbonTracker
– Weak overall drawdown, but good variability – Pattern in the LEF residuals indicates not enough uptake over corn– Obs highlight need to properly account for transport in models
• Regional model results: promising model performance when crops are included
43
Courtesy of S. Ismail
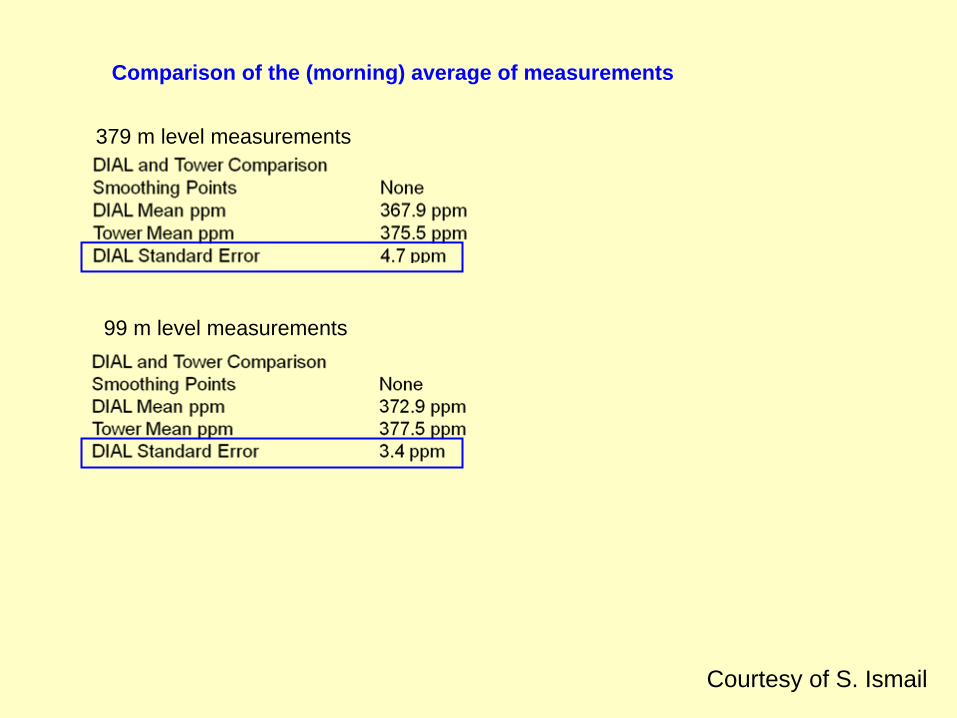
Comparison of the (morning) average of measurements
379 m level measurements
99 m level measurements
Courtesy of S. Ismail

8000
200
4000
Altitud
e (m
)
8000
200
4000
Altitud
e (m
)
8000
200
4000
Altitud
e (m
)
8000
4000
Altitud
e (m
)
8000
200
4000
8000
200
4000
8000
200
4000
8000
4000
8000
4000
8000
4000
8000
200
4000
8000
200
4000
0 6 120 6 12
0 6 12
0 6 12
0 6 12 0 6 12 0 6 12 0 6 12
0 6 12
0 6 12
0 6 120 6 12
18
0
‐15
18
0
‐15
18
0
‐15
18
0
‐15200 200 200 200
Deviation from global mean [CO2]
Climatology of 12
of 16 currently
running NOAA
aircraft project
sites•
2 – 3 profiles /
month at each site•
Increase in
amplitude of the
seasonal cycle
from west to east
NOAA Aircraft Program CO2 Measurements


![arXiv:1610.08981v2 [astro-ph.GA] 23 Jan 20173 where ˚ tot is the total potential (baryons and DM). The uncertainty on g obs is estimated as g obs = g obs s 2 V obs V obs 2 + 2 i tan(i)](https://static.fdocuments.us/doc/165x107/60ad9881cf21661fce48e6c8/arxiv161008981v2-astro-phga-23-jan-2017-3-where-tot-is-the-total-potential.jpg)
