
NAC 10 Market Analysis - Alchemy s Five Forces Analysis 15 Competitive ... points and assess the...
170
NAC‐10 Market Analysis Prepared by: Kolt Codner, Project Manager 330.261.3331 [email protected] YSU Research Team: Sarah Holmes Teresa Maderitz Marc Sikora December 8, 2010
Transcript of NAC 10 Market Analysis - Alchemy s Five Forces Analysis 15 Competitive ... points and assess the...
NAC‐10 Market Analysis
Prepared by: Kolt Codner,
Project Manager 330.261.3331
YSU Research Team: Sarah Holmes
Teresa Maderitz Marc Sikora
December 8, 2010

Table of Contents Executive Summary 1
Findings & Recommendations 2
Future Action 6
Project Approach 7
Project History 7
Research Methodology 8
NAC‐10 Analysis 10
SWOT Analysis 10
Key Success Factors 13
Porter’s Five Forces Analysis 15
Competitive Analysis 17
Market Introduction 17
Competitive Firm Overview 17
3M Company 18
PPG Industries 20
Bredero Shaw 22
DuPont 24
Dow Chemical 27
Sherwin‐Williams 29
Valspar 32
Akzo Nobel N.V. 34
Competitive Coating Overview 35
Fusion Bonded Epoxies 35
Three Layer Polyethylene 36
Three Layer Polypropylene 37
Coal Tar Enamel 37
Polyurethane 37
Coating Price Points 37
Evaluation of Coating Processes 38
Licensing and Prequalification of Coating Applicators 39
End‐User Analysis 41
Shell Oil 42
Exxon Mobil 46
BP 46
Chevron 50
Occidental 52
Supply Chain Inefficiencies 54
Pipe Suppliers for End‐Users 54
Pipeline Re‐Coat Process 56
Regulatory Oversight 58
Regulatory Agency Overview 58
Corrosion Protection Requirements 58
Conclusions 63
Supporting Exhibits Exhibit One: Project Charter 65
Exhibit Two: Market Analysis Project Approach 70
Exhibit Three: Project Plan Document 72
Exhibit Four: Key Market Statistics 73
Exhibit Five: Market Definition 74
Exhibit Six: Nano‐Chemicals Promise for Advanced Coatings 75
Exhibit Seven: Competitive Landscape in Coating Industry 76
Exhibit Eight: Firms Competing within the Coating Industry 78
Exhibit Nine: Summary of Paint and Coating Production in 2009 81
Exhibit Ten: Detailed 3M Firm Assessment 82
Exhibit Eleven: Detailed PPG Firm Assessment 85
Exhibit Twelve: Detailed Bredero Shaw Firm Assessment 90
Exhibit Thirteen: Detailed DuPont Firm Assessment 94
Exhibit Fourteen: Detailed Dow Chemical Firm Assessment 98
Exhibit Fifteen: Detailed Sherwin‐Williams Firm Assessment 102
Exhibit Sixteen: Detailed Valspar Firm Assessment 106
Exhibit Seventeen: Detailed Azko Nobel N.V. Firm Assessment 110
Exhibit Eighteen: Overview of FBEs 114
Exhibit Nineteen: Composition of Various Anti‐Corrosive Coatings 116
Exhibit Twenty: Coating Price Points 119
Exhibit Twenty One: Evaluation of Coating Processes 120
Exhibit Twenty Two: Licensing and Prequalification of Applicators 122
Exhibit Twenty Three: Detailed Shell Oil Firm Assessment 125
Exhibit Twenty Four: Detailed Exxon Mobil Firm Assessment 131
Exhibit Twenty Five: Detailed BP Firm Assessment 133
Exhibit Twenty Six: Detailed Chevron Firm Assessment 136
Exhibit Twenty Seven: Detailed Occidental Firm Assessment 139
Exhibit Twenty Eight: Pipeline Recoating Process 142

Executive Summary
This document provides an analysis of the market within which WinTec’s NAC‐10 coating will
compete. The analysis utilizes a multi‐faceted approach to look at a wide number of key data
points and assess the overall attractiveness of the petrochemical/oil industry segment for anti‐
corrosive coatings.
The findings and recommendations section immediately following the executive summary
outlines the key points discovered in this analysis and provides strategic recommendations.
Additionally, the findings and recommendations section also outlines the key areas that need to
be further assessed in future studies to gain a full evaluation of this market segment.
The analysis also provides an overview of the key competing firms within the coatings industry
to assess their market strategy and gain insight into their long‐term objectives. Additionally, a
simple assessment of the various types of coatings within the anti‐corrosive industry is
included.
Fitting with the pull marketing strategy this plan recommends, an analysis of key end‐users is
also provided to illuminate several key points of potential market penetration. Creating buy‐in
at the end‐user level is the essential route to successfully bringing NAC‐10 to the marketplace.
Finally, the analysis provides a brief summary of the regulatory oversight that is a factor within
this high‐risk segment of the marketplace. Although, this information was unable to provide an
in‐depth analysis, it did yield a high‐level overview of the oversight regulations.
The body of this analysis is supported by twenty eight supporting exhibits that provide links to
the data sources used to compile the main body of this analysis.
1
Findings & Recommendations
Pull Marketing
One of the things that rapidly became apparent within the industry was that the end‐user was
the decision maker in the coating process. Despite the fact that the coating is sold to and
applied by an intermediary, there is no decision making being made by the intermediary. They
simply purchase and apply whichever coating the end‐user desires. Considering this point, this
analysis recommends that WinTec directly reaches out to the end‐user firms to create buy‐in
and interest at their levels. If WinTec is successful at creating interest with the end‐users, they
will effectively “pull” NAC‐10 through the supply chain and generate product orders.
Price Escalation
When examining competing firms within the protective coating industry it became apparent
that the industry was recently experiencing escalating input and production costs. Costs
increases in the vicinity of 10% were experienced by a number of industry rivals and are
something that must be considered when pricing NAC‐10. As end‐users are price conscious,
WinTec must be careful to adequately price NAC‐10 to ensure it can avoid having to frequently
raise prices to meet full product and period costs.
Infrastructure Market
When examining the competing firms it became apparent that a number of firms were electing
to dedicate more resources to protective coatings for infrastructure applications. Nearly all
firms evaluated were either developing or acquiring new technologies to satisfy the needs of
the infrastructure markets. This can be for a number of different reasons; however, this analysis
attributes it largely to the fluctuations in the industrial coatings segment.
This past year Valspar experienced a decrease in revenues of more than 22% within the
industrial coating segment. Industrial firms are extremely sensitive to economic downturns and
may elect to put‐off industrial expenditures on new coatings that may still have a marginal
2

amount of useful life left. By diversifying into infrastructure coatings are less economically
dependent will generate more stable revenue streams.
Additionally, the infrastructure segment is less of a high‐risk industry where it will be easier to
gain penetration without an existing reputation. The high‐stakes nature of petrochemical/oil
anti‐corrosive coatings creates a situation where end‐users undergo extensive testing and
discussion regarding anti‐corrosive coating selection. Within the infrastructure segment, anti‐
corrosive coatings are less intensive decision and there are a far greater number of coating
applications available.
This analysis recommends that WinTec closely consider expanding NAC‐10 into the
infrastructure segment. The infrastructure will afford a significant number of opportunities for
WinTec and NAC‐10 that the petrochemical/oil industry does not.
Supply Chain Inefficiencies
The North American market is dominated by fusion bonded epoxies that are brittle and prone
to damage during transport, handling and installation. This results in situations where the pipe
is coated and re‐coated multiple times. Initial studies indicate that NAC‐10 superior durability
will enable it to endure the impacts and abrasions that FBEs are damaged by. This will
generate substantial labor and material cost savings by streamlining the end‐users’ supply
chains. Through this analysis a full cost of these supply chain inefficiencies was unable to be
calculated. This data should be compiled in future studies to determine the full benefit NAC‐10
affords to the end‐users.
Applicator Certification
The overall integrity of NAC‐10’s and WinTec’s reputations will ultimately depend upon the
quality of the coatings application. To ensure that NAC‐10 is properly applied by capable
applicators, it is recommended that WinTec only allow applicators that can meet or exceed ISO
certification 12944 to apply NAC‐10.
3

Regulatory Oversight
The review of the regulatory agencies overseeing the petrochemical and oil industries yielded
less than all of the findings this analysis had hoped to uncover. That being said, this analysis
was able to determine that the United States Department of Transportation Pipeline and
Hazardous Material Safety Administration (PHMSA) was the federal agency with supreme
oversight for the safety requirements within the industry segment. However, the requirement
outlined by PHMSA are less than specific, rather they establish general guidelines regarding to
corrosion protection and anti‐corrosive coatings. These regulations can be found in CFR Title 49
§192.4 and are outlined later in the corrosion protection section of the regulatory oversight.
Comparison of NAC‐10 with Three Layer Polyethylene and Three Layer Polypropylene Coatings
Being a business market analysis, this study did not perform a technical analysis of NAC‐10,
three layer polyethylene (3LPE) or three layer polypropylene (3LPP). However, a review of
material from trade journals indicates that 3LPE and 3LPP coatings are superior to FBE coatings
in the flexibility and durability to impacts and surface damage. It is imperative to perform a full
engineering analysis of these coatings in comparison to NAC‐10 to determine the respective
strengths and weaknesses of each. This will allow WinTec to gain a fuller view of the
competitive landscape within the industry.
Additionally, the research indicated that the North American market has been slow to adopt
3LPE and 3LPP coatings while the rest of the world has largely used them to replace FBEs. This
analysis could yield revealing information regarding the North American preference for coatings
they are familiar with like an FBE.
End‐User Findings
During the end‐user analysis contained within, this study was able to reveal the current actions
and market strategies of the firms reviewed. This data could be a starting point for developing
a fuller picture of the needs of end‐users within this market segment.
4

When examining Shell, it became apparent that their extensive involvement in the Gulf of
Mexico affords WinTec a geographic advantage over some competitors. Additionally, Shell has
a number of natural gas pipelines within the heart of Texas that would act as good test points
for NAC‐10. Finally, Shell is currently expanding their Port Arthur Facility and installing 54 new
hazardous material storage tanks that would be a prime target for NAC‐10.
Similar to Shell, Exxon has the bulk of their business located within the Gulf of Mexico.
Additionally, Exxon has demonstrated a willingness to utilize new and innovative technologies
in their drilling process in Colorado. This indicates that Exxon may be more willing to employ
new and innovative technology, like NAC‐10, in their corrosion protection as well.
An analysis of BP’s various holdings also indicated that they would be a primary target for NAC‐
10 as well. The study revealed that BP currently owns and operates more than 9,000 miles of
pipeline and an additional 7,500 miles of pipeline are controlled through strategic joint
ventures. This substantial amount of domestic pipeline provides a section of the market that
WinTec must look to exploit with NAC‐10. Additionally, BP has demonstrated a continued
investment in facility upgrades in recent years. For instance, at their Whiting, IN refinery BP will
be spending $5.2 billion on improvements in the near future. This type of new expenditure
creates an opportunity for NAC‐10 to establish itself a new anti‐corrosive coating within BP’s
soon‐to‐be expanded refinery.
The analysis of Chevron revealed that they were the largest producer within the Gulf of Mexico
and California. Additionally, Occidental’s evaluation revealed the firm to be the largest
producer in Texas and New Mexico.
License NAC‐10 to another Firm
Once concept that was floated during discussion by the analysis team was the idea of WinTec
licensing NAC‐10 to another competitor for a share of revenues it would earn. The logic behind
this discussion was that by licensing NAC‐10 to another firm, WinTec would be able to generate
5

cash flows without investing funds in developing and maintaining a distribution network.
Additionally, by leveraging the brand reputation of a firm like 3M or PPG, NAC‐10 would enter
the market with instant credibility and likely increased sales.
Additionally, this negates the risk of another firm developing a copy‐cat coating before WinTec
would be able to develop a sustainable and defensible competitive advantage within the
marketplace. This would allow NAC‐10 to hit the market running and quickly develop a loyal
following within the industry segment.
Also, by licensing the product WinTec would free up company resources to work on products
that are already successful and profitable. Instead of spending cash reserves to attempt to
penetrate the market, WinTec would be able to funnel NAC‐10 cash flows into their more
established operations.
This is not a recommendation that this should be done, rather, that additional research should
be performed to determine if this is a viable route for NAC‐10.
Future Action
As previously discussed, this document is an active working document that will serve as a
foundation upon which future projects can be constructed and analyzed. With the time and
resource constraints of this project it was impossible to adequately analyze all of the points that
had the plan had hoped to examine. Additionally, though the analysis of this document there
were several key points that arose and should be examined in further detail. This analysis
strongly recommends that WinTec continue to research and analyze the key points that are
recommended for further study in this section. Key points for further research and analysis
include:
6
• Research Product Pricing Information for All Competitors
o Establish Pricing Recommendations for NAC‐10
• Further Analysis the Infrastructure Coatings Segment
o Evaluate Ease of Entrance
o Key Stakeholders
o Overall Size and Attractiveness
• Perform a Comprehensive Analysis of the End‐User Supply Chain within the
Petrochemical/Oil Segment
o Develop Process Mapping
o Estimate the Cost of the Supply Chain Inefficiencies
• Examine Regulatory Agencies In‐Depth
o Develop Hierarchy Map of Oversight
o Establish Minimum Specifications for Each Agency
• Perform Technical Analysis and Testing of NAC‐10
o Comparisons to Three Layer Polyethylene and Three Layer Polypropylene
o Field Applications
o Additional Third Party Independent Testing
• Evaluate Why the North American Market has been Slow to Adopt 3LPE and 3LPP
Coatings
o Examine what Impact those findings will Have on NAC‐10
Project Approach
Project History
The project originated with a project kickoff meeting on October 1, 2010 at WinTec’s Houston,
TX headquarters. At the kickoff meeting, Ron Emery and Barbara Tompkins‐Brown of the Tagos
Group and Kolt Codner of Youngstown State University met with Jim Henry and Patrick
Gonzales of WinTec to discuss the objectives for the NAC‐10 market analysis project. An initial
7
8
project charter drafted by Mr. Codner was reviewed to facilitate discussion at the meeting and
aid in focusing the project goals. The project charter is available as Exhibit One of this
document. Out of the meeting eight key points arose as points to be discussed during the
project. The points are listed below; the full project approach is available as Exhibit Two.
• Evaluate the Current Issues Facing the Petrochemical Industry
• Determine and Evaluate the Regulator Requirements Regarding NAC‐10
• Evaluate the Needs of End‐Users of Anti‐Corrosive Coatings within the Petrochemical
Industry
• Determine the Competitive Landscape of Anti‐Corrosive Coatings within the
Petrochemical Industry
• Evaluate and Compare the Complexity of the NAC‐10 Coating System with that
Competitors
• Evaluate the Impact of a Catastrophic Corrosion Failure on both the End‐User and the
Coating Developer
• Examine Existing Supply Chains of End‐Users and Determine Potential Savings by Using
NAC‐10
• Utilizing the Totality of Data Gathered Quantify the Financial Impact of Using NAC‐10
Combining the project approach goals with the resources currently available to work on the
project a project plan was developed using Microsoft Project 2010. The project plan, available
as Exhibit Three, developed a methodical way of approaching the project to ensure all essential
data was gathered as quickly as possible to ensure accurate and timely analysis.
Research Methodology
This analysis set out to analyze the overall market attractiveness of the petrochemical anti‐
corrosive coating segment for NAC‐10. To achieve the goals of this analysis, the project first set
about evaluating NAC‐10 and its current place within the industry. This Information can be
found within the NAC‐10 Analysis section of this document. After formulating a foundation
upon which the remainder of the project could be developed, the analysis then utilized a multi‐
faceted approach to determine the overall attractiveness of this industry segment.
This expanded information includes a detailed competitive analysis and end‐user analysis.
These points were extensively researched due to their overall impact to the industry segment.
During the meeting with WinTec on October 1st, WinTec voiced some concern regarding the
impact of the pipe manufacturer within the industry. Upon review of the industry structure it
was determined that the pipe mill has a nominal impact on the anti‐corrosive coating selection.
Additionally, the same analysis was applied to the intermediary that receives the pipe from the
mill and then applies the anti‐corrosive coating. This link within the value chain has little
impact on the anti‐corrosive coating selection and simply applies whatever coating the end‐
user desires. Thus, the analysis determined that the most effective way to sell NAC‐10 was
through a pull model by reaching out directly to the end‐users of the product and creating buy‐
in at that level. Thus, analysis included a detailed end‐users assessment with this document to
provide key background information that can aid in reaching out to the end‐users and
developing sales. The analysis recommends using a “pull” strategy in marketing reaching out to
end‐users and using them to pull the coating through the supply chain.
Additionally, a detailed competitive analysis was performed to evaluate the overall positions for
the firms competing in the anti‐corrosive coating industry. This data was deemed essential
because it allows WinTec to develop a fuller understanding of the competitors within the
industry and evaluate their long‐term objectives. Additionally, research revealed that many
end‐users within the segment were very brand loyal because of the perceived safety that brand
reputation and familiarity built. For NAC‐10 to succeed within this market segment it will be
essential to cultivate a loyal customer following as 3M and PPG have done in the past.
Finally, this document also assesses the impact of government regulation within this industry
segment. The data that was compiled will help to navigate some of the bureaucratic red tape
9

that governs the safety of the petrochemical industry. The data that was gathered provides a
brief overview of the regulatory impact and will be a point of further study upon future
assessments.
NAC‐10 Analysis
Product Overview
NAC‐10 is a nano‐based polymer anti‐corrosive coating that has exceeded industry expectations
upon bench tests of the product. The product consists of applying two products to the metal
substrate. The first is a metal‐penetrating, nano‐based hydrophobic primer coat followed by an
overcoat of a highly cross‐linked nano‐based hydrophobic polymer membrane to protect the
primer coat from UV light, impacts, abrasions, acids and petrochemicals.
SWOT Analysis
The SWOT Analysis provides a context for the competitive environment within which the NAC‐
10 coating will be competing. The key points from the SWOT analysis are available below.
NAC‐10 SWOT Analysis Strengths Weaknesses
• Unique Nano‐Based Design • Lack of Brand Reputation • Polymer Composition • Limited Product Visibility • Superior Durability • Relatively Small Firm • Manufacturer Ready • Limited End‐User Relationships • Scalability • Limited Distribution Network
Opportunities Threats • Aging Pipelines Need Rehabilitation • Rapidly Evolving Products • Increased Demand in Marcellus Shale • Perceived Risk of New Products • Tariff on Foreign Pipe • Intensity of Competitive Rivalry • Supply Chain Inefficiencies • Highly Fragmented Industry • Large Barriers to Entry
Strengths
10

One of the primary strengths of NAC‐10 can be found within its unique nano‐based polymer
design that affords the coating unrivaled durability and superior petrochemical and acid
resistance. As discussed with at the kickoff meeting on October 1st, bench tests have shown
NAC‐10 to be virtually unaffected by the harshest of environment. Initial bench tests indicate
that the useful life of the NAC‐10 coating is a minimum of five times that of existing competitors
on the marketplace. This unduplicated durability allows the NAC‐10 coating the ability to
provide long‐term durability that current competitors’ coatings will have difficulty matching.
Additionally, per the kickoff meeting with WinTec, a manufacturer is on board and readily able
to begin mass producing the coating components at a moments notice. The meeting also
revealed that inputs for the coating are abundant and readily available. This allows the NAC‐10
coating to have great scalability in production if orders were to increase at a rapid rate.
Weaknesses
There are a number of weaknesses challenging WinTec as it looks to bring the NAC‐10 anti‐
corrosive coating to the market. The most critical weakness challenging NAC‐10 is the lack of
brand recognition and reputation. As, previously discussed end‐users within this market
segment tend to be very brand loyal and stick with companies they have regularly used and are
familiar with. This is likely a result of the significant impact a catastrophic failure will have on
the end‐user. Because of this significant impact, end‐users are much more likely to go with
products and companies they have developed trust in over the years.
This creates a situation where there is going to be significant difficulty for new entrants into the
market place. A firm like WinTec attempting to penetrate a market where firms like 3M and
PPG have built their reputations over decades will have difficulty building brand equity. It is
essential that WinTec develop a reputation of unrivaled quality and commitment to process
quality to mitigate this weakness.
11

WinTec is also relatively small in comparison to the industry leaders. This creates a situation
where industry leaders will be able to invest significant funds in research and development that
will dwarf WinTec’s own expenditures. If NAC‐10 is able to develop a demand for a nano‐
based polymer coating within the marketplace it would likely be quickly duplicated by a 3M or
PPG. If this were to happen, the NAC‐10 coating may still be superior to the new polymer
coatings, however, the 3M or PPG coatings may be perceived as superior due to their brand
reputation.
Opportunities
Opportunities within the industry include the aging of pipelines and petrochemical storage
tanks and increasing number of facilities that are requiring rehabilitation. Currently within the
United States there are 328,000 miles of natural gas transmission lines and more than 8.5
million hazardous material storage tanks. A recent Federal Highway Administration study
pegged the annual cost of corrosion in the U.S. at $270 billion. Additionally, the push to
systematically replace large diameter bare steel natural gas transmission lines with modern
alternatives also creates some unique time sensitive opportunities.
Current tariffs on foreign pipe are also facilitating increased domestic production of pipe for the
petrochemical and oil industries. For instance, V&M Star, a division of Paris based Vallourec,
has went forward with construction of a $650 million large diameter pipe mill in Youngstown,
OH to capitalize on the advantages of domestic pipe production. This opportunity creates a
situation where greater quantities of domestic steel pipe will be available on the market and
require anti‐corrosive coatings.
One of the primary points this analysis planned to assess and quantify was the impact of the
supply chain inefficiencies within the end‐users’ supply chains. With the coating process
utilized by most firms, there is a substantial amount of material handling and wasted resources
spent on coating and recoating pipe that was damaged at some point in utilization. An
assessment of NAC‐10 indicated that substantial cost savings would be able to be realized
12
thanks to the superior durability of the coating. This is discussed in‐depth within the supply
chain inefficiencies of this document.
Threats
The anti‐corrosive coating industry contains rapidly evolving coatings and changing
technologies. This is of paramount concern when it comes to defending NAC‐10’s unique
competitive advantage. Likely, the continued evolution of competitors will enable to them to
shortly develop products that rival the capabilities of NAC‐10. It is essential that WinTec
develop a reputation with NAC‐10 that will be defensible by the time duplicate products reach
the market.
Additionally, there is a perceived risk within the industry related to the adoption of new
coatings. As previously discussed, with the high‐risk stakes associated with a catastrophic
failure, it is imperative that the end‐user feels comfortable with their coating selection. The
overall industry structure creates a situation that generates a substantial barrier to entry based
on this concept.
The petrochemical/oil anti‐corrosive coating industry segment is highly fragmented and fiercely
competitive. Any new entrants will face stiff competition from established competitors that
will expend significant resources to protect their market share. It is essential for new entrant
like WinTec to quickly develop a distribution channels that will be able to minimize the impact
of this threat.
Key Success Factors
This analysis developed five key success factors for the long‐term viability of NAC‐10 within the
market segment. The five KSFs are listed below in descending importance.
• Communicate the Value Proposition
• Reduce the Perceived Risk of the New Product to End‐Users
13

• Develop Brand Equity
• Build a Defensible Position within the Market
• Exploit Supply Chain Inefficiencies to Increase the Value
Communicate the NAC‐10 Value Proposition
First and foremost, it is essential to communicate the value NAC‐10 provides to end‐users. The
NAC‐10 coating allows firms to utilize a coating that provides a useful life up to five times
greater than that of competing coatings. Without effectively communicating NAC‐10’s value
proposition there is no way to effectively recruit end‐users to use NAC‐10
Reduce Perceived Risk
After communicating the value proposition, it is imperative to reduce the perceived risk
associated with adopting a new anti‐corrosive coating from a relatively small company. The risk
of purchasing and implementing a new coating is quite significant for end‐users within the
industry. By establishing independent tests from third party labs, WinTec will be able to
assuage some of the concerns regarding the risks of a new coating.
To further reduce the perceived risk, WinTec could offer a sample of the NAC‐10 coating to the
end‐user to allow them to test the coating in their own laboratories and familiarize themselves
with it. By allowing the end‐user to test the coating on their own they will be able to largely
negate the effects of perceived risk and validate the value proposition of NAC‐10.
Develop Brand Equity
After establishing a position within marketplace it is important for WinTec to then dedicate
resources to establishing brand equity and a brand reputation. This can be achieved through a
multi‐faceted approach to develop NAC‐10 and WinTec in the eyes of end‐users. The brand
reputation will be built through a combination of product performance, customer support and
a continued commitment to product quality.
14

The product’s performance will largely speak for itself, however, it is critical to ensure that
applicators apply NAC‐10 in accordance with the engineer’s specifications. If the product is
applied as prescribed and performs accordingly, end‐users will develop a trust and commitment
to WinTec and NAC‐10.
Build a Defensible Position
KSF three will dovetail right into building a defensible position for NAC‐10. As previously
discussed, the likelihood of competitors developing and marketing similar products to NAC‐10 is
incredibly significant. By developing a reputation of quality, NAC‐10 and WinTec will be in a
position to weather attacks by 3M and PPG. However, this is easier said than done when
competitors already have established brand names. In order to combat this advantage, WinTec
must hit the market hard and show an unwavering commitment to product quality and
customer service.
Exploit Supply Chain Inefficiencies
Current Fusion Bonded Epoxy (FBE) coatings have a number of limitations regarding flexibility.
The brittle nature of FBE coatings create a situation where they will frequently fracture and
flake off if the coating is damaged. This exposes the metal substrate below and makes it
venerable to corrosion. With NAC‐10 superior flexibility as a result of its polymer formula it is
considerably more durable than FBEs. This allows NAC‐10 to endure the rigors of pipe handling
and construction without being damaged. Also, this creates a situation that significantly
flattens and streamlines the supply chain; providing significant cost savings.
Porter’s Five Forces Analysis
To develop a macro view of the industry, this analysis also performed a review of Porter’s Five
Forces regarding the anti‐corrosive industry within the oil and petrochemical segment. The
analysis is available in the figure below.
15

Porter’s Five Forces Analysis
16
17
Competitive Analysis
Market Introduction
To develop a competitive analysis this analysis examined the protective coatings industry to
determine the industry’s structure and composition. On a macro‐level, the coatings industry
market grew 1.9% in 2009 to reach a value of $19.3 billion. According to data compiled in
Exhibit Four, the market is expected to continue to grow to more than $22.3 billion by 2014.
Additionally, Exhibit Nine provides and summary of production within the paint and coating
industry in 2009.
Competitive Firm Overview
The coating industry consists of a significant amount of competition. The main firms within the
industry are 3M, PPG Industries, and Bredero Shaw. Additional companies generating
substantial amount of revenue from coating products are E.I. du Pont de Nemours and
Company, Sherwin‐Williams, The Dow Chemical Company and The Valspar Corporation. Based
on this analysis, Valspar is the only company that generates 100 percent of revenues from
coating products. However, there are foreign companies that generate revenues within the
U.S. market. Akzo Nobel generates approximately 20 percent of revenues from North America.
Therefore, an analysis of Azko Nobel was performed. A significant amount of information was
derived from the most recent Annual Reports and company websites. This research provides
an in‐depth analysis for the previously listed companies. A complete list of publicly traded
companies that compete within this industry can be found as Exhibit Eight.
The companies profiled in the following sections are as follows:
1. 3M Company
2. Bredero Shaw
3. E.I. du Pont de Nemours and
Company
4. PPG Industries
5. Sherwin‐Williams
6. The Dow Chemical Company
7. The Valspar Corporation
8. Akzo Nobel
3M Company
Company Profile
3M is a widely diversified technology firm offering products that cover a wide range. 3M’s
product offerings serve the six market segments listed below.
• Industrial and Transportation
• Health Care
• Consumer and Office
• Safety, Security, Protection Services
• Display and Graphics
• Electro and Communications
The diversified offerings of 3M allow the firm to weather instabilities within one market by
offsetting it with performance within an unrelated market segment. 3M utilizes an assortment
of distribution channels to effectively reach customers and their respective markets as a result
of the business‐to‐business and business‐to‐consumer aspects of the business. The primary
segment of interest for NAC‐10 analysis is the industrial and transportation segment served by
3M. A detailed company assessment of 3M can be found in Exhibit Ten.
Industrial & Transportation Business
The industrial and transportation offerings of 3M cover an extensive set of offerings. The
primary points of concern for this analysis can be found in 3M’s industrial coatings. According
to data from 3M’s site, the Skotchkote FBE corrosion protection system has been the industry
leader since the 1960’s. The Skotchkote FBE system has developed a reputation within the
industry as tough and reliable coating that can be readily applied and trusted to last.
Additionally, the liquid epoxy version of the Sktochkote system can be utilized to fully encase
the pipeline with a durable internal pipe lining.
3M’s corrosion protection products are targeted at the following six industry segments.
• Oil and Gas
• Water Infrastructure
• Building and Construction
• Utilities and Power
18

• Transportation Infrastructure • Production and Manufacturing
Annual Revenues
The following figures provide an overview of 3M’s annual revenues for all aspects of the firm’s
operations. The industrial and transportation division, including anti‐corrosive coatings, of the
firm achieved 2009 revenues of $7.1 billion.
Research & Development Efforts
3M’s R&D expenditures accounted for nearly $1.3 billion in 2009. This exorbitantly high figure
represents 3M’s continued commitment to purposeful product innovation. Additionally, it
indicates that if NAC‐10 were to be successful within the marketplace, 3M would likely move
quickly to implement initiatives to bring a similar product to market as soon as possible.
19

Evaluation of Strategic Initiatives
In 3M’s 2009 statement to stockholders, the firm announced its resolve to continue to invest
the in the firm’s future. With R&D expenditures totaling 5.6% or revenues, 3M has an
impressive ability to continue to develop unique solutions to their customers’ problems.
Also, in January of 2009, 3M completed a purchase of Alltech Solutions. This move signaled
3M’s shift to gain market share within the infrastructure segment of the marketplace. Alltech
Solutions built a reputation based upon innovative coating products to aid in the rehabilitation
of drinking water distribution pipes. This shift to focus additional resources in the
infrastructure segment should not be ignored and instead carefully considered for WinTec to
explore.
PPG Industries
Company Profile
PPG was incorporated in 1883 and is based in Pittsburgh, PA. The firm specializes in protective
and decorative coatings. PPG operates in six industry segments.
• Performance Coatings
• Industrial Coatings
• Architectural Coatings
• Optical and Specialty Materials
• Commodity Chemicals
• Glass
The primary segments of interest for this analysis are the performance and industrial coating
segments. These segments include coatings for manufacturing, infrastructure and
petrochemical/oil segments. A detailed company assessment of PPG can be found in Exhibit
Eleven.
Performance & Industrial Coatings
The firm’s protective coatings include four main segments.
• Civil and Infrastructure Coatings • Offshore Coatings
20
• Petrochemical Coatings
• Power Coatings
The civil and infrastructure coatings cover anti‐corrosive coatings for use in bridges, pipelines,
water and wastewater treatment plants, water transmission lines and water storage tanks. The
offshore coatings PPG offers are primarily epoxy based and designed to handle highly corrosive
environments created by the presence of hydrocarbons. The petrochemical coatings largely
mirror the composition of the offshore coatings and offer similar performance for onshore
petrochemical applications. Finally, the power coatings are designed for applications in fossil
fuel plants, nuclear energy plants, hydroelectric generation plants, wind energy generation and
power transmission towers.
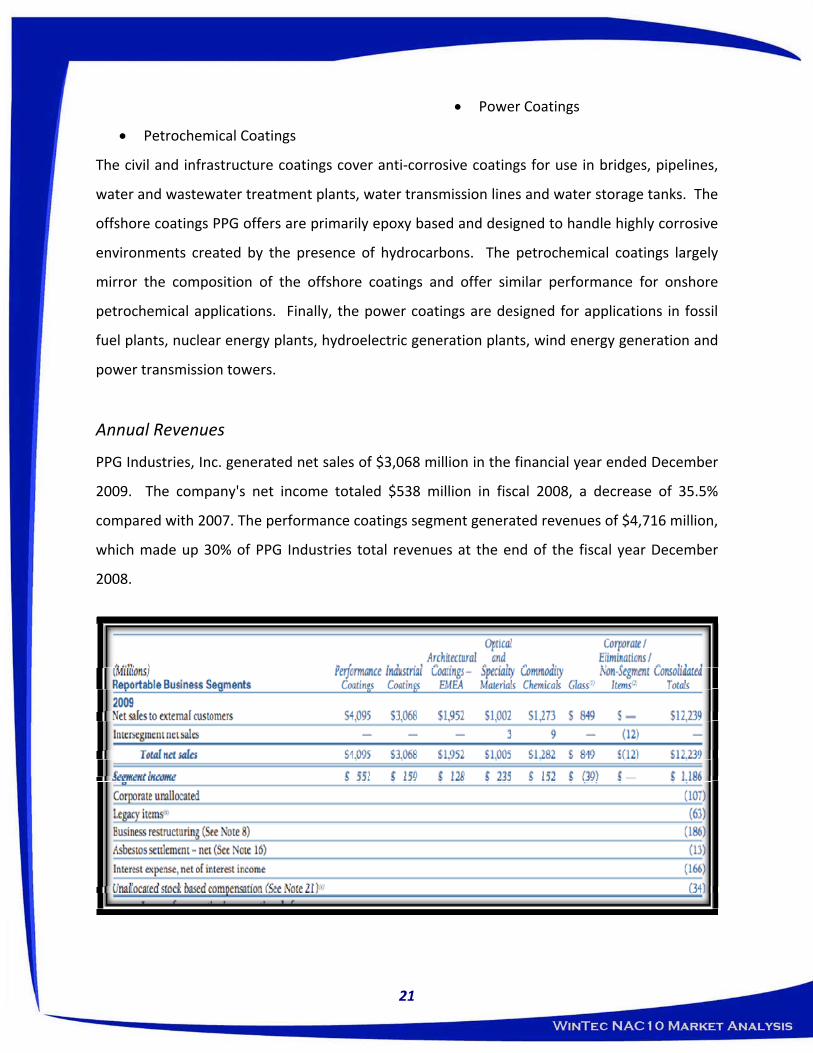
Annual Revenues
PPG Industries, Inc. generated net sales of $3,068 million in the financial year ended December
2009. The company's net income totaled $538 million in fiscal 2008, a decrease of 35.5%
compared with 2007. The performance coatings segment generated revenues of $4,716 million,
which made up 30% of PPG Industries total revenues at the end of the fiscal year December
2008.
21

Research & Development Efforts
Research and development costs, including depreciation of research facilities, were $403
million, $468 million and $363 million during 2009, 2008 and 2007, respectively. These costs
totaled approximately 3% of sales in each of these years, representing a level of expenditure
that is expected to continue in 2010. PPG owns and operates several facilities to conduct
research and development relating to new and improved products and processes. Additional
process and product research and development work is also undertaken at many of the
Company’s manufacturing plants.
Evaluation of Strategic Initiatives
In an effort to streamline operations and cut costs, PPG is in the process of a firm wide
restructuring. During the first quarter of 2009, PPG booked a $186 million cost for the
restructuring expenses. This restructuring effort was also facilitated to fully integrate the
product offerings from PPG’s 2008 acquisition of Sigma Coatings. Sigma Coatings specializes in
protective coatings, specifically within the infrastructure segments. Similar to 3M this
acquisition, demonstrates PPG’s commitment to the fully capitalizing on the infrastructure
segment of the protective coatings.
Bredero Shaw
Company Profile
Bredero Shaw is set up as a division of ShawCor Ltd. and is the leader of pipe coatings within
the industry. Based out of Houston, TX and incorporated in the 1930’s, Bredero Shaw’s focus is
on protective industrial coatings. Bredero Shaw’s coatings compete within three main industry
segments: oil, gas and water segments. A detailed company assessment of Bredero Shaw can
be found in Exhibit Twelve.
Anti‐Corrosive Coatings
22

Bredero Shaw offers a wide range of anti‐corrosive coatings for both onshore and offshore
applications. Listed below are Bredero Shaw’s anti‐corrosive coatings.
• 3LPE: Three Layer Polyethylene Coating • 3LPP: Three Layer Polypropylene Coating • AE: Asphalt Enamel Pipeline Coating • FBE: Fusion Bonded Epoxy Powder Coating • Dual Layer FBE: Dual Fusion Bonded Epoxy Powder Coating • LAT‐FBE: Low Application Temperature Fusion Bonded Epoxy Powder Coating • HPCC: High Performance Composite Coating • HPCC SE: High Performance Composite Coating Side Extruded • PRITEC®: Multi‐Layer PE Coating • Yellow Jacket®: High Density Two Layer Polyethylene Coating • YJ2K®: Three Layer Bonded PE Coating for Higher Temperatures
Additionally to provide internal pipe protection, Bredero Shaw offers six different internal
coatings. The internal pipe coatings offer corrosion protection for the interior of the pipe,
enhance hydrodynamics of the pipe and increase the ease of internal visual pipe inspection.
Listed below are the firm’s internal pipe coatings.
• SureFlo® CML: Centrifugally Applied Cement Mortar Lining • SureFlo® FBE: Internal FBE Lining • SureFlo® FEC: Thin Film Internal Epoxy Coating • SureFlo® SF: Solvent Free Thin Film Internal Epoxy Coating • WaterGuard™ LE: Solvent Free Epoxy Protective Lining • WaterGuard™ PU: Solvent Free Rigid Polyurethane Lining
Annual Revenues
2009 revenues for ShawCor totaled $1.183 billion with an annual net income equal to $131.45
million. Precise figures could not be found, however, it is estimated that Bredero Shaw
revenues accounted for nearly 40% or ShawCor’s annual total.
Research & Development Efforts
Bredero Shaw has developed over 40 leading pipe‐coating technologies designed to protect
pipelines across all segments of the market. Bredero Shaw has also engaged in active
participation with industry organizations such as NACE, ISO, CSA, IPLOCA, NAPCA and AWWA,
to address key industry issues by initiating and implementing new pipe coating solutions.
23

24
Bredero Shaw currently leads the industry in innovation, holding over 100 patents covering new
products and process technology in the pipe coating industry.
Evaluation of Strategic Initiatives
In addition to Bredero Shaw’s extensive expenditures in protective pipe coatings, ShawCor is
also continuing to expand into other anti‐corrosive pipeline technologies. In 2008, the firm
acquired Flexipipe Systems, a firm that developed coiled, corrosion resistant pipe for
infrastructure applications. The high‐density polyethylene and glass wound pipe offers high
corrosion resistance and simplifies pipeline installation through long‐line offerings.
The pipeline coils can accommodate up to 6,900 feet of continuous pipeline which significantly
reduces installation costs. Applications for the Flexpipe Systems include small diameter
pipeline, oil & gas gathering, water disposal and injection pipelines, gas transmission pipelines
and other applications where a corrosion resistant, high pressure pipeline is required. This
acquisition fits with the strategic movements of PPG & 3M shifting additional resources into the
infrastructure segments.
E.I. du Pont de Nemours and Company ( DuPont )
Company Profile
DuPont offers a wide range of products fitting into multiple product segments. Segments
targeted by DuPont are listed below.
• Agriculture & Nutrition
• Electronics & Communications
• Performance Chemicals
• Performance Coatings
• Performance Materials
• Safety & Protection
• Pharmaceuticals
The segment of primary concern for this analysis is the performance coating segment of
DuPont. A detailed company assessment of DuPont can be found in Exhibit Thirteen.
Performance Coatings
DuPont has several different types of performance coatings.
1. Water Base 2. Alkyd 3. Epoxies 4. Polyurethanes 5. Zinc 6. High Temperatures 7. Premex Products
The epoxy coating product line is most significant to the piping industry. The epoxy coating
portfolio consists of the following:
• CORLO ® 823 IN. • CORLO ® AE 823. • 99P200 CORLO ® CLEAR • DUPONT ® 25P EPOXIMASTIC ® HIGH SOLIDS.
DUPONT ® 25P. • CORLO ® AE 823. • DUPONT ® 25P EPOXIMASTIC ® HIGH SOLIDS. • CORLO ® PLUS 24P 100%. • Corlar ® 825. • COAL TAR CORLO ®
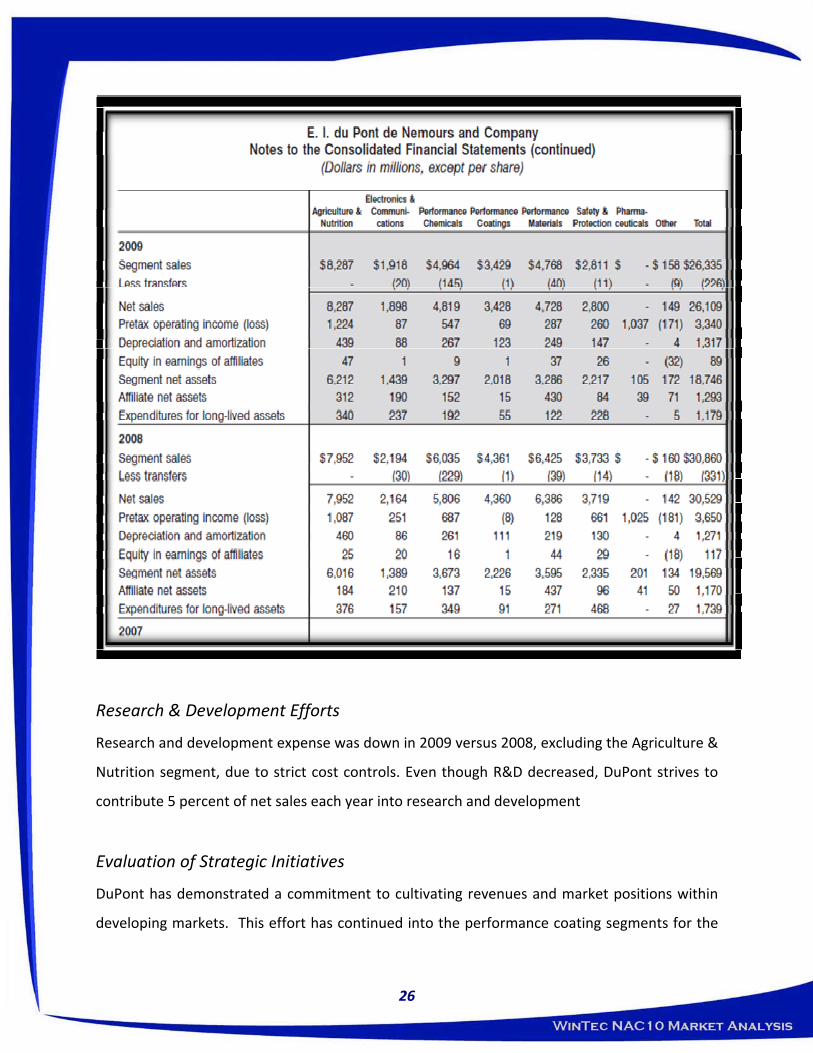
Annual Revenues
DuPont generated revenues of $31,836 million in the financial year ended December 2008, an
increase of 8.4% compared to the previous year. The company's net income totaled $2,007
million in fiscal 2008, a decrease of 32.8% compared with 2007. For the fiscal year ended
December 2008, 36% of sales were generated within the US. The company has generated
$3,429 in revenue from their performance coatings. Despite the decline from 2008, DuPont still
generates 13 percent of sales from this segment.
25
Research & Development Efforts
Research and development expense was down in 2009 versus 2008, excluding the Agriculture &
Nutrition segment, due to strict cost controls. Even though R&D decreased, DuPont strives to
contribute 5 percent of net sales each year into research and development
Evaluation of Strategic Initiatives
DuPont has demonstrated a commitment to cultivating revenues and market positions within
developing markets. This effort has continued into the performance coating segments for the
26

27
rapidly growing infrastructure within the developing markets of China, India, Latin American
countries and Southeast Asia.
Dow Chemical Company
Company Profile
Dow is a large multi‐national firm serving multiple product segments in more than 160
countries. The segments served by Dow Chemical are listed below.
• Electronic and Specialty materials
• Coatings and Infrastructure
• Health and Agricultural sciences
• Performance systems
• Performance products
• Basic plastics,
• Basic chemicals
• Hydrocarbons and Energy
The primary focus of this analysis is on Dow’s coatings and infrastructure segment. A detailed
company assessment of Dow Chemical can be found in Exhibit Fourteen.
Coatings and Infrastructure
Dow Coating Materials is the division of Dow that provides industrial and protective coatings
rivaling NAC‐10. A select product portfolio of coatings competing with NAC‐10 is listed below.
• AVANSE™ MV‐100 o This high‐performance, low VOC binder technology is used in a variety of
industrial maintenance applications, offering a more environmentally‐advanced option. This product provides excellent adhesion, durability and corrosion resistance, as well as the potential for formulated cost savings and reduced supply chain complexity.
• MAINCOTE™ EC‐11 o This highly versatile, 100% acrylic resin offers exceptional performance in
elastomeric coatings for industrial maintenance applications. Designed primarily for metal and cementitious substrates, this binder enables coatings to have excellent corrosion and water resistance, superior adhesion, and outstanding flexibility and impact resistance, even at low temperatures. In addition, this technology is APEO surfactant‐free and allows for low VOC formulations.
• MAINCOTE™ AU‐28 o An excellent acrylic polyol for two‐component, water‐based polyurethane
coatings. Useful in high performance and low VOC industrial coatings, this

hydroxyl‐functional polymer provides clear and pigmented topcoats with high gloss and excellent durability.
• MAINCOTE™ HG‐31 o As a highly versatile, water‐based acrylic resin for water‐resistant industrial
coatings used on masonry and steel substrates, this product displays excellent performance in primers and direct‐to‐metal (DTM) finishes. Its outstanding performance properties include excellent corrosion resistance and adhesion, as well as superior water whitening (blushing) resistance in clear coatings.
• RoShield™ 636 o This new, very hard, styrene‐acrylic emulsion that offers one‐component, self‐
cross‐linking technology in a low formaldehyde/formaldehyde‐free environment, and is used in finishes for kitchen cabinets, moldings and other interior board applications.
Annual Revenues
28

Research & Development Efforts
In 2009, Dow invested a record $1.6 billion in R&D. Dow’s continued investments are paying
off; nearly tripled the firms R&D pipeline valuation to $28 billion in just three years. At the
same time, Dow has implemented a rigorous, cross‐company system of portfolio management
to ensure every research dollar is spent on the highest value‐adding opportunities.
Evaluation of Strategic Initiatives
Beginning in 2009, Dow began a shift away from commodity chemicals and into high profit
margin specialties. For instance, in early 2010 Dow announced its investment into clean
filtration technologies. These types of high‐margin and high‐growth ventures epitomize the
route Dow is planning for their long‐term growth. Additionally, following the acquisition of
chemical conglomerate Rohm & Haas for $15 billion in 2009; Dow undertook a process to
streamline operations and reduce its workforce by 2,500 employees.
Sherwin‐Williams
Company Profile
The Sherwin‐Williams Company develops, manufactures and sells coatings for retail,
commercial and industrial applications. Sherwin‐Williams coatings are split into three groups:
the residential paint stores group, the residential consumer group and the
commercial/industrial global finishes group. The global finishes group will be the focus of this
analysis because it offers industrial anti‐corrosive coatings. A detailed company assessment of
Sherwin‐Williams can be found in Exhibit Fifteen.
Industrial & Commercial Coatings
Sherwin‐Williams offers a wide array of industrial coatings. Some of the firm’s structural steel
anti‐corrosive coatings include: zincs, epoxies, urethanes, polyaspartics and polysiloxanes.
29

Additionally, Sherwin Williams features the Euronavy ES301 anti‐corrosive coating for offshore
applications and highly‐corrosive environments.
Euronavy ES301 distinctive features:
Product Features
• Modified epoxy, polyamine cured • Solvent free • Tolerant to damp surfaces • No dew point restrictions • Tolerance to adherent iron oxides • High compatibility with old coatings • Very high adhesion to steel (> 170
Kg/cm2) • Reacts with steel, oxides and
moisture • Steel roughness is not a critical factor• “edge retentive” version (ES301 S)
available. • Friendly pot‐life (up to 3 hours at
25ºC) • Applicable by brush, roll or airless
(60:1) with adequate viscosity.
System Characteristics
• Surface preparation standard: hydroblasting to SSPC SP12 Wj2 (Wj2‐M visual standard as per SSPC Vis4 – NACE Nº7, MEDIUM flash rust)
• Typical DFT per coat: 100 – 150 microns
• Same product for priming / intermediate / finish
• If UV resistance is needed, the system may include a classic polyurethane topcoat
• 2 or 3 coat systems, ranging from 200 to 450 microns total DFT, depending on the areas to be protected, corrosiveness and service life target.
• Comfortable recoating window (16 h – 1 week at 25ºC)
• No need for dehumidification in enclosed spaces such as tanks and voids.
Annual Revenues
The Sherwin‐Williams Company generated revenues of $7,980 million in the financial year
ended December 2008, a decrease of 0.3% compared to the previous year. The company's net
income totaled $476.9 million in fiscal 2008, a decrease of 22.5% compared with 2007.
At the end of the fiscal year December 2008, the paints stores group had taken revenues of
$647.9 million whilst, the consumer group and global finishes group took revenues of $140.2
30
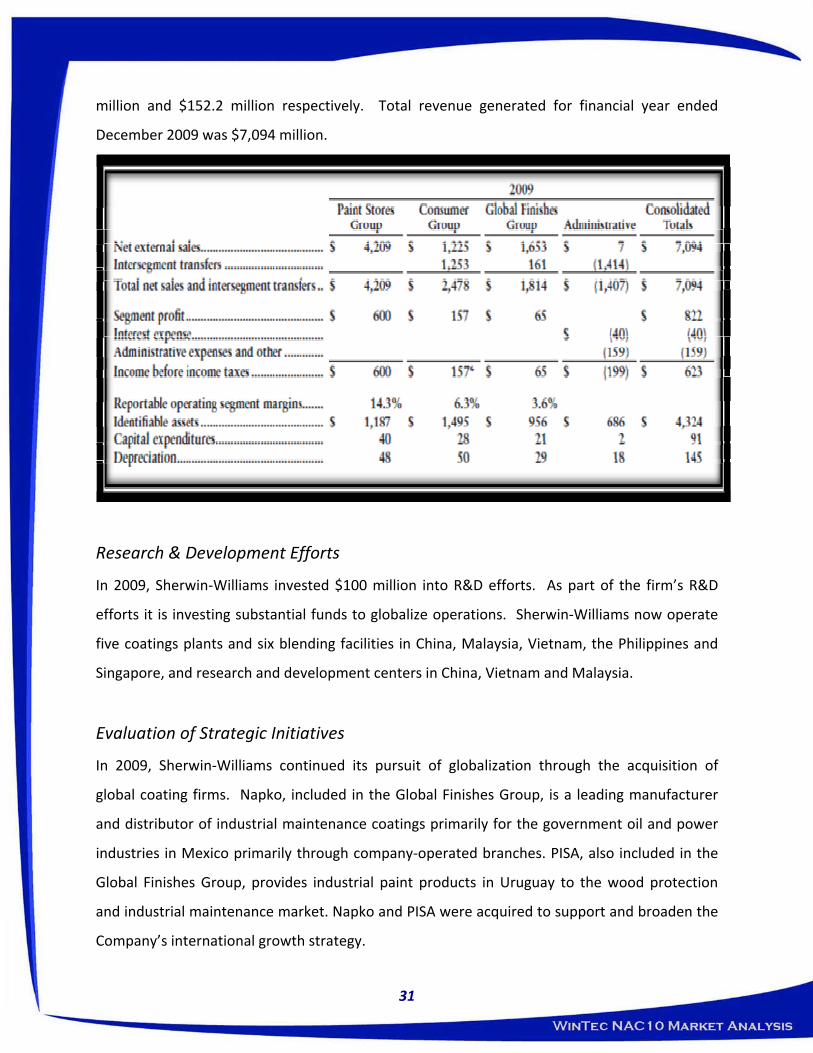
million and $152.2 million respectively. Total revenue generated for financial year ended
December 2009 was $7,094 million.
Research & Development Efforts
In 2009, Sherwin‐Williams invested $100 million into R&D efforts. As part of the firm’s R&D
efforts it is investing substantial funds to globalize operations. Sherwin‐Williams now operate
five coatings plants and six blending facilities in China, Malaysia, Vietnam, the Philippines and
Singapore, and research and development centers in China, Vietnam and Malaysia.
Evaluation of Strategic Initiatives
In 2009, Sherwin‐Williams continued its pursuit of globalization through the acquisition of
global coating firms. Napko, included in the Global Finishes Group, is a leading manufacturer
and distributor of industrial maintenance coatings primarily for the government oil and power
industries in Mexico primarily through company‐operated branches. PISA, also included in the
Global Finishes Group, provides industrial paint products in Uruguay to the wood protection
and industrial maintenance market. Napko and PISA were acquired to support and broaden the
Company’s international growth strategy.
31
32
Another company acquired was MAB. MAB services the professional painting contractor and
builder markets through its own company‐operated stores. MAB was acquired as part of the
Company’s domestic controlled‐distribution growth strategy. Nitco, included in the Global
Finishes Group, is a leading manufacturer and distributor, especially in western India, of
exterior paints and coatings used in the construction of office buildings, high rise apartments,
shopping malls, hospitals and schools. Nitco was acquired to support the Company’s growth
strategy into new international markets.
Valspar Corporation
Company Profile
Valspar offers a wide array of coating products for a number of industries. The coating
segments offered by Valspar are listed below.
• Consumer
• High Performance Architectural Coatings
• Packaging Coatings
• Wood Coatings
• Industrial Coatings
• Automotive Coatings
• Kustom Finishes
• Coating Intermediates
The primary segment of concern for this analysis is the industrial coatings section. The
industrial coatings segment offers anti‐corrosive and protective coatings. A detailed company
assessment of Valspar can be found in Exhibit Sixteen.
Industrial Coatings
The Company’s general industrial product line provides customers a variety of industries with a
single source for powder, liquid and electro‐deposition coatings technologies. The firm’s
featured product is the Valspar Pipeclad FBE coating. The Pipeclad FBE system has provided
long‐term protection for over 100,000 miles of pipelines, ranging in diameter from 2" to 48".
Additionally, Valspar claims their coatings are specifically engineered to minimize damage

during transit, installation and operation to protect against all of the corrosive elements
associated with underground and underwater environments.
Annual Revenues
Net sales for 2009 fell 17.3 percent to $2.879 billion, reflecting the impact of the global
recession. Sales in the Paints segment declined 4.9 percent. The North America architectural
product line posted increased sales for the year, while the overall paint market declined more
than 10 percent. Coatings segment sales were down 22.9 percent. The performance of the
global packaging product line helped to mitigate the impact of lower revenues in our industrial
product lines. Net income in 2009 totaled $160.2 million, up $9.4 million from $150.8 million in
2008
Research & Development Efforts
Research and development costs for fiscal 2009 were $91.3 million or 3.2% of net sales,
compared to $96.6 million or 2.8% of net sales for fiscal 2008 and $90.3 million or 2.8% of net
sales for fiscal 2007. The primary emphasis has been on developing and refining emerging
technologies in Valspar’s Industrial Coatings segment.
Evaluation of Strategic Initiatives
Valspar’s long‐term strategy has been to build its brand reputation, develop leading‐edge
technologies and expand its global presence. Higher awareness of the Valspar brand in the
United States resulted in increased share and significantly outperformed the overall market for
consumer paint.
Acquisitions have historically contributed significantly to the growth of the company. As part of
the growth strategy, Valspar intends to continue to pursue acquisitions of complementary
businesses and products.
33
Akzo Nobel N.V.
Company Profile
Based in Amsterdam, Akzo Noble operates in 80 countries worldwide with product offerings in
three different business segments. The three business segments include: specialty chemicals,
decorative paints, and performance coatings. The primary focus of this analysis is on Akzo’s
performance coating segment. A detailed company assessment of Akzo Nobel can be found in
Exhibit Seventeen.
Performance Coatings
Akzo provides products for the oil and gas pipeline industry are classified as systems:
• System A o A high durability (above 15 years) coating specification designed for
environments classified by ISO 12944‐2 as C3 medium corrosivity. • System B
o A high durability (above 15 years) coating specification designed for environments classified by ISO 12944‐2 as C5‐M very high corrosivity (Marine).
• System C o A high durability (above 15 years) coating specification designed for
environments classified by ISO 12944‐2 as C5‐M very high corrosivity (Marine). • System D
o A high durability (above 15 years) coating specification designed for environments classified by ISO 12944‐2 as C5‐M very high corrosivity (Marine).
Annual Revenues
Akzo Nobel N.V. generated revenues of $22,556 million in the financial year ended December
2008, an increase of 50.9% compared to the previous year. The company reported a net loss of
$1,589.1 million in fiscal 2008, compared to a net income of $13,697.5 million the previous
year. The Americas generated 33% of the total annual revenues in 2008. The decorative paints
segment of the company generated revenues of $7,424.5 million in 2008, whilst the
performance coatings segment and specialty chemicals took revenues of $6,474.9 million and
$8,246.9 million respectively.
34

35
Research & Development Efforts
Akzo Nobel’s R&D strategy is focused on innovation projects with the highest potential for
major impact. Major programs on water‐based decorative and protective coatings, next
generation antifouling coatings, self‐healing coatings, low energy curing, delivery systems, bio‐
renewable raw materials and advanced processing technologies all feature in this list of exciting
developments.
Evaluation of Strategic Initiatives
Akzo has been steadily investing in building a global position, especially in high growth markets;
notably China and Eastern Europe. Akzo maintained their strategy of focusing on defined
market segments and developing segment‐specific value propositions which offer customers a
complete service package rather than just a product. Their sites are also becoming more
dedicated by concentrating on specific technologies and segments.
Competitive Coating Overview
The anti‐corrosive protective coating marketplace consists of a number of different
compounds. The five most common types of anti‐corrosive coatings are listed below.
• Fusion Bonded Epoxies (FBEs)
• Three Layer Polyethylene (3LPE)
• Three Layer Polypropylene (3LPP)
• Coal Tar Enamel (CTE)
• Polyurethane (PUR)
Exhibit Nineteen provides a detailed overview of each coating and the various market shares
within the industry.
Fusion Bonded Epoxies
According to the data from Exhibit Eighteen, FBEs rose to prominence after being developed by
3M with the first pipe applications in the early 1960’s and the first for large diameter pipe
applications in 1965. At the close of the 1970’s FBEs were the dominant anti‐corrosive coatings

for pipelines in the United States, Canada, Sauid Arabia and the United Kingdom. Additionally,
FBEs have developed a niche market in rebar applications for the same geographic markets.
While offering some long‐term corrosion protection for pipelines, FBEs’ hard coatings are
frequently damaged pipe manufacturing, pipe handling and shipping and pipe installation. Due
to these limitations cathodic protection systems must be used in conjunction with FBEs to
provide adequate anti‐corrosion protection.
FBEs do offer good adhesion, chemical resistance, temperature resistance and corrosion
protection overall. These coatings are factory applied to pipeline segments with the welded
joints being protected by field‐applied coatings. The Expected useful life of FBE coatings is
projected at 20 to 30 years in ideal conditions.
To help mitigate the brittle nature of FBE coatings, manufacturers have began applying an
exterior layer of high‐density polyethylene or polypropylene over the FBE base coat. This new
top coat process has dramatically increased the flexibility and impact resistance of FBE coatings.
Three Layer Polyethylene
Three layer polyethylene systems are the dominant anti‐corrosive coating worldwide, with 50
per cent market share, for onshore pipelines. However, that does not hold true in North
America where FBEs control the marketplace. The trend is increasing with a greater number of
projects coated with 3LPE in China, India and the Middle East. The increased acceptance of
3LPE is due to its broad operating temperature range (from ‐45°C to + 85°C) and ability to
withstand very rough handling and installation practices without damage to the coating.
3LPE systems consist of an epoxy primer, a grafted copolymer medium density (MDPE)
adhesive to bond the epoxy primer with a high density (HDPE) topcoat (Exhibit Nineteen).
36

Three Layer Polypropylene
3LPP systems are recognized as excellent systems for offshore projects with elevated operating
temperature (0°C to +140°C) and extreme mechanical stress on the pipes. Recent projects in
the North Sea, Africa, Gulf of Mexico and Arabian regions have set new standards for 3LPP
coatings, which provide access to deeper gas and oil fields. 3LPP system consists of an epoxy
primer, a grafted copolymer PP adhesive to bond the epoxy primer with a PP topcoat (Exhibit
Nineteen).
Coal Tar Enamel
Coal tar and asphalt enamel are antiquated anti‐corrosive coatings that are both still used in
some countries. For many refineries, which have their own pipelines, coal tar is the cheapest
coating option, being their own product. Both systems are declining and suffer from health and
environmental concerns (Exhibit Nineteen).
Polyurethane
Polyurethanes combine excellent durability and melt strength of the polymer with very high
properties like notch resistance, abrasion resistance, improved impact at low and elevated
temperatures, peel strength and indentation resistance. The HDPE and PP top coat are supplied
in compounded form to withstand long‐term thermal ageing and light ageing (Exhibit
Nineteen).
Coating Price Points
This analysis was unable to secure exact pricing figures for each of the product reviewed.
However, Exhibit Twenty offers some insight regarding the recent price increases with the
industrial coating segment of the marketplace. For instance in the spring of 2008 BASF
announced that all of their industrial coatings would see a price increase between five and eight
percent as a result of the escalating costs of inputs, energy and product transportation.
37

Also in 2008, Akzo Nobel implemented a 15% price escalation across all of its industrial
coatings. Akzo, cited many of the same impacts that BASF cited in their announcement,
indicating that the scenarios impacting these two firms are industry wide and not isolated.
These recent price escalations must be taken into consideration when pricing NAC‐10. It is
essential to price the product sufficiently high enough to above having to repeatedly increase
the coatings selling price as the price of inputs shifts.
Evaluation of Coating Process
According to data compiled in Exhibit Twenty One, the FBE powder coating application has
three essential stages:
1. The steel surface is thoroughly cleaned 2. The cleaned metal part is heated to the recommended FBE powder application
temperature 3. The application of the FBE coating and curing stage
The conventional application procedure involves abrasive cleaning of pipe and fittings. The
surface is cleaned to NACE level2 using steel grit and shot of the proper size to obtain a 2.5‐ to
4.5‐mil profile. The surface is then checked for salt contamination and, if necessary, washed
with phosphoric acid and then deionized water. Chromate is applied to enhance the adhesive
strength of some FBE formulations. This surface is then heated to 450 to 488F. The finely
powdered, unreacted FBE is then fluidized with cold, dry air and conveyed to an electrostatic
spray system. The fluidized FBE powder is then sprayed onto the hot pipe surface using a series
of spray guns. FBE, which is solid at ambient temperature, melts when it contacts the hot
surface. The melted epoxy resin reacts with the curing agent contained in the FBE system and
bonds to the substrate
The required profile for FBE application is 2.5 to 4.5 mil. The peak heights and densities of the
profile have a profound effect on the corrosion protection performance of the coating. Proper
initial adhesion and the powder coating's ability to provide adequate adhesion throughout the
design life of the pipeline are the key factors in providing adequate corrosion protection.
38

The success of the FBE coating as a corrosion control system for underground pipelines lies in
its ability to limit oxygen and water transport to the pipe surface and compatibility with the
alternate CP system. The properties of FBE are designed such that it will work in conjunction
with the CP system, not interfere with it. However, the application parameters including surface
cleanliness, removal of contaminants, profile shape and densities, initial application
temperature and curing temperature and time play a critical role in ensuring these important
properties.
Upon completion of the coating operation, but prior to storage, the coating must be inspected
for continuity in accordance with NACE Standard RP0490‐01. The search electrode is steel
spring or conductive rubber. The thickness of the coating will be checked with properly
calibrated magnetic thickness gauge and shall have nominal thickness of 16 mils/406 μm with a
minimum of 12 mils/305 μm or as required by the specifications.
The above listed overview of the FBE application process is actually much more complicated
than that of NAC‐10. This indicates that there would be some cost savings through the use of
NAC‐10 regarding the application process. Additionally, the simple paint‐like way that NAC‐10
can be applied indicates that there would be a significant number of applicators capable of
applying NAC‐10 properly.
Licensing & Prequalification of Coating Applicators
This analysis also examined the prequalification process that would be essential to ensure that
qualified applicators were applying NAC‐10. This is absolutely essential to the long‐term
viability of NAC‐10 because the integrity of the brand can only be maintained through ensuring
proper application of the coating. Regardless of how good NAC‐10 is, if it is improperly applied
it will fail and negatively impact the brand’s reputation.
39

To provide recommendations on applicator licensing and prequalification, this analysis
examined the methods of prequalification utilized by competitors. A detailed representation of
this of this data can be found in Exhibit Twenty Two.
The most prominent certification for the applicator to have would be an ISO 12944 certification
standard. ISO 12944 is an international standard for Paints and varnishes ‐ Corrosion protection
of steel structures by protective paint systems ‐Part 5: Protective paint systems. This standard
is used by the competition analyzed in this document, as well as other industry leaders. They
have a proven track record that identifies these companies as the market leaders.
• ISO 12944 Paints & Varnishes ‐ Corrosion Protection of Steel Structures by protective
paint systems
• The ISO 12944 standard is intended to assist engineers and corrosion experts in
adopting best practice in corrosion protection of structural steel at new construction.
• ISO 12944 is progressively superseding regional standards to become a truly global
benchmark in corrosion control.
Selecting specifications that comply with ISO 12944 provides you with:
• Confidence that the corrosion protection you specify will be fit for purpose
• An objective approach to coating selection
• A simplified matrix of coating systems to select from
• A meaningful coating design life
• A universally accepted standard
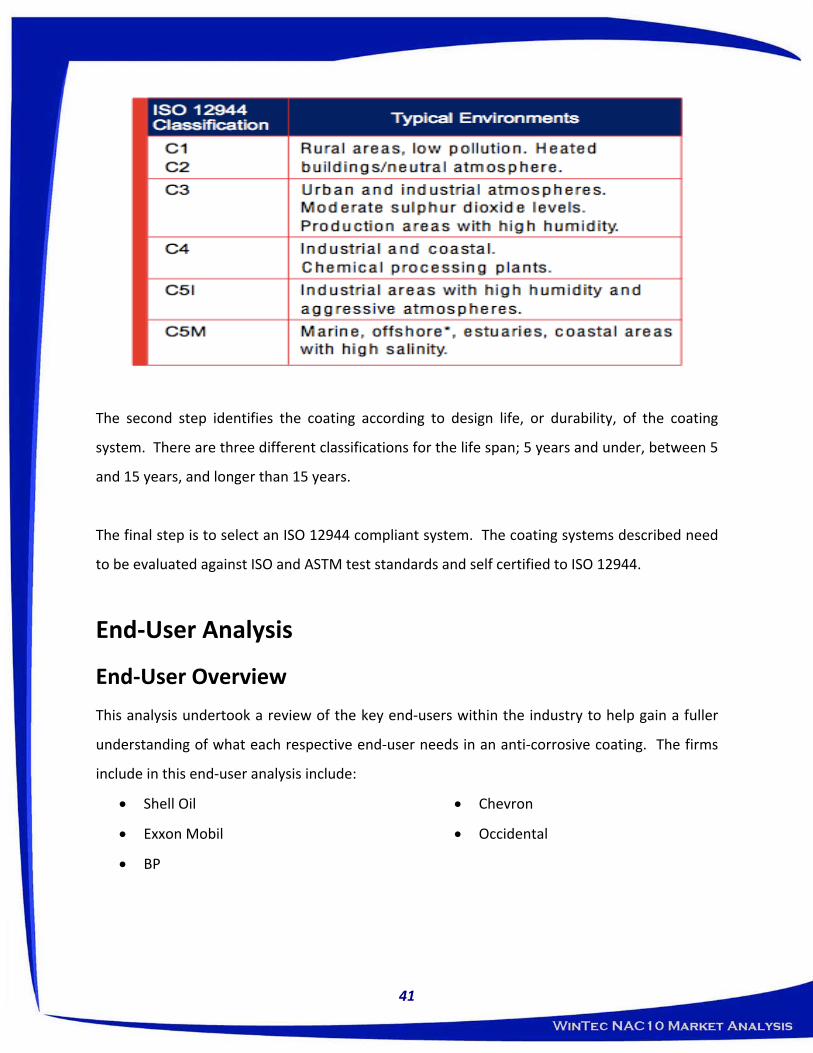
The first step in identifying the classification of the coating is to determine the environment.
The chart below categorizes the industry:
40
41
The second step identifies the coating according to design life, or durability, of the coating
system. There are three different classifications for the life span; 5 years and under, between 5
and 15 years, and longer than 15 years.
The final step is to select an ISO 12944 compliant system. The coating systems described need
to be evaluated against ISO and ASTM test standards and self certified to ISO 12944.
End‐User Analysis
End‐User Overview
This analysis undertook a review of the key end‐users within the industry to help gain a fuller
understanding of what each respective end‐user needs in an anti‐corrosive coating. The firms
include in this end‐user analysis include:
• Shell Oil
• Exxon Mobil
• BP
• Chevron
• Occidental

Shell Oil
Company Profile
Shell is the market leader through approximately 25,000 Shell‐branded gas stations in the US
which also serve as Shell's most visible public presence. Shell is a leading oil and gas producer in
the deepwater Gulf of Mexico, a recognized pioneer in oil and gas exploration and production
technology and one of America’s leading oil and natural gas producers, gasoline and natural gas
marketers and petrochemical manufacturers. It operates in 50 states and employs more than
22,000 people delivering energy in technically innovative ways. A full detailed analysis of Shell
Oil can be found in Exhibit Twenty Three.
Shell’s presence in the U.S. dates back nearly 100 years, first as a Pacific Coast gasoline
marketer and Midwest oil producer. In that time, Shell has been a key player in innovation and
is pushing the limits of what is technically feasible to locate and extract energy resources from
increasingly difficult locations.
Shell Pipeline Company takes steps to preserve the integrity of the pipelines, storage tanks and
facilities to help keep them safe, reliable and environmentally sound.
• Shell conducts risk and integrity assessments by performing scheduled inspections
and integrating data from numerous sources.
• Using sophisticated computer and telecommunications equipment located along the
pipeline system, Shell monitors the pipelines from the control centers 24 hours a
day, seven days a week. If a problem is detected, Shell takes quick action to correct
it.
• Shell conducts frequent ground or aerial surveys along the pipeline routes, looking
for any excavation activity or ground discoloration that could indicate a leak.
• Shell also periodically reassesses the maintenance and damage prevention activities,
looking for opportunities to improve them.
42
Every day, Shell moves more than 7 million barrels of crude oil and refined products from
source to market, across 10,000 miles of pipelines in 22 states and the Gulf of Mexico through
an efficient, integrated network of trunk lines, distribution systems, interconnects, and
terminals. Shell recognizes that protecting the quality of products it ships and distributes is
critical to its success and to its customers' success. Shell's focus on quality and safety is
underscored through programs to test and monitor products, pipelines and terminals through
all phases of transportation.
Shell’s Strategic Direction
With up to 70% of oil being left behind in the reservoir because it is too difficult or costly to
recover, Shell is using technology to ‘squeeze’ more out. Enhanced oil recovery is the key
technology here – enabling the remaining oil to flow in to the wells and up to the surface.
Advanced drilling techniques and technologies are also helping Shell to access valuable oil and
gas with wells that extend many miles and snake around underground obstacles to reach
multiple small reservoirs. And by finding ways to safely and cost effectively transport gas, Shell
can put more of this resource to use even when it is far away from where it’s needed.
Shell’s Project Locations
Shell has project locations in the following place through out the United States: Alabama,
Alaska, Colorado, Deerpark, Geismar, Gulf of Mexico, Perdido, Port Arthur Expansion Project,
South Texas, Wyoming.
Shell’s Alabama facility is designed to process 200 million cubic feet (mmcf) of sour gas per day,
which provides the source for three commercialized products: gas to fuel homes and industry,
natural gas liquids and sulfur.
43

The plant also has processing agreements to gather and treat raw gas produced from certain
offshore fields operated by Chevron in Viosca Knoll. Chevron production is received at the
Fairway platform and then transported to the Yellowhammer Plant via a 12” pipeline.
Shell’s Alaskan operations date back to 1918. In 2011 Shell plans to form a joint cooperative
project with Beaufort Sea Details to drill two exploration wells in Camden Bay.
Deerpark is the sixth largest refinery in the US. In February 1993, Shell Oil Company and PMI
Norteamerica, S.A. de C.V., a subsidiary of Petroleos Mexicanos (Pemex), formed a 50‐50 joint
venture, Deer Park Refining Limited Partnership (DPRLP). In March 2001 Shell completed a $1
billion capital upgrade. The project improved DPRLP’s global competitiveness, operating
efficiency and long‐term economic viability while significantly reducing air emissions.
The assets of the refinery are managed and operated by Shell Oil Company through Shell Deer
Park Refining Company, a division of Shell Oil Products Company, a Shell Oil subsidiary. Today,
Shell Deer Park is home to the sixth largest refinery in the United States with a crude oil
capacity of 340,000 barrels a day (42 gallons per barrel).
The Shell Geismar facility manufactures Detergent Alcohols, Ethylene Glycol, Alpha Olefins, and
a diversified line of ethylene based industrial chemicals used in a wide range of modern
applications. The Shell Geismar Plant site currently contains approximately 800 acres of which
only 400 acres are developed.
Shell operations in the GOM provide more than 36 percent of Shell's Upstream America's oil
and gas production. Shell has approximately 1,600 contract and full‐time employees in the
GOM.
• Shell operates six major offshore facilities, 13 manned platforms, one spar and
numerous subsea systems in the GOM.
44

• Shell facilities in its East GOM portfolio include three tension leg platforms: Mars,
Ursa and Ram‐Powell, as well as fixed platforms: Cognac, West Delta 143 and Main
Pass 252. Subsea systems include Europa, King, Deimos, Crosby, Princess, Mensa,
Tahoe, SE Tahoe and Einset.
• Shell facilities in its West GOM portfolio include the newest platform ‐ the Perdido
spar, two tension leg platforms Auger and Brutus, as well as fixed platforms:
Enchilada, Cougar and Boxer. Subsea systems include Macaroni, Serrano, Oregano,
Llano, Habanero, Angus, Manatee, Troika, Popeye, Gyrfalcon and Glider.
• Shell currently has four Mobile Offshore Drilling Units (MODUs) under contract,
operating across the deepwater Gulf of Mexico.
• Shell also is involved in partner‐operated deepwater projects, such as Nakika,
Conger, Marlin, Holstein and Morpeth. In instances when Shell is not the operator, it
does not manage storm or hurricane procedures for these assets. Shell only has
authority for Shell‐operated facilities.
Perdido, TX marks a new era in innovation for Shell. The facility sits in approximately 2,450
metres (8,000 feet) of water to access reservoirs deep beneath the ocean floor. As production
reaches full capabilities, the annual peak production will be more than 100,000 barrels of oil
equivalent per day.
Motiva Enterprises is expanding its Port Arthur Refinery (PAR) in Texas by 325,000 barrels per
day (bbl/d), taking total capacity to 600,000 bbl/d. Following the expansion, the PAR will be one
of the largest refineries in the US. Shell owns 50% of Motiva; the remaining 50% is owned by
Saudi Aramco. The expanded Port Arthur refinery will be capable of handling most grades of
crudes, even the lowest quality. A new three‐unit naphtha processing complex will include a
catalytic reformer which will convert 85,000 b/d into high octane gasoline for blending. The
scale of the expansion includes 725 pumps, 19 compressors, 514 heat exchangers and 54 new
tanks.
45

In 2006, Shell closed an agreement for a like‐kind exchange with Total E&P USA. Shell
exchanged its 17‐percent non‐operated interest in the deepwater Gulf of Mexico Tahiti field for
Total’s interests in natural gas assets in South Texas. Shell operates approximately 525
producing wells and approximately 600 miles of pipeline across three counties (Hidalgo, Starr,
and Brooks). Shell drilled its first South Texas wells in 1953. Today, it produces
approximately 210 million cubic feet of natural gas per day from more than 400 wells across
three counties – Zapata, Hidalgo and Starr.
In Wyoming’s Pinedale Anticline gas field, Shell is applying best practices for the operations.
That includes implementing innovative technologies and working collaboratively to build
effective relationships in Sublette County. Today on the Anticline, Shell has drilled more than
400 natural gas wells, operate on more than 21,000 acres and produce approximately 350
million cubic feet of natural gas per day.
Exxon Mobil
Company Profile
Exxon is the world's largest publicly traded international oil and gas company; a full detailed
analysis of Exxon can be found in Exhibit Twenty Four.
Exxon’s Project Locations
Exxon Mobil has two major locations in the United States, they are the Piceance Basin in
Colorado and the Gulf of Mexico.
The Piceance Basin in northwest Colorado contains trillions of cubic feet of natural gas, offering
an immense amount of energy in America’s backyard. Exxon Mobil and its predecessors have
been operating here since the 1950s, producing modest amounts of gas that were relatively
easy to extract. The majority of the gas, however, is in scattered pockets deep underground in
46
rocks as dense as cement. Although the industry has known about these “tight gas” deposits for
decades, they were generally left behind because they were too difficult and expensive to
recover. Exxon Mobil engineers are using proprietary, innovative technologies including Multi‐
Zone Stimulation Technology (MZST) and Just‐in‐Time Perforating (JITP) system to recover that
gas with great precision and less environmental impact.
The Gulf of Mexico is an active place for ExxonMobil engineers, drillers and production
personnel. Six miles from the company’s Hoover Diana development in the Gulf of Mexico, a
new well is expected to more than triple existing natural gas production. The gas pockets are in
a field called Rockefeller, one of several surrounding the Hoover Diana offshore platform, which
began production in 2000. Rockefeller was once considered too expensive to develop, but
technology advancements, along with a drilling plan that tied the new well into an existing
subsea network offered millions in cost savings and enabled the company to begin
development in 2007.
Drilling operations were completed in July 2009. The drilling crew of The Ocean Valiant
leveraged the company’s Fast Drill Process (FDP) to achieve a nearly 60 percent increase in feet‐
per‐day drilling rates compared to other Exxon Mobil‐operated deepwater wells in the Gulf of
Mexico. The project saved more than $10 million by drilling the well on the southeast corner of
the Madison field, where Exxon Mobil has existing production, and connecting the gathering
line from Rockefeller into the Madison subsea template so the gas can be directed to Hoover
Diana for processing and transmission to shore for domestic sales. Production start‐up for the
field began in September 2009.
BP
Company Profile
BP is the leading producer of oil and natural gas in the United States and the largest investor in
U.S. energy development. The BP family of brands includes Amoco, ARCO, and BP gasolines, as
47
well as am/pm retail outlets and Castrol motor oil. A full detailed analysis of BP can be found in
Exhibit Twenty Five.
Since 2004, BP has invested over $45 billion in the United States to increase existing energy
sources, extend energy supplies and develop new low‐carbon technologies. BP currently
employs approximately 23,000 people in the US, has over $47 billion in fixed assets, and sells
more than 15 billion gallons of gasoline every year.
Today, BP is the number one producer of oil and gas offshore in the deepwater Gulf of Mexico.
Equally important are the onshore gas operations, which have enabled the company to become
the one of the largest gas producers in the US.
BP Pipelines (North America) is the second‐largest liquids pipeline company in the U.S.,
transporting more than 1.6 million barrels per day of oil, refined products, natural gas liquids,
carbon dioxide and chemicals. That represents about 9 percent of the U.S. liquids pipeline
market.
Altogether, BP Pipelines North America operates about 9,000 miles of pipelines owned and
operated by BP or its subsidiaries, affiliates and joint ventures, and holds joint venture interests
in another approximately 7,500 miles of pipelines, which are operated by third parties.
BP’s Project Locations
BP has modern refineries in Texas City, TX, Carson, CA, Cherry Point, WA, Whiting, IN and
Toledo, OH. These five refineries have a total capacity for processing 1.5 million barrels of crude
oil a day.
BP’s refineries produce a wide range of fuels, petrochemicals and lubricants for America’s
highway and rail transportation; industry; home, commercial and institutional heating; power
generation, and airlines. (Air BP is a major supplier to airlines, with about 10 percent of the
Global market.)
48

BP Carson Refinery leads the nation in the production of low‐emission gasoline, setting the
standard for other refineries and for the state of California. Encompassing over 630 acres of
land, 1,200 employees work to help process some 265,000 barrels of oil per day into gasoline,
diesel, jet fuel, and petroleum coke. The refinery supplies about 25 percent of the Los Angeles
gasoline market.
BP’s Cherry Point, WA is situated on 2,400 acres and employing about 825 full‐time workers,
the facility processes more than 225,000 barrels of crude oil a day, primarily transportation
fuels. It provides about 20 percent of the gasoline market share in Washington and Oregon, the
majority of jet fuel for Seattle, Portland and Vancouver, B.C. international airports, and is the
largest west coast supplier of jet fuel to the U.S. military.
At BP’s Texas City, TX location more than 2,000 people are employed at the 1,200 acre facility.
BP Texas City can process 475,000 barrels of oil per day, more than 7 billion gallons of
petroleum products per year. (Of which three billion are gasoline.) It is the third largest refinery
in the United States and can process three percent of the nation’s gasoline supply. BP Texas
City has more than 20 process units and is considered one of the most versatile refineries in the
world.
BP Texas City’s flexibility also enables the refinery to produce a wide range of products
including gasoline, ultra low sulfur diesel, jet fuel, chemical feed stocks and heavy fuels.
BP‐Husky Refining LLC (i.e., the Toledo Refinery) occupies 585 acres just east of the City of
Toledo. Operating continuously since 1919, the facility has undergone numerous improvements
and expansions to achieve its current capacity for processing 160,000 barrels of crude oil daily.
Under the agreement, BP operates the refinery on behalf of the joint venture. Day‐to‐day
operations are driven by some 600 BP employees and another 500‐700 contract workers. They
work year‐round to convert crude oil into almost six million gallons of product each day.
49

Most of the refinery’s output is gasoline, including low‐sulfur fuels that produce lower vehicle
emissions. The refinery also produces diesel fuel, aviation fuel, propane, kerosene and asphalt.
The BP Whiting, IN Refinery is located on the southwestern shore of Lake Michigan and the
Indiana Harbor Ship Canal in the communities of Whiting, East Chicago and Hammond, Indiana.
Whiting Refinery is the second largest refinery in the BP refining system, and the 5th largest
refinery in the United States.
Today, BP is investing $3.8 billion (USD) in Northwest Indiana to modernize its Whiting Refinery
for the processing of heavier crudes. The modernization is essential to the long‐term viability of
the refinery, and includes $1.4 billion toward environmental improvements.
Chevron
Company Profile
Chevron is one of the world's largest integrated energy companies. Headquartered in San
Ramon, Calif., Chevron conducts business worldwide. They are engaged in every aspect of the
crude oil and natural gas industry, including exploration and production, manufacturing,
marketing and transportation, chemicals manufacturing and sales, geothermal energy, and
power generation. A full detailed analysis of Chevron can be found in Exhibit Twenty Six.
Chevron traces their earliest roots to an 1879 oil discovery at Pico Canyon, north of Los Angeles,
Calif., which led to the formation of the Pacific Coast Oil Co. That company later became
Standard Oil Co. of California and, subsequently, Chevron. They took on the name "Chevron”
when they acquired Gulf Oil Corp., in 1984, nearly doubling the worldwide proved oil and gas
reserves. The merger with Gulf was at that time the largest in U.S. history.
Another major branch of the family tree is The Texas Fuel Company, which was formed in
Beaumont, Texas, in 1901. It later became known as The Texas Company and eventually
50

Texaco. In 2001, the two companies merged. The acquisition of Unocal Corporation in 2005
strengthened Chevron's position as an energy industry leader, increasing their crude oil and
natural gas assets around the world.
Chevron is the second‐largest U.S.‐based integrated energy company, producing crude oil,
natural gas and many other products essential for progress.
Chevron‐branded products are sold in more than 7,500 retail locations in the United States,
primarily on the West Coast and in the South. Chevron also supplies more than 2,000 service
stations in southern and eastern states with Texaco‐branded fuel. Chevron's five U.S. refineries
have the capacity to process more than 941,000 barrels of oil per day.
Chevron’s Project Locations
The company's major producing operations in the United States are in California, the Gulf of
Mexico, Louisiana, Texas, New Mexico, the Rocky Mountains and Alaska.
As of the end of 2009, Chevron was the largest leaseholder in the Gulf of Mexico. Chevron is
one of the largest producers of crude oil and natural gas on the U.S. Gulf of Mexico shelf,
achieving an average daily net production during 2009 of 51,000 barrels of crude oil, 428 million
cubic feet of natural gas and 9,000 barrels of natural gas liquids.
Chevron is one of the leading leaseholders in the deepwater Gulf of Mexico, averaging net daily
production of 97,000 barrels of crude oil, 56 million cubic feet of natural gas and 6,000 barrels
of natural gas liquids during 2009. In 2009, Chevron reached peak production rates on two
significant new deepwater developments Blind Faith and Tahiti.
Chevron is the largest producer in net oil‐equivalent in California, at 211,000 barrels per day in
2009. Daily production in 2009 averaged 191,000 barrels of crude oil, 91 million cubic feet of
natural gas and 5,000 barrels of natural gas liquids. The majority of the production is from
51
Chevron‐operated leases that are part of three major crude oil fields in the San Joaquin Valley
Kern River, Midway Sunset and Cymric. In 2009, the total daily production from these leases
was 147,000 barrels per day (145,000 net) and 14 million cubic feet of natural gas (14 million
net).
Chevron operates producing fields in the midcontinental United States primarily in Colorado,
New Mexico, Oklahoma, Texas and Wyoming and in Alaska. The company also holds interests in
these and several other states. Chevron is one of the largest hydrocarbon producers in the
Permian Basin of West Texas.
In Alaska, Chevron operates 10 platforms and five natural gas producing fields in the Cook Inlet
Basin.
Occidental
Company Profile
Occidental Petroleum Corporation is an international oil and gas exploration and production
company, and its OxyChem subsidiary is a major North American chemical manufacturer. The
company is the fourth‐largest U.S. oil and gas company, based on market capitalization of $66
billion at year‐end 2009, with nearly 30,000 employees and contractors on four continents. A
full detailed analysis of Chevron can be found in Exhibit Twenty Seven.
OxyChem engages in oil and natural gas exploration and production in three core regions: the
United States, Middle East/North Africa and Latin America. The company is a worldwide leader
in applying advanced technology to boost production from mature oil and natural gas fields and
access hard‐to‐reach reserves. The company is consistently replaced and expanded reserves
through improved recovery, strategic acquisitions and focused exploration.
OxyChem's Midstream, Marketing and Other segment transports produced oil and natural gas
to market. Centurion Pipeline is an oil‐gathering, common carrier pipeline and storage system
52

with approximately 2,750 miles of pipelines extending from southeast New Mexico across the
Permian Basin of southwest Texas to Cushing, Oklahoma.
Occidental’s Project Locations
Occidental has operations at the following locations: Elk Hills, California; Hugoton, Kansas;
Permian Basin; Piceance Basin; THUMS; Tidelands, California; Vintage. California
OxyChem's majority interest in the giant Elk Hills field is a key factor in the company's position
as the largest natural gas producer and second‐largest oil producer in California. Located in the
southern portion of California's San Joaquin Valley, Elk Hills is one of the largest oil and natural
gas fields in the United States.
Elk Hills is Oxy’s largest California operation with 538 million barrels of oil equivalent (BOE) of
current proved reserves, 70 percent of Oxy’s total reserves in the state. Since acquiring Elk Hills,
a former U.S. National Strategic Petroleum Reserve, in 1998, Oxy has produced 400 million BOE
and achieved reserves replacement of approximately 125 percent. Oxy has customized a range
of recovery techniques to the field's complex reservoirs, transforming this once declining asset
into the largest natural gas producer in California
Oxy produces oil, natural gas and natural gas liquids in the Permian Basin of southwest Texas
and southeast New Mexico. The Permian Basin is one of the largest and most active oil basins in
the United States, with the entire basin accounting for approximately 19 percent of total U.S. oil
production. Oxy's position in the Permian Basin makes the company the largest oil producer in
Texas and New Mexico.
53

Supply Chain Inefficiencies
As previously discussed, the inefficiencies in the supply chains result in substantial wasted costs
by the end‐users. During the evaluation of the competitor coatings, it became apparent that
FBEs are brittle and subject to damage during transport and installation processes. Preliminary
research indicated that these firms then must remove those damaged sections from their
material stock piles and re‐coat the damaged sections to ensure adequate corrosion protection.
Initial studies indicate that the application of NAC‐10 will be able to handle the impacts and
abrasions that normally compromise FBE coatings that dominate the North American market.
By streamlining the supply chains and eliminating the re‐coating of damaged sections of stored
pipe NAC‐10 will be able to demand a premium within the marketplace.
However, through this analysis it was impossible to full calculate the costs of these supply chain
inefficiencies. This is an area that must be explored in‐depth during future assessments. If a
fully valuation of the financial impact of these supply chain inefficiencies can be calculated
WinTec will be strongly positioned to market this as a unique competitive advantage of NAC‐10.
Pipe Suppliers for End‐Users
There are five prominent end users that are begin focused on in this analysis. These and users
are as follows: Shell, Plc.; Exxon Mobil Corp.; BP, Plc.; Chevron Corp.; and Occidental Petroleum.
The following tables give a breakdown of the assumed manufacturers/suppliers for the end
users in terms of the pipeline supplies and storage. The tables provide the manufacturer or
supplier name and the sector path that the company focuses on.
Shell, Plc.
Name Hierarchy Focused Sector Path Enterprise GP Holdings L.P. Energy > Midstream > Natural Gas Pipeline and Storage > United States Enterprise Products Partners L.P. Energy > Midstream > Natural Gas Pipeline and Storage > United States Duncan Energy Partners L.P. Energy > Midstream > Natural Gas Pipeline and Storage > United States
54
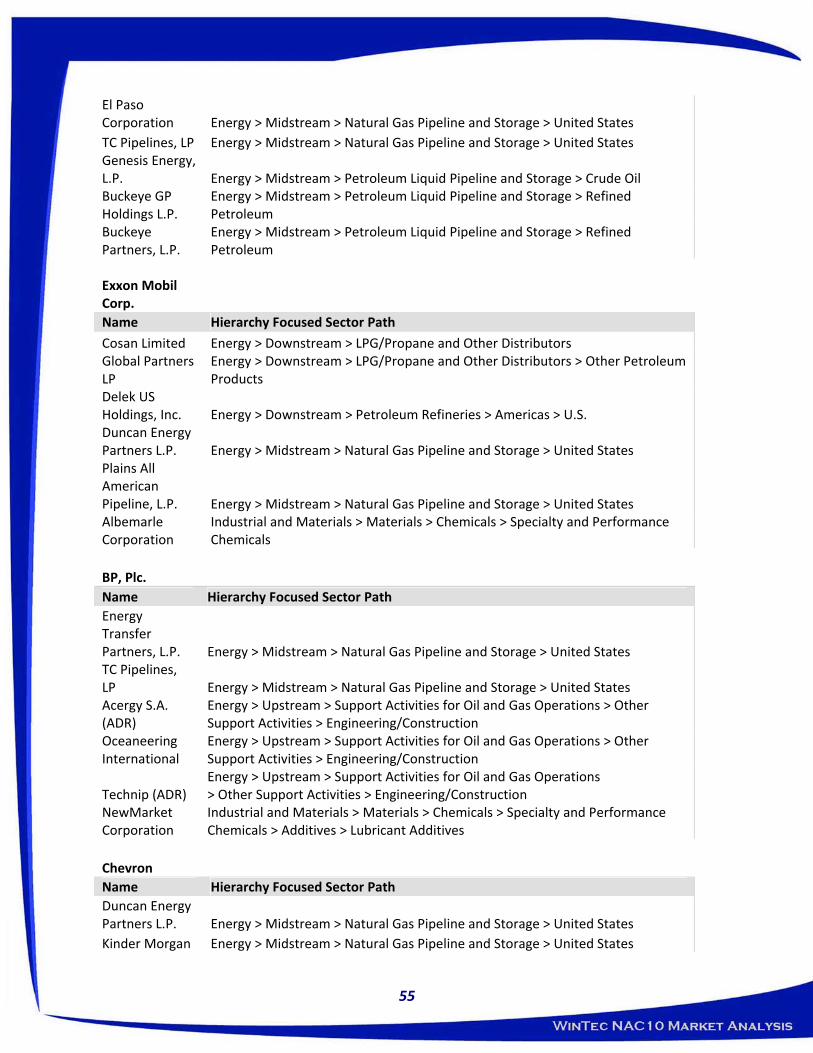
El Paso Corporation Energy > Midstream > Natural Gas Pipeline and Storage > United States TC Pipelines, LP Energy > Midstream > Natural Gas Pipeline and Storage > United States Genesis Energy, L.P. Energy > Midstream > Petroleum Liquid Pipeline and Storage > Crude Oil Buckeye GP Holdings L.P.
Energy > Midstream > Petroleum Liquid Pipeline and Storage > Refined Petroleum
Buckeye Partners, L.P.
Energy > Midstream > Petroleum Liquid Pipeline and Storage > Refined Petroleum
Exxon Mobil Corp. Name Hierarchy Focused Sector Path
Cosan Limited Energy > Downstream > LPG/Propane and Other Distributors Global Partners LP
Energy > Downstream > LPG/Propane and Other Distributors > Other Petroleum Products
Delek US Holdings, Inc. Energy > Downstream > Petroleum Refineries > Americas > U.S. Duncan Energy Partners L.P. Energy > Midstream > Natural Gas Pipeline and Storage > United States Plains All American Pipeline, L.P. Energy > Midstream > Natural Gas Pipeline and Storage > United States Albemarle Corporation
Industrial and Materials > Materials > Chemicals > Specialty and Performance Chemicals
BP, Plc. Name Hierarchy Focused Sector Path Energy Transfer Partners, L.P. Energy > Midstream > Natural Gas Pipeline and Storage > United States TC Pipelines, LP Energy > Midstream > Natural Gas Pipeline and Storage > United States Acergy S.A. (ADR)
Energy > Upstream > Support Activities for Oil and Gas Operations > Other Support Activities > Engineering/Construction
Oceaneering International
Energy > Upstream > Support Activities for Oil and Gas Operations > Other Support Activities > Engineering/Construction
Technip (ADR) Energy > Upstream > Support Activities for Oil and Gas Operations > Other Support Activities > Engineering/Construction
NewMarket Corporation
Industrial and Materials > Materials > Chemicals > Specialty and Performance Chemicals > Additives > Lubricant Additives
Chevron Name Hierarchy Focused Sector Path Duncan Energy Partners L.P. Energy > Midstream > Natural Gas Pipeline and Storage > United States Kinder Morgan Energy > Midstream > Natural Gas Pipeline and Storage > United States
55
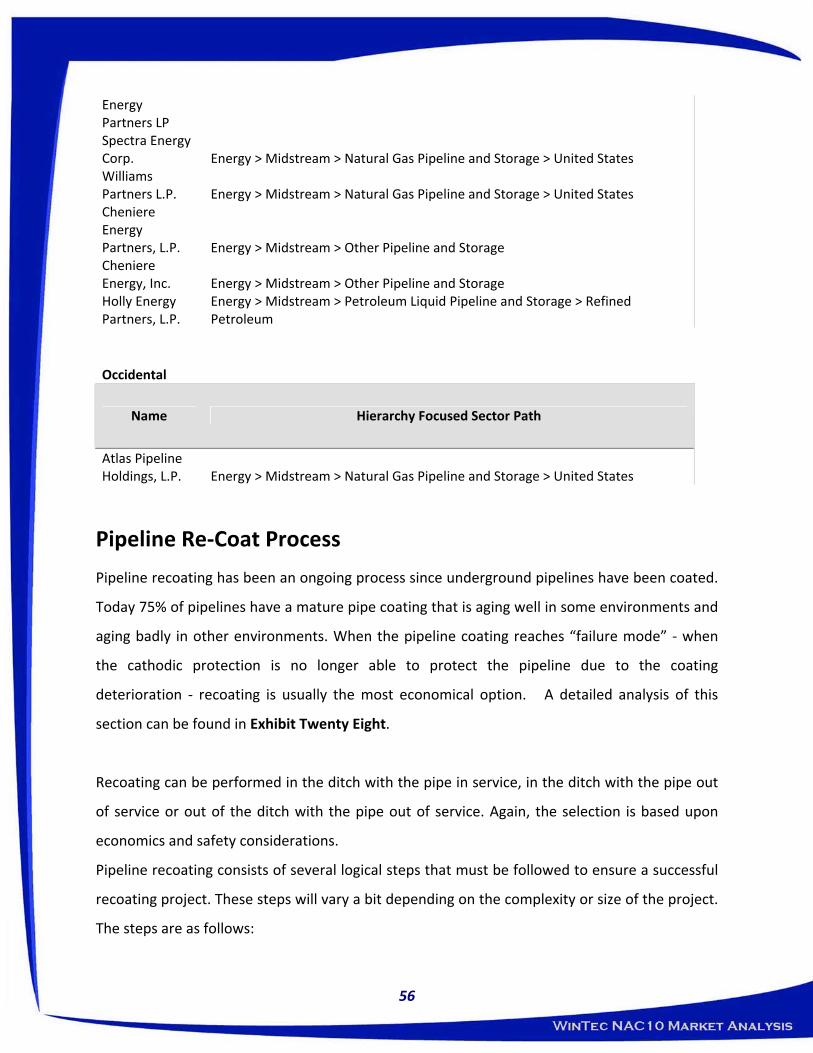
Energy Partners LP Spectra Energy Corp. Energy > Midstream > Natural Gas Pipeline and Storage > United States Williams Partners L.P. Energy > Midstream > Natural Gas Pipeline and Storage > United States Cheniere Energy Partners, L.P. Energy > Midstream > Other Pipeline and Storage Cheniere Energy, Inc. Energy > Midstream > Other Pipeline and Storage Holly Energy Partners, L.P.
Energy > Midstream > Petroleum Liquid Pipeline and Storage > Refined Petroleum
Occidental
Name Hierarchy Focused Sector Path
Atlas Pipeline Holdings, L.P. Energy > Midstream > Natural Gas Pipeline and Storage > United States
Pipeline Re‐Coat Process
Pipeline recoating has been an ongoing process since underground pipelines have been coated.
Today 75% of pipelines have a mature pipe coating that is aging well in some environments and
aging badly in other environments. When the pipeline coating reaches “failure mode” ‐ when
the cathodic protection is no longer able to protect the pipeline due to the coating
deterioration ‐ recoating is usually the most economical option. A detailed analysis of this
section can be found in Exhibit Twenty Eight.
Recoating can be performed in the ditch with the pipe in service, in the ditch with the pipe out
of service or out of the ditch with the pipe out of service. Again, the selection is based upon
economics and safety considerations.
Pipeline recoating consists of several logical steps that must be followed to ensure a successful
recoating project. These steps will vary a bit depending on the complexity or size of the project.
The steps are as follows:
56

• Determine the extent of the area to be recoated and the effect on the surrounding work
area.
• Determine what environmental issues exist or may exist at the recoating site(s).
• Determine the expected conditions to be encountered after the pipe is exposed and
excavated.
• Determine if additional measures such as select fill, tenting, etc. will be required.
• Determine to the best of one’s ability the expected added or hidden costs or delays
based on previous projects.
Recoating becomes necessary when the coating on the existing pipeline nears the end of its life
or has already failed. Coating failure happens after some many years of service and may be
accelerated by soil stress, higher than designed operating temperatures and initial coating
selection. Prior to recoating the pipeline operator has several options;
• Increase the output of the existing cathodic protection
• Additional conventional cathodic protection
• Distributed anode or linear anode cathodic protection
These solutions are only a temporary solution to recoating, however they may give the owner 1
to 20 more years before recoating is necessary and there is total coating failure. CP & coating
synergies – as well coated underground pipeline requires very little cathodic protection current.
As the coating ages this current demand or requirement increases and additional current is
applied to the pipeline. Eventually the amount of current required becomes excessive (as the
coating goes into failure mode) and recoating becomes the next step.
57

Regulatory Agency Oversight
Regulatory Agency Overview
In an attempt to fully understand the regulatory environment at play within this industry
segment, this analysis intended to develop a hierarchical map of government and regulatory
oversight. However, that data proved to be exceptionally difficult to gather and accurately map
out. This analysis attempted to gather technical requirements and oversight processes from
NACE, ASTM, EPA, TCEQ, DEQ, US Coast Guard, US Navy and the US Department of
Transportation Pipeline and Hazardous Material Safety Administration (PHMSA). While most
agencies were unable to provide and readily defined standards, PHMSA was able to direct the
analysis to the Code of Federal Regulations and the applicable sections governing corrosion
protection for pipelines and hazardous material storage tanks. CFR Title 49 §192.4 establishes
the minimum requirements for protection of metallic pipelines from external, internal and
atmospheric corrosion.
Corrosion Protection Requirements
According to Federal Regulations, buried or submerged pipelines of bare or ineffectively coated
transmission lines, bare or coated pipes at compressor, regulator, and measuring stations and
bare or coated distribution lines, installed before August 1, 1971, must be cathodically
protected in accordance with this subpart in which active corrosion is found. If a buried pipeline
has any parts that become exposed, then the exposed portion must be examined for evidence
of external corrosion if the pipe is bare, or if the coating is deteriorated. The only exception
pertains to cast iron or ductile iron pipelines.
Protective coating whether conductive or insulating, applied for the purpose of external
corrosion control must, be applied on a properly prepared surface. As well as have sufficient
adhesion to the metal surface to effectively resist under film migration of moisture and be
sufficiently ductile to resist cracking. It must also have sufficient strength to resist damage due
58

to handling and soil stress; and have properties compatible with any supplemental cathodic
protection.
Each external protective coating which is an electrically insulating type must also have low
moisture absorption and high electrical resistance. Also each external protective coating must
be inspected just prior to lowering the pipe into the ditch and backfilling, and any damage
detrimental to effective corrosion control must be repaired. Each external protective coating
must be protected from damage resulting from adverse ditch conditions or damage from
supporting blocks. If the coated pipe is installed by boring, driving, or other similar method,
precautions must be taken to minimize damage to the coating during installation.
The cathodic protection system must provide a level of cathodic protection at least equal to
that provided by compliance with one or more of the following criterias. If amphoteric metals
are included in a buried or submerged pipeline containing a metal of different anodic
potential—
(1) The amphoteric metals must be electrically isolated from the remainder of the pipeline and
cathodically protected; or
(2) The entire buried or submerged pipeline must be cathodically protected at a cathodic
potential that meets the requirements of appendix D of this part for amphoteric metals.
The amount of cathodic protection must be controlled so as not to damage the protective
coating or the pipe.
Each pipeline that is under cathodic protection must be tested at least once each calendar year,
but with intervals not exceeding 15 months, to determine whether the cathodic protection
meets the requirements of §192.463. Each cathodic protection rectifier or other impressed
current power source must be inspected six times each calendar year, but with intervals not
exceeding 21/2months, to insure that it is operating.
59
Each reverse current switch, each diode, and each interference bond whose failure would
jeopardize structure protection must be electrically checked for proper performance six times
each calendar year, but with intervals not exceeding 21/2months. Each other interference bond
must be checked at least once each calendar year, but with intervals not exceeding 15 months.
Each operator shall take prompt remedial action to correct any deficiencies indicated by the
monitoring. After the initial evaluation required by §§192.455(b) and (c) and 192.457(b), each
operator must, not less than every 3 years at intervals not exceeding 39 months, reevaluate its
unprotected pipelines and cathodically protect them in accordance with this subpart in areas in
which active corrosion is found. The operator must determine the areas of active corrosion by
electrical survey. However, on distribution lines and where an electrical survey is impractical on
transmission lines, areas of active corrosion may be determined by other means that include
review and analysis of leak repair and inspection records, corrosion monitoring records,
exposed pipe inspection records, and the pipeline environment.
Each pipeline under cathodic protection required by this subpart must have sufficient test
stations or other contact points for electrical measurement to determine the adequacy of
cathodic protection.
Each new transmission line and each replacement of line pipe, valve, fitting, or other line
component in a transmission line must have features incorporated into its design and
construction to reduce the risk of internal corrosion. At a minimum, unless it is impracticable or
unnecessary to do so, each new transmission line or replacement of line pipe, valve, fitting, or
other line component in a transmission line must be configured to reduce the risk that liquids
will collect in the line; have effective liquid removal features whenever the configuration would
allow liquids to collect; and allow use of devices for monitoring internal corrosion at locations
with significant potential for internal corrosion.
When an operator changes the configuration of a transmission line, the operator must evaluate
the impact of the change on internal corrosion risk to the downstream portion of an existing
60

onshore transmission line and provide for removal of liquids and monitoring of internal
corrosion as appropriate. An operator must maintain records demonstrating compliance.
Coating material must be suitable for the prevention of atmospheric corrosion. Each operator
must clean and coat each pipeline or portion of pipeline that is exposed to the atmosphere,
except pipelines in offshore splash zones or soil‐to‐air interfaces. The operator need not protect
from atmospheric corrosion any pipeline for which the operator demonstrates by test,
investigation, or experience appropriate to the environment of the pipeline that corrosion will
only be a light surface oxide or not affect the safe operation of the pipeline before the next
scheduled inspection.
(a) Each segment of metallic pipe that replaces pipe removed from a buried or submerged
pipeline because of external corrosion must have a properly prepared surface and must be
provided with an external protective coating that meets the requirements of §192.461.
(b) Each segment of metallic pipe that replaces pipe removed from a buried or submerged
pipeline because of external corrosion must be cathodically protected in accordance with this
subpart.
(c) Except for cast iron or ductile iron pipe, each segment of buried or submerged pipe that is
required to be repaired because of external corrosion must be cathodically protected in
accordance with this subpart.
General corrosion. Each segment of transmission line with general corrosion and with a
remaining wall thickness less than that required for the MAOP of the pipeline must be replaced
or the operating pressure reduced commensurate with the strength of the pipe based on actual
remaining wall thickness. However, corroded pipe may be repaired by a method that reliable
engineering tests and analyses show can permanently restore the serviceability of the pipe.
Corrosion pitting so closely grouped as to affect the overall strength of the pipe is considered
general corrosion for the purpose of this paragraph.
61

Localized corrosion pitting. Each segment of transmission line pipe with localized corrosion
pitting to a degree where leakage might result must be replaced or repaired, or the operating
pressure must be reduced commensurate with the strength of the pipe, based on the actual
remaining wall thickness in the pits.
The strength of pipe based on actual remaining wall thickness may be determined by the
procedure in ASME/ANSI B31G or the procedure in AGA Pipeline Research Committee Project
PR 3–805 (with RSTRENG disk). Both procedures apply to corroded regions that do not
penetrate the pipe wall, subject to the limitations prescribed in the procedures.
Remedial measures: Distribution lines other than cast iron or ductile iron lines.
General corrosion. Except for cast iron or ductile iron pipe, each segment of generally corroded
distribution line pipe with a remaining wall thickness less than that required for the MAOP of
the pipeline, or a remaining wall thickness less than 30 percent of the nominal wall thickness,
must be replaced. However, corroded pipe may be repaired by a method that reliable
engineering tests and analyses show can permanently restore the serviceability of the pipe.
Corrosion pitting so closely grouped as to affect the overall strength of the pipe is considered
general corrosion for the purpose of this paragraph.
Localized corrosion pitting. Except for cast iron or ductile iron pipe, each segment of
distribution line pipe with localized corrosion pitting to a degree where leakage might result
must be replaced or repaired.
Remedial measures: Cast iron and ductile iron pipelines.
Each segment of cast iron or ductile iron pipe on which general graphitization is found to a
degree where a fracture or any leakage might result a leak, must be replaced, or repaired, or
sealed by internal sealing methods adequate to prevent or arrest any leakage.
62

Threat Standard1
External corrosion §192.9252
Internal corrosion in pipelines that transport dry gas §192.927
Stress corrosion cracking §192.929
1For lines not subject to subpart O of this part, the terms “covered segment” and “covered
pipeline segment” in §§192.925, 192.927, and 192.929 refer to the pipeline segment on which
direct assessment is performed.
Conclusions
This document provides a high‐level overview of the petrochemical/oil anti‐corrosive coating
segment that WinTec wanted to examine. This is not intended to be a stand alone finished
document, rather, this document should act as a foundation upon which further analysis can be
performed heading into the future.
The Findings and Recommendations section of this document outline the key points that were
found during this assessment and outline recommend actions heading forward. Additionally,
the supporting exhibits attached to this document provide an excellent research base from
which future analysis can be performed.
63

Supporting
Exhibits
64
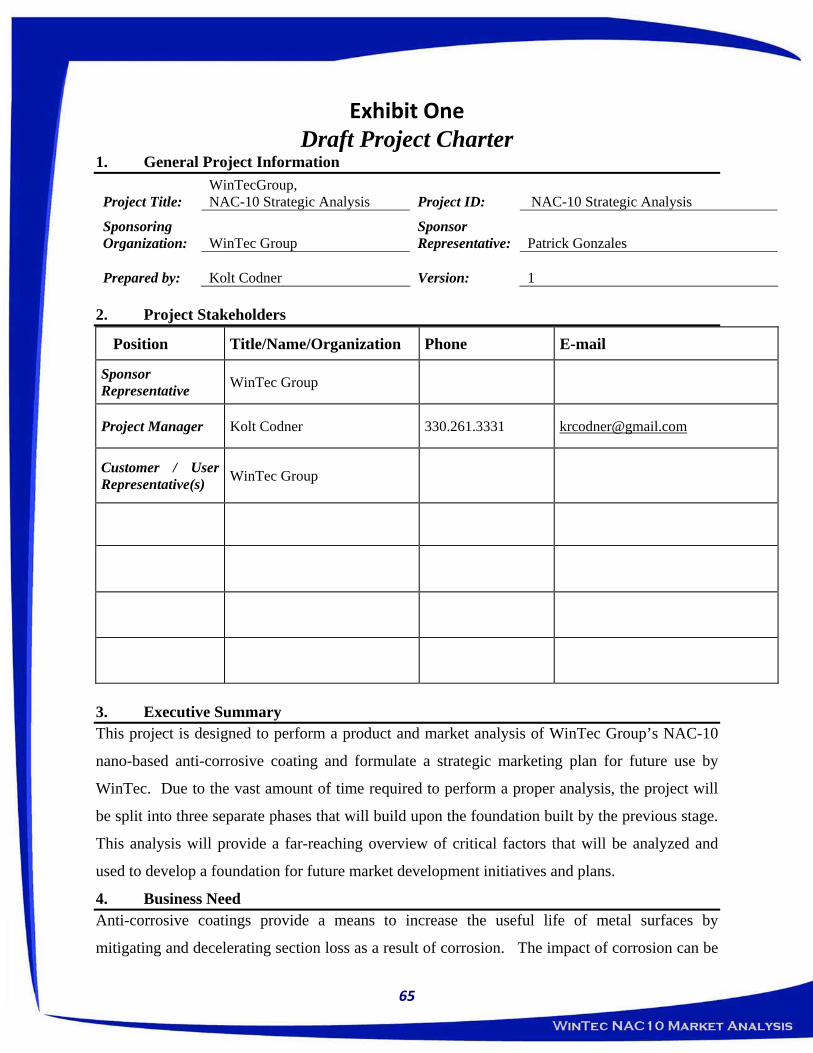
Exhibit One Draft Project Charter
1. General Project Information
Project Title: WinTecGroup, NAC-10 Strategic Analysis Project ID: NAC-10 Strategic Analysis
Sponsoring Organization: WinTec Group
Sponsor Representative: Patrick Gonzales
Prepared by: Kolt Codner Version: 1 2. Project Stakeholders
Position Title/Name/Organization Phone E-mail
Sponsor Representative WinTec Group
Project Manager Kolt Codner 330.261.3331 [email protected]
Customer / User Representative(s) WinTec Group
3. Executive Summary This project is designed to perform a product and market analysis of WinTec Group’s NAC-10
nano-based anti-corrosive coating and formulate a strategic marketing plan for future use by
WinTec. Due to the vast amount of time required to perform a proper analysis, the project will
be split into three separate phases that will build upon the foundation built by the previous stage.
This analysis will provide a far-reaching overview of critical factors that will be analyzed and
used to develop a foundation for future market development initiatives and plans.
4. Business Need Anti-corrosive coatings provide a means to increase the useful life of metal surfaces by
mitigating and decelerating section loss as a result of corrosion. The impact of corrosion can be
65

realized in a wide array of industry segments; however, the need is most dramatic within the
infrastructure and utility segments. Within the infrastructure segment, the need for corrosion
protection can be found in a number of areas; including, structural steel bridge super-structures,
concrete rebar reinforcing, hazardous materials storage and water and wastewater treatment plant
facility equipment and conduit. Additionally, the needs for corrosion protection within the utility
segment can be found in oil and natural gas pipelines, utility distribution lines and utility poles.
5. Business Case According to data compiled by CorrosionCost.com, a website sponsored by the Federal Highway
Administration, the annual cost of corrosion in the United States is $270 billion. Furthermore,
with over 500,000 bridges, 328,000 miles of natural gas transmission and gathering lines and 8.5
million hazardous materials storage tanks within the United States there are a plethora of
domestic opportunities for anti-corrosive coatings. Additionally, with the recent substantial
investment in public infrastructure through the American Recovery and Reinvestment Act
(ARRA), an increasing number of facilities are being rehabilitated and offer prime opportunities
for innovative anti-corrosive coatings. Within the natural gas distribution segment, gas
distributors are continuing with a systematic replacement of bare metal and cast iron distribution
lines that were susceptible to corrosion. Additionally, in the light of the recent natural gas
transmission line explosion in San Bruno, California; there is increasing public pressure on
utilities to utilize fail-safe anti-corrosive coatings for their lines. Through technical analysis
provided by WinTec, the NAC-10 coating will provide an impenetrable and self-healing
Polymeric coating that appears to provide corrosion protection for (use 5x; studies indicate 10-15
fold) years. The NAC-10 coating could provide a significant long-term cost savings by
increasing the useful life of a wide assortment of metal substrates and realizing labor savings by
significantly reducing operation and maintenance costs over the life of the coated materials.
6. Project Scope In order to fully assess the true market potential for the NAC-10 coating there are a number of
critical areas which must be addressed. Considering the substantial time requirements to perform
a detailed analysis of NAC-10 and develop a strategic market engagement plan; the greater
project will be split into multiple sequential phases to ensure the accuracy and integrity of the
plan development. Project phase one will focus specifically on determining the attractiveness of
the marketplace within which the NAC-10 coasting competes. Additionally, phase one will also
incorporate an analysis of existing oil pipeline supply currently utilized by potential NAC-10
66
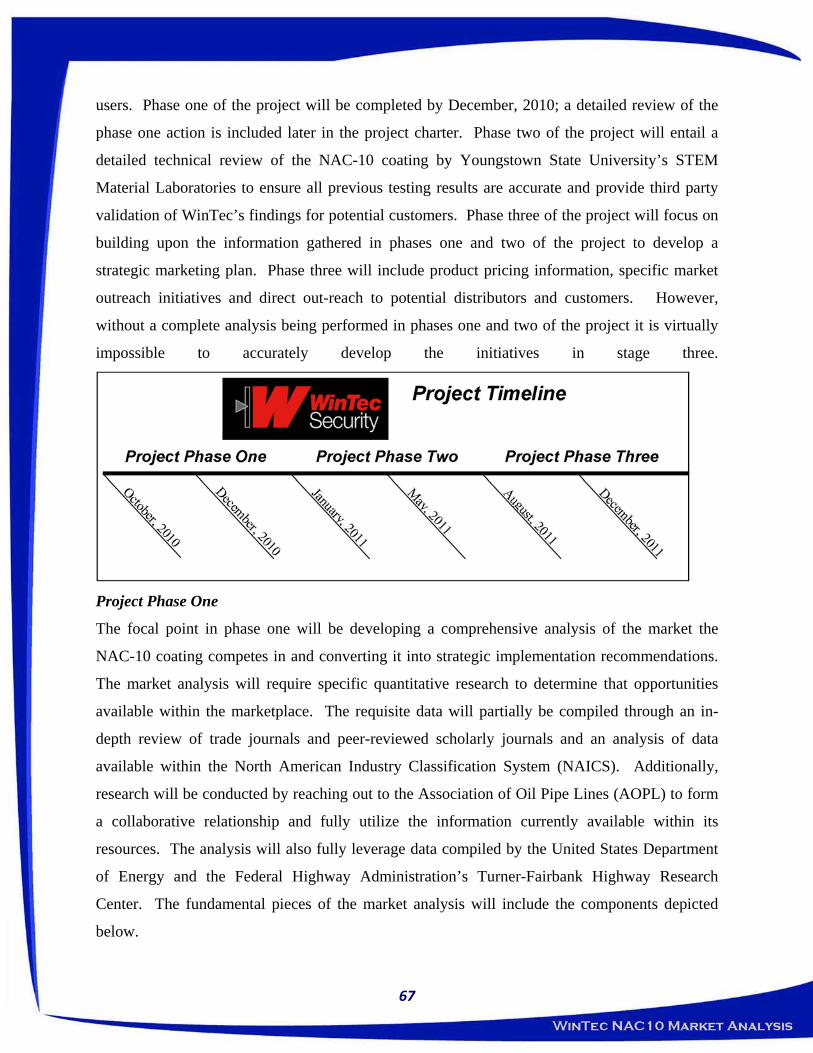
users. Phase one of the project will be completed by December, 2010; a detailed review of the
phase one action is included later in the project charter. Phase two of the project will entail a
detailed technical review of the NAC-10 coating by Youngstown State University’s STEM
Material Laboratories to ensure all previous testing results are accurate and provide third party
validation of WinTec’s findings for potential customers. Phase three of the project will focus on
building upon the information gathered in phases one and two of the project to develop a
strategic marketing plan. Phase three will include product pricing information, specific market
outreach initiatives and direct out-reach to potential distributors and customers. However,
without a complete analysis being performed in phases one and two of the project it is virtually
impossible to accurately develop the initiatives in stage three.
Project Phase One
The focal point in phase one will be developing a comprehensive analysis of the market the
NAC-10 coating competes in and converting it into strategic implementation recommendations.
The market analysis will require specific quantitative research to determine that opportunities
available within the marketplace. The requisite data will partially be compiled through an in-
depth review of trade journals and peer-reviewed scholarly journals and an analysis of data
available within the North American Industry Classification System (NAICS). Additionally,
research will be conducted by reaching out to the Association of Oil Pipe Lines (AOPL) to form
a collaborative relationship and fully utilize the information currently available within its
resources. The analysis will also fully leverage data compiled by the United States Department
of Energy and the Federal Highway Administration’s Turner-Fairbank Highway Research
Center. The fundamental pieces of the market analysis will include the components depicted
below.
67

• Simple Technical Analysis of NAC-10
• Market Analysis
• Competitive Analysis
• NAC-10 SWOT Analysis
• Porter’s Five Forces Analysis of NAC-10
Additionally, phase one will include a review and analysis of supply chains currently utilized by
potential customers within the oil pipeline industry. This will allow the latter phases in the
project to have a holistic view of the potential cost savings realized by NAC-10. For instance,
preliminary research indicates that potential customers currently utilize a laborious and costly
supply chain that results in wasted effort that could be averted by the employing the NAC-10
coating in the early stages of production. Thus, the potential cost savings of NAC-10 reach
beyond the simple added life and also impact potential cost savings through leaning out and
streamlining the supply chain.
Project – Phase One Schedule
Phase one of the project will commence with a project kick-off meeting on October 1, 2010.
From that point out the consultant will continue to compile information and submit draft one of
the document to WinTec management on October 22, 2010 for comment and review. From that
point out WinTec will submit comments to the consultant by October 29, 2010 and the
consultant will incorporate the comments and additional information into the draft document.
From that point out the schedule below will be utilized for draft document submissions and
requisite revisions until the final document is presented to WinTec management on December 3,
2010.
68

7. Critical Success Factors The critical success factors of this project will be acquiring adequate technical analysis and
comparison of the NAC-10 coating with competitors within the relatively short project time
frame. Additionally, for the successful development of a strategic implementation plan, it will
be essential for NAC-10 coating to be found a significant improvement over rival coatings
currently within the marketplace. If the analysis can successfully demonstrate the superiority of
the NAC-10 coating, a market positioning plan and strategic market development plan can be
formulated.
8. Project Assumptions / Constraints Obviously with a relatively short project schedule and limited financial resources and in-depth
analysis cannot be performed. Rather, this project will look to develop a foundation of analysis
upon which future initiatives can be developed and implemented. The project will also assume
that the preponderance of technical analysis will derived from testing already performed by
WinTec.
9. Project Deliverables At the conclusion of the phase one of the project the consultant will present to WinTec, a
comprehensive report of initial findings. This will be accomplished through the presentation the
written market analysis and supply chain analysis coupled with all of the supporting documents
and sources necessary to develop the analysis. Throughout the development of phase one, three
versions of the draft document will be submitted to WinTec for comment and revisions.
Additionally, the findings will be presented to WinTec in a final presentation in December, 2010.
69
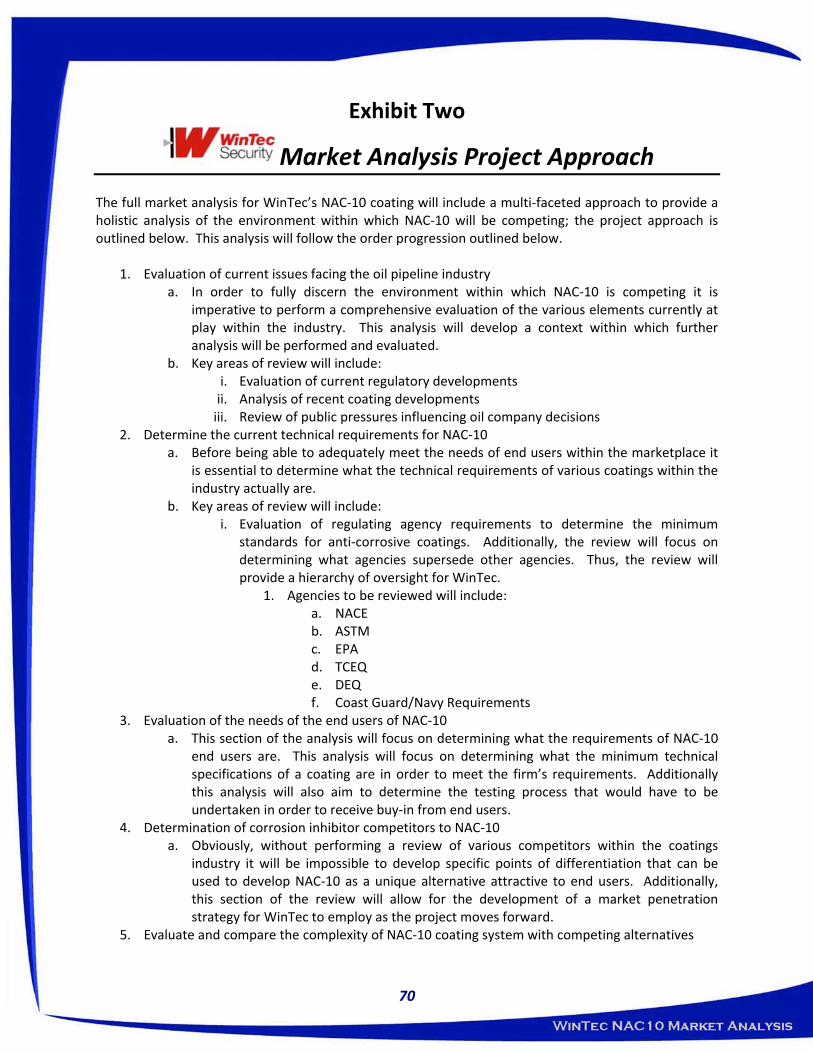
Exhibit Two
Market Analysis Project Approach The full market analysis for WinTec’s NAC‐10 coating will include a multi‐faceted approach to provide a holistic analysis of the environment within which NAC‐10 will be competing; the project approach is outlined below. This analysis will follow the order progression outlined below.
1. Evaluation of current issues facing the oil pipeline industry a. In order to fully discern the environment within which NAC‐10 is competing it is
imperative to perform a comprehensive evaluation of the various elements currently at play within the industry. This analysis will develop a context within which further analysis will be performed and evaluated.
b. Key areas of review will include: i. Evaluation of current regulatory developments ii. Analysis of recent coating developments iii. Review of public pressures influencing oil company decisions
2. Determine the current technical requirements for NAC‐10 a. Before being able to adequately meet the needs of end users within the marketplace it
is essential to determine what the technical requirements of various coatings within the industry actually are.
b. Key areas of review will include: i. Evaluation of regulating agency requirements to determine the minimum
standards for anti‐corrosive coatings. Additionally, the review will focus on determining what agencies supersede other agencies. Thus, the review will provide a hierarchy of oversight for WinTec.
1. Agencies to be reviewed will include: a. NACE b. ASTM c. EPA d. TCEQ e. DEQ f. Coast Guard/Navy Requirements
3. Evaluation of the needs of the end users of NAC‐10 a. This section of the analysis will focus on determining what the requirements of NAC‐10
end users are. This analysis will focus on determining what the minimum technical specifications of a coating are in order to meet the firm’s requirements. Additionally this analysis will also aim to determine the testing process that would have to be undertaken in order to receive buy‐in from end users.
4. Determination of corrosion inhibitor competitors to NAC‐10 a. Obviously, without performing a review of various competitors within the coatings
industry it will be impossible to develop specific points of differentiation that can be used to develop NAC‐10 as a unique alternative attractive to end users. Additionally, this section of the review will allow for the development of a market penetration strategy for WinTec to employ as the project moves forward.
5. Evaluate and compare the complexity of NAC‐10 coating system with competing alternatives
70

a. One point that will be under close consideration by manufacturers who would eventually apply the NAC‐10 coating will be the complexity of the coating process. The analysis will aim to determine the current application processes and determine how they differentiate from the NAC‐10 application. This step in the analysis expose the unique differences between NAC‐10 and current coating application processes. It is imperative to understand the differences between the types of coating application processes because a significant differentiation from the status quo may generate substantial hesitation on the application process
b. Additionally, the analysis will also have to determine what the pre‐qualification process for application contractors of NAC‐10 will be. Operating within such a high‐risk industry it is critical to ensure that applicators follow the proper processes in the application of NAC‐10. Even the best coatings can be undone if they are applied improperly and this consequences of such misapplication are so extreme development of an applicator pre‐qualification is essential.
i. Key areas of review will include 1. Evaluation of other coating applicators 2. Determination of the differences in the application process 3. Evaluation of the tolerances in the application process
6. Evaluation of worst case scenarios in the event of a coating or system failure a. The most important components of any coating is its ability to reduce the likelihood of a
catastrophic failure of the surface it is protecting. Obviously, within the oil and gas pipeline industry there are significant ramifications if a pipeline failure were to occur. In order to fully develop the value of a coating, it is critical to determine what the consequences are of a catastrophic failure as a result of corrosion.
b. Key areas of review will include i. Evaluation and calculation of environmental clean up costs
1. Including any fines that would be associated with the failure ii. Evaluation of the potential damage to public opinion of the company in the
event of a failure 1. This cost will look into the full cost of the impact; including, loss of good
will and lost revenues 7. Examine the supply chains of end users to quantify and potential savings from NAC‐10
a. As previously discussed, it is believed that NAC‐10 could provide significant savings through streamlining the supply chains of end users and simplifying the coating processes.
b. Key areas of review will include: i. Analysis of current supply chains within the oil pipeline industry ii. Evaluation of potential cost savings realized by streamlining the coating supply
chain process 8. Determine and calculate the benefits NAC‐10 provides to the client
a. This section will build on the information compiled in the previous seven phases of the market analysis to determine both financial and intangible benefits provided by NAC‐10. This step will look to provide a holistic review of potential savings NAC‐10 provides over various competing coatings.
71

Exhibit Three
Project Management Plan
72

IDTa
sk
Mo
de
Task
Nam
eD
ura
tio
n
0W
inTe
c M
arke
t A
nal
ysis
28
day
s1
Pro
gres
s M
eeti
ng
Wit
h E
mer
y1
day
2K
icko
ff M
eeti
ng
wit
h P
roje
ct T
eam
1 d
ay3
Re
gula
tory
Age
ncy
Rev
iew
- P
has
e I
13
day
s4
Acc
um
ula
te R
ese
arch
7 d
ays
5P
rovi
de
Pre
-Lim
Dat
a to
KC
fo
r R
evi
ew1
day
6In
corp
ora
te K
C C
om
men
ts In
Fin
al D
raft
Reg
ula
tory
Sec
tio
n5
day
s
7P
rovi
de
Fin
al D
raft
of
Re
gula
tory
Se
ctio
n0
day
s
8C
om
pet
itiv
e A
nal
ysis
28
day
s9
Co
mp
etit
or
Firm
An
alys
is -
Ph
ase
I1
3 d
ays
10
Res
ear
ch R
ele
van
t C
om
pet
ito
rs
wit
hin
Ind
ust
ry7
day
s
11
Pro
vid
e P
re-L
im D
ata
to K
C f
or
Rev
iew
1 d
ay
12
Inco
rpo
rate
KC
Co
mm
ents
In F
inal
D
raft
Co
mp
etit
ive
An
alys
is5
day
s
13
Pro
vid
e Fi
nal
Dra
ft o
f C
om
pet
itiv
e A
nal
ysis
0 d
ays
14
Co
mp
etit
or
Co
atin
g A
nal
ysis
- P
has
e II
10
day
s1
5R
ese
arch
Co
mp
etit
or
Co
atin
gs4
day
s1
6P
rovi
de
Pre
-Lim
Dat
a to
KC
fo
r R
evie
w1
day
17
Inco
rpo
rate
KC
Co
mm
ents
In F
inal
D
raft
Co
mp
etit
or
Co
atin
g A
nal
ysis
5 d
ays
18
Pro
vid
e Fi
nal
Dra
ft o
f C
om
pet
ito
r C
oat
ing
An
alys
is0
day
s
19
End
Use
r A
nal
ysis
- P
has
e I
28
day
s
11
/5
11
/12
11
/5
11
/12
11
/19
11
/26
17
20
23
26
29
14
71
01
31
61
92
22
52
81
4O
cto
ber
20
10
No
vem
ber
20
10
Dec
emb
er 2
01
0
Task
Split
Mile
sto
ne
Sum
mar
y
Pro
ject
Su
mm
ary
Exte
rnal
Tas
ks
Exte
rnal
Mile
sto
ne
Inac
tive
Tas
k
Inac
tive
Mile
sto
ne
Inac
tive
Su
mm
ary
Man
ual
Tas
k
Du
rati
on
-on
ly
Man
ual
Su
mm
ary
Ro
llup
Man
ual
Su
mm
ary
Star
t-o
nly
Fin
ish
-on
ly
Dea
dlin
e
Pro
gres
s
Pag
e 1
Pro
ject
: Win
Tec
Mar
ket
An
alys
isD
ate:
Tu
e 1
1/3
0/1
0
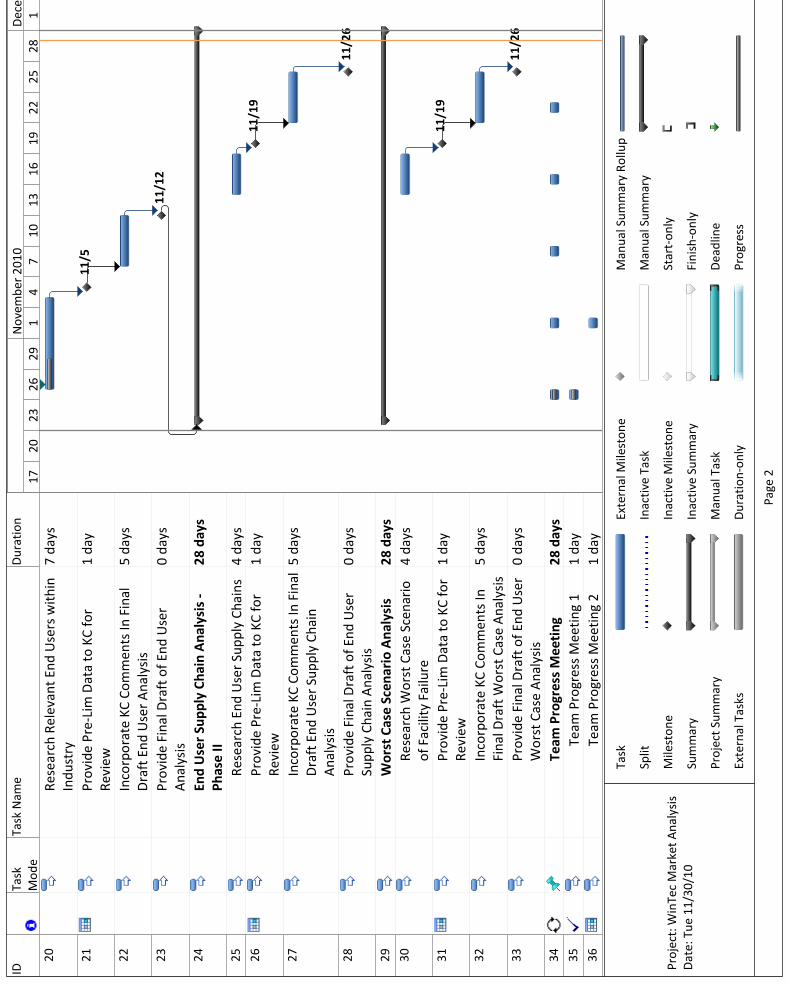
IDTa
sk
Mo
de
Task
Nam
eD
ura
tio
n
20
Res
ear
ch R
ele
van
t En
d U
sers
wit
hin
In
du
stry
7 d
ays
21
Pro
vid
e P
re-L
im D
ata
to K
C f
or
Rev
iew
1 d
ay
22
Inco
rpo
rate
KC
Co
mm
ents
In F
inal
D
raft
En
d U
ser
An
alys
is5
day
s
23
Pro
vid
e Fi
nal
Dra
ft o
f En
d U
ser
An
alys
is0
day
s
24
End
Use
r Su
pp
ly C
hai
n A
nal
ysis
-
Ph
ase
II2
8 d
ays
25
Res
ear
ch E
nd
Use
r Su
pp
ly C
hai
ns
4 d
ays
26
Pro
vid
e P
re-L
im D
ata
to K
C f
or
Rev
iew
1 d
ay
27
Inco
rpo
rate
KC
Co
mm
ents
In F
inal
D
raft
En
d U
ser
Sup
ply
Ch
ain
A
nal
ysis
5 d
ays
28
Pro
vid
e Fi
nal
Dra
ft o
f En
d U
ser
Sup
ply
Ch
ain
An
alys
is0
day
s
29
Wo
rst
Cas
e Sc
enar
io A
nal
ysis
28
day
s3
0R
ese
arch
Wo
rst
Cas
e Sc
enar
io
of
Faci
lity
Failu
re4
day
s
31
Pro
vid
e P
re-L
im D
ata
to K
C f
or
Rev
iew
1 d
ay
32
Inco
rpo
rate
KC
Co
mm
ents
In
Fin
al D
raft
Wo
rst
Cas
e A
nal
ysis
5 d
ays
33
Pro
vid
e Fi
nal
Dra
ft o
f En
d U
ser
Wo
rst
Cas
e A
nal
ysis
0 d
ays
34
Team
Pro
gres
s M
eeti
ng
28
day
s3
5Te
am P
rogr
ess
Mee
tin
g 1
1 d
ay3
6Te
am P
rogr
ess
Mee
tin
g 2
1 d
ay
11
/5
11
/12
11
/19
11
/26
11
/19
11
/26
17
20
23
26
29
14
71
01
31
61
92
22
52
81
4O
cto
ber
20
10
No
vem
ber
20
10
Dec
emb
er 2
01
0
Task
Split
Mile
sto
ne
Sum
mar
y
Pro
ject
Su
mm
ary
Exte
rnal
Tas
ks
Exte
rnal
Mile
sto
ne
Inac
tive
Tas
k
Inac
tive
Mile
sto
ne
Inac
tive
Su
mm
ary
Man
ual
Tas
k
Du
rati
on
-on
ly
Man
ual
Su
mm
ary
Ro
llup
Man
ual
Su
mm
ary
Star
t-o
nly
Fin
ish
-on
ly
Dea
dlin
e
Pro
gres
s
Pag
e 2
Pro
ject
: Win
Tec
Mar
ket
An
alys
isD
ate:
Tu
e 1
1/3
0/1
0
IDTa
sk
Mo
de
Task
Nam
eD
ura
tio
n
37
Team
Pro
gres
s M
eeti
ng
31
day
38
Team
Pro
gres
s M
eeti
ng
41
day
39
Team
Pro
gres
s M
eeti
ng
51
day
17
20
23
26
29
14
71
01
31
61
92
22
52
81
4O
cto
ber
20
10
No
vem
ber
20
10
Dec
emb
er 2
01
0
Task
Split
Mile
sto
ne
Sum
mar
y
Pro
ject
Su
mm
ary
Exte
rnal
Tas
ks
Exte
rnal
Mile
sto
ne
Inac
tive
Tas
k
Inac
tive
Mile
sto
ne
Inac
tive
Su
mm
ary
Man
ual
Tas
k
Du
rati
on
-on
ly
Man
ual
Su
mm
ary
Ro
llup
Man
ual
Su
mm
ary
Star
t-o
nly
Fin
ish
-on
ly
Dea
dlin
e
Pro
gres
s
Pag
e 3
Pro
ject
: Win
Tec
Mar
ket
An
alys
isD
ate:
Tu
e 1
1/3
0/1
0
FS
FS
FS
Pro
gre
ss M
ee
tin
g W
ith
Em
ery
Star
t: S
un
10
/24
/10ID
: 1
Fin
ish
: Su
n 1
0/2
4/1
0Du
r: 1
day
Res
:
Kic
koff
Me
eti
ng
wit
h P
roje
ct T
eam
Star
t: T
ue
10
/26
/10ID
: 2
Fin
ish
: Tu
e 1
0/2
6/1
0Du
r: 1
day
Res
:
Pag
e 1

Pag
e 2
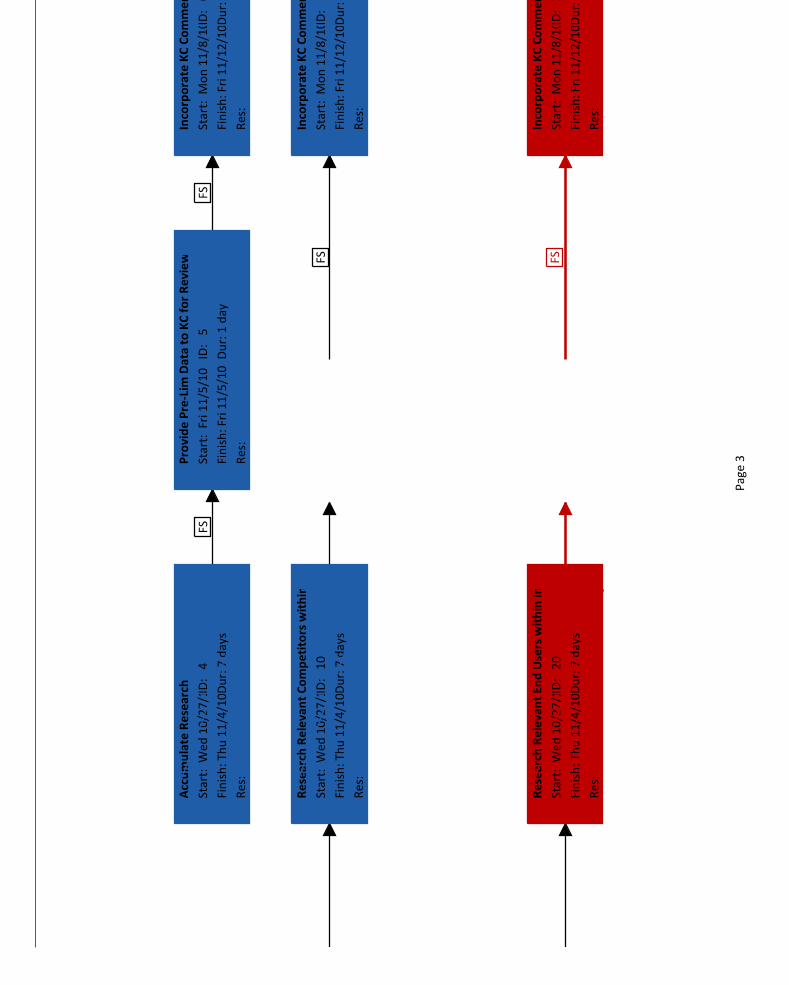
FSFS
FSFS
FSFS
Pro
vid
e P
re-L
im D
ata
to K
C f
or
Re
vie
w
Star
t: F
ri 1
1/5
/10
ID:
5
Fin
ish
: Fri
11
/5/1
0D
ur:
1 d
ay
Res
:
Inco
rpo
rate
KC
Co
mm
en
ts In
Fin
al D
raft
Re
gula
tory
Se
ctio
n
Star
t: M
on
11
/8/1
0ID
: 6
Fin
ish
: Fri
11
/12
/10D
ur:
5 d
ays
Res
:
Acc
um
ula
te R
ese
arch
Star
t: W
ed 1
0/2
7/1
0ID:
4
Fin
ish
: Th
u 1
1/4
/10D
ur:
7 d
ays
Res
:
Re
sear
ch R
ele
van
t C
om
pe
tito
rs w
ith
in In
du
stry
Star
t: W
ed 1
0/2
7/1
0ID:
10
Fin
ish
: Th
u 1
1/4
/10D
ur:
7 d
ays
Res
:
Inco
rpo
rate
KC
Co
mm
en
ts In
Fin
al D
raft
Co
mp
eti
tive
An
alys
is
Star
t: M
on
11
/8/1
0ID
: 1
2
Fin
ish
: Fri
11
/12
/10D
ur:
5 d
ays
Res
:
Re
sear
ch R
ele
van
t En
d U
sers
wit
hin
Ind
ust
ry
Star
t: W
ed 1
0/2
7/1
0ID:
20
Fin
ish
: Th
u 1
1/4
/10D
ur:
7 d
ays
Res
:
Inco
rpo
rate
KC
Co
mm
en
ts In
Fin
al D
raft
En
d U
ser
An
alys
is
Star
t: M
on
11
/8/1
0ID
: 2
2
Fin
ish
: Fri
11
/12
/10D
ur:
5 d
ays
Res
:
Pag
e 3

Pag
e 4
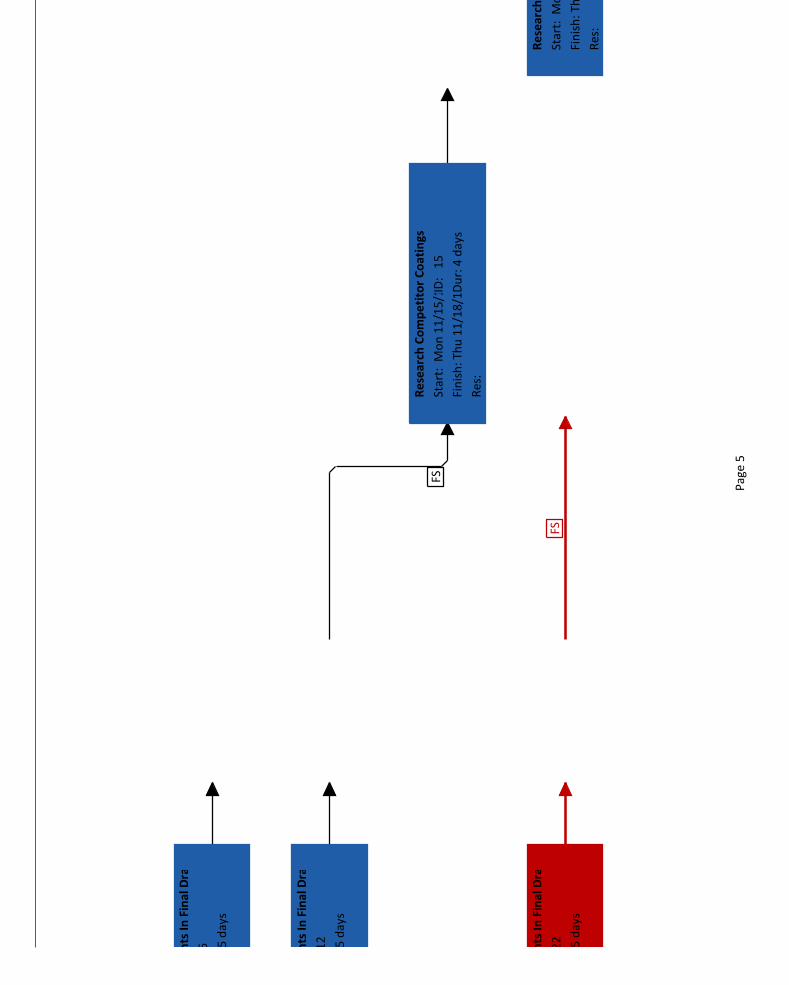
FS FS
FS
FSFS
FS
Inco
rpo
rate
KC
Co
mm
en
ts In
Fin
al D
raft
Re
gula
tory
Se
ctio
n
ID:
6
Du
r: 5
day
s
Res
:
Inco
rpo
rate
KC
Co
mm
en
ts In
Fin
al D
raft
Co
mp
eti
tive
An
alys
is
ID:
12
Du
r: 5
day
s
Res
:
Inco
rpo
rate
KC
Co
mm
en
ts In
Fin
al D
raft
En
d U
ser
An
alys
is
ID:
22
Du
r: 5
day
s
Res
:
Re
sear
ch C
om
pe
tito
r C
oat
ings
Star
t: M
on
11
/15
/10ID
: 1
5
Fin
ish
: Th
u 1
1/1
8/1
0Du
r: 4
day
s
Res
:
Re
sear
ch E
nd
Use
r Su
pp
ly C
hai
ns
Star
t: M
on
11
/15
/10
Fin
ish
: Th
u 1
1/1
8/1
0
Res
:
Pag
e 5

Pag
e 6

FSFS
FSFS
FS
FSFS
Inco
rpo
rate
KC
Co
mm
en
ts In
Fin
al D
raft
Co
mp
eti
tor
Co
atin
g A
nal
ysis
Star
t: M
on
11
/22
/10ID
: 1
7
Fin
ish
: Fri
11
/26
/10D
ur:
5 d
ays
Res
:
Re
sear
ch E
nd
Use
r Su
pp
ly C
hai
ns
Star
t: M
on
11
/15
/10ID
: 2
5
Fin
ish
: Th
u 1
1/1
8/1
0Du
r: 4
day
s
Res
:
Inco
rpo
rate
KC
Co
mm
en
ts In
Fin
al D
raft
En
d U
ser
Sup
ply
Ch
ain
An
alys
is
Star
t: M
on
11
/22
/10ID
: 2
7
Fin
ish
: Fri
11
/26
/10D
ur:
5 d
ays
Res
:
Re
sear
ch W
ors
t C
ase
Sce
nar
io o
f Fa
cilit
y Fa
ilure
Star
t: M
on
11
/15
/10ID
: 3
0
Fin
ish
: Th
u 1
1/1
8/1
0Du
r: 4
day
s
Res
:
Pag
e 7
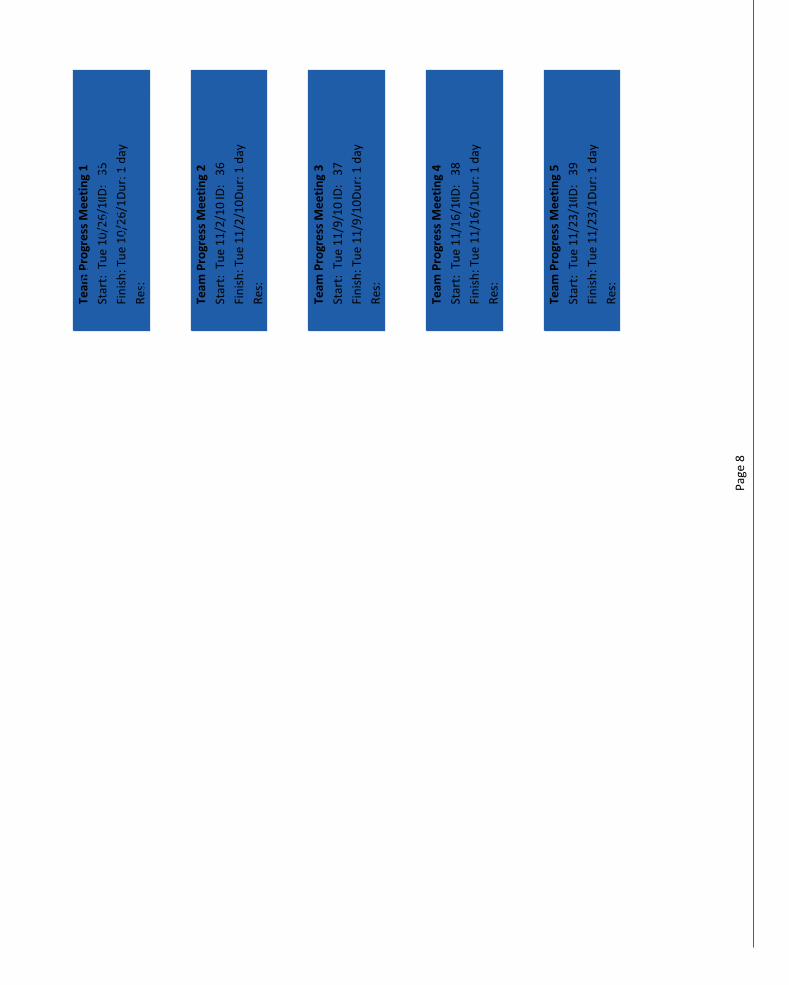
Team
Pro
gre
ss M
ee
tin
g 1
Star
t: T
ue
10
/26
/10ID
: 3
5
Fin
ish
: Tu
e 1
0/2
6/1
0Du
r: 1
day
Res
:
Team
Pro
gre
ss M
ee
tin
g 2
Star
t: T
ue
11
/2/1
0ID
: 3
6
Fin
ish
: Tu
e 1
1/2
/10
Du
r: 1
day
Res
:
Team
Pro
gre
ss M
ee
tin
g 3
Star
t: T
ue
11
/9/1
0ID
: 3
7
Fin
ish
: Tu
e 1
1/9
/10
Du
r: 1
day
Res
:
Team
Pro
gre
ss M
ee
tin
g 4
Star
t: T
ue
11
/16
/10ID
: 3
8
Fin
ish
: Tu
e 1
1/1
6/1
0Du
r: 1
day
Res
:
Team
Pro
gre
ss M
ee
tin
g 5
Star
t: T
ue
11
/23
/10ID
: 3
9
Fin
ish
: Tu
e 1
1/2
3/1
0Du
r: 1
day
Res
:
Pag
e 8
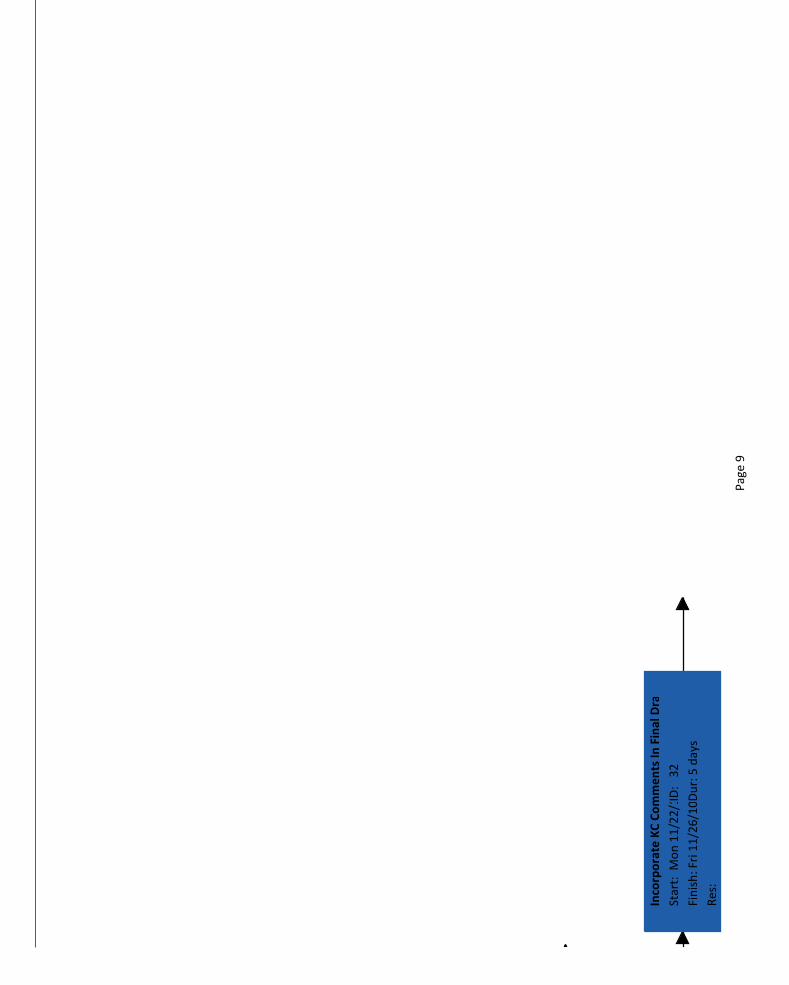
FS
Inco
rpo
rate
KC
Co
mm
en
ts In
Fin
al D
raft
Wo
rst
Cas
e A
nal
ysis
Star
t: M
on
11
/22
/10ID
: 3
2
Fin
ish
: Fri
11
/26
/10D
ur:
5 d
ays
Res
:
Pag
e 9

Pag
e 1
0

Cri
tica
l
No
ncr
itic
al
Cri
tica
l Mile
sto
ne
Mile
sto
ne
Cri
tica
l Su
mm
ary
Sum
mar
y
Cri
tica
l In
sert
ed
Inse
rted
Cri
tica
l Mar
ked
Mar
ked
Cri
tica
l Ext
ern
al
Exte
rnal
Pro
ject
Su
mm
ary
Hig
hlig
hte
d C
riti
cal
Hig
hlig
hte
d N
on
crit
ical
Pag
e 1
1
Pro
ject
: Win
Tec
Mar
ket
An
alys
isD
ate:
Tu
e 1
1/3
0/1
0
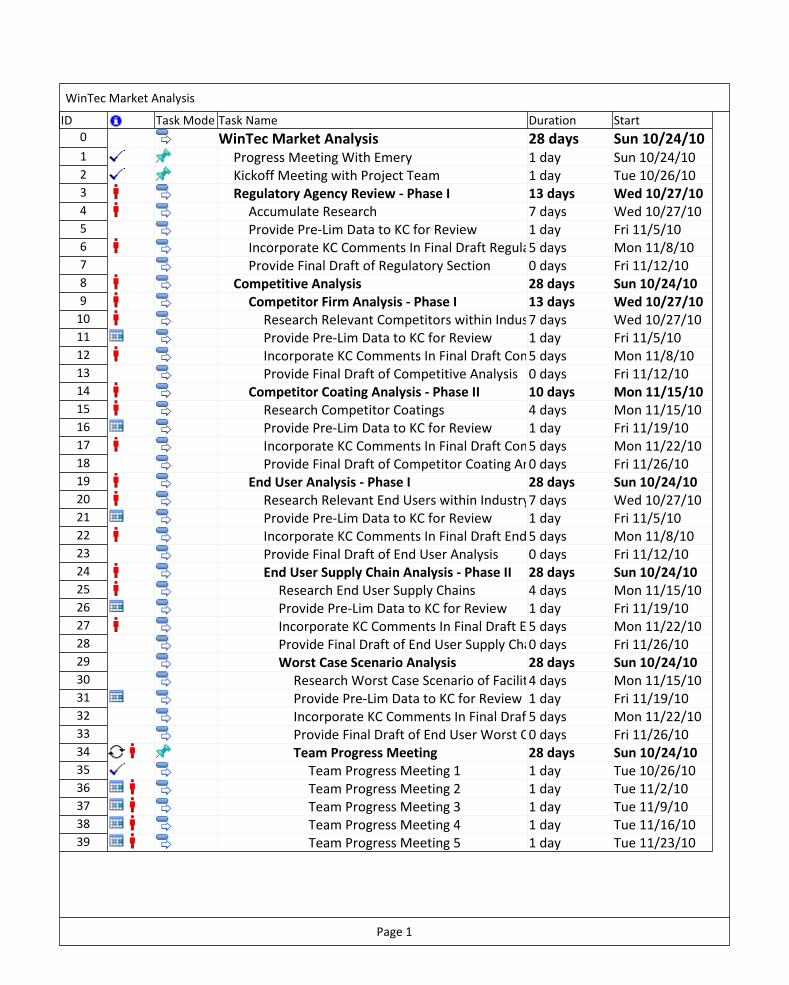
ID Task Mode Task Name Duration Start
0 WinTec Market Analysis 28 days Sun 10/24/101 Progress Meeting With Emery 1 day Sun 10/24/102 Kickoff Meeting with Project Team 1 day Tue 10/26/103 Regulatory Agency Review - Phase I 13 days Wed 10/27/104 Accumulate Research 7 days Wed 10/27/105 Provide Pre-Lim Data to KC for Review 1 day Fri 11/5/106 Incorporate KC Comments In Final Draft Regulatory Section5 days Mon 11/8/107 Provide Final Draft of Regulatory Section 0 days Fri 11/12/108 Competitive Analysis 28 days Sun 10/24/109 Competitor Firm Analysis - Phase I 13 days Wed 10/27/10
10 Research Relevant Competitors within Industry7 days Wed 10/27/1011 Provide Pre-Lim Data to KC for Review 1 day Fri 11/5/1012 Incorporate KC Comments In Final Draft Competitive Analysis5 days Mon 11/8/1013 Provide Final Draft of Competitive Analysis 0 days Fri 11/12/1014 Competitor Coating Analysis - Phase II 10 days Mon 11/15/1015 Research Competitor Coatings 4 days Mon 11/15/1016 Provide Pre-Lim Data to KC for Review 1 day Fri 11/19/1017 Incorporate KC Comments In Final Draft Competitor Coating Analysis5 days Mon 11/22/1018 Provide Final Draft of Competitor Coating Analysis0 days Fri 11/26/1019 End User Analysis - Phase I 28 days Sun 10/24/1020 Research Relevant End Users within Industry7 days Wed 10/27/1021 Provide Pre-Lim Data to KC for Review 1 day Fri 11/5/1022 Incorporate KC Comments In Final Draft End User Analysis5 days Mon 11/8/1023 Provide Final Draft of End User Analysis 0 days Fri 11/12/1024 End User Supply Chain Analysis - Phase II 28 days Sun 10/24/1025 Research End User Supply Chains 4 days Mon 11/15/1026 Provide Pre-Lim Data to KC for Review 1 day Fri 11/19/1027 Incorporate KC Comments In Final Draft End User Supply Chain Analysis5 days Mon 11/22/1028 Provide Final Draft of End User Supply Chain Analysis0 days Fri 11/26/1029 Worst Case Scenario Analysis 28 days Sun 10/24/1030 Research Worst Case Scenario of Facility Failure4 days Mon 11/15/1031 Provide Pre-Lim Data to KC for Review 1 day Fri 11/19/1032 Incorporate KC Comments In Final Draft Worst Case Analysis5 days Mon 11/22/1033 Provide Final Draft of End User Worst Case Analysis0 days Fri 11/26/1034 Team Progress Meeting 28 days Sun 10/24/1035 Team Progress Meeting 1 1 day Tue 10/26/1036 Team Progress Meeting 2 1 day Tue 11/2/1037 Team Progress Meeting 3 1 day Tue 11/9/1038 Team Progress Meeting 4 1 day Tue 11/16/1039 Team Progress Meeting 5 1 day Tue 11/23/10
WinTec Market Analysis
Page 1
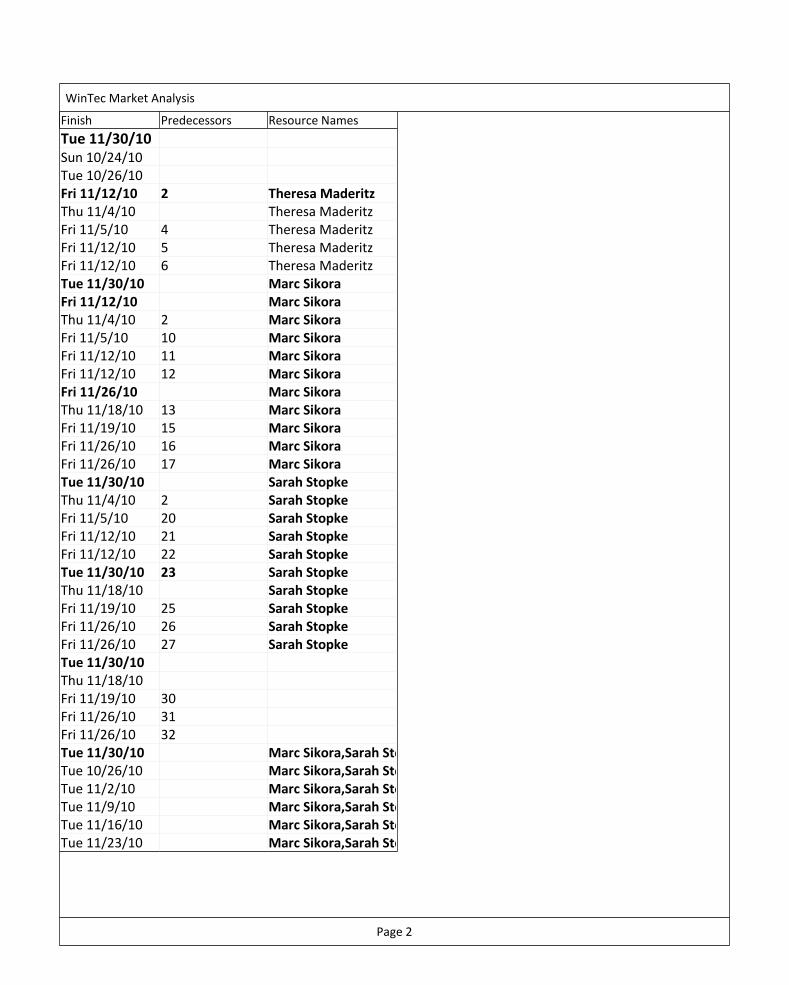
Finish Predecessors Resource Names
Tue 11/30/10Sun 10/24/10Tue 10/26/10Fri 11/12/10 2 Theresa MaderitzThu 11/4/10 Theresa MaderitzFri 11/5/10 4 Theresa MaderitzFri 11/12/10 5 Theresa MaderitzFri 11/12/10 6 Theresa MaderitzTue 11/30/10 Marc SikoraFri 11/12/10 Marc SikoraThu 11/4/10 2 Marc SikoraFri 11/5/10 10 Marc SikoraFri 11/12/10 11 Marc SikoraFri 11/12/10 12 Marc SikoraFri 11/26/10 Marc SikoraThu 11/18/10 13 Marc SikoraFri 11/19/10 15 Marc SikoraFri 11/26/10 16 Marc SikoraFri 11/26/10 17 Marc SikoraTue 11/30/10 Sarah StopkeThu 11/4/10 2 Sarah StopkeFri 11/5/10 20 Sarah StopkeFri 11/12/10 21 Sarah StopkeFri 11/12/10 22 Sarah StopkeTue 11/30/10 23 Sarah StopkeThu 11/18/10 Sarah StopkeFri 11/19/10 25 Sarah StopkeFri 11/26/10 26 Sarah StopkeFri 11/26/10 27 Sarah StopkeTue 11/30/10Thu 11/18/10Fri 11/19/10 30Fri 11/26/10 31Fri 11/26/10 32Tue 11/30/10 Marc Sikora,Sarah Stopke,Theresa MaderitzTue 10/26/10 Marc Sikora,Sarah Stopke,Theresa MaderitzTue 11/2/10 Marc Sikora,Sarah Stopke,Theresa MaderitzTue 11/9/10 Marc Sikora,Sarah Stopke,Theresa MaderitzTue 11/16/10 Marc Sikora,Sarah Stopke,Theresa MaderitzTue 11/23/10 Marc Sikora,Sarah Stopke,Theresa Maderitz
WinTec Market Analysis
Page 2
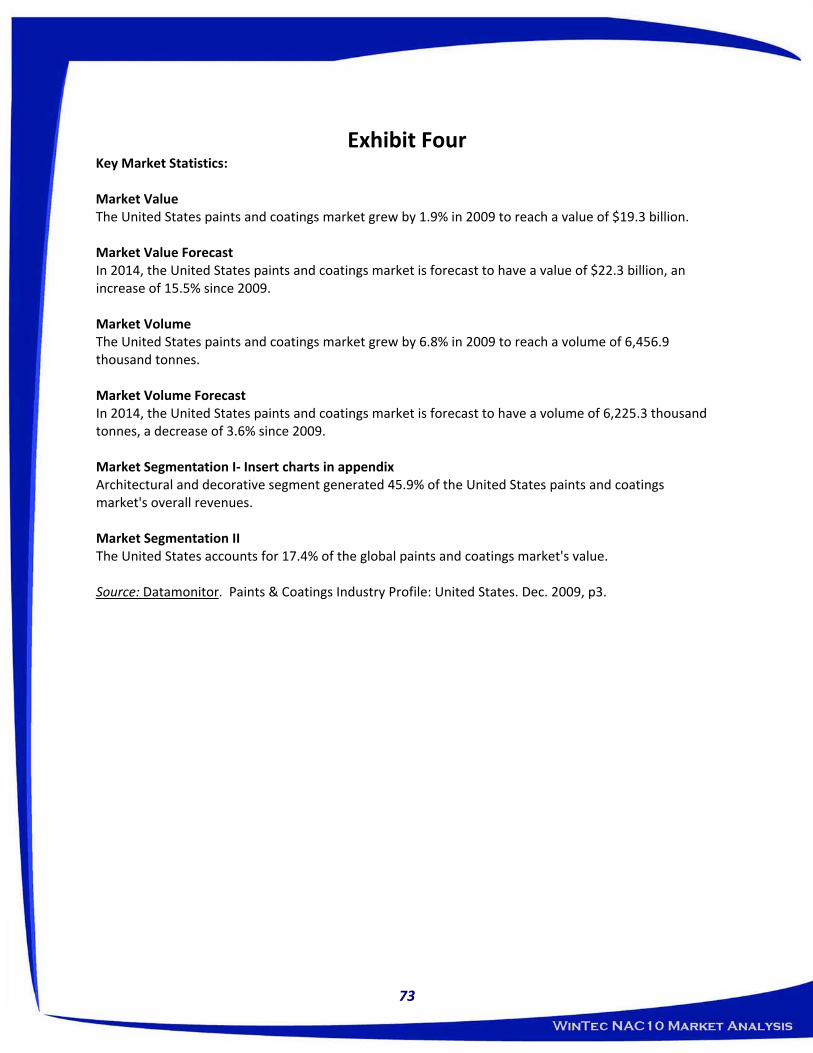
Exhibit Four
Key Market Statistics: Market Value The United States paints and coatings market grew by 1.9% in 2009 to reach a value of $19.3 billion. Market Value Forecast In 2014, the United States paints and coatings market is forecast to have a value of $22.3 billion, an increase of 15.5% since 2009. Market Volume The United States paints and coatings market grew by 6.8% in 2009 to reach a volume of 6,456.9 thousand tonnes. Market Volume Forecast In 2014, the United States paints and coatings market is forecast to have a volume of 6,225.3 thousand tonnes, a decrease of 3.6% since 2009. Market Segmentation I‐ Insert charts in appendix Architectural and decorative segment generated 45.9% of the United States paints and coatings market's overall revenues. Market Segmentation II The United States accounts for 17.4% of the global paints and coatings market's value. Source: Datamonitor. Paints & Coatings Industry Profile: United States. Dec. 2009, p3.
73

Exhibit Five Market Definition: The paints & coatings market consists of liquid and powder based paints, varnishes, and related products used for protective and decorative, industrial and automotive, specialty, or other purposes. The market excludes inks, thinners and raw materials such as pigments and solvents. The architectural & decorative segment consists of products used in homes and buildings, such as interior and exterior paints, primers, sealers, and varnishes. The industrial segment comprises products that are factory‐ applied to manufactured goods as part of the production process. The specialty segment consists of aerosol paints, marine paints, high‐performance maintenance coatings, and automotive refinish paints. The market value is calculated according to end‐user prices. Any currency conversions used in the creation of this report have been calculated using constant annual average exchange rates. Source Datamonitor. Paints & Coatings Industry Profile: United States. Dec. 2009, p7
74

Exhibit Six
Nano‐chemicals hold promise for advanced coatings and specialty chemicals: The micro‐scale science of nanotechnology may be in its infancy, but it offers great promise in the chemicals and coatings sector nonetheless. Nanotech advances will eventually affect everything from LEDs, where brighter monitors and displays may be possible, to slicker, denser paints for industrial, marine and architectural applications. Watch for rapid changes within the specialty chemicals sector, as many factors with the potential for driving the industry in new directions are at work. These include a growing use of biotechnology to create biochemical products such as enzymes and solvents; consolidation, mergers and acquisitions on a worldwide basis; high raw components costs; increased environmental regulations and concerns; rapid growth in demand for plastics and other chemical products; the rise of nanotechnology in such chemicals sectors as composites, coatings and exotic materials; technological breakthroughs in such areas as ceramics; and the rapid rise of China as both a producer and consumer of chemicals and chemical products. BASF estimated it would sell 500 million Euros worth of products that incorporate nanotechnology in 2010, up from 250 million Euros in 2006. These products include nanochemicals for textiles, paints, cosmetics, electronics, insulation and lighting. For example, BASF’s research center in Singapore is working on nanotech component paints for ship hulls with the goal of preventing the extremely costly build up of barnacles, algae and other organisms that plague ship bottoms. BASF’s lab at Louis Pasteur University in Strasbourg is working on nanofoams as potential insulating materials for buildings, transportation and refrigeration equipment. Another example of this firm’s focus on nanotechnology is its Ultradur High Speed plastic. The use of a nanoparticulate additive improves the “flowability” of the plastic, which means that manufacturers can process the plastic at lower temperatures. Global chemicals giant Mitsubishi Chemical created a company named Frontier Carbon Corporation to manufacture tiny, high‐strength carbon structures known as fullerenes or “bucky balls.” Technically speaking, a fullerene is a microscopic, round structure that is geodesic in nature. It has 60 joints across the rounded surface, each joint holding a carbon atom at its center. The geodesic‐like shape affords the structure immense strength. Today, fullerenes are appearing in such products as lubricants, cosmetics, rubber additives andpolymer additives. Eventual applications may include the use of fullerenes in films and coatings, lubricants of many types, photosensitive materials, diagnostic agents and pharmaceuticals, along with such energy uses as lithium batteries, fuel cells and solar cells. Frontier Carbon Corporation’s high output manufacturing has enabled it to sell this exotic carbon product at very reasonable prices. The lowered costs will drive industrial uses. Frontier Carbon is a joint venture between Mitsubishi Chemical Corporation, Mitsubishi Corporation and Nanotech Partners. It was the first firm to create industrial quantities of fullerenes. It was launched with a manufacturing capacity of 40 tons of fullerenes yearly, using the brand name “Nanom.” The secret to Frontier’s success is a “combustion method” that it developed for the high‐speed production of fullerenes. This cost‐effective process is continuous, with a constant stream of fullerenes exiting the system. Source: Plunkett Research: Plunkett, J. W. (Last updated July 23, 2010). Nanochemicals Hold Promise for Advanced Coatings and Specialty Chemicals. [Electronic version]. Chemicals, Coatings & Plastics Industry. Retrieved November 3, 2010 fromhttp://www.plunkettresearchonline.com.
75

Exhibit Seven Competitive Landscape of Coating Industry: The paints and coatings market will be analyzed taking paint manufacturers as players. The key buyers will be taken as industrial and construction companies, and chemical manufacturers as the key suppliers. The US paints and coatings market is concentrated, and dominated by domestic players. With buyers in many different sectors, and the ability to differentiate products through investment in R&D, buyer power is no more than moderate. Most inputs are commodities, readily obtained from many sources, weakening supplier power. The low level of imports in the US market suggests that market entry will generally require investment in US‐based production plants. The construction sector in the US is fragmented, and small subcontracting businesses are often responsible for purchasing materials such as paint. Paints and coatings are so widely used in the manufacturing industry that market players will generally have a wide variety of potential customers. Paints and coatings are generally highly important to buyers. Product differentiation by offering performance improvement is possible, and to this end, major players invest in R&D. All these factors weaken buyer power in this market. However, brand is not likely to be a major consideration for most buyers, who will instead tend to be price‐sensitive, and switching costs are not usually high. These factors strengthen buyer power, which is assessed as moderate overall. Key inputs for paints and coatings are pigments such as titanium dioxide, and epoxy and other resins, as well as containers for packaging. Generally, these are not highly differentiated products, and can be sourced readily from several companies, thereby weakening supplier power. Major players also tend to adopt strategies of identifying substitute raw materials and technologies, to reduce the impact of any rise in input prices. There is also a strong likelihood of vertical integration, with large companies such as BASF active not only in the manufacture of paints and coatings, but also in the production of raw materials like resins. Supplier power is moderate. This market can be entered by a start‐up company, or by an existing company diversifying its products to include paints and coatings; also, a player established elsewhere may begin activities in this country. The manufacture of paints and coatings is generally a high‐volume, automated process, which tends to favor larger companies able to generate scale economies that offset the initial capital outlay on production equipment and facilities. In principal, it is possible to manufacture paint in a different country and export to the US. However, only around 3% of the US market value is supplied by imports, no doubt because of the impact of transportation costs. This implies that establishing a manufacturing facility in the US will almost always be necessary, which raises entry barriers.
76
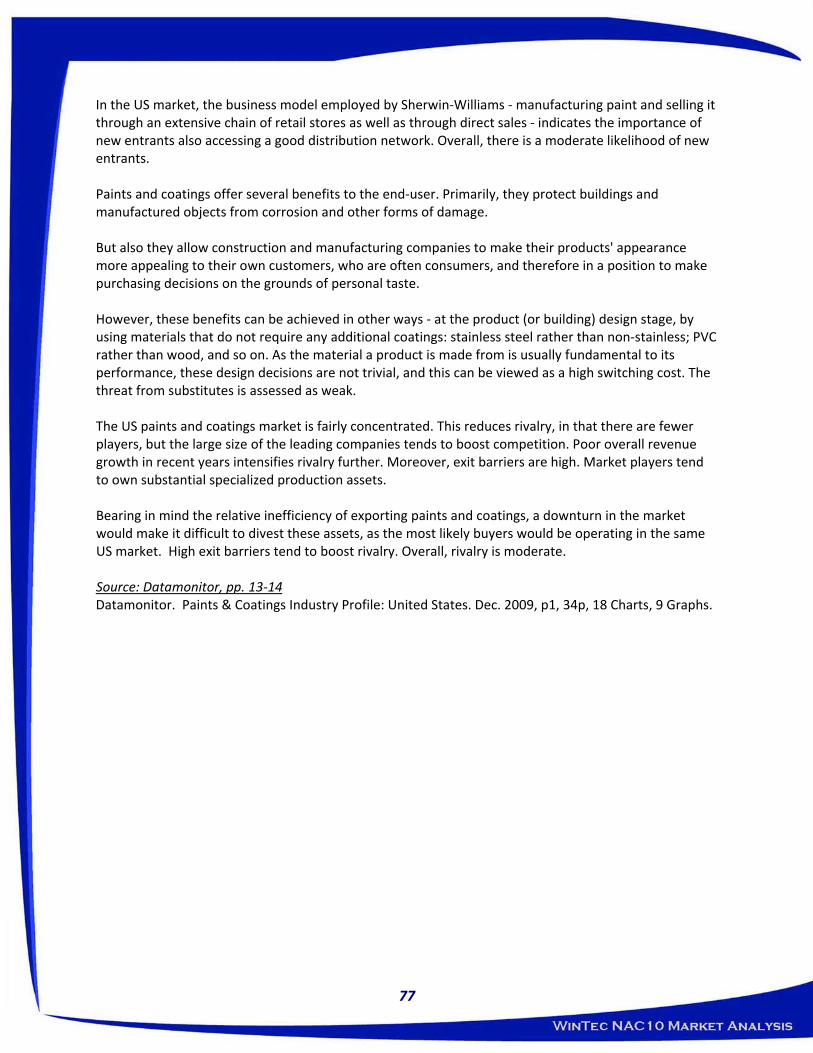
In the US market, the business model employed by Sherwin‐Williams ‐ manufacturing paint and selling it through an extensive chain of retail stores as well as through direct sales ‐ indicates the importance of new entrants also accessing a good distribution network. Overall, there is a moderate likelihood of new entrants. Paints and coatings offer several benefits to the end‐user. Primarily, they protect buildings and manufactured objects from corrosion and other forms of damage. But also they allow construction and manufacturing companies to make their products' appearance more appealing to their own customers, who are often consumers, and therefore in a position to make purchasing decisions on the grounds of personal taste. However, these benefits can be achieved in other ways ‐ at the product (or building) design stage, by using materials that do not require any additional coatings: stainless steel rather than non‐stainless; PVC rather than wood, and so on. As the material a product is made from is usually fundamental to its performance, these design decisions are not trivial, and this can be viewed as a high switching cost. The threat from substitutes is assessed as weak. The US paints and coatings market is fairly concentrated. This reduces rivalry, in that there are fewer players, but the large size of the leading companies tends to boost competition. Poor overall revenue growth in recent years intensifies rivalry further. Moreover, exit barriers are high. Market players tend to own substantial specialized production assets. Bearing in mind the relative inefficiency of exporting paints and coatings, a downturn in the market would make it difficult to divest these assets, as the most likely buyers would be operating in the same US market. High exit barriers tend to boost rivalry. Overall, rivalry is moderate. Source: Datamonitor, pp. 13‐14 Datamonitor. Paints & Coatings Industry Profile: United States. Dec. 2009, p1, 34p, 18 Charts, 9 Graphs.
77

Exhibit Eight Publicly Traded Companies Competing in the Coating Industry: Companies sorted by Net Income Data in millions
Market Cap. Total
Revenue Research & Development
Net Income Ticker Name
Today MRQ MRQ MRQ
PBR Petroleo Brasileiro SA (ADR)
149,685.77 27,559.00 756.00 4,317.00
BASFY BASF SE (ADR) 66,773.40 21,216.13 492.00 1,547.96
DOW The Dow Chemical Company
35,769.96 13,618.00 407.00 651.00
DD E.I. du Pont de Nemours & Company
42,859.89 9,080.00 404.00 1,159.00
MMM 3M Company 60,060.17 6,731.00 350.00 1,121.00
AKZOY Akzo Nobel N.V. (ADR)
13,834.88 5,384.59 123.93 331.40
PPG PPG Industries, Inc.
12,666.99 3,460.00 0.00 262.00
SVYSY Solvay S.A. (ADR)
7,682.39 2,408.87 50.81 57.32
ASH Ashland Inc. 4,064.85 2,362.00 23.00 148.00
SHW Sherwin‐Williams Company
7,938.43 2,143.06 0.00 181.71
MAS Masco Corporation
3,821.61 2,048.00 0.00 3.00
MWV MeadWestvaco Corp.
4,394.72 1,552.00 0.00 50.00
LZ Lubrizol Corporation
6,918.18 1,401.20 52.90 201.40
TKR The Timken Company
4,007.00 1,011.40 0.00 85.60
RPM RPM International Inc.
2,669.53 894.81 0.00 69.00
78

ROC Rockwood Holdings, Inc.
2,552.43 874.50 0.00 52.40
VAL The Valspar Corporation
3,160.96 873.92 24.76 75.14
CYT Cytec Industries Inc.
2,441.04 837.10 18.00 37.70
CSL Carlisle Companies, Inc.
2,138.54 709.40 6.40 38.60
GRA W.R. Grace & Co.
2,333.33 682.10 14.80 54.90
FOE Ferro Corporation
1,181.70 543.49 0.00 7.10
AAAGY Altana AG (ADR)
2,734.21 538.55 27.35 62.30
ARJ Arch Chemicals, Inc.
892.06 441.40 5.10 43.50
JDSU JDS Uniphase Corporation
2,326.69 390.90 51.40 1.50
FUL H.B. Fuller Company
1,010.92 338.57 0.00 18.98
BW Brush Engineered Material
674.63 325.95 1.80 13.72
OMN OMNOVA Solutions Inc.
358.35 227.90 0.00 3.50
ENTG Entegris, Inc. 790.04 167.58 10.74 18.39
KWR Quaker Chemical Corporation
410.04 135.99 0.00 9.15
HWKN Hawkins, Inc. 370.09 74.67 0.00 7.34
CCF Chase Corporation
139.97 35.44 0.00 4.37
LPAD LaPolla Industries, Inc.
34.53 16.65 0.00 0.54
SWTX Southwall Technologies
67.75 11.79 0.79 3.04
LUNA Luna Innovations Incorporated
22.96 9.00 0.43 ‐0.62
OBCI Ocean Bio‐ 15.79 7.35 0.00 0.37
79
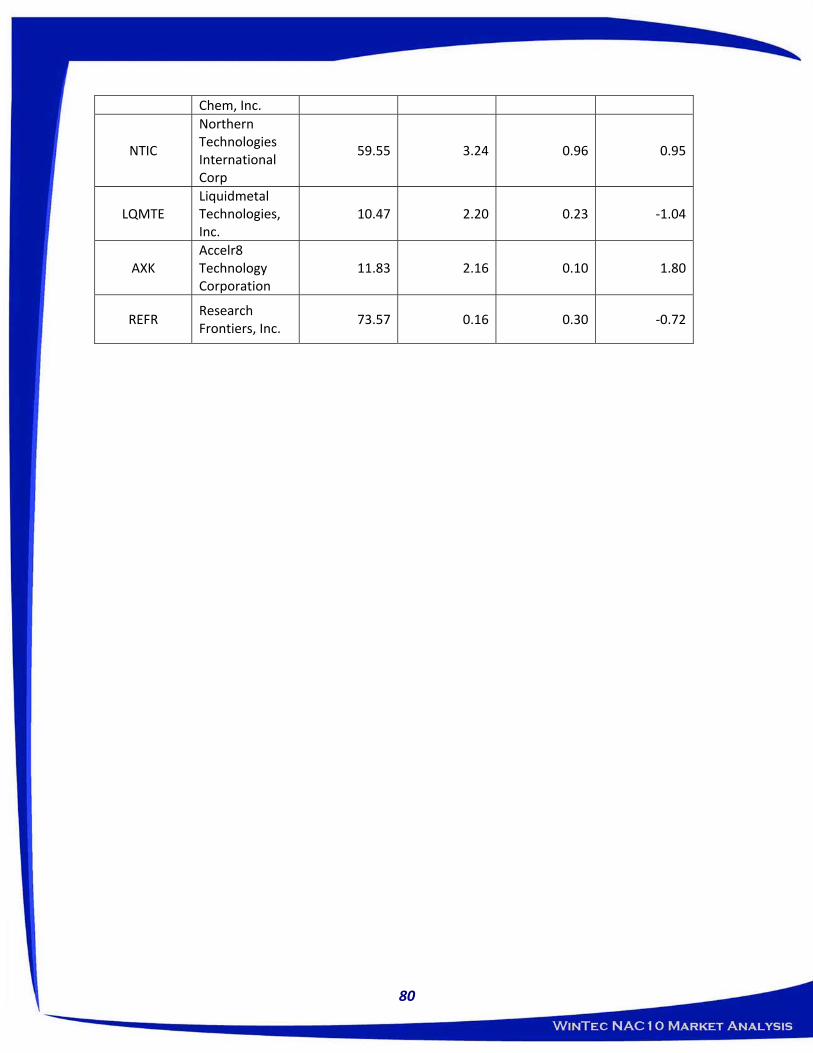
Chem, Inc.
NTIC
Northern Technologies International Corp
59.55 3.24 0.96 0.95
LQMTE Liquidmetal Technologies, Inc.
10.47 2.20 0.23 ‐1.04
AXK Accelr8 Technology Corporation
11.83 2.16 0.10 1.80
REFR Research Frontiers, Inc.
73.57 0.16 0.30 ‐0.72
80

Exhibit Nine
81
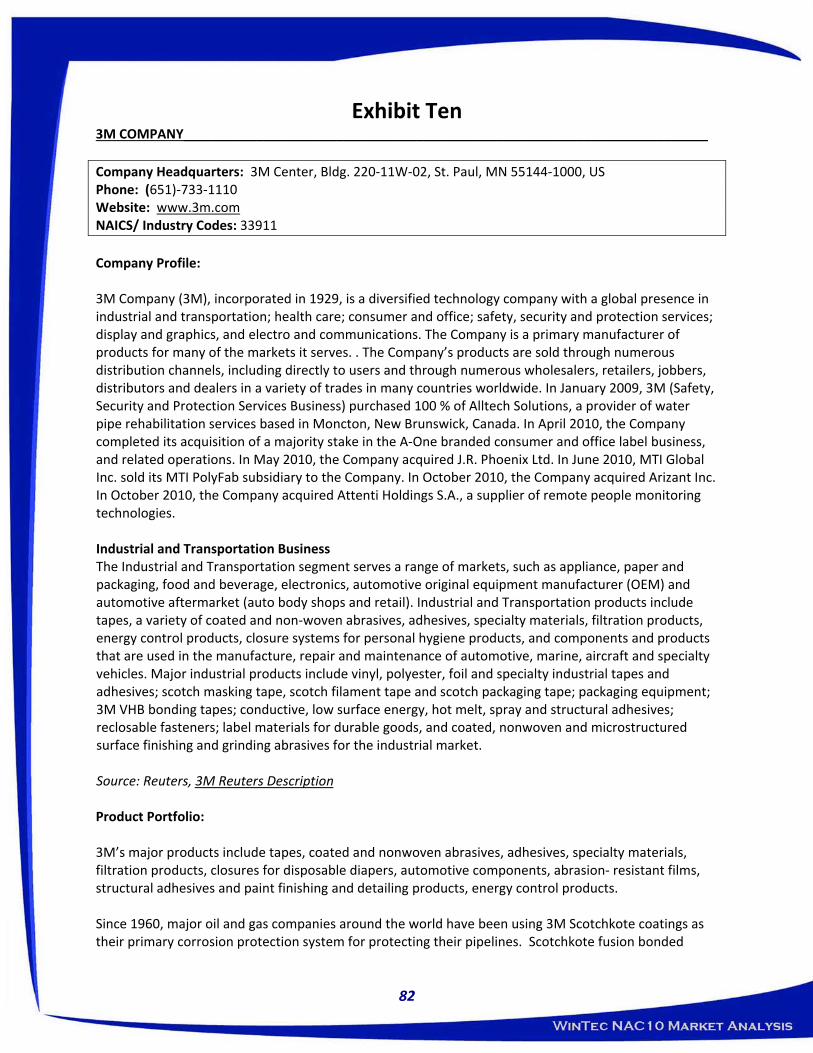
Exhibit Ten 3M COMPANY________________________________________________________________________ Company Headquarters: 3M Center, Bldg. 220‐11W‐02, St. Paul, MN 55144‐1000, US Phone: (651)‐733‐1110 Website: www.3m.com NAICS/ Industry Codes: 33911 Company Profile: 3M Company (3M), incorporated in 1929, is a diversified technology company with a global presence in industrial and transportation; health care; consumer and office; safety, security and protection services; display and graphics, and electro and communications. The Company is a primary manufacturer of products for many of the markets it serves. . The Company’s products are sold through numerous distribution channels, including directly to users and through numerous wholesalers, retailers, jobbers, distributors and dealers in a variety of trades in many countries worldwide. In January 2009, 3M (Safety, Security and Protection Services Business) purchased 100 % of Alltech Solutions, a provider of water pipe rehabilitation services based in Moncton, New Brunswick, Canada. In April 2010, the Company completed its acquisition of a majority stake in the A‐One branded consumer and office label business, and related operations. In May 2010, the Company acquired J.R. Phoenix Ltd. In June 2010, MTI Global Inc. sold its MTI PolyFab subsidiary to the Company. In October 2010, the Company acquired Arizant Inc. In October 2010, the Company acquired Attenti Holdings S.A., a supplier of remote people monitoring technologies. Industrial and Transportation Business The Industrial and Transportation segment serves a range of markets, such as appliance, paper and packaging, food and beverage, electronics, automotive original equipment manufacturer (OEM) and automotive aftermarket (auto body shops and retail). Industrial and Transportation products include tapes, a variety of coated and non‐woven abrasives, adhesives, specialty materials, filtration products, energy control products, closure systems for personal hygiene products, and components and products that are used in the manufacture, repair and maintenance of automotive, marine, aircraft and specialty vehicles. Major industrial products include vinyl, polyester, foil and specialty industrial tapes and adhesives; scotch masking tape, scotch filament tape and scotch packaging tape; packaging equipment; 3M VHB bonding tapes; conductive, low surface energy, hot melt, spray and structural adhesives; reclosable fasteners; label materials for durable goods, and coated, nonwoven and microstructured surface finishing and grinding abrasives for the industrial market. Source: Reuters, 3M Reuters Description Product Portfolio: 3M’s major products include tapes, coated and nonwoven abrasives, adhesives, specialty materials, filtration products, closures for disposable diapers, automotive components, abrasion‐ resistant films, structural adhesives and paint finishing and detailing products, energy control products. Since 1960‚ major oil and gas companies around the world have been using 3M Scotchkote coatings as their primary corrosion protection system for protecting their pipelines. Scotchkote fusion bonded
82
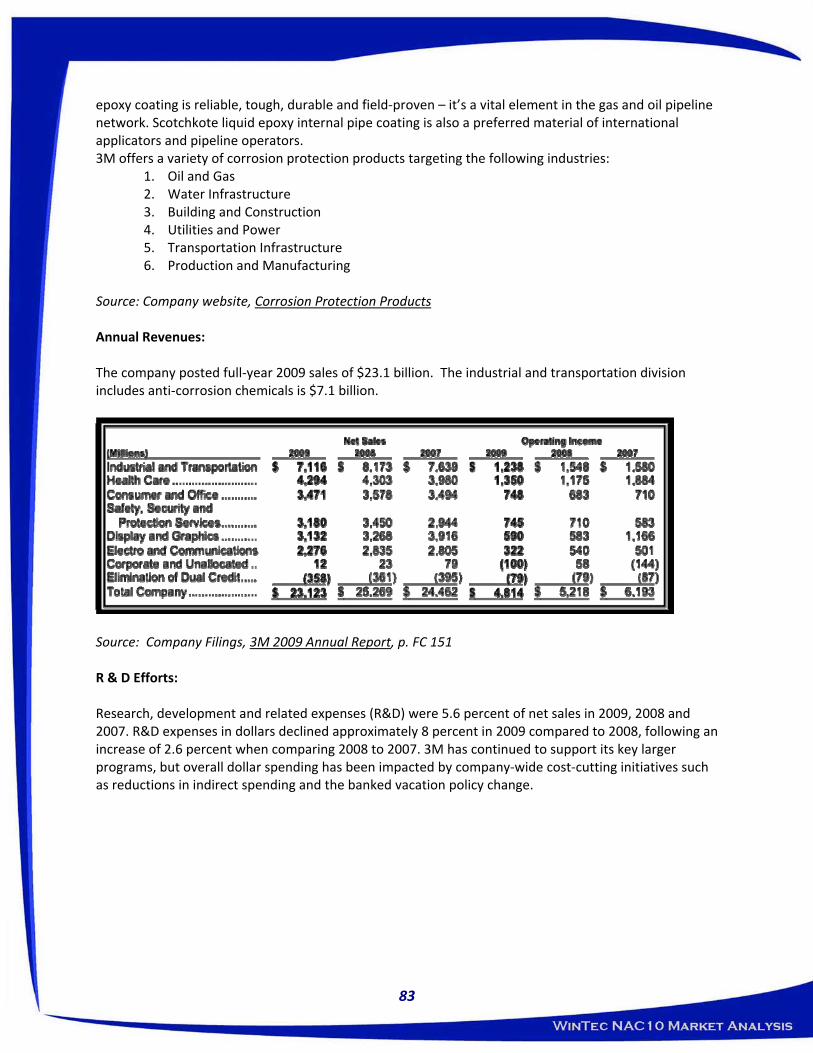
epoxy coating is reliable‚ tough‚ durable and field‐proven – it’s a vital element in the gas and oil pipeline network. Scotchkote liquid epoxy internal pipe coating is also a preferred material of international applicators and pipeline operators. 3M offers a variety of corrosion protection products targeting the following industries:
1. Oil and Gas 2. Water Infrastructure 3. Building and Construction 4. Utilities and Power 5. Transportation Infrastructure 6. Production and Manufacturing
Source: Company website, Corrosion Protection Products Annual Revenues: The company posted full‐year 2009 sales of $23.1 billion. The industrial and transportation division includes anti‐corrosion chemicals is $7.1 billion.
Source: Company Filings, 3M 2009 Annual Report, p. FC 151 R & D Efforts: Research, development and related expenses (R&D) were 5.6 percent of net sales in 2009, 2008 and 2007. R&D expenses in dollars declined approximately 8 percent in 2009 compared to 2008, following an increase of 2.6 percent when comparing 2008 to 2007. 3M has continued to support its key larger programs, but overall dollar spending has been impacted by company‐wide cost‐cutting initiatives such as reductions in indirect spending and the banked vacation policy change.
83

Source: Company Filings, 3M 2009 Annual Report, p. FC 23 Evaluation of Strategic Initiatives: A distinguishing factor of 2009 was this resolve to maintain investments in the future. We maintained investments of more than a billion dollars in R&D at a time when many companies were forced to dramatically cut back. And we still managed to achieve an impressive free cash flow conversion, about 126%, even with $900 million capital investment last year and nearly $1.4 billion put into our pension and postretirement plans, the majority of which was cash. These investments are a clear and present signal of our confidence in the future of 3M and will only serve to make us stronger yet. Source: Company Filings, 3M 2009 Annual Report, p. FC 2
84

Exhibit Eleven PPG Industries_________________________________________________________________________ Company Headquarters: 1 PPG Pl., Pittsburgh, PA 15272, US Phone: (412) 434‐3131 Website: www.ppg.com NAICS/ Industry Code: 325510 Company Profile: PPG Industries, Inc. (PPG), incorporated in 1883, is a global supplier of protective and decorative coatings. The Company operates in six segments: Performance Coatings, Industrial Coatings, Architectural Coatings, Optical and Specialty Materials, Commodity Chemicals and Glass. The Performance Coatings, Industrial Coatings and Architectural Coatings segments supply protective and decorative finishes for customers in a range of end use markets, including industrial equipment, appliances and packaging; factory‐finished aluminum extrusions and steel and aluminum coils; marine and aircraft equipment; automotive original equipment, and other industrial and consumer products. In addition to supplying finishes to the automotive original equipment market, PPG supplies refinishes to the automotive aftermarket. Performance Coatings, Industrial Coatings and Architectural Coatings The Performance Coatings consists of the refinish, aerospace, protective and marine and architectural coatings businesses. The refinish coatings business supplies coatings products for automotive and commercial transport/fleet repair and refurbishing, light industrial coatings for an array of markets and specialty coatings for signs. These products are sold primarily through distributors. The aerospace coatings business supplies coatings products for automotive and commercial transport/fleet repair and refurbishing, light industrial coatings for a range of markets and specialty coatings for signs. The protective and marine coatings business supplies coatings and finishes for the protection of metals and structures to metal fabricators, heavy‐duty maintenance contractors and manufacturers of ships, bridges, rail cars and shipping containers. These products are sold through the architectural coatings Company‐owned architectural coatings stores, independent distributors and directly to customers. The architectural coatings business primarily produces coatings used by painting and maintenance contractors and by consumers for decoration and maintenance. Architectural coatings products are sold through a combination of Company‐owned stores, home centers, paint dealers, independent distributors and directly to customers. The architectural coatings business operates approximately 400 Company‐owned stores in North America and approximately 50 Company‐owned stores in Australia. The Company’s Industrial Coatings segment consists of the automotive, industrial and packaging coatings businesses. The industrial and automotive coatings businesses sell directly to a variety of manufacturing companies. PPG also supplies adhesives and sealants for the automotive industry and metal pretreatments and related chemicals for industrial and automotive applications. The packaging coatings business supplies coatings and inks to the manufacturers of aerosol, food and beverage containers. The Architectural Coatings business supplies a variety of coatings under a number of brands and purchased sundries to painting contractors and consumers in Europe, the Middle East and Africa.
85
The products are sold through a combination of about 560 company‐owned stores, home centers, paint dealers, independent distributors and directly to customers. Performance Coatings, Industrial Coatings and Architectural Coatings PPG is a major global supplier of protective and decorative coatings. The Performance Coatings, Industrial Coatings and Architectural Coatings – EMEA reportable segments supply protective and decorative finishes for customers in a wide array of end use markets, including industrial equipment, appliances and packaging; factory‐ finished aluminum extrusions and steel and aluminum coils; marine and aircraft equipment; automotive original equipment; and other industrial and consumer products. In addition to supplying finishes to the automotive original equipment market, PPG supplies refinishes to the automotive aftermarket. PPG also supplies coatings to painting and maintenance contractors and directly to consumers for decoration and maintenance. The coatings industry is highly competitive and consists of a few large firms with global presence and many smaller firms serving local or regional markets. PPG competes in its primary markets with the world’s largest coatings companies, most of which have global operations, and many smaller regional coatings companies. Product development, innovation, quality and technical and customer service have been stressed by PPG and have been significant factors in developing an important supplier position by PPG’s coatings businesses comprising the Performance Coatings, Industrial Coatings and Architectural Coatings – EMEA reportable segments. The Company competes with Akzo Nobel NV, BASF Corporation, the DuPont Company, the Sherwin‐Williams Company, Valspar Corporation, Nippon paint, Materis Paints, The Dow Chemical Company, Formosa Plastics Corporation, Georgia Gulf Corporation, Olin Corporation, Occidental Chemical Corporation, Asahi Glass Company, Cardinal Glass Industries, Guardian Industries, NSG Pilkington, Owens Corning, Vetrotex, Jushi Group, Johns Manville Corporation, CPIC Fiberglass, AGY and Taishan Fiberglass. Source: Reuters, PPG Reuter's Description and Annual Report p. 2, Annual Report Product Portfolio: PPG protective and marine coatings offer a variety of protection‐based products. Protective Coatings
1. Civil Infrastructure PPG Protective & Marine Coatings delivers proven performance for the severe conditions found in the Civil Infrastructure segment. These markets cover a wide variety of structures, many of which involve huge investment and exposure to corrosive environments. Constant innovation and investment has given PPG proven, durable products for a range of Civil Infrastructure applications: Airport, Bridges, Pipelines, Stadiums, Water and wastewater treatment plants, Water transmission and storage. 2. Offshore Using state‐of‐the‐art technology, PPG’s segment‐leading coatings requirements offer the best protection against steel corrosion in the most extreme environmental conditions. Combined with hydrocarbon Passive Fire Protection offerings, PPG offshore systems provide exceptional protective coatings solutions feature our high performance tank lining range, general purpose epoxy primers and durable finishes.
86
Their coatings have been tested by third party laboratories and certificates are available on request. Constant innovation and investment has given PPG proven, durable products for a range of Offshore applications: Topsides, Decks, Tanks, Passive Fire Protection (PITT‐CHAR® XP), Splash zone, Subsea. 3. Petrochemical The environmental conditions found within the Petrochemical industry are some of the most extreme in the protective coatings industry. PPG Protective & Marine Coatings has a wealth of experience in this field to meet and service the requirements of our global customers. PPG offers an excellent range of protective coatings featuring our unique tank linings, general purpose epoxy primers and durable finishes. Our advanced coating systems, combined with our hydrocarbon Passive Fire Protection offer, give PPG the capability of providing a complete solution – whatever your need. Continuous innovation and investment has given PPG proven, durable products for a range of Petrochemical applications: Jetty protection, Structural steel, Storage facilities, Process equipment, Pipes, Passive Fire Protection (PITT‐CHAR® XP). 4. Power PPG helps energy producers meet this challenge with proven products by making plants and equipment last longer, work better, and lower on‐going maintenance costs – even in some of the world's harshest environments. Decades of innovation and investment have given PPG proven, durable products for a range of Power sectors: Fossil fuel, Nuclear, Hydroelectric, Wind, Transmission towers.
Marine Coatings PPG continually strives to develop and market products that meet the current requirements of both operators and yards. Consequently, they have launched coatings that allow for extended laid‐up periods, meet latest IMO PSPC regulations for water ballast tanks, and reduce the cost of onboard maintenance. In addition, they have coatings solutions that reduce fuel consumption and carbon dioxide emissions as a result of improved hydrodynamics of the ship’s hull. Constant innovation and investment has given PPG proven, durable products for a range of Marine applications: Marine new‐build, Marine dry dock, Marine sea stock. Source: Company website, Product Divisions Market Share: n/a Annual Revenues: The Industrial Coatings reportable segment is comprised of the automotive, industrial and packaging coatings operating segments. This reportable segment primarily supplies a variety of protective and
87
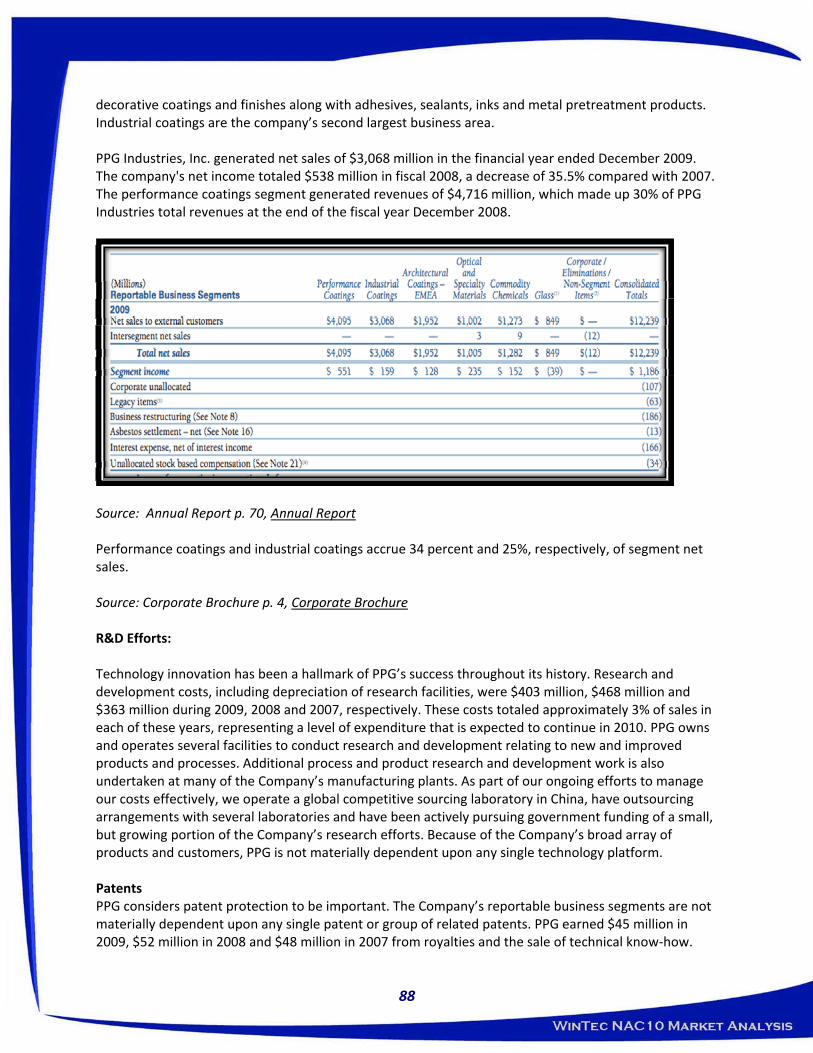
decorative coatings and finishes along with adhesives, sealants, inks and metal pretreatment products. Industrial coatings are the company’s second largest business area. PPG Industries, Inc. generated net sales of $3,068 million in the financial year ended December 2009. The company's net income totaled $538 million in fiscal 2008, a decrease of 35.5% compared with 2007. The performance coatings segment generated revenues of $4,716 million, which made up 30% of PPG Industries total revenues at the end of the fiscal year December 2008.
Source: Annual Report p. 70, Annual Report Performance coatings and industrial coatings accrue 34 percent and 25%, respectively, of segment net sales. Source: Corporate Brochure p. 4, Corporate Brochure R&D Efforts: Technology innovation has been a hallmark of PPG’s success throughout its history. Research and development costs, including depreciation of research facilities, were $403 million, $468 million and $363 million during 2009, 2008 and 2007, respectively. These costs totaled approximately 3% of sales in each of these years, representing a level of expenditure that is expected to continue in 2010. PPG owns and operates several facilities to conduct research and development relating to new and improved products and processes. Additional process and product research and development work is also undertaken at many of the Company’s manufacturing plants. As part of our ongoing efforts to manage our costs effectively, we operate a global competitive sourcing laboratory in China, have outsourcing arrangements with several laboratories and have been actively pursuing government funding of a small, but growing portion of the Company’s research efforts. Because of the Company’s broad array of products and customers, PPG is not materially dependent upon any single technology platform. Patents PPG considers patent protection to be important. The Company’s reportable business segments are not materially dependent upon any single patent or group of related patents. PPG earned $45 million in 2009, $52 million in 2008 and $48 million in 2007 from royalties and the sale of technical know‐how.
88

Backlog In general, PPG does not manufacture its products against a backlog of orders. Production and inventory levels are geared primarily to projections of future demand and the level of incoming orders. Source: Annual Report, p. 10, Annual Report Evaluation of Strategic Initiatives: PPG is currently in a restructuring phase to cut costs. During the first quarter of 2009, the Company finalized a restructuring plan that is focused on further reducing PPG’s global cost structure. The Company recorded a charge of $186 million for the cost of this restructuring. During the third quarter of 2008, the Company finalized a restructuring plan that is part of implementing PPG’s global transformation strategy and the integration of its acquisition of Sigma Coatings. The Company recorded a charge of $163 million for the cost of this restructuring. Other earnings increased by $13 million in 2009 due primarily to the impact of gains on non‐operating asset sales. Source: Annual Report, p. 17, Annual Report
89
Exhibit Twelve Bredero Shaw_________________________________________________________________________ Company Headquarters: Bredero Shaw 3838 N. Sam Houston Pkwy E. Suite 300, Houston, Texas 77032‐3400, USA Phone: (281) 886‐2350 Website: www.brederoshaw.com NAICS/ Industry Code: 332812, Metal Coating & Non‐Precious Engraving Company Profile: Bredero Shaw is a division of ShawCor Ltd., a growth‐oriented energy services company focused on technology‐based products for the energy industry. Bredero Shaw is the global leader in pipe coating solutions. They develop and manufacture pipe‐coating solutions for the oil, gas, and water industries. With more than 80 years of experience, the largest team of dedicated pipe coating professionals, the most extensive network of strategically located plants worldwide and with proven innovative coating technologies, the company has protected more pipelines in virtually every environment and operating condition than anyone in the industry. With a rich history of proven experience that dates back to the 1930s, the company is the preferred choice of major energy industry clients around the world. Over 400,000 km of pipelines around the world have been protected using Bredero Shaw technology and services. The company, skilled in developing solutions for its clients, has the largest team of experienced and dedicated pipe‐coating professionals in the industry. With the most extensive network of strategically located plants around the world, and with proven, innovative coating technologies, Bredero Shaw has coated more pipelines in more diverse geographical areas and climates than anyone in the industry. Source: Company website, www.brederoshaw.com Product Portfolio: 1. Anti Corrosion Coatings Bredero Shaw offers the widest range of anti‐corrosion coatings in the industry covering all operating conditions for both offshore and onshore construction. Anti‐corrosion coatings are applied under quality controlled factory conditions and with leading edge process technology. These coatings can be effectively used under concrete and thermal insulation. Products
• 3LPE: Three Layer Polyethylene Coating • 3LPP: Three Layer Polypropylene Coating • AE: Asphalt Enamel Pipeline Coating • FBE: Fusion Bonded Epoxy Powder Coating • Dual Layer FBE: Dual Fusion Bonded Epoxy Powder Coating • LAT‐FBE: Low Application Temperature Fusion Bonded Epoxy Powder Coating • HPCC: High Performance Composite Coating • HPCC SE: High Performance Composite Coating Side Extruded • PRITEC®: Multi‐Layer PE Coating
90
• Yellow Jacket®: High Density Two Layer Polyethylene Coating • YJ2K®: Three Layer Bonded PE Coating for Higher Temperatures
2. Protective and Weight Coatings
Protective and weight coating products are concrete based systems that provide mechanical protection for pipelines onshore and negative buoyancy for pipelines in offshore environments, tidal and swamp areas and river crossings.
These products also offer additional security to pipeline areas where backfill may damage the anti‐corrosion coatings and to pipelines in high traffic sea corridors. Products
• HeviCote®: Concrete Weight Coating • Compression Coat: Concrete Weight Coating • Rock Jacket: Wrap Applied Bendable Concrete Coating
3. Flow Assurance Coatings Bredero Shaw’s flow assurance products provide world‐class solutions for both onshore and offshore insulation. The offshore product lines consist of high efficiency thermal insulation systems with optimum thicknesses ensuring easy installation and flow assurance. The onshore products are designed to meet the high performance standards required for insulated pipelines. Products
• Insul‐8®:Moulded or Spray Applied PU Foam Insulation • Insul‐8® AG: Pre‐insulated pipe insulation system for above ground pipelines • Insul‐8® HT: Spray Applied Polyurethane Foam Insulation (High Temperatures) • Pipe‐in‐Pipe:PU Foam Insulated Pipe‐In‐Pipe • ThermoFlo®: Polyurethane Insulation Systems • Thermotite®: Polypropylene Insulation Systems • Thermotite® TDF: Subsea Thermal Insulation Systems • Thermotite® ULTRA™: Subsea Thermal Insulation Systems
4. Internal Coatings
Bredero Shaw’s internal coatings are used to increase flow efficiency for natural gas pipelines and other anti‐corrosion applications. Improved flow conditions may enable use of a smaller pipe or allow for lower compression requirements.
Additional benefits of using internal flow coatings include:
• Corrosion protection of the pipe during storage prior to installation • Improved pigging conditions • Faster drying times
91
• Enhanced conditions for visual inspection of the internal surface of the pipe walls Products
• SureFlo® CML: Centrifugally Applied Cement Mortar Lining • SureFlo® FBE: Internal FBE Lining • SureFlo® FEC: Thin Film Internal Epoxy Coating • SureFlo® SF: Solvent Free Thin Film Internal Epoxy Coating • WaterGuard™ LE: Solvent Free Epoxy Protective Lining • WaterGuard™ PU: Solvent Free Rigid Polyurethane Lining
Source: Company website products, http://www.brederoshaw.com/solutions/solutions.htm Annual Revenues: 2009 revenues for ShawCor totaled $1.183 billion with an annual net income equal to $131.45 million. Source: http://www.shawcor.com/investors/pdfs/FinancialSummary.pdf R&D Efforts: Bredero Shaw has developed over 40 leading pipe‐coating technologies designed to protect pipelines across all segments of the market. Proven technologies include innovative anti‐corrosion coatings, protective and weight coatings, thermal flow assurance coatings, internal coatings, custom coatings, field joints, support engineering and logistics services. The company has been instrumental in introducing innovative coatings for cold climates, rugged terrains, high operating temperatures, deep‐water environments and many other unique applications. With the most extensive Research and Development facilities located in Canada and Norway, and applied development resources at each plant, Bredero Shaw is the leader in the formulation and production of unique coating solutions. Through active participation with industry organizations such as NACE, ISO, CSA, IPLOCA, NAPCA and AWWA, Bredero Shaw proactively addresses key industry issues by initiating and implementing new standards, product solutions and technologies at their various R&D locations: Toronto, Canada, Calgary, Canada, and Orkanger, Norway.
• The company employs a dedicated Research and Development team with over 50 engineers and scientists on staff.
• Bredero Shaw is the world’s most innovative pipe coating company with over 100 patents covering new products and process technology. Examples include the High Performance Composite Coating system (HPCC), and Thermotite® polypropylene flow assurance technology.
• The company has state‐of‐the‐art Research and Development facilities located on two continents.
• Bredero Shaw has a dedicated team of design and testing specialists to determine the best coating solution for any given application. Examples include thickness determination for
92
protective coatings and thermal analysis for flow assurance products. Various proposed coatings can also be quickly qualified for specific pipeline operating conditions.
Source: Company website, Technology Evaluation of Strategic Initiatives: Bredero has complex strategic initiatives. ShawCor’s Simulated Service Vessel (SSV) is a key part of a state of the art facility designed to simulate deep‐water service conditions for insulated pipe, flexible pipe and custom coated subsea structures. Bredero Shaw will use this vessel to simulate service conditions experienced by subsea insulation coatings by controlling the water temperature and applying pressure to the water surrounding the insulation coatings while controlling the temperature inside the pipe. By simulating these service conditions within the test vessel and measuring the heat flow and compressive creep of the insulating material, Bredero Shaw is able to advise the pipeline design engineer of both the thermal efficiency and depth rating of the insulation. Source: Company website, Simulated Service Vessel
93
Exhibit Thirteen E.I. du Pont de Nemours & Company______________________________________________________ Company Headquarters: 1007 Market Street, Wilmington, DE 19898 United States Phone: (302) 774‐1000 Website: www.dupont.com NAICS/ Industry Code: 325 Company Profile: E. I. du Pont de Nemours and Company (DuPont), incorporated in 1915, offers a range of products and services for markets, including agriculture, food, building, construction, electronics, communications, general industrial and transportation. The Company’s segments include Agriculture & Nutrition, Electronics & Communications, Performance Chemicals, Performance Coatings, Performance Materials, Safety & Protection, and Pharmaceuticals. The Company includes certain embryonic businesses, such as Applied BioSciences and non‐aligned businesses in Other. DuPont has operations in approximately 80 countries worldwide and its subsidiaries and affiliates conduct manufacturing, seed production or selling activities, and some are distributors of products manufactured by the Company.
Performance Chemicals
Performance Chemicals businesses offers solutions with a range of industrial and specialty chemical products for markets, including plastics and coatings, textiles, mining, pulp and paper, water treatment and healthcare. DuPont Titanium Technologies is the manufacturer of titanium dioxide. The businesses principal products include its line of DuPont Ti‐Pure titanium dioxide products, and Starblast abrasives. DuPont Chemicals and Fluoroproducts is a manufacturer of industrial and specialty fluorochemicals, fluoropolymers and performance chemicals. The businesses line of products that include refrigerants, lubricants, propellants, solvents, fire extinguishants and electronic gases, cover a range of industries and markets. Principal brands include DuPont Teflon, Dymel, Isceon, Suva, Vertrel, Zyron, Vazo and Virkon.
Performance Materials
Performance Materials businesses provide performance polymers, elastomers, films, parts, and systems and solutions. The markets served by the segment include the automotive original equipment manufacturer (OEM) and associated after‐market industries, as well as electrical, electronics, packaging, construction, oil, photovoltaics, aerospace, chemical processing and consumer durable goods. Performance Polymers offers a range of polymer‐based materials in its product portfolio, including elastomers and thermoplastic and thermoset engineering polymers, which are used by customers to fabricate components for mechanical, chemical and electrical systems. The principal products include DuPont Zytel nylon resins, Delrin acetal resins, Hytrel polyester thermoplastic elastomer resins, Tynex filaments, Vespel parts and shapes, Vamac ethylene acrylic elastomer, Kalrez perfluoroelastomer and Viton fluoroelastomers. Performance Polymers also includes the DuPont Teijin Films joint venture, whose primary products include Mylar and Melinex polyester films. Packaging & Industrial Polymers specializes in resins and films used in packaging and industrial polymer applications, sealants and adhesives, sporting goods, and interlayers for laminated safety glass. Its principal brands include DuPont
94

Surlyn ionomer resins, Bynel coextrudable adhesive resins, Elvax EVA resins, SentryGlas and Butacite laminate interlayers.
Source: Reuters, Reuter's Description Product Portfolio: The coatings and color technologies segment provides a wide range of products, including liquid and powder coatings for original equipment manufacturers (OEM), the automotive aftermarket (refinish), and general industrial applications. These include coatings for heavy equipment, pipes, and appliances and electrical insulation. The segment markets its refinish products under the DuPont, Standox, Spies Hecker, and Nason brands. In addition, a broad line of DuPont Ti‐Pure titanium dioxide products in both slurry and powder form serve the coatings, plastic, and paper industries. Additionally, the segment's specialty products include adhesive‐bonding and electrical insulation products. Dupont has several different types of performance coatings.
8. Water Base 9. Alkyd 10. Epoxies 11. Polyurethanes 12. Zinc 13. High Temperatures 14. Premex Products
The Epoxy product line is most significant to the piping industry. The portfolio consists of the following:
• CORLO ® 823 IN. • CORLO ® AE 823. • 99P200 CORLO ® CLEAR • DUPONT ® 25P EPOXIMASTIC ® HIGH SOLIDS.
DUPONT ® 25P. • CORLO ® AE 823. • DUPONT ® 25P EPOXIMASTIC ® HIGH SOLIDS. • CORLO ® PLUS 24P 100%. • Corlar ® 825. • COAL TAR CORLO ®
Source: Company website, Product Line Annual Revenues: E. I. duPont de Nemours & Company generated revenues of $31,836 million in the financial year ended December 2008, an increase of 8.4% compared to the previous year. The company's net income totaled $2,007 million in fiscal 2008, a decrease of 32.8% compared with 2007. For the fiscal year ended December 2008, 36% of sales were generated within the
95
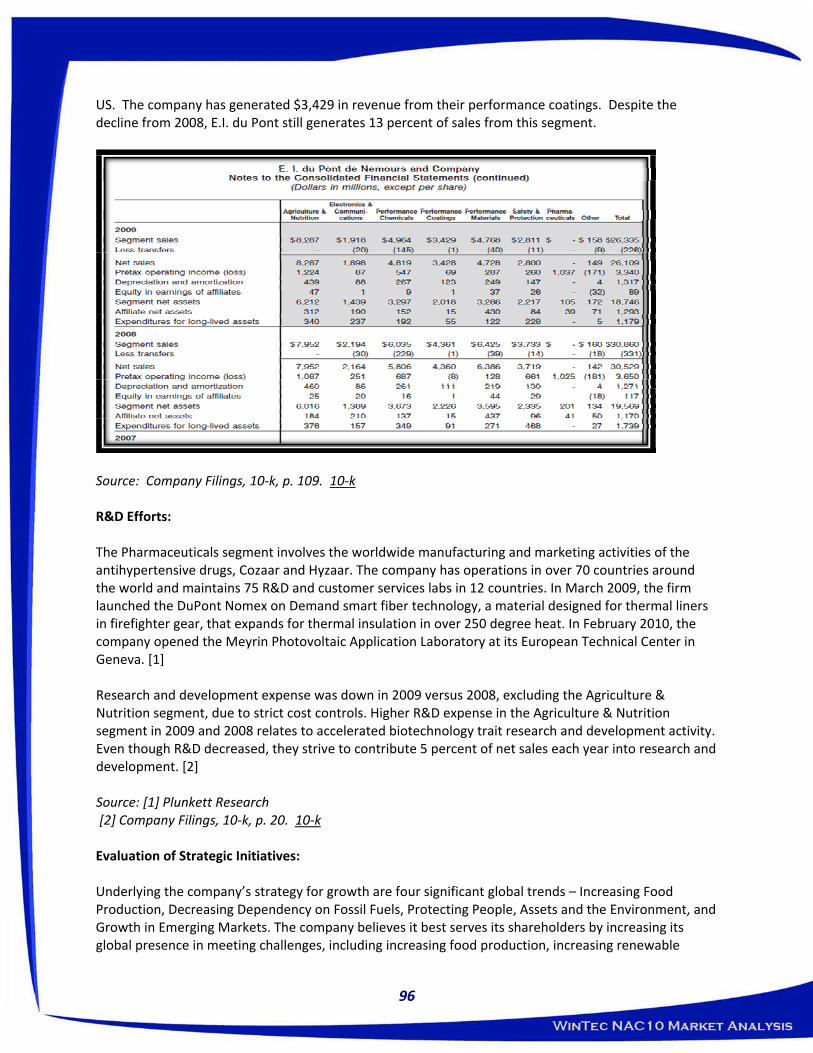
US. The company has generated $3,429 in revenue from their performance coatings. Despite the decline from 2008, E.I. du Pont still generates 13 percent of sales from this segment.
Source: Company Filings, 10‐k, p. 109. 10‐k R&D Efforts: The Pharmaceuticals segment involves the worldwide manufacturing and marketing activities of the antihypertensive drugs, Cozaar and Hyzaar. The company has operations in over 70 countries around the world and maintains 75 R&D and customer services labs in 12 countries. In March 2009, the firm launched the DuPont Nomex on Demand smart fiber technology, a material designed for thermal liners in firefighter gear, that expands for thermal insulation in over 250 degree heat. In February 2010, the company opened the Meyrin Photovoltaic Application Laboratory at its European Technical Center in Geneva. [1] Research and development expense was down in 2009 versus 2008, excluding the Agriculture & Nutrition segment, due to strict cost controls. Higher R&D expense in the Agriculture & Nutrition segment in 2009 and 2008 relates to accelerated biotechnology trait research and development activity. Even though R&D decreased, they strive to contribute 5 percent of net sales each year into research and development. [2] Source: [1] Plunkett Research [2] Company Filings, 10‐k, p. 20. 10‐k Evaluation of Strategic Initiatives: Underlying the company’s strategy for growth are four significant global trends – Increasing Food Production, Decreasing Dependency on Fossil Fuels, Protecting People, Assets and the Environment, and Growth in Emerging Markets. The company believes it best serves its shareholders by increasing its global presence in meeting challenges, including increasing food production, increasing renewable
96

sources for energy and raw materials, and providing greater safety and protection for life, assets, and the environment. The company has differentiated targets for growth in these strategic areas including future funding of capital expenditures, research and development, and marketing programs. By aggressively pursuing top line growth opportunities in key markets and improving productivity, the company met or surpassed its 2009 financial goals for earnings per share, cash flow, and working capital reductions. The company announced a three‐year 2010‐2012 plan which includes $1 billion fixed cost productivity actions, $1 billion working capital productivity programs, and compound annual growth targets of 10 percent for sales and 20 percent for earnings per share through 2012. Sales in emerging markets, which include China, India, and the countries located in Latin America, Eastern and Central Europe, Middle East, Africa, and Southeast Asia, are targeted to grow at a 14 percent compound annual rate from 2009 to 2012. The company has reaffirmed its commitment to maintain a strong balance sheet and to return excess cash to shareholders unless there is a compelling opportunity to invest for growth. The year 2009 was one of considerable economic change, transitioning from predominantly depressed conditions and inventory destocking in most markets during the first half of the year to resumption of growth for most businesses and markets in the latter half. Of particular importance to the company are motor vehicle and construction related markets which, while gradually improving, remained depressed for most of the year. Reflecting these conditions, the company’s full year sales volume dropped 12 percent versus 2008, and selling prices remained under pressure, principally for chemical and certain polymer products. The global recessionary economic conditions along with productivity and cost reduction programs contributed to a 7 percent reduction in the company’s combined costs for raw materials, energy and transportation. Depressed equity market values resulted in higher non‐cash pension costs, versus 2008. While financial and credit market conditions were challenging, the company continued to access the short and long‐term debt markets without difficulty. Source: Company Filings, 10‐k
97

Exhibit Fourteen The Dow Chemical Company_____________________________________________________________ Company Headquarters: 2030 Dow Center, Midland, MI 48674 United States Phone: (989) 636‐1000 Website: www.dow.com NAICS/ Industry Code: 325 Company Profile: The Dow Chemical Company (Dow), incorporated in 1947, is engaged in the manufacture and sale of chemicals, plastic materials, agricultural and services, and other specialized products and services. It delivers a range of products and services to customers in approximately 160 countries to growth sectors such as electronics, water, energy, coatings and agriculture. The Company operated 214 manufacturing sites in 37 countries. Dow operates in eight business segments: Electronic and Specialty materials, Coatings and Infrastructure, Health and Agricultural sciences, Performance systems, Performance products, Basic plastics, Basic chemicals, and Hydrocarbons and Energy. The Company is also engaged in the property and casualty insurance and reinsurance business primarily through its Liana Limited subsidiaries. In May 2010, OMNOVA Solutions Inc. acquired The Dow Chemical Company's hollow sphere plastic pigment (HPP) product line and terminated the RohmNova paper coatings joint venture. In June 2010, the Company sold of its interest in Styron plastics division to Bain Capital Partners.
In January 2009, the Company announced that its thermoplastic polyurethane (TPU) business was acquired by Lubrizol Corporation. In April 2009, the Company completed the acquisition of Rohm and Haas Company. In September 2009, the Company completed the sale of its interests in Total Raffinaderij Nederland N.V. to Total S.A. In September 2009, Union Carbide Corporation, a wholly owned subsidiary of Dow, announced that it has completed the divestiture of its ownership in the OPTIMAL Group of Companies to Petroliam Nasional Berhad. In November 2009, Dow Corning, equally owned by the Company and Corning, Incorporated, announced that it acquired 100% interest in Globe Metais Industria e Comercio S.A., a silicon metal manufacturer in Para, Brazil, and a 49% interest in Globe Metallurgical Inc.’s silicon manufacturing operation in Alloy, West Virginia (United States), WVA Manufacturing LLC. In January 2010, the Company completed the sale of its acrylic acid and esters business, and its UCAR Emulsion Systems specialty latex business to Arkema SA. In October 2009, the Company completed the divestiture of its interest in Morton International, Inc. to K+S Aktiengesellschaft.
Coatings and Infrastructure
Adhesives and Functional Polymers is a portfolio of businesses that primarily manufacture sticking and bonding solutions for a range of applications, including adhesive tapes and paper labels, flexible packaging and leather, textile and imaging. The products include ADCOTE and AQUA‐LAM laminating adhesives; MOR‐FREE solventless adhesives; ROBOND acrylic adhesives; SERFENE barrier coatings; Solvent‐based polyurethanes and polyesters and TYMOR tie resins.
98

Dow Building and Construction is comprised of two global businesses ‐ Dow Building Solutions and Dow Construction Chemicals, which offers lines of industry insulation, housewrap, sealant and adhesive products and systems, as well as construction chemical solutions. The Dow Building and Construction products include AQUASET acrylic thermosetting resins; CELLOSIZE hydroxyethyl cellulose; FROTH‐PAK polyurethane spray foam; GREAT STUFF polyurethane foam sealant; INSTA‐STIK roof insulation adhesive; POWERHOUSE solar shingle; RHOPLEX aqueous acrylic polymer emulsions; STYROFOAM brand insulation products (including extruded polystyrene and polyisocyanurate rigid foam sheathing products); THERMAX insulation; TILE BOND roof tile adhesive, and WEATHERMATE weather barrier solutions (housewraps, sill pans, flashings and tapes).
Dow Coating Materials is in the business of supplying coatings and raw materials for architectural paints and industrial coatings. The business also offers technologies used in industrial coatings, including packaging, pipelines, wood, automotive, marine, maintenance and protective industries. Dow Coating Materials products include ACRYSOL rheology modifiers; AVANSE, ELASTENE, PRIMAL and RHOPLEX acrylics; CELLOSOLVE and the CARBITOL and DOWANOL series of oxygenated solvents; D.E.H. curing agent and intermediates; D.E.R. and D.E.N. liquid and epoxy resins; FORTEGRA Epoxy Tougheners; OROTAN and TAMOL dispersants; ROPAQUE opaque polymers; TRITON, TERGITOL, DOWFAX and ECOSURF SA surfactants.
Source: Reuters, Reuter's Description Product Portfolio: Dow has a product portfolio consisting of coatings targeting the industrial industry.
1. Epoxy 2. Cement 3. Metal 4. Plastic 5. Roads 6. Roofs 7. Specialty Applications 8. Industrial Maintenance
Their new lines of industrial coatings are listed;
1. AVANSE™ MV‐100 This high‐performance, low VOC binder technology is used in a variety of industrial maintenance applications, offering a more environmentally‐advanced option. This product provides excellent adhesion, durability and corrosion resistance, as well as the potential for formulated cost savings and reduced supply chain complexity.
2. MAINCOTE™ EC‐11 This highly versatile, 100% acrylic resin offers exceptional performance in elastomeric coatings for industrial maintenance applications. Designed primarily for metal and cementitious substrates, this binder enables coatings to have excellent corrosion and water resistance, superior adhesion, and outstanding flexibility and impact resistance, even at low temperatures. In addition, this technology is APEO surfactant‐free and allows for low VOC formulations.
99

3. MAINCOTE™ AU‐28 An excellent acrylic polyol for two‐component, water‐based polyurethane coatings. Useful in high performance and low VOC industrial coatings, this hydroxyl‐functional polymer provides clear and pigmented topcoats with high gloss and excellent durability.
4. MAINCOTE™ HG‐31 As a highly versatile, water‐based acrylic resin for water‐resistant industrial coatings used on masonry and steel substrates, this product displays excellent performance in primers and direct‐to‐metal (DTM) finishes. Its outstanding performance properties include excellent corrosion resistance and adhesion, as well as superior water whitening (blushing) resistance in clear coatings.
5. RoShield™ 636This new, very hard, styrene‐acrylic emulsion that offers one‐component, self‐crosslinking technology in a low formaldehyde/formaldehyde‐free environment, and is used in finishes for kitchen cabinets, moldings and other interior board applications. For complete list of products, follow the link provided. Source: Company website, http://www.dow.com/products/industrial/industrial_coatings/landing.page?industry=1000612&application=1120605 Annual Revenues:
Source: Annual Report, p. 181. http://www.dow.com/financial/pdfs/161‐00479.pdf
100
R&D Efforts: Dow is reinventing itself into an agile scientific innovator with the capability to solve major global issues. Fueling this transformation is our innovation engine. In 2009, we invested a record $1.6 billion1 in R&D – more than the combined physical sciences R&D budgets of the top 25 ranked U.S. universities. Our continued investments are paying off: during the last three years, we have nearly tripled our pipeline valuation – to $28 billion – by making targeted investments in higher‐value, higher‐margin products and businesses. At the same time, we have implemented a rigorous, cross‐company system of portfolio management to ensure every research dollar is spent on the highest valueadding opportunities. By consistently investing in world‐class resources and people, our innovation engine sets the stage for delivering long‐term value to our stockholders while addressing the evolving needs of our planet. Source: Annual Report p. 7 Evaluation of Strategic Initiatives: The firm's long‐term strategy is to move away from commodity chemicals, which do not earn large profit margins, and focus on specialty chemicals. During 2009, in line with this strategy, it announced the shutdown of styrene monomer and ethylbenzene production units in Freeport, Texas. In April 2009, the firm acquired chemicals giant Rohm & Haas for $15 billion. Following this acquisition, the company announced a restructuring plan that includes the elimination of 2,500 employees. Other activities during 2009 included the divestiture of Morton International, Inc.; the divestiture of its stake in the OPTIMAL Group of Companies; and the formation of biotechnology company Pfenex, Inc. In early 2010, Dow sold its acrylic acid and esters business; and announced its investment in Clean Filtration Technologies, Inc. In June 2010, the company sold Dow Haltermann Custom Processing; and divested its Styron division. Source: Plunkett Research Today’s Dow has a renewed focus on higher‐margin, higher‐growth businesses where technology is the key differentiator. Underpinning transformation is their immense R&D pipeline, which is fueling organic growth across the value chain. The combined R&D capabilities of Dow and Rohm and Haas have resulted in a unique, science‐based and customer‐driven powerhouse. The top long‐term growth synergy opportunities have a combined revenue potential of more than $4 billion. Source: Company filings. 19, Annual Report.
101

Exhibit Fifteen Sherwin‐Williams______________________________________________________________________ Company Headquarters: 101 Prospect Ave. N.W., Cleveland, OH 44115‐1075, US Phone: 216‐566‐2200 Website: www.sherwin‐williams.com NAICS/ Industry Code: 444120 Company Profile: The Sherwin‐Williams Company (Sherwin‐Williams), incorporated in 1884, is engaged in the development, manufacture, distribution and sale of paint, coatings and related products to professional, industrial, commercial and retail customers primarily in North and South America, with additional operations in the Caribbean region, Europe and Asia. The Company’s segments include Paint Stores Group, Consumer Group and Global Finishes Group. In February 2009, the Company acquired Altax Sp. zo.o.
Paint Stores Group
The Paint Stores Group consisted of 3,354 Company‐operated specialty paint stores in the United States, Canada, Puerto Rico, Virgin Islands, Trinidad and Tobago, St. Maarten and Jamaica as of December 31, 2009. Each store in this segment is engaged in the related business activity of selling paint, coatings and related products to customers. The Paint Stores Group markets and sells Sherwin‐Williams branded architectural paint and coatings, industrial and marine products, original equipment manufacturer (OEM) product finishes and related items. These products are produced by manufacturing facilities in the Consumer and Global Finishes Groups. In addition, each store sells purchased associated products. During the year ended December 31, 2009, this segment opened eight net new stores, consisting of 53 new stores opened (44 in the United States, seven in Canada, one in Jamaica and one in St. Maarten) and 45 stores closed (in the United States).
Consumer Group
The Consumer Group develops, manufactures and distributes a variety of paint, coatings and related products to third party customers primarily in the United States and Canada and the Paint Stores Group. Approximately 51% of the total sales of the Consumer Group in 2009, including inter‐segment transfers, represented products sold through the Paint Stores Group.
Global Finishes Group
The Global Finishes Group develops, licenses, manufactures, distributes and sells a variety of architectural paint and coatings, industrial and marine products, automotive finishes and refinish products, OEM coatings and related products in North and South America, Europe and Asia. Sherwin‐Williams and other brand products are distributed, through the Paint Stores Group and this segment’s 539 company‐operated branches and by a direct sales staff and outside sales representatives to retailers, dealers, jobbers, licensees and other third party distributors. During 2009, this segment opened 18 new branches (eight in the United States, one in Canada, six in South America and three in India) and closed 20 (one in South America, 15 in the United States and four in Mexico). As of December 31, 2009, the Global Finishes Group consisted of operations in the United States, subsidiaries in 14 foreign countries, four foreign joint ventures and income from licensing agreements in 16 foreign countries. Source: Reuter, http://www.reuters.com/finance/stocks/companyProfile?rpc=66&symbol=SHW
102
Product Portfolio: Sherwin‐Williams is the world leader in protective and marine coatings. They provide advanced solutions and reliable technical service for every market served. They provide coatings for the following industries.
• Bridge & Highway • Food & Beverage • Healthcare • Marine • PetroChem/Offshore • Power Generation • Pulp & Paper • Rail • Steel Fabrication • Water
Their portfolio consists of the following products for the bridge and highway industry:
1. Structural Steel Coatings Sherwin‐Williams offers the most comprehensive line of coatings for steel protection, including zincs, epoxies, urethanes, polyaspartics and polysiloxanes.
2. Concrete Coatings and Stains For maximum protection for your structural concrete, sound walls, or concrete barriers, Sherwin‐Williams offers a complete line of concrete coatings, sealers, stains, silanes, siloxanes, and textured coatings for maximum protection and performance
3. Anti‐Graffiti Coatings To protect your concrete or steel structures from graffiti, Sherwin‐Williams offers a variety of sacrificial and non‐sacrificial products to prevent graffiti from damaging your existing coating system. Anti‐Graffiti Brochure
Source: Company website, http://protective.sherwin‐williams.com/industries/index.jsp Annual Revenues:
103

The Sherwin‐Williams Company generated revenues of $7,980 million in the financial year ended December 2008, a decrease of 0.3% compared to the previous year. The company's net income totaled $476.9 million in fiscal 2008, a decrease of 22.5% compared with 2007. At the end of the fiscal year December 2008, the paints stores group had taken revenues of $647.9 million whilst, the consumer group and global finishes group took revenues of $140.2 million and $152.2 million respectively. Total revenue generated for financial year ended December 2009 was $7,094 million.
Source: Datamonitor, pg 20 and Annual Report p. 76 R&D Efforts: Across all divisions in 2009, Sherwin‐Williams recruited 530 high caliber people into our respected Management Training Program and invested more than $100 million in research, development and commercialization of new product technologies. They are confident these investments will benefit the company in the near term and deliver appropriate returns in the long term. To support the supply of quality product finishes to manufacturers and finishers of furniture, electronics, heavy equipment, wood, composite and metal building products in Asia, the Global Finishes Group completed construction of a new 215,000 square foot factory manufacturing plant in Zhaoqing in South China in 2009, and announced plans to build a new blending facility in Langfang in North China to open in June 2010. We now operate five coatings plants and six blending facilities in China, Malaysia, Vietnam, the Philippines and Singapore, and research and development centers in China, Vietnam and Malaysia. Source: Company filings, Annual report 2009 p. 2 and 7, http://investors.sherwin‐williams.com/annual‐reports/index.jsp Evaluation of Strategic Initiatives: Sherwin‐ Williams is looking to generate more revenue from the international markets. Columbia was acquired to contribute to the Company’s domestic controlled‐distribution growth strategy. VHT, included in the Consumer Group, is the market leader in High Temperature coatings and premium aerosol products. VHT was acquired to broaden the product offering in Consumer Group and add to its growth strategy. Napko, included in the Global Finishes Group, is a leading manufacturer and distributor
104
of industrial maintenance coatings primarily for the government oil and power industries in Mexico primarily through company‐operated branches. PISA, also included in the Global Finishes Group, provides industrial paint products in Uruguay to the wood protection and industrial maintenance market. Napko and PISA were acquired to support and broaden the Company’s international growth strategy. Another company acquired was MAB. MAB services the professional painting contractor, builder and do‐it‐yourself markets through its own company‐operated stores. MAB was acquired as part of the Company’s domestic controlled‐distribution growth strategy. Nitco, included in the Global Finishes Group, is a leading manufacturer and distributor, especially in western India, of exterior paints and coatings used in the construction of office buildings, high rise apartments, shopping malls, hospitals and schools. Nitco was acquired to support the Company’s growth strategy into new international markets. Source: Annual Report, 2009, p 50. http://investors.sherwin‐williams.com/annual‐reports/index.jsp
105

Exhibit Sixteen The Valspar Corporation________________________________________________________________ Company Headquarters: 1101 Third St. S., Minneapolis, MN 55415, US Phone: 612‐851‐7000 Website: www.valsparglobal.com NAICS/ Industry Code: 325510 Company Profile:
The Valspar Corporation is a coating and paints manufacturer and distributor. It manufactures and distributes a portfolio of coatings, paints and related products. The Company operates its business in two reportable segments: Coatings and Paints. Coatings segment includes a range of decorative and protective coatings for metal, wood and plastic, primarily for sale to original equipment manufacturing (OEM) customers. Products within its Coatings segment include primers, top coats, varnishes, inks, sprays, stains, fillers and other coatings used by customers in a range of manufacturing industries, including building products, appliances, furniture, transportation, agricultural and construction equipment, metal packaging and metal fabrication. It also manufactures and sells specialty polymers, colorants and gelcoats, and sells furniture protection plans under the Guardsman brand. The specialty polymers and colorants are manufactured for internal use and for external sale to other coatings manufacturers. Its gelcoats and related products are sold to boat manufacturers, shower and tub manufacturers and others.
The Company utilizes a variety of coatings technologies to meet its customers’ coatings requirements, including electrodeposition, powder, solvent‐based, waterborne and ultra violet (UV) light‐cured coatings. This segment includes the packaging product line and three industrial product lines: coil, general industrial and wood. Its packaging product line includes coatings for the interior and exterior of metal packaging containers, principally food containers and beverage cans. It also produces coatings for aerosol and paint cans, crowns for glass bottles, plastic packaging and bottle closures. The Company’s coil product line includes coatings that are applied to metal coils used to manufacture pre‐engineered buildings and building components, other metal building and architectural products and appliances. It also supplies coil coatings in Asia, South America and Northern and Eastern Europe.
The Company’s general industrial product line provides customers a variety of industries with a single source for powder, liquid and electrodeposition coatings technologies. It has customers support in Europe, Central and South America and Asia. Its wood product line includes decorative and protective coatings for wood furniture, building products, cabinets and floors. The Company has color design, manufacturing and technical service capabilities in the United States and Asia.
106
Its Paints segment includes a variety of products, such as paints, primers, topcoats and aerosol spray paints sold primarily through retailers and distribution networks. It sells branded and other products in the paints segment, including Valspar, Cabot, Huarun, DeBeer and House of Kolor. In the architectural product line, the Company offers a portfolio of interior and exterior paints, stains, primers, varnishes, floor paints and specialty decorative products. It sells these products primarily into the do‐it‐yourself and professional markets through home centers, mass merchants, hardware wholesalers and independent dealers.
The Company’s automotive product line includes refinish paints and aerosol spray paints that are sold through automotive refinish distributors, body shops, automotive supply distributors and automotive supply retailers. It’s Valspar, De Beer and House of Kolor brands are offered in many countries around the world. In addition to the main product lines, the Company manufactures and sells specialty polymers, gelcoats and colorants, and sells furniture protection plans under the Guardsman brand. Its gelcoats and related products are sold to boat manufacturers, shower and tub manufacturers and others.
Source: Reuters, http://www.reuters.com/finance/stocks/companyProfile?rpc=66&symbol=VAL
Product Portfolio: Valspar offers a diverse array of products, which makes them one of the most complete suppliers anywhere, and the sixth largest paint and coatings company in the world. They operate in the following business areas.
• Consumer
• High Performance Architectural Coatings
• Packaging Coatings
• Wood Coatings
• Industrial Coatings
• Automotive Coatings
• Kustom Finishes
• Coating Intermediates
The industrial coatings segment offers a wide array of products most relevant to the oil and gaseline segment.
Their featured product is the Valspar Pipeclad® corrosion‐protection products, which are the choice coating of major petroleum and gas producers around the world and have provided long‐term protection for over 100,000 miles of pipelines, ranging in diameter from 2" to 48". FBE coating
107
The unique chemical characteristics for their coatings are carefully engineered to provide superior adhesion to the substrate, which creates excellent cathodic‐disbondment resistance in a wide range of environments.
The physical properties of Valspar coatings minimize damage during transit, installation and operation and protect against all the corrosive elements associated with underground or underwater use. Source: Company website for industrial coatings, http://www.valsparindustrial.com/ Annual Revenues: Net sales for the year fell 17.3 percent to $2.879 billion, reflecting the impact of the global recession. Sales in our Paints segment declined 4.9 percent. Our North America architectural product line posted increased sales for the year, while the overall paint market declined more than 10 percent. Coatings segment sales were down 22.9 percent. The performance of our global packaging product line helped to mitigate the impact of lower revenues in our industrial product lines. Net income in 2009 totaled $160.2 million, up $9.4 million from $150.8 million in 2008. Adjusted earnings per share excluding certain items increased to $1.77 in 2009, up 12.7 percent from $1.57 in 2008. Results benefitted from an improved costprice ratio, higher efficiency in our operations from restructuring and productivity actions, and good control of expenses. During the year, we reduced our total debt by $42 million and generated $220 million in free cash flow (net operating cash flow less capital spending and dividends), an improvement of $54 million from 2008. The Board of Directors raised the quarterly dividend for fiscal 2010 by 7 percent to $0.16 a share. Our reserve liquidity at year end was $608 million, with $420 million available through committed bank credit facilities and $188 million in cash, up from $430 million of reserve liquidity at the end of 2008. Source: Company Filings, Annual report 2009, p. 4. http://phx.corporate‐ir.net/External.File?item=UGFyZW50SUQ9MzY0MTQwfENoaWxkSUQ9MzU4NDIwfFR5cGU9MQ==&t=1 R&D Efforts: Their product and application technology is supported by underlying chemistry that has not changed over time. Ongoing research and development efforts include reviewing our propriety technology, including the technology we have acquired through our acquisitions, and making formulation changes to improve products. This has resulted in several successful product improvements. For example, they have recently commercialized a new coil coating product with improved hardness, adhesion and flexibility. In the architectural line, Valspar has introduced an improved concrete coating. In the wood line, they have commercialized a waterborne ultraviolet energy cured product line. Moreover, they have continued to expand the line of polymers and now have a full portfolio of both water‐based and conventional polymers for architectural, industrial and packaging products. Research and development costs for fiscal 2009 were $91.3 million or 3.2% of net sales, compared to $96.6 million or 2.8% of net sales for fiscal 2008 and $90.3 million or 2.8% of net sales for fiscal 2007. The primary emphasis has been on developing and refining emerging technologies in our Coatings segment.
108

Source: Company Filings, Annual report 2009, p. 13. http://phx.corporate‐ir.net/External.File?item=UGFyZW50SUQ9MzY0MTQwfENoaWxkSUQ9MzU4NDIwfFR5cGU9MQ==&t=1 Evaluation of Strategic Initiatives: Their strength is focused on long‐term strategy – building their brands, developing leading‐edge technologies and expanding global presence, which was evident in 2009. Higher awareness of the Valspar brand in the United States resulted in increased share and significantly outperformed the overall market for consumer paint. Acquisitions have historically contributed significantly to the growth of our company. As part of our growth strategy, we intend to continue to pursue acquisitions of complementary businesses and products. If we are successful in completing such acquisitions, we may experience Source: Company Filings, Annual report 2009, p. 15. http://phx.corporate‐ir.net/External.File?item=UGFyZW50SUQ9MzY0MTQwfENoaWxkSUQ9MzU4NDIwfFR5cGU9MQ==&t=1
109

Exhibit Seventeen Akzo Nobel N.V. _______________________________________________________________________ Company Headquarters: Strawinskylaan 2555, Amsterdam, The Netherlands Phone: 31‐20‐502‐7555 Website: www.akzonobel.com NAICS/ Industry Code: 325 Company Profile: Akzo Nobel is engaged in the production of paints, coatings and specialty chemicals and the supply of specialty chemicals worldwide. The company operates in over 80 countries worldwide spanning the Americas, Europe, Asia, and Latin America. It is headquartered in Amsterdam, the Netherlands and employs about 61,300 people. Akzo Nobel operates through three business segments: specialty chemicals, decorative paints, and performance coatings. The specialty chemicals segment operates through six businesses: pulp and paper chemicals, industrial chemicals, functional chemicals, surface chemistry, polymer chemicals, and chemicals Pakistan. The pulp and paper chemicals business supplies specialty chemicals to the polymer production and processing industries. It is traded under the name Eka Chemicals. The business produces bleaching chemicals for manufacturing paper pulp. The business also manufactures sodium chlorate, hydrogen peroxide, and other products such as wet strength agents, dry strength agents and coating additives. Through its industrial chemicals business, Akzo Nobel is engaged in the production of including salt and energy, chlor‐alkali products, and derivatives such as monochloracetic acid (MCA). The segment also supplies vacuum salt, and chlorine, caustic lye, and MCA used in the chemical, detergent, construction, food, pulp and paper, and plastic industries. The functional chemicals business manufactures and sells a variety of chemical intermediates and performance chemicals worldwide. It supplies ethylene amines, chelates, cellulosic specialties, sulfur products, and polysulfides worldwide and salt specialties in Europe. It also supplies redispersible powder polymers made for construction applications such as cement and repair mortars, adhesives, floor coatings, and waterproofing systems. The surface chemistry business produces surface‐active agents for a wide variety of applications. Its specialty surfactants and surfactant intermediates are used by industrial and consumer product companies. Through polymer chemicals business, Akzo Nobel produces organic peroxides, metal alkyls, and co‐catalysts. The business also manufactures high purity metalorganics, chemicals used in consumer electronics such as LEDs (light emitting diodes) for lighting, and for lasers inside compact disc (CD) and digital video disc (DVD) players. Through, the chemicals Pakistan business, the company exclusively market its specialty chemicals, polyester fibers, and soda ash in Pakistan. These products are supplied to various industries including, consumer goods, electronics and engineering products, food and beverages, pharmaceuticals, and textiles.
110
The decorative paints segment, which was set up in January 2008 following the acquisition of Imperial Chemical Industries (ICI), is engaged in the production of decorative paints and specialty products. ICI products include specialty polymers for personal care products, adhesives for the electronics and packaging markets, as well as a wide range of decorative coatings and specialty products for domestic use and the construction industry. It also manufactures paints, lacquers and varnishes, and floor leveling compounds. It offers brands like Sikkens, Dulux, and Hammerite. The decorative paints business consists of seven business units in three regions which include decorative paints Europe, decorative paints America, and decorative paints Asia. The performance coatings segment operates through five businesses; car refinishes, marine and protective coatings, powder coatings, industrial finishes, and packaging coatings. Akzo Nobel's car refinishes business supplies paints and services for the car repair, commercial vehicles, and automotive plastics markets. The business sells coatings for car body refinishing, or recoating, to customers including bodyshops, distributors, fleet owners, automotive suppliers, and major bus and truck producers. The business operates in approximately 60 countries under the brands Sikkens, Lesonal, Dynacoat, Wanda, and Autocoat BT. The marine and protective coatings business produces marine paints and antifouling coatings used in shipbuilding, ship maintenance, and repair, and also by yacht and other pleasure craft owners. The business, which markets its products through the International brand name, manufactures fire retardant products for large plants and offshore installations, and protective coatings for structures such as bridges, stadia, and landmarks. Through Akzo Nobel Aerospace Coatings, the company manufactures paint coatings, serving the commercial, general aviation, and military markets. The powder coatings business manufactures powder coatings for eight key market sectors under the global brands Interpon and Resicoat. The market sectors served by the business are appliance, architectural, automotive, functional, furniture, general industry, general trade coaters, and information technology (IT) sector. The business also supplies non‐stick coatings for houseware and other specialist industrial applications. The industrial finishes business develops, manufactures, and markets factory applied wood, coil, and plastic coatings, and industrial wood adhesives. Coil coatings are applied to coiled steel and aluminum before manufacturing and are used in the metal building products market for roofing, siding, garage and entry doors, and gutters. Coil coatings also serve the HVAC (air conditioners, heaters, furnaces, and ventilation units) and appliance markets. The company supplies plastic coatings to the consumer electronics industry (for use on cell phones, music players, and computers) and cosmetic packaging and sporting equipment industries (for use on bicycles, helmets, and ski equipment). The wood adhesives business provides bonding solutions for laminated beams, wood flooring, furniture, and other wood applications. The packaging coatings business is involved in the supply of a comprehensive range of interior and exterior decoration and protection products for beverage can industry. These products are used to protect food and drinks cans, aerosols, and metal closures. Source: Datamonitor p 16 Product Portfolio:
111
Akzo provides products for the oil and gas pipeline industry are classified as systems:
1. System A A high durability (above 15 years) coating specification designed for environments classified by ISO 12944‐2 as C3 medium corrosivity.
2. System B
A high durability (above 15 years) coating specification designed for environments classified by ISO 12944‐2 as C5‐M very high corrosivity (Marine).
3. System C
A high durability (above 15 years) coating specification designed for environments classified by ISO 12944‐2 as C5‐M very high corrosivity (Marine).
4. System D A high durability (above 15 years) coating specification designed for environments classified by ISO 12944‐2 as C5‐M very high corrosivity (Marine).
Source: Company website, http://www.international‐pc.com/ourmarkets/oilandgas/Pages/OilandGas.aspx Annual Revenues: Akzo Nobel N.V. generated revenues of $22,556 million in the financial year ended December 2008, an increase of 50.9% compared to the previous year. The company reported a net loss of $1,589.1 million in fiscal 2008, compared to a net income of $13,697.5 million the previous year. The Americas generated 33% of the total annual revenues in 2008. The decorative paints segment of the company generated revenues of $7,424.5 million in 2008, whilst the performance coatings segment and specialty chemicals took revenues of $6,474.9 million and $8,246.9 million respectively. Source: Datamonitor p 17 R&D Efforts: AkzoNobel’s Research, Development and Innovation (RD&I) strategy is focused on creating bigger, bolder innovations to drive profitable growth. It’s about ensuring that we pioneer technologies with major potential and putting the right resources behind them. To do this, they are directing a greater proportion of expenditure towards major innovations. Specifically, they have identified the 50 largest innovation projects with the highest potential impact currently being carried out by their businesses. Major programs on water‐based decorative and protective coatings, next generation antifouling coatings, self‐healing coatings, low energy curing, delivery systems, biorenewable raw materials and advanced processing technologies all feature in this list of exciting developments.
112

Source: Company filings, Annual report, p 19. http://report.akzonobel.com/2009/servicepages/downloads/files/akzonobel_report09_entire.pdf Evaluation of Strategic Initiatives: Akzo has been steadily investing in building a global position, especially in high growth markets – notably China and Eastern Europe. This policy paid off in 2009 as the economies in these high growth markets bounced back faster than the rest of the world, which had a positive impact on their sales. Akzo maintained their strategy of focusing on defined market segments and developing segment‐specific value propositions which offer customers a complete service package rather than just a product. Their sites are also becoming more dedicated by concentrating on specific technologies and segments. This approach has been the foundation of our market share growth and has strengthened our ability to resist price pressure and maintain margins. Source: Company filings, Annual report, p 38 http://report.akzonobel.com/2009/servicepages/downloads/files/akzonobel_report09_entire.pdf
113

Exhibit Eighteen Overview of Fusion Bonded Epoxies: Fusion bonded epoxy (FBE) was introduced in Europe in 1953 for the coating of electrical equipment by the fluidized bed dipping method. In the early '60s it was introduced to the pipeline industry for the protection of small diameter water and oil field production piping. The first FBE for large diameter pipe was supplied in the mid‐sixties. By the late seventies, FBE became the most widely used pipeline coating in the U.S., Canada, Saudi Arabia and the U.K. Presently, FBE is used on every continent for the protection of line pipe, production tubing and drill pipe for the oil and gas industries. It has also gained acceptance for the protection of reinforcing steel (rebar) in the U.S., Canada, the U.K. and the Middle East Fusion‐bonded‐epoxy (FBE) powder coatings, first developed by 3M Co., are used worldwide where long‐term corrosion protection is critical such as on oil, gas and water pipelines. However, the performance requirements for FBEs are challenging because the hard, highly cross‐linked coatings are expected to survive demanding pipe manufacturing processes and installation conditions as well as field performance at elevated temperatures. It may be possible to improve the performance of FBE coatings for pipeline corrosion protection by increasing the toughness of the coating. Although FBE is extremely successful as a corrosion protection system for underground pipelines, there are some inherent limitations, which make it difficult to achieve total corrosion protection with coatings alone. Some of these limitations are due to the chemical nature of organic materials in the coating and some are related to coating application procedures. To overcome the deficiencies and achieve total corrosion protection, another alternative method, cathodic protection (CP), is used in conjunction with the coating. Presently, FBE with the CP system is the most effective and economical corrosion control system for underground pipelines, but the success depends on the coating's ability to become an integral part of the "CP coating" combination system. Epoxy resin‐based powder coatings have been the standard corrosion protection system for pipelines in the oil, gas and water industry for many years because of their outstanding adhesion, chemical resistance, temperature resistance, and corrosion protection. These coatings are factory applied on pipeline segments, and then the pipeline segments are transported to the field and welded in place. The welded joints are protected with a special field‐ applied powder coating process or with other systems such as liquid coatings or shrink‐wrap sleeves. These coatings are expected to last between 20 and 30 years without requiring a significant amount oil monitoring or repair. To achieve this level of durability, the coatings must be perfectly applied with literally no bare metal exposed to the environment. However, the coatings may be damaged during transportation or installation, especially when the pipe is installed in remote areas with difficult access or rocky terrain. To overcome this problem, a multi‐layer coating system was developed in the mid‐eighties, which involved adding a layer of high‐density polyethylene (HIDPE) or polypropylene over the epoxy coating.The enhancement of fusion‐bonded epoxies in the past decades clearly demonstrates the ability of this toughening technology to
114
dramatically enhance the flexibility and impact resistance of FBE coatings. Essentially, FBE has been the market leader in industrial coatings. Source: Development of Novel Toughening Technology for Fusion‐Bonded‐Epoxy Paint & Coatings Industry. Development of Novel Toughening Technology for Fusion‐Bonded‐Epoxy (FBE) Powder Coatings. Oct 2007, Vol. 23 Issue 10, p64‐68, 4p.
115

Exhibit Nineteen Composition of Coatings: Fusion Bonded Epoxies Essential components of a powder coating are:
1. Resin 2. Hardener or curing agent 3. Fillers and extenders 4. Color pigments
The resin and hardener part together is known as the "Binder". As the name indicates, in Fusion bonded epoxy coatings the resin part is an "epoxy" type resin. “Epoxy” or “Oxirane” structure contains a three membered cyclic ring; one oxygen atom connected to two carbon atoms, in the resin molecule. This part is the most reactive group in the epoxy resins. Most commonly used FBE resins are derivatives of bisphenol A and epichlorohydrin. However, other types of resins are also commonly used in FBE formulations to achieve various properties, combinations or additions. Resins are also available in various molecular lengths, to provide unique properties to the final coating. The second most important part of FBE coatings is the curing agent or hardener. Curing agents react either with the epoxy ring or with the hydroxyl groups, along the epoxy molecular chain. Various types of curing agents, used in FBE manufacture, include dicyandiamide, aromatic amines, aliphatic diamines, etc. The selected curing agent determines the nature of the final FBE product — its cross linking density, chemical resistance, brittleness, flexibility etc. The ratio of epoxy resins and curing agents in a formulation is determined by their relative equivalent weights. In addition to these two major components, FBE coatings include fillers, pigments, extenders and various additives, to provide desired properties. These components control characteristics such as permeability, hardness, color, thickness, gouge resistance etc. All of these components are normally dry solids, even though small quantities of liquid additives may be used in some FBE formulations. If used, these liquid components are sprayed into the formulation mix during pre‐blending in the manufacturing process. Market Share of Various Coatings__________________________________________ The architectural paint market "has benefited from solid consumer spending on remodeling, and improved weather in parts of the country'," says, "Donald Carson, analyst at Merrill Lynch. Carson says paint makers, including PPG Industries, Sherwin‐Williams, and Valspar had "healthy" third‐quarter sales or volume growth in their architectural segments. Sherwin‐Williams posted an 8.1% rise in third‐quarter net income, to $120.3 million, on sales up 5.4%, to $1.5 billion. The company's Paint Store segment sales grew by 5.4%, to $989 million, and its consumer segment sales increased 4‐7%, to $128.9 million. "The third‐quarter sales increase was due primarily to stronger architectural sales at some of this segment's largest retailers, and increased sales of aerosol and wood‐care products," the company says. PPG reported a 5% volume increase in its Architectural business in the third quarter, Carson says. PPG says that coatings account for a little more than half of its sales. Overall coatings sales grew 7%, to $1.22
116
billion, due CO strengthening of foreign currencies and improved volumes across all businesses, off‐ set in part by lower prices in the automotive OEM business. Operating earnings grew 3.8%, to $185 million, which PKJ attributes to increased volumes, lower overhead costs, improved manufacturing efficiencies, and favorable effects of foreign currency translation. PPG reported overall net income down 4%, to $147 million, on sales up 7%, to $2.21 billion. Valspar's packaging and architectural sales have remained healthy, Garson says. Valspar reported net income up 5%, to $40.1 million, tor its fiscal third quarter ended May 31, on sales up 4%, to $598.2 million. The company's architectural and packaging coatings lines drove earnings growth, but the industrial coatings unit was bit by soft demand, Valspar says. The weak economy and high raw material costs crimped earnings growth, the company says. Valspar is scheduled to report results for its fiscal fourth quarter later this month, and says it expects that sales in its industrial segment will improve as there are signs of an upturn in industrial end markets. DuPont does not break out automotive OEM paint sales, which are included along with all DuPont finishes and the company's titanium dioxide business in its Coatings and Color Technologies unit. DuPonts’ third‐quarter sales for that unit climbed 8%, to $1.4 billion, says Eric Melin, V.P., and general manager/refinish systems at DuPont. However, the increase was largely due to favorable currency exchange rates and an acquisition, Melin says. Paint volume declined 1% in the quarter. The company says car builds are down about 2% in the U.S. and about 3%‐ 4% in Europe; collision and repair work "continues to he on the soft side" both in Europe and the U.S.; consumer confidence is low; and growth in the general industrial sector is slow. Source: Paints and Coatings, Seeking a Window of Opportunity D’Amico, Esther. Chemical Week; Paints and Coatings, Seeking a New Window of Opportunity. 12 Nov 2003, Vol. 165 Issue 41, p23‐26, 3p, 5 Color Photographs. Types of Coatings Various coating systems have been tried over the past 45 years and they have evolved with time and with innovation of new materials. Today, five main coating systems are commonly used for pipelines: three layer PE (3LPE), three layer PP (3LPP), fusion bonded epoxy (FBE or Dual FBE), coal tar enamel (CTE), asphalt enamel and polyurethane (PUR). The different systems are specified by pipeline owners and consultants based on various factors, including short‐term cost, long‐term cost, captive usage, regional availability of the coating material, control on handling, transportation and installation of pipelines, and technical reasons. 3LPE coating is dominant worldwide – with 50 per cent market share – for onshore pipelines, with the exception of North America. The trend is increasing with a greater number of projects coated with 3LPE in China, India and the Middle East. The increased acceptance of 3LPE is due to its broad operating temperature range (from ‐45°C to + 85°C) and ability to withstand very rough handling and installation practices without damage to the coating. 3LPE systems consist of an epoxy primer, a grafted copolymer medium density (MDPE) adhesive to bond the epoxy primer with a high density (HDPE) topcoat. 3LPP systems are recognized as excellent systems for offshore projects with elevated operating temperature (0°C to +140°C) and extreme mechanical stress on the pipes. Recent projects in the North Sea, Africa, Gulf of Mexico and Arabian regions have set new standards for 3LPP coatings, which provide access to deeper gas and oil fields. 3LPP system consists of an epoxy primer, a grafted copolymer PP adhesive to bond the epoxy primer with a PP topcoat.
117

FBE is dominant in North America, United Kingdom and a few other countries but the trend is declining in favor of 3LPE and PP Systems. Some pipeline owners have graduated from coal tar coating to Dual FBE as the cost has become quite competitive after increases in coal tar prices. Coal tar and asphalt enamel are both still used in some countries. For many refineries, which have their own pipelines, coal tar is the cheapest coating option, being their own product. Both systems are declining and suffer from health and environmental concerns. Providers of innovative, value creating plastics solutions, Borealis and Borouge have over 40 years of combined experience in the polyolefins industry and a record of engaging with parties throughout the value chain. Borealis is pre‐eminent in Europe with a strong leadership position in the industry whilst Borouge has a strong growing market presence in the Middle East, Asia‐Pacific and Africa. Their long experience and expertise in the plastic pipe industry includes more than 20 years in steel pipe coating. In the 80s and 90s, the group supplied an extensive number of projects all over the world, initially with low density (LDPE) and MDPE compounds for pipe coating. With continuous research and development, Borouge and Borealis’s first bimodal high density PE system with grafted MDPE adhesive was introduced in 1997 and it remains a leading 3LPE system. In 1990, Borealis introduced its first PP system. Borouge and Borealis employ their unique Borstar technology to produce differentiated, high performance PE and PP polymer solutions for steel pipe coating. Borstar technology combines excellent processability and melt strength of the polymer with very high properties like notch resistance, abrasion resistance, improved impact at low and elevated temperatures, peel strength and indentation resistance. The HDPE and PP top coat are supplied in compounded form to withstand long‐term thermal ageing and light ageing. A high level of investment in research and development in close co‐operation with customers ensures the continual development of innovative new products and pipe system solutions. Several new products are under development including a PE top coat with very high resistance to slow crack growth, machine applied PE for field joint coatings, PP weight coating and PP injection molded systems for field joint coating. The result of this approach is a long pipeline service life with minimum maintenance cost for the pipeline owner, fast production and high output for the pipe coater, easy installation without repairs for the installers and peace of mind and reliability for the engineering consultant. Source: Pipeline International
118

Exhibit Twenty Coating Price Points: Industrial coatings have seen a steady increase in over several years. BASF Corp. has announced that it will increase prices on all of its Industrial Coatings Solutions product lines between five and eight percent effective March 1, 2008, or as contracts allow. BASF will increase prices up to 15 percent for its paper wet‐end chemicals in Asia Pacific. The costs of raw materials and energy prices have risen considerably. As a result, BASF is forced to increase the prices of its paper process chemicals, in some cases significantly. According to BASF, the price increase pertains to North American Industrial Coatings markets only and is necessary due to escalating energy, transportation and raw material costs in the region. Citing a continuing escalation in raw material costs, Dow Coating Materials implemented a price increase for all acrylic and acrylic‐based products sold to the architectural coatings, industrial coatings, and traffic paint industries. The increase of $0.05 per pound is in addition to any previously announced increase. This price change took place in 2008 and affects all acrylic and styrene‐acrylic emulsions, vinyl‐acetate‐based emulsions, rheology modifiers, opaque polymers and dispersants. Akzo Nobel's Industrial Finishes Business Unit, a leading global supplier of custom formulated industrial finishes, coatings and wood adhesives, has announced a global price increase in response to rapidly rising raw material and energy costs. Robert Taylor, President and General Manager, Industrial Finishes, announced that a 15 percent increase would go into effect across all Industrial Finishes market segments globally during July 2008, including industrial wood coatings; coil and extrusion coatings; specialty plastics coatings; and wood adhesives and board resins. He says the price increases are essential in order to sustain consistent product supply, new technology development and the technical service Akzo Nobel customers depend on. Essentially, there has been a significant price increase that began two years ago. After researching several industry leaders, pricing of various coatings was not revealed. However, current pricing should reflect these price increases. Based on the following, our recommendation would be to consider the price increase when determining a price point for consumers. Source: Akzo Nobel's Industrial Finishes Business Unit Announces Price Increase China Chemical Reporter; AkzoNobel's Industrial Finishes Business Unit Announces Price Increase. 6 Jul 2008, Vol. 19 Issue 19, p21‐21, 1/8p.
119

Exhibit Twenty One Evaluation of Coating Process: Regardless of the shape and type of steel surface to be coated, the FBE powder coating application has three essential stages:
4. The steel surface is thoroughly cleaned, 5. The cleaned metal part is heated to the recommended FBE powder application temperature,
and 6. The application and curing stage.
The advantage of pipe and rebar is that their round shape allows continuous linear application over the exterior surface, while the parts are moved in a conveyor through the powder application booth, ensuring high throughput. On fittings, etc., the coating is applied by manual spray guns. Another method of application is "fluid‐dip" process, in which the heated components are dipped in a fluidized powder bed.
The conventional application procedure involves abrasive cleaning of pipe and fittings. The surface is cleaned to NACE level2 using steel grit and shot of the proper size to obtain a 2.5‐ to 4.5‐mil profile. The surface is then checked for salt contamination and, if necessary, washed with phosphoric acid and then deionized water. Chromate is applied to enhance the adhesive strength of some FBE formulations. This surface is then heated to 450 to 488F. The finely powdered, unreacted FBE is then fluidized with cold, dry air and conveyed to an electrostatic spray system. The fluidized FBE powder is then sprayed onto the hot pipe surface using a series of spray guns. FBE, which is solid at ambient temperature, melts when it contacts the hot surface. The melted epoxy resin reacts with the curing agent contained in the FBE system and bonds to the substrate, providing a highly cross linked polymer with a sophisticated network of covalent and coordinate bonds. These high energy bonds provide excellent adhesion between the coating and the metallic substrate.
Influence of surface preparation and application temperature. Most of the high performance powder coating systems requires an extremely clean surface. For FBE, the minimum required cleanliness is Sa 2.5 per ISO 8501‐1/SIF or NACE level2. The importance of this requirement can be easily understood by reviewing the role of adhesion in the coating's performance. The two important components of adhesion, polar and chemical, are directly linked to the bonding hydroxyls of the substrate surface. The absence of these hydroxyl groups can adversely affect the overall adhesive strength of the coating. An improperly cleaned surface can limit the number of hydroxyls available for bonding. Another important step is the removal of water soluble salts and organic contaminants. If left on the surface, salts, especially chlorides and sulfates, can initiate water absorption by osmosis and lead to coating blisters. It has been reported that chloride contamination will seriously affect adhesion and cathodic disbondment properties. Six international standards such as NACE and CSA address this issue in their FBE application specifications. The standard procedure to remove soluble salts, such as chloride, involves washing the pipe with phosphoric acid followed by deionized water. The maximum allowable chloride concentration is 2.0 mg/m2, according to NACE standards.7
120
The required profile for FBE application is 2.5 to 4.5 mil. The peak heights and densities of the profile have a profound effect on the corrosion protection performance of the coating. Proper initial adhesion and the powder coating's ability to provide adequate adhesion throughout the design life of the pipeline are the key factors in providing adequate corrosion protection. Profile is a key factor in deciding the total adhesive strength of the powder coating. As stated earlier, the major adhesion components are mechanical, polar and chemical. All of these are greatly influenced by the shape, peak heights and density of the anchor profile. By increasing the depth and density of the profile, the available bonding area is increased.
Powder coatings essentially control corrosion by separating the cathode and anode. This can only be achieved if the coating can wet out the surface completely on the micro level. To have excellent wetting properties, the powder coating should have low viscosity. Because FBE is a solid, the melt viscosity has to be low enough to fill the profile without leaving any air pockets, which are potential areas for pit corrosion. Low viscosity can be achieved by using proper resin systems. However, the viscosity depends to a greater extent on the pipe surface temperature. A higher temperature will result in a low melt viscosity, allowing the powder coating to wet out the surface completely.
FBE systems require high energy to achieve cross linking between the epoxy molecules and the curing agent. Improper energy levels can leave powder coating components unreacted. This will adversely affect the applied film properties. One of the properties that will be seriously affected is flexibility, since under‐cured coatings will crack during field bending of the coated pipe. Another property that will be affected is adhesion. For chemical adhesion, an excited metal surface is needed. By increasing the application temperature, the chance for excitation of iron molecules on the substrate will be increased. This will lead to more chemical adhesion sites and increased adhesive strength of the applied coating.
The success of the FBE coating as the best corrosion control system for underground pipelines lies in its ability to limit oxygen and water transport to the pipe surface and compatibility with the alternate CP system. The properties of FBE are designed such that it will work in conjunction with the CP system, not interfere with it. However, the application parameters including surface cleanliness, removal of contaminants, profile shape and densities, initial application temperature and curing temperature and time play a critical role in ensuring these important properties.
Upon completion of the coating operation, but prior to storage, the coating must be inspected for continuity in accordance with NACE Standard RP0490‐01. The search electrode is steel spring or conductive rubber. The thickness of the coating will be checked with properly calibrated magnetic thickness gauge and shall have nominal thickness of 16 mils/406 μm with a minimum of 12 mils/305 μm or as required by the specifications. Source: http://www.fastfab.com/products/3M‐scotchkote‐206N.php and 3M Application Process
121

Exhibit Twenty Two Licensing and Prequalification of Contractors to Apply Coating: ISO is a recognized and widely adopted standards organization that assists in providing best practice throughout industry. International standards are developed by international standards organizations. International standards are available for consideration and use, worldwide. The most prominent organization is the International Organization for Standardization. International standards may be used either by direct application or by a process of modifying an international standard to suit local conditions. The adoption of international standards results in the creation of equivalent, national standards that are substantially the same as international standards in technical content, but may have (i) editorial differences as to appearance, use of symbols and measurement units, substitution of a point for a comma as the decimal marker, and (ii) differences resulting from conflicts in governmental regulations or industry‐specific requirements caused by fundamental climatic, geographical, technological, or infrastructural factors, or the stringency of safety requirements that a given standard authority considers appropriate. International standards are one way of overcoming technical barriers in international commerce caused by differences among technical regulations and standards developed independently and separately by each nation, national standards organization, or company. Technical barriers arise when different groups come together; each with a large user base, doing some well‐established thing that between them is mutually incompatible. Establishing international standards is one way of preventing or overcoming this problem. Source: www.iso.org ISO 12944 is an international standard for Paints and varnishes ‐ Corrosion protection of steel structures by protective paint systems ‐Part 5: Protective paint systems. This standard is used by the competition analyzed in this document, as well as other industry leaders. They have a proven track record that identifies these companies as the market leaders.
• ISO 12944 Paints & Varnishes ‐ Corrosion Protection of Steel Structures by protective paint systems
• The ISO 12944 standard is intended to assist engineers and corrosion experts in adopting best practice in corrosion protection of structural steel at new construction.
• ISO 12944 is progressively superseding regional standards to become a truly global benchmark in corrosion control.
Selecting specifications that comply with ISO 12944 provides you with:
• Confidence that the corrosion protection you specify will be fit for purpose • An objective approach to coating selection • A simplified matrix of coating systems to select from • A meaningful coating design life • A universally accepted standard
The first step in identifying the classification of the coating is to determine the environment. The chart below categorizes the industry:
122
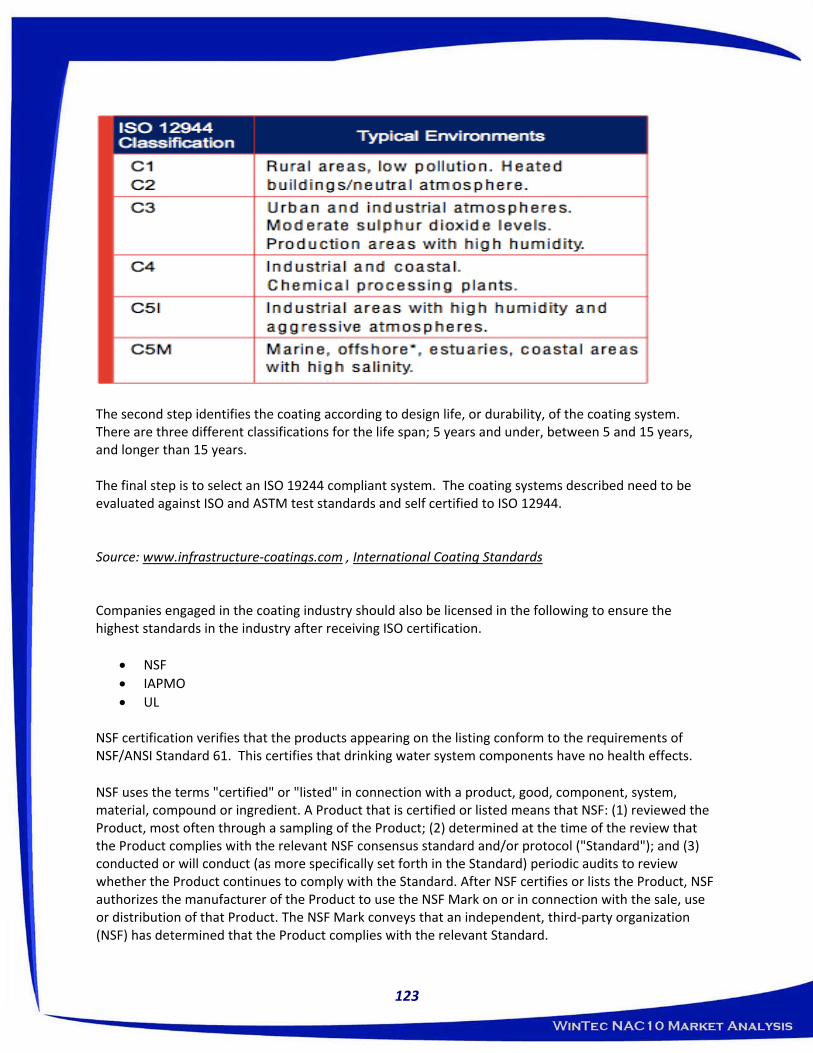
The second step identifies the coating according to design life, or durability, of the coating system. There are three different classifications for the life span; 5 years and under, between 5 and 15 years, and longer than 15 years. The final step is to select an ISO 19244 compliant system. The coating systems described need to be evaluated against ISO and ASTM test standards and self certified to ISO 12944. Source: www.infrastructure‐coatings.com , International Coating Standards Companies engaged in the coating industry should also be licensed in the following to ensure the highest standards in the industry after receiving ISO certification.
• NSF • IAPMO • UL
NSF certification verifies that the products appearing on the listing conform to the requirements of NSF/ANSI Standard 61. This certifies that drinking water system components have no health effects.
NSF uses the terms "certified" or "listed" in connection with a product, good, component, system, material, compound or ingredient. A Product that is certified or listed means that NSF: (1) reviewed the Product, most often through a sampling of the Product; (2) determined at the time of the review that the Product complies with the relevant NSF consensus standard and/or protocol ("Standard"); and (3) conducted or will conduct (as more specifically set forth in the Standard) periodic audits to review whether the Product continues to comply with the Standard. After NSF certifies or lists the Product, NSF authorizes the manufacturer of the Product to use the NSF Mark on or in connection with the sale, use or distribution of that Product. The NSF Mark conveys that an independent, third‐party organization (NSF) has determined that the Product complies with the relevant Standard.
123

The NSF Mark can be found on millions of consumer, commercial, and industrial products today. Products evaluated and certified by NSF International include bottled water, food equipment, home water treatment products, home appliances, plumbing and faucets, and even pool and spa components.
Source: www.nsf.org The International Association of Plumbing and Mechanical Officials has been protecting the public’s health and safety for more than eighty years by working in concert with government and industry to implement comprehensive plumbing and mechanical systems around the world. IAPMO Research and Technology is a product certification body which tests and inspects samples taken from the suppliers’ stock, from the market, or a combination of both to verify compliance to the requirements of applicable codes and standards. This activity is coupled with periodic surveillance of the suppliers’ factory and warehouse. This also includes an assessment of the suppliers’ Quality Assurance System. Source: http://www.iapmo.org/Pages/splash.aspx
Underwriters Laboratories is an independent product safety certification organization that has been testing products and writing standards for safety for more than a century. UL evaluates more than 19,000 types of products, components, materials and systems annually with 20 billion UL Marks appearing on 66,000 manufacturers' products each year. UL's worldwide family of companies and network of service providers includes 68 laboratories, testing and certification facilities serving customers in 102 countries.
Source: http://www.ul.com/global/eng/pages/ Essentially, these four certifications are the industry standard. Without being certified in the following, it will be difficult to penetrate the market.
124

Exhibit Twenty Three Shell Oil Company Shell is the market leader through approximately 25,000 Shell‐branded gas stations in the US which also serve as Shell's most visible public presence. Shell is a leading oil and gas producer in the deepwater Gulf of Mexico, a recognized pioneer in oil and gas exploration and production technology and one of America’s leading oil and natural gas producers, gasoline and natural gas marketers and petrochemical manufacturers. It operates in 50 states and employs more than 22,000 people delivering energy in technically innovative ways. Shell’s presence in the U.S. dates back nearly 100 years, first as a Pacific Coast gasoline marketer and Midwest oil producer. In that time, Shell has been a key player in innovation and is pushing the limits of what is technically feasible to locate and extract energy resources from increasingly difficult locations. Shell Pipeline Company takes steps to preserve the integrity of the pipelines, storage tanks and facilities to help keep them safe, reliable and environmentally sound.
• Shell conducts risk and integrity assessments by performing scheduled inspections and integrating data from numerous sources.
• Using sophisticated computer and telecommunications equipment located along the pipeline system, Shell monitors the pipelines from the control centers 24 hours a day, seven days a week. If a problem is detected, Shell takes quick action to correct it.
• Shell conducts frequent ground or aerial surveys along the pipeline routes, looking for any excavation activity or ground discoloration that could indicate a leak.
• Shell also periodically reassess the maintenance and damage prevention activities, looking for opportunities to improve them.
Every day, Shell moves more than 7 million barrels of crude oil and refined products from source to market, across 10,000 miles of pipelines in 22 states and the Gulf of Mexico through an efficient, integrated network of trunk lines, distribution systems, interconnects, and terminals. Shell recognizes that protecting the quality of products it ships and distributes is critical to its success and to its customers' success. Shell's focus on quality and safety is underscored through programs to test and monitor products, pipelines and terminals through all phases of transportation. The Direction Shell is Moving With up to 70% of oil being left behind in the reservoir because it is too difficult or costly to recover, Shell is using technology to ‘squeeze’ more out. Enhanced oil recovery is the key technology here – enabling the remaining oil to flow in to the wells and up to the surface. Advanced drilling techniques and technologies are also helping Shell to access valuable oil and gas with wells that go on for many miles and snake around underground obstacles to reach multiple small reservoirs. And by finding ways to safely and cost effectively transport gas, Shell can put more of this resource to use even when it is far away from where it’s needed. Shell’s Project Locations
125

Shell has project locations in the following place through out the United States: Alabama, Alaska, Colorado, Deerpark, Geismar, Gulf of Mexico, Perdido, Port Arthur Expansion Project, South Texas, Wyoming. Alabama: About the Yellowhammer Plant and Fairway Field The facility is designed to process 200 million cubic feet (mmcf) of sour gas per day, which provides the source for three commercialized products: gas to fuel homes and industry, natural gas liquids and sulfur. The plant also has processing agreements to gather and treat raw gas produced from certain offshore fields operated by Chevron in Viosca Knoll. Chevron production is received at the Fairway platform and then transported to the Yellowhammer Plant via a 12” pipeline. Shell operates the Yellowhammer Plant, as well as the Fairway offshore field, with 30 Shell employees and various contractors. It recently marked its 15th anniversary with a celebratory event for employees, contractors and stakeholders. Shell supports a number of agencies and community groups in the area, such as the Alabama Coastal Foundation, the Dauphin Island Sea Lab and the Mobile Child Advocacy Center. Mobile Bay Operations at a glance
• The Yellowhammer Plant is named for the Alabama state bird.
• The Yellowhammer Plant is located approximately 20 miles south of Mobile, Alabama.
• The plant is jointly owned by Shell Exploration & Production Company with 64%, and Marubeni Oil and Gas with 36%.
• The plant processes sour gas from the Shell/Marubeni Fairway Field and other 3rd party fields.
• The Fairway Field is located four miles south of Dauphin Island, Alabama, and about 17 miles southeast of the Yellowhammer Plant.
• The sour gas provides the source for three commercialized products: gas to fuel homes and industry, natural gas liquids and sulfur.
• Shell operates the Yellowhammer Plant and the Fairway offshore field. Together the Yellowhammer Plant and the Fairway Field make up Shell’s Mobile Bay Operations.
• Mobile Bay Operations celebrated its 15th anniversary in 2006.
Alaska: Shell has a long history in Alaska, dating back to 1918. Beginning almost 50 years ago, Shell operated continuously in Alaska until 1998. Shell was one of the most prominent explorers in all of the frontier basins of Alaska, as well as being an operator and major producer in Cook Inlet.
126

In 2011 Shell plans to work in the Beaufort Sea Details associated with the drilling program are detailed below.
• Up to two exploration wells in Camden Bay
• Noble Discoverer drillship
• Communication plan for avoiding conflicts with subsistence users
• Zero discharge of: Drilling fluids; Cuttings after 20” casing; Treated sanitary and gray water; Ballast and bilge water
• Three‐tier oil spill response – offshore, near‐shore and onshore
• Oil spill response fleet on standby 24/7 near drilling location
• Kulluk drill rig staged in Alaska waters and available to drill a relief well in the unlikely event it is needed
• Arctic containment system to capture and recover hydrocarbons from a well control incident
• BOP testing and enhancements: Testing every 7 days instead of every 14 days; Use of second set of shear rams; Sub‐sea remote operating panel relocation
• Supported by ice management and anchor handling vessels
• Real time ice and weather forecasting
• Deadhorse shorebase
• Crew changes by helicopter – routes determined through coordination and communication
• Robust marine mammal monitoring program
• Marine Mammal Observers (MMOs) on all vessels
Colorado: Technology Shell carried out a small field test known as the Mahogany Demonstration Project South on its private property in Rio Blanco County, Colorado, using an in‐ground heating process to recover oil and gas from the shale formation. On only a 30 x 40 foot testing area, Shell successfully recovered 1,700 barrels of high quality light oil plus associated gas from shallower, less‐concentrated oil shale layers. Shell’s research to date has demonstrated that the In situ Conversion Process (ICP) works technically on a small scale ‐ what remains is to prove it can work commercially. Shell will continue to set a high industry standard for public participation, environmental protection and community enhancement in an effort to ensure oil shale is done the right way.
127
Shell aims to advance the technology systematically to the point at which an application could be made to convert the 160‐acre RD&D tracts to commercial leases. A commercial decision would be middle of the next decade and possibly later depending on the sequence and outcome of research activities. Deerpark: Deerpark is the sixth largest refinery in the US. In February 1993, Shell Oil Company and PMI Norteamerica, S.A. de C.V., a subsidiary of Petroleos Mexicanos (Pemex), formed a 50‐50 joint venture, Deer Park Refining Limited Partnership (DPRLP). In March 2001 Shell completed a $1 billion capital upgrade. The project improved DPRLP’s global competitiveness, operating efficiency and long‐term economic viability while significantly reducing air emissions. The assets of the refinery are managed and operated by Shell Oil Company through Shell Deer Park Refining Company, a division of Shell Oil Products Company, a Shell Oil subsidiary. Today, Shell Deer Park is home to the sixth largest refinery in the United States with a crude oil capacity of 340,000 barrels a day (42 gallons per barrel). Geismar: The Plant is located on the east bank of the Mississippi River, 20 miles downriver from Baton Rouge, Louisiana. On January 18, 1965 Shell announced the purchase of the Geismar site. The original site was about 700 acres and was formerly part of Ashland ‐ Belle Helene Plantation. By mid‐1966, the construction was in full swing. Offices were moved to the plant site in February, 1967 from a leased location at 721 Government Street in Baton Rouge. The Shell Geismar facility manufactures Detergent Alcohols, Ethylene Glycol, Alpha Olefins, and a diversified line of ethylene based industrial chemicals used in a wide range of modern applications. The Shell Geismar Plant site currently contains approximately 800 acres of which only 400 acres are developed. Gulf of Mexico: Throughout Shell, the company strives for “Goal Zero.” Shell wants to create a workplace with zero fatalities, zero accidents and zero significant incidents. Shell operations in the GOM provide more than 36 percent of Shell's Upstream America's oil and gas production. Shell has approximately 1,600 contract and full‐time employees in the GOM.
• Shell operates six major offshore facilities, 13 manned platforms, one spar and numerous subsea systems in the GOM.
• Shell facilities in its East GOM portfolio include three tension leg platforms: Mars, Ursa and Ram‐Powell, as well as fixed platforms: Cognac, West Delta 143 and Main Pass 252. Subsea systems include Europa, King, Deimos, Crosby, Princess, Mensa, Tahoe, SE Tahoe and Einset.
• Shell facilities in its West GOM portfolio include the newest platform ‐ the Perdido spar, two tension leg platforms Auger and Brutus, as well as fixed platforms: Enchilada, Cougar and Boxer. Subsea systems include Macaroni, Serrano, Oregano, Llano, Habanero, Angus, Manatee, Troika, Popeye, Gyrfalcon and Glider.
• Shell currently has four Mobile Offshore Drilling Units (MODUs) under contract, operating across the deepwater Gulf of Mexico.
128
• Shell also is involved in partner‐operated deepwater projects, such as Nakika, Conger, Marlin, Holstein and Morpeth. In instances when Shell is not the operator, it does not manage storm or hurricane procedures for these assets. Shell only has authority for Shell‐operated facilities.
Perdido, Texas: Perdido marks a new era in innovation and safely unlocks domestic sources of energy for US consumers. The facility sits in approximately 2,450 metres (8,000 feet) of water, which is roughly equivalent to six Empire State Buildings stacked one atop the other, and will access reservoirs deep beneath the ocean floor. The Perdido Development will ramp up to annual peak production of more than 100,000 barrels of oil equivalent per day. Perdido fast facts:
• One day’s production from Perdido is equivalent to the energy needed to fuel 500 cars for 15 years
• First commercial production from the Lower Tertiary reservoir in the Gulf of Mexico
• First Gulf of Mexico full host subsea separation and boosting, in the Gulf of Mexico, removes about 2,000 psi of backpressure from the wells
• First spar wet tree Direct Vertical Access (DVA) wells in water more than two kilometers (1.2 miles) deep
• The project achieved 10‐million hours without a lost time injury
• Located 320 kilometres (200 miles) from the Texas coast in Alaminos Canyon Block 857
• The Great White field represents about 80% of Perdido’s total estimated production
• Perdido’s project life is expected to be about 20 years
• Construction of the Perdido host spar began in late 2006
• Topsides were mated with the spar in a single lift in early 2009
Port Arthur Expansion: Motiva Enterprises is expanding its Port Arthur Refinery (PAR) in Texas by 325,000 barrels per day (bbl/d), taking total capacity to 600,000 bbl/d. Following the expansion, the PAR will be one of the largest refineries in the US. Shell owns 50% of Motiva; the remaining 50% is owned by Saudi Aramco. The expanded Port Arthur refinery will be capable of handling most grades of crudes, even the lowest quality. A new three‐unit naphtha processing complex will include a catalytic reformer which will convert 85,000 b/d into high octane gasoline for blending. The scale of the expansion includes 725 pumps, 19 compressors, 514 heat exchangers and 54 new tanks. New technology will lower most emissions from the refinery on a per barrel basis. Nitrogen oxides and volatile organic compounds will be reduced from present day levels.
129
South Texas: In 2006, Shell closed an agreement for a like‐kind exchange with Total E&P USA. Shell exchanged its 17‐percent non‐operated interest in the deepwater Gulf of Mexico Tahiti field for Total’s interests in natural gas assets in South Texas. Shell operates approximately 525 producing wells and approximately 600 miles of pipeline across three counties (Hidalgo, Starr, and Brooks). Shell has production offices in McAllen and in McCook, with 80 employees assigned to the production team. Shell drilled its first South Texas wells in 1953. Today, it produces approximately 210 million cubic feet of natural gas per day from more than 400 wells across three counties – Zapata, Hidalgo and Starr.
Wyoming: In the Pinedale Anticline gas field, Shell is applying best practices for the operations. That includes implementing innovative technologies and working collaboratively to build effective relationships in Sublette County. Today on the Anticline, Shell has drilled more than 400 natural gas wells, operate on more than 21,000 acres and produce approximately 350 million cubic feet of natural gas per day. Shell’s Pinedale Anticline leasehold is predominately federal minerals, underlying federal (Bureau of Land Management) surface. The Pinedale Anticline Project Area (PAPA) is the 3rd largest gas field in the United Sates and provides vital energy for the country. The field is located in Sublette County’s Green River Valley south of Pinedale, Wyoming near a Class 1 Area that features world‐class natural resources. It consists of 197,345 acres of federal, state and private lands: 157,719 surface acres (79.9 percent) belong to the Bureau of Land Management; 9,766 surfaces areas (5.0 percent) belong to the state of Wyoming; and 29,860 surface acres (15.1 percent) belong to private owners. The PAPA contains natural gas estimates of up to 40 trillion cubic feet, with 20 – 25 trillion cubic feet of that recoverable—enough to supply 10 million homes for more than 30 years. The first well in the PAPA was drilled in the 1930s; regional energy development became economically viable in the early 2000s. Energy development in the PAPA must be managed responsibly with respect to critical issues that include air quality management, water protection and wildlife and habitat conservation for significant migration corridors and species ranging from mule deer, antelope, sage‐grouse and a number of raptors including bald eagles.
130

Exhibit Twenty Four Exxon Mobil Corp. Exxon is the world's largest publicly traded international oil and gas company, providing energy that helps underpin growing economies and improve living standards around the world. Exxon Mobil has two major locations in the United States, they are the Piceance Basin in Colorado and the Gulf of Mexico. The Piceance Basin in northwest Colorado contains trillions of cubic feet of natural gas, offering an immense amount of energy in America’s backyard. Exxon Mobil and its predecessors have been operating here since the 1950s, producing modest amounts of gas that were relatively easy to extract. The majority of the gas, however, is in scattered pockets deep underground in rocks as dense as cement. Although the industry has known about these “tight gas” deposits for decades, they were generally left behind because they were too difficult and expensive to recover. Exxon Mobil engineers are using proprietary, innovative technologies including Multi‐Zone Stimulation Technology (MZST) and Just‐in‐Time Perforating (JITP) system to recover that gas with great precision and less environmental impact. Rio Blanco County, home of Exxon Mobil’s Piceance project, covers an area larger than 3,000 square miles and contains enough clean‐burning, domestic natural gas to benefit millions of consumers. Exxon Mobil’s leases hold a potential resource of more than 45 trillion cubic feet of gas, recoverable over the life of the project. That volume could power 50 million homes for almost a decade. Exxon Mobil's innovative solutions significantly reduce environmental impact. The Piceance project uses a single pad to drill up to nine wells from each location, and includes initiatives to protect wildlife, as well as programs to reuse produced water and reduce the use of fresh water. With increased natural gas production in the Piceance Basin and additional investments planned, Exxon Mobil is committed to building long‐term partnerships in Rio Blanco County and northwest Colorado. Gulf of Mexico: The Gulf of Mexico is an active place for ExxonMobil engineers, drillers and production personnel as they work to bring on new domestic oil and gas supplies at established off‐shore fields to meet ever‐growing U.S. energy demand. Six miles from the company’s Hoover Diana development in the Gulf of Mexico, a new well is expected to more than triple existing natural gas production. The gas pockets are in a field called Rockefeller, one of several surrounding the Hoover Diana offshore platform, which began production in 2000. Rockefeller was once considered too expensive to develop, but technology advancements, along with a drilling plan that tied the new well into an existing subsea network offered millions in cost savings and enabled the company to begin development in 2007. Drilling operations were completed in July 2009. The drilling crew of The Ocean Valiant leveraged the company’s Fast Drill Process (FDP) to achieve a nearly 60 percent increase in feet‐per‐day drilling rates compared to other Exxon Mobil‐operated deepwater wells in the Gulf of Mexico. The project saved more than $10 million by drilling the well on the southeast corner of the Madison field, where Exxon Mobil has existing production, and connecting the gathering line from Rockefeller into the Madison subsea template so the gas can be directed to Hoover Diana for processing and transmission to shore for domestic sales. Production start‐up for the field began in September 2009.
131
Elsewhere in the Gulf, Exxon Mobil employees and contractors are working to bring new energy supplies online, acquire additional exploration acreage and work over existing wells to keep oil and gas flowing. Some of the company’s newest equipment, construction and most exciting technology applications are occurring in Gulf of Mexico fields Exxon Mobil has operated for decades.
132

Exhibit Twenty Five BP, Plc BP is the leading producer of oil and natural gas in the United States and the largest investor in U.S. energy development. The BP family of brands includes Amoco, ARCO, and BP gasolines, as well as am/pm retail outlets and Castrol motor oil. Since 2004, BP has invested over $45 billion in the United States to increase existing energy sources, extend energy supplies and develop new low‐carbon technologies. BP currently employs approximately 23,000 people in the US, has over $47 billion in fixed assets, and sells more than 15 billion gallons of gasoline every year. BP is one of the largest blenders and marketers of biofuels in the nation. BP is underwriting cutting‐edge research investing more than $500 million over the next 10 years in the search for a new generation of biofuels that contain more energy, have less impact on the environment, and will not reduce the supply or increase the cost of food. BP entered the North American oil business as a pioneer explorer in Alaska in the late 1950s. In 1969 BP made a major oil discovery at Prudhoe Bay on Alaska’s North Slope. Through the large share in Prudhoe Bay, BP became part owners of the biggest oilfield in the US. By 2001, following a series of mergers and acquisitions, BP had become the largest oil and gas producer and one of the largest gasoline retailers in the US. Today, BP is the number one producer of oil and gas offshore in the deepwater Gulf of Mexico. Equally important are the onshore gas operations, which have enabled the company to become the one of the largest gas producers in the US. BP Pipelines (North America) is the second‐largest liquids pipeline company in the U.S., transporting more than 1.6 million barrels per day of oil, refined products, natural gas liquids, carbon dioxide and chemicals. That represents about 9 percent of the U.S. liquids pipeline market. Beyond core operations, BP Pipelines (BPPNA) is a partner in various joint venture pipelines. Headquartered in Warrenville, IL, BP’s core and joint venture pipeline operations span 18 states and are managed from pipeline control centers in Oklahoma, Washington and California. Altogether, BP Pipelines North America operates about 9,000 miles of pipelines owned and operated by BP or its subsidiaries, affiliates and joint ventures, and holds joint venture interests in another approximately 7,500 miles of pipelines, which are operated by third parties. BP Project Location BP has modern refineries in Texas City, TX, Carson, CA, Cherry Point, WA, Whiting, IN and Toledo, OH. These five refineries have a total capacity for processing 1.5 million barrels of crude oil a day. BP’s refineries produce a wide range of fuels, petrochemicals and lubricants for America’s highway and rail transportation; industry; home, commercial and institutional heating; power generation, and airlines. (Air BP is a major supplier to airlines, with about 10 percent of the global market.)
133

Carson, CA Oil discoveries in Southern California in the early part of the 20th century set the stage for the growth of the petroleum industry in the Los Angeles basin. The Watson Ranch, which was only three miles west of Signal Hill, and the first developed land north of Los Angeles Harbor, became a prime location for storage tanks and a refinery. On March 3rd 1923, Pan‐American Petroleum paid $2,000 per acre for Patrick Watson’s 100‐acre tract. The refinery went through four major renovations before the Atlantic and Richfield merger. Additional modernizations and expansions have punctuated the refinery’s history since then. In November 1987, the Watson Cogeneration Plant began producing electricity and steam for the refinery, with the balance of the electricity sold to Southern California Edison. In that same year, the Watson Refinery’s name was officially changed to the “Los Angeles Refinery.” Following the BP merger in April 2000, the name was changed to “BP‐Carson Refinery.” BP Carson Refinery leads the nation in the production of low‐emission gasoline, setting the standard for other refineries and for the state of California. Encompassing over 630 acres of land, 1,200 employees work to help process some 265,000 barrels of oil per day into gasoline, diesel, jet fuel, and petroleum coke. The refinery supplies about 25 percent of the Los Angeles gasoline market.
Cherry Point, WA BP's Cherry Point refinery has quietly provided a significant portion of US energy needs for more than 30 years. Now it’s being positioned to meet the challenges of a diverse and rapidly changing energy market. Since it started operations in 1971, Cherry Point has processed a large share of Alaska North Slope crude oil. A refining workhorse, Cherry Point became one of BP's premier U.S. assets following the merger with ARCO in 2000. Situated on 2,400 acres and employing about 825 full‐time workers, the facility processes more than 225,000 barrels of crude oil a day, primarily transportation fuels. It provides about 20 percent of the gasoline market share in Washington and Oregon, the majority of jet fuel for Seattle, Portland and Vancouver, B.C. international airports, and is the largest west coast supplier of jet fuel to the U.S. military.
Texas City, TX Over three‐quarters of a century, BP and its heritage companies have invested billions of dollars in the Texas City refinery for numerous expansions and modernizations to meet the growing and changing fuel needs of the United States. From 2005 through 2007, investments made to produce ultra‐low sulfur diesel now allow the refinery to manufacture diesel fuel emitting just 15 sulfur parts per million, a 97 percent reduction from the old standard of 500 sulfur parts per million. Also since 2006, other significant investments have refurbished most of the plant’s major process units, resulting in improved environmental performance. More than 2,000 people are employed at the 1,200 acre facility, continuing the tradition of providing good‐paying jobs to four generations of area residents. Since 2006, operational and safety training for employees has been increased significantly.
134

BP Texas City can process 475,000 barrels of oil per day, more than 7 billion gallons of petroleum products per year. (Of which three billion are gasoline.) It is the third largest refinery in the United States and can process three percent of the nation’s gasoline supply, enough to fill the gas tanks of seven cars every second. BP Texas City has more than 20 process units and is considered one of the most versatile refineries in the world. BP Texas City’s flexibility also enables the refinery to produce a wide range of products including gasoline, ultra low sulfur diesel, jet fuel, chemical feed stocks and heavy fuels.
Toledo, OH BP‐Husky Refining LLC (i.e., the Toledo Refinery) occupies 585 acres just east of the City of Toledo. Operating continuously since 1919, the facility has undergone numerous improvements and expansions to achieve its current capacity for processing 160,000 barrels of crude oil daily. BP and Husky Energy finalized the formation of two 50/50 joint ventures in 2008. One joint venture (JV) will develop Husky’s Sunrise oil sands field located in Alberta, Canada, while the other repositions the refinery through a major investment enabling it to run 100% Canadian oil sands. This gives the refinery access to a reliable source of North American crude oil, ensuring the facility’s future for years to come. Under the agreement, BP operates the refinery on behalf of the joint venture. Day‐to‐day operations are driven by some 600 BP employees and another 500‐700 contract workers. They work year‐round to convert crude oil into almost six million gallons of product each day. Most of the refinery’s output is gasoline, including low‐sulfur fuels that produce lower vehicle emissions. The refinery also produces diesel fuel, aviation fuel, propane, kerosene and asphalt.
Whiting, IN The BP Whiting Refinery is located on the southwestern shore of Lake Michigan and the Indiana Harbor Ship Canal in the communities of Whiting, East Chicago and Hammond, Indiana. Whiting Refinery is the second largest refinery in the BP refining system, and the 5th largest refinery in the United States. Operations began in 1889, prior to the advent of the automobile. Today, BP is investing $3.8 billion (USD) in Northwest Indiana to modernize its Whiting Refinery for the processing of heavier crudes. The modernization is essential to the long‐term viability of the refinery, and includes $1.4 billion toward environmental improvements. Whiting Refinery employs approximately 1700 employees. In addition, the Whiting Refinery Modernization Project is employing thousands of contractors. Following the modernization, the refinery will continue to employ hundreds of contractors involved with routine maintenance work. The modernization project will provide for greater energy security in the Midwest, as conventional supplies of the lighter crudes diminish, and are replaced by heavier crudes.
135

Exhibit Twenty Six Chevron Corp. Chevron is one of the world's largest integrated energy companies. Headquartered in San Ramon, Calif., Chevron conducts business worldwide. They are engaged in every aspect of the crude oil and natural gas industry, including exploration and production, manufacturing, marketing and transportation, chemicals manufacturing and sales, geothermal energy, and power generation. Chevron traces the earliest roots to an 1879 oil discovery at Pico Canyon, north of Los Angeles, Calif., which led to the formation of the Pacific Coast Oil Co. That company later became Standard Oil Co. of California and, subsequently, Chevron. They took on the name "Chevron” when they acquired Gulf Oil Corp., in 1984, nearly doubling the worldwide proved oil and gas reserves. The merger with Gulf was at that time the largest in U.S. history. Another major branch of the family tree is The Texas Fuel Company, which was formed in Beaumont, Texas, in 1901. It later became known as The Texas Company and eventually Texaco. In 2001, the two companies merged. The acquisition of Unocal Corporation in 2005 strengthened Chevron's position as an energy industry leader, increasing their crude oil and natural gas assets around the world. Chevron is the second‐largest U.S.‐based integrated energy company, producing crude oil, natural gas and many other products essential for progress. Chevron‐branded products are sold in more than 7,500 retail locations in the United States, primarily on the West Coast and in the South. Chevron also supplies more than 2,000 service stations in southern and eastern states with Texaco‐branded fuel. Chevron's five U.S. refineries have the capacity to process more than 941,000 barrels of oil per day. Here are some other highlights of the U.S. operations:
• Chevron was the third‐largest hydrocarbon producer in the United States in 2009.
• In 2009, Chevron was once again ranked No. 1 in net oil‐equivalent production in California.
• Chevron operates a U.S. pipeline network of more than 10,800 net miles (17,300 km) of pipelines.
• They are a leading developer, manufacturer and marketer of lubricant and fuel oil additives.
• The California‐based Chevron Shipping Co. manages approximately 2,500 deep‐sea tanker voyages per year.
• Through 50 percent‐owned Chevron Phillips Chemical Company LLC, they're one of the world's leading producers of chemicals.
• Chevron Mining owns mines that produce coal and molybdenum, a mineral used in steel production.
• Chevron generate and sell power at plants in California, Nevada and Wyoming.
136
During 2009, Chevron produced an average of 717,000 barrels of net oil‐equivalent per day, representing approximately 27 percent of the companywide total. Chevron Project Locations The company's major producing operations in the United States are in California, the Gulf of Mexico, Louisiana, Texas, New Mexico, the Rocky Mountains and Alaska. As of the end of 2009, Chevron was the largest leaseholder in the Gulf of Mexico. Chevron is one of the largest producers of crude oil and natural gas on the U.S. Gulf of Mexico shelf, achieving an average daily net production during 2009 of 51,000 barrels of crude oil, 428 million cubic feet of natural gas and 9,000 barrels of natural gas liquids. Chevron drilled 36 development and delineation wells which help map oil and natural gas formations in the earth during 2009 and participated with partners in four deep‐gas exploration wells. Flatrock, one of the company's largest deep‐gas developments, is a multiple‐reservoir development below the Chevron‐operated Tiger Shoal Field. Flatrock has benefited from the proximity of existing shelf infrastructure, reaching maximum production in August 2009 following its discovery in mid‐2007. Chevron is one of the leading leaseholders in the deepwater Gulf of Mexico, averaging net daily production of 97,000 barrels of crude oil, 56 million cubic feet of natural gas and 6,000 barrels of natural gas liquids during 2009. In 2009, Chevron reached peak production rates on two significant new deepwater developments Blind Faith and Tahiti. Chevron has a 75 percent interest in and operates the Blind Faith Field. It is Chevron's deepest offshore facility, located in 6,500 feet (1,981 m) of water. Ramp‐up to the daily peak production of 70,000 barrels of oil‐equivalent was reached in March 2009. Total daily production in 2009 averaged 51,000 barrels of crude oil (38,000 net) and 34 million cubic feet of natural gas (25 million net). The company's remaining deepwater production was from the mature Genesis, Petronius and Perseus fields and the nonoperated Mad Dog Field. Chevron holds a 56.7 percent interest in Genesis and a 50 percent interest in Petronius. The company operates both. In 2009, Genesis averaged total production of 10,000 barrels of crude oil per day (5,000 net) and 12 million cubic feet of natural gas (6 million net) per day. At Petronius, total daily production averaged 24,000 barrels of crude oil (10,000 net) and 23 million cubic feet of natural gas (10 million net), including production from the nearby Perseus Field.
California Chevron is the largest producer in net oil‐equivalent in California, at 211,000 barrels per day in 2009. Daily production in 2009 averaged 191,000 barrels of crude oil, 91 million cubic feet of natural gas and 5,000 barrels of natural gas liquids. The majority of the production is from Chevron‐operated leases that are part of three major crude oil fields in the San Joaquin Valley Kern River, Midway Sunset and Cymric. In 2009, the total daily production from these leases was 147,000 barrels per day (145,000 net) and 14 million cubic feet of natural gas (14 million net). Heavy oil makes up about 84 percent of the crude oil production in the California fields, so Chevron continues to employ steam flooding in the recovery of these reserves. Chevron has crude oil resources in diatomite reservoirs in the San Joaquin Valley at Lost Hills, Cymric, McKittrick and Midway Sunset fields. Formed from the skeletons of prehistoric microorganisms called diatoms, diatomite is an unconventional reservoir rock with very high porosity and low permeability from which production can be difficult. In 2009, approximately 21 percent of the company's net oil‐equivalent production in California was derived from these diatomite reservoirs.
137

At San Ardo, Chevron operates a multiyear major capital project designed to boost crude oil production using the company's latest steamflood technology, including automation tools, operations software and an elaborate water management strategy, that includes creating artificial wetlands. The main construction phase of the project is essentially complete, although steamflood expansion is expected to continue. In 2009, the company's daily net U.S. production outside California and the Gulf of Mexico averaged 94,000 barrels of crude oil, 824 million cubic feet of natural gas and 31,000 barrels of natural gas liquids. Chevron is part of the fabric of California. The company’s roots go back 130 years to the first major discovery of oil near Los Angeles. Today, the company is a global energy leader, and The company’s commitment to California remains strong and vibrant.
Midcontinent and Alaska Chevron operates producing fields in the midcontinental United States primarily in Colorado, New Mexico, Oklahoma, Texas and Wyoming and in Alaska. The company also holds interests in these and several other states. Chevron is one of the largest hydrocarbon producers in the Permian Basin of West Texas. In Alaska, Chevron operates 10 platforms and five natural gas producing fields in the Cook Inlet Basin. And the company has operated and nonoperated working interests on the North Slope.
138
Exhibit Twenty Seven Occidental: Occidental Petroleum Corporation is an international oil and gas exploration and production company, and its OxyChem subsidiary is a major North American chemical manufacturer. The company is the fourth‐largest U.S. oil and gas company, based on market capitalization of $66 billion at year‐end 2009, with nearly 30,000 employees and contractors on four continents. Oxy is committed to respecting the environment, maintaining safety and upholding high standards of social responsibility throughout the company's worldwide operations. Oxy's success is built on technical expertise, business acumen, strong partnerships and proven ability to deliver superior results. Oxy engages in oil and natural gas exploration and production in three core regions: the United States, Middle East/North Africa and Latin America. The company is a worldwide leader in applying advanced technology to boost production from mature oil and natural gas fields and access hard‐to‐reach reserves. The company is consistently replaced and expanded reserves through improved recovery, strategic acquisitions and focused exploration. Oxy’s Midstream, Marketing and Other segment gathers, treats, processes, transports, stores, purchases and markets crude oil (including NGLs and condensate), natural gas, carbon dioxide (CO2) and power. It also trades around its assets, including pipeline and storage capacity, and trades commodities and securities. Oxy's Midstream, Marketing and Other segment transports produced oil and natural gas to market. Centurion Pipeline is an oil‐gathering, common carrier pipeline and storage system with approximately 2,750 miles of pipelines extending from southeast New Mexico across the Permian Basin of southwest Texas to Cushing, Oklahoma. Occidental’s Product Location Occidental has operations at the following locations: Elk Hills, California; Hugoton, Kansas; Permian Basin; Piceance Basin; THUMS; Tidelands, California; Vintage. California Elk Hills: Oxy's majority interest in the giant Elk Hills field is a key factor in the company's position as the largest natural gas producer and second‐largest oil producer in California. Located in the southern portion of California's San Joaquin Valley, Elk Hills is one of the largest oil and natural gas fields in the United States. Elk Hills exemplifies Oxy's focus on acquiring large, long‐lived properties and, by applying enhanced oil recovery techniques, continuing to increase production in mature fields. Elk Hills is Oxy’s largest California operation with 538 million barrels of oil equivalent (BOE) of current proved reserves, 70 percent of Oxy’s total reserves in the state. Since acquiring Elk Hills, a former U.S. National Strategic Petroleum Reserve, in 1998, Oxy has produced 400 million BOE and achieved reserves replacement of approximately 125 percent. Oxy has customized a range of recovery techniques to the field's complex reservoirs, transforming this once declining asset into the largest natural gas producer in California. Elk Hills has been recognized for outstanding environmental stewardship by the State of California and environmental organizations including the Wildlife Habitat Council, California Climate Action Registry,
139

California Department of Conservation and the U.S. Environmental Protection Agency. Elk Hills programs and initiatives include the preservation of endangered species habitats, emissions reduction, waste minimization and recycling, and cultural resource preservation. Hugoton: Oxy owns a 1.4 million‐acre position in the Hugoton field spanning southwest Kansas and the Oklahoma panhandle. Oxy is maximizing production in Hugoton through a variety of advanced technologies, such as 3‐D seismic techniques, water flooding, infill drilling, recompletions and fracture stimulation. Permian Basin: Oxy produces oil, natural gas and natural gas liquids in the Permian Basin of southwest Texas and southeast New Mexico. The Permian Basin is one of the largest and most active oil basins in the United States, with the entire basin accounting for approximately 19 percent of total U.S. oil production. Oxy's position in the Permian Basin makes the company the largest oil producer in Texas and New Mexico. Approximately 58 percent of Oxy's Permian Basin oil production is from fields that actively employ the application of carbon dioxide (CO2) flood technology, an enhanced oil recovery (EOR) technique in which Oxy is an acknowledged leader. Significant development activity is under way on several CO2 projects, including implementation of new floods and expansion of existing CO2 floods. Piceance Basin: Oxy's position in the Piceance Basin in western Colorado comprises more than 120,000 acres. Oxy has owned interests in the Piceance, one of the largest natural gas reserves in the country, since the 1970s. Oxy is maximizing production in the Piceance Basin through a variety of advanced technologies, such as infill drilling, recompletions and fracture stimulation. THUMS: Oxy THUMS comprises four man‐made islands in Long Beach Harbor, California. THUMS encompasses a portion of the giant Wilmington field, which was discovered in 1932. When Oxy acquired THUMS in 2000, it retained the name derived from the original consortium of operators: Texaco, Humble, Unocal, Mobil and Shell. Under the terms of a partnership agreement between THUMS Long Beach, the city of Long Beach and the state of California, THUMS was designed to blend in with the surrounding coastal environment. Drilling rigs and other above‐ground equipment are camouflaged and sound‐proofed, and wellheads and pipelines are located below ground to ensure that the islands enhance the appearance of both harbor and skyline. Tidelands: Tidelands Oil Production Company was acquired by Oxy in 2006. Tidelands is a California State‐licensed full‐service oil and gas production contractor that operates the West Wilmington Field in Long Beach, California, for the City of Long Beach. Tidelands' onshore production facilities and drilling operations are located around the Port of Long Beach, near Oxy's THUMS operation. Vintage: Vintage California is composed of Oxy's California assets, excluding Elk Hills, THUMS and Tidelands. The combined Vintage properties produce oil and gas from more than 50 fields encompassing approximately
140

1 million acres, including both developed and undeveloped acreage, primarily located in the Ventura, San Joaquin and Sacramento basins.
141
Exhibit Twenty Eight Product Re‐Coat Process Pipeline recoating has been an ongoing process since underground pipelines have been coated. Today 75% of pipelines have a mature pipe coating that is aging well in some environments and aging badly in other environments. When the pipeline coating reaches “failure mode” ‐ when the cathodic protection is no longer able to protect the pipeline due to the coating deterioration ‐ recoating is usually the most economical option. Recoating can be performed in the ditch with the pipe in service, in the ditch with the pipe out of service or out of the ditch with the pipe out of service. Again, the selection is based upon economics and safety considerations. Pipeline recoating consists of several logical steps that must be followed to ensure a successful recoating project. These steps will vary a bit depending on the complexity or size of the project. The steps are as follows:
• Determine the extent of the area to be recoated and the effect on the surrounding work area.
• Determine what environmental issues exist or may exist at the recoating site(s).
• Determine the expected conditions to be encountered after the pipe is exposed and excavated.
• Determine if additional measures such as select fill, tenting, etc. will be required.
• Determine to the best of one’s ability the expected added or hidden costs or delays based on previous projects.
Recoating becomes necessary when the coating on the existing pipeline nears the end of its life or has already failed. Coating failure happens after some many years of service and may be accelerated by soil stress, higher than designed operating temperatures and initial coating selection. Prior to recoating the pipeline operator has several options;
• Increase the output of the existing cathodic protection • Additional conventional cathodic protection • Distributed anode or linear anode cathodic protection
These solutions are only a temporary solution to recoating, however they may give the owner 1 to 20 more years before recoating is necessary and there is total coating failure. CP & coating synergies – as well coated underground pipeline requires very little cathodic protection current. As the coating ages this current demand or requirement increases and additional current is applied to the pipeline. Eventually the amount of current required becomes excessive (as the coating goes into failure mode) and recoating becomes the next step. When recoating, the following process is normally followed:
• Clear and mow site and adjacent area to provide safe work area
• Locate pipeline and make appropriate notifications
• Excavate pipeline leaving supports in at required intervals
• Remove coating per approved method & dispose of coating per requirements
142

• Abrasive blast pipeline to required cleanliness level
• Inspect pipe for defects
• Reblast if necessary
• Coat pipe per specifications
• Inspect & holiday test after coating
• Backfill pipe and remove supports and recoat those areas
• Restore area and perform resurvey to ensure pipeline protected As pipelines age recoating and rehabilitation will be the choice for pipeline operators to ensure their pipelines remain operable as designed for the next 50+ years. Recoating itself is not the only answer, a practical integrity management plan is necessary for the pipeline operator to have a long term rehabilitation program and incorporate the recoating into that plan. A good plan incorporates cathodic protection upgrades, selective pipe replacement/upgrading, recoating as well as an internal inspection program where practical (Didas, Jeffery).
143
Supporting NACE Article
144
PIPELINE RECOATING GENERAL DISCUSSION Pipeline recoating consists of several logical steps that must be followed to ensure a successful recoating project. These steps will vary a bit depending on the complexity or size of the project. The steps are as follows: • Determine the extent of the area to be recoated and the effect on the surrounding work area. • Determine what environmental issues exist or may exist at the recoating site(s). • Determine the expected conditions to be encountered after the pipe is exposed and excavated. • Determine if additional measures such as select fill, tenting, etc. will be required. • Determine to the best of one’s ability the expected added or hidden costs or delays based on previous projects. Recoating Area The total recoat area calculation is necessary to determine various costs and project complexity. The greater the length of recoating, the longer the project will take. The type and size of the workforce needed to complete this size project and the amount of project management and project inspection will be affected. The area or footprint of the recoating project will also affect the costs due to landowner issues, excavation requirements; spoil pile management and effect on the surrounding community. A narrow right of way may require the excavated material to be temporarily hauled off to allow adequate room to perform the recoating project. The proximity of homes or businesses may require screening or windbreaks to minimize the effects of blasting and coating operations. Access to / from the recoat site is also an issue again depending on right of way or easement requirements. Finally landowner issues will need to be addressed during the entire project. Environmental Issues Environmental issues are a major component of any recoating project. The major item one needs to address are the actual area that will be disturbed during the recoating process, the existing coating on the pipeline that will be removed, if any soil contamination exists and again site access. Disturbed Area – wetlands, naturally occurring asbestos soils, paved areas, built up areas and archeological sensitive areas all affect the way you can disturb the soil and excavate the pipeline. Permitting, complex excavation schemes, special handling of spoil materials, etc. can affect the project. Existing Coating – the existing coating type will also affect the project. Coating containing asbestos requires special removal and handling and disposal. Coatings that contain carcinogens also require special removal, handling and disposal. Soil Contamination – If the existing soil is contaminated, then the removal, handling, storage and disposal or reuse of the soil will require special attention. Environmental Conditions After the pipe is exposed and excavated various conditions may exist that will affect the project. If the pipe was installed in a “shot” ditch then additional rock may be needed to be removed using mechanical means (jack hammering, hammer hoe, etc.) which will add the
145
project costs. Wet (flowing water) conditions will require pumps to keep the ditch dry will add to the project costs. A deep or unstable ditch may require shoring or a trench box which will also add to the project costs. Weather and time of year will also affect the project – wet weather, humid conditions (sweating pipe) hot weather, cold weather, dry weather may cause delays to the project and may require tenting, heaters, fans, specialized pipeline heating equipment, special coatings designed for the environment or working during unusual hours to avoid the conditions will also affect the project costs.. Additional Measures Additional measures to perform the recoating may also be necessary. Again items such as dust control, tenting, pipeline preheating, use of select backfill, use of rockshield, site restoration, dealing with regulatory agencies and a lot of these issues that always seem to pop up on a project will also affect the project costs. . Hidden Costs or Hidden Delays Using the experience of previous projects, the various hidden costs or hidden delays can hopefully be minimized or eliminated with proper project planning and execution. Hidden costs or delays are driven by contract language, mobilization delays, past issues with landowners and company personnel, regulator awareness and additional permit requirements. When to Recoat Recoating becomes necessary when the coating on the existing pipeline nears the end of its life or has already failed. Coating failure happens after some many years of service and may be accelerated by soil stress, higher than designed operating temperatures and initial coating selection. Prior to recoating the pipeline operator has several options; Increase the output of the existing cathodic protection Additional conventional cathodic protection Distributed anode or linear anode cathodic protection These solutions are only a temporary solution to recoating, however they may give you 1 to 20 more years before recoating is necessary and you have total coating failure. CP & coating synergies – as well coated underground pipeline requires very little cathodic protection current. As the coating ages this current demand or requirement increases and additional current is applied to the pipeline. Eventually the amount of current required becomes excessive (as the coating goes into failure mode) and recoating becomes the next step. Why Recoat Recoating is performed for many reasons, with the primary one being coating failure. We also recoat due to the following: • When cathodic protection (CP) is not effective • When cost to apply/install CP is excessive • When recoating lengths are short • When paving/permanent construction activities will restrict future access
146

• When the economics are favorable Recoating Problems & Issues In addition the following are common issues & problems encountered during a recoating project: • Removal & disposal of original coating. • Pipeline operations – sweating pipe. • Qualified contractors – competent craftsman. • Pipeline defects & repairs • Coating material. • Tie in to original (parent) coating. • Quality inspection. To address these issues, the following concepts are used; Develop a regulatory acceptable coating removal, handling & disposal plan. Schedule recoating operations during the fall or winter or late in the day to minimize pipeline sweating issues or use a moisture compatible coating. Develop an alliance with your pipeline contractors and keep the recoating competent craftsman engaged year round or partner with other pipeline operators to use the same contractors. Plan to encounter pipeline defects and have the resources available to perform necessary repairs. Use the coating materials available today that provide acceptable cure times, backfill protection and a 50+ year projected life. Establish a universal system to allow tie into the original (parent) coating. Develop in house or contractor certifications and documented experience to maintain and grow a competent inspection program and work force. Recoating Process When recoating, the following process is normally followed: • Clear and mow site and adjacent area to provide safe work area • Locate pipeline and make appropriate notifications • Excavate pipeline leaving supports in at required intervals • Remove coating per approved method & dispose of coating per requirements • Abrasive blast pipeline to required cleanliness level • Inspect pipe for defects
147

• Reblast if necessary • Coat pipe per specifications • Inspect & holiday test after coating • Backfill pipe and remove supports and recoat those areas • Restore area and perform resurvey to ensure pipeline protected CASE HISTORY The decision to recoat this pipeline was based on the coating reaching failure mode. Cathodic protection was not achieving the required protection for this pipeline. Additional Cathodic protection was installed however the coating would not support this additional Cathodic protection and recoating became the only option. • 32” Steel Products Pipeline • Installed 1963 • Asphalt Enamel Coating • Clay/Loam mix soil • Initial recoating length – 465 m (1525 feet) • Final recoat length – 602 m (1975 feet) • Pipeline was recoated until a -1.00 volt pipe to soil potential was achieved at each end of the recoat site and sound coating to tie into was located. • Coated with 100% solids, epoxy-urethane coating applied to 0.50 mm to 0.75 mm (20 to 30 mils) • Pipe was abrasive blasted to NACE/SSPC SP-10 near white blast and a surface profile of 75 to 125 microns (3 to 5 mils) was achieved. Background: The CP current demand in this area had been increasing over the past several years indicating the coating was failing. Several anomaly digs were performed in this area to investigate ILI suspected defects. During the dig process disbonded and failed coating – see Figure 1 was discovered. The defects discovered during the anomaly investigation process were also indicative of the coating failing and the CP becoming ineffective. This coating being asphalt enamel has a normal service life of 20 to 30 years. This coating being 45 years old was well past its expected service life and had actually performed well up to the last few years.
148
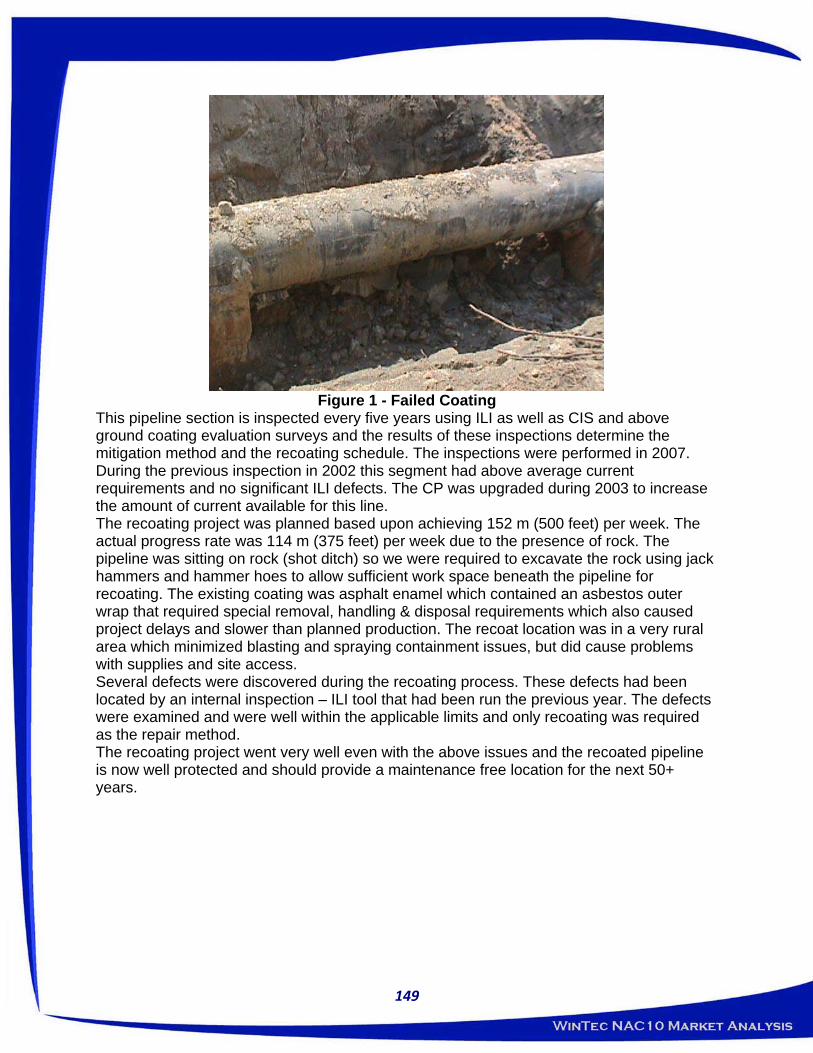
Figure 1 - Failed Coating
This pipeline section is inspected every five years using ILI as well as CIS and above ground coating evaluation surveys and the results of these inspections determine the mitigation method and the recoating schedule. The inspections were performed in 2007. During the previous inspection in 2002 this segment had above average current requirements and no significant ILI defects. The CP was upgraded during 2003 to increase the amount of current available for this line. The recoating project was planned based upon achieving 152 m (500 feet) per week. The actual progress rate was 114 m (375 feet) per week due to the presence of rock. The pipeline was sitting on rock (shot ditch) so we were required to excavate the rock using jack hammers and hammer hoes to allow sufficient work space beneath the pipeline for recoating. The existing coating was asphalt enamel which contained an asbestos outer wrap that required special removal, handling & disposal requirements which also caused project delays and slower than planned production. The recoat location was in a very rural area which minimized blasting and spraying containment issues, but did cause problems with supplies and site access. Several defects were discovered during the recoating process. These defects had been located by an internal inspection – ILI tool that had been run the previous year. The defects were examined and were well within the applicable limits and only recoating was required as the repair method. The recoating project went very well even with the above issues and the recoated pipeline is now well protected and should provide a maintenance free location for the next 50+ years.
149

150
Photo – Typical Pipeline Recoating Scenario
DISCUSSION As pipelines age recoating and rehabilitation will be the choice for pipeline operators to ensure their pipelines remain operable as designed for the next 50+ years. Recoating itself is not the only answer, a practical integrity management plan is necessary for the pipeline operator to have a long term rehabilitation program and incorporate the recoating into that plan. A good plan incorporates cathodic protection upgrades, selective pipe replacement/upgrading, recoating as well as an internal inspection program where practical. SUMMARY AND CONCLUSIONS The above case history is actual example of a recoating program that has been ongoing since 1999 and will continue for the next several decades. This segment in the case history was inspected in 2007 and the repairs and recoating performed in 2008. Recoating while not inexpensive, is normally a better value than pipeline replacement. Recoating issues that will affect industry involve finding competent recoating/rehabilitation contractors and properly qualified inspectors. Coating materials available today are formulated for in the ditch or over the ditch recoating and offer a superior material with an acceptable cure time (one to four hours) and excellent backfill protection with or without rockshield.