NAB Charitable Giving Index · NAB Charitable Giving Index ... Relative to incomes, however, the...
16
1 NAB Charitable Giving Index Indepth report – 12 months to February 2015 n Giving to charity grew by just 2% over the year to February 2015, down from 10% at the same time last year. Growth slowed in most age groups (except 65+), in all regions and there was significant divergence in the rate of charitable giving growth across charity categories (Chart 1). The slowdown in giving mirrors some key findings from our Consumer Anxiety Reports which shows that Australians are responding to heightened stress by cutting back spending on “non essentials”, including charitable donations (Chart 2). Slower growth in charitable donations has also occurred against a backdrop of below trend economic growth and rising unemployment. Despite these challenges, the average donation size for all charities increased by $2 over the past year to $336 per donor, with nearly all charity sectors experiencing an increase in average donation size. For this update, we have undertaken a review of charity categorisations (Table 1) to improve how charities are represented in the publication. This has resulted in some changes, with around 50% of the “Other” category re- allocated to a new “Charitable Lotteries” category. Despite this change, Humanitarian Services charities continue to attract by far the biggest (albeit declining) share of all charity donations (35%). Finally, we continue to see a very strong relationship between average dollar giving and average incomes with the affluent suburbs of Middle Park (3206), Bellevue Hill (2023) and Hunters Hill (2110) leading the country for generosity. Relative to incomes, however, the suburbs of Castlemaine (3450), Sturt (5047) and Fitzroy North (3068) lead the way for charity. - Alan Oster, Group Chief Economist, NAB n The NAB Charitable Giving Index provides a clear window into people’s contribution to charities – playing an important role in helping the not-for-profit sector realise the giving potential in Australia. The Index is also a powerful indicator of how people are giving to their charities. Mobile apps and web-based charities are changing the landscape and revolutionising the way people donate. With more seamless channels for donation, and a much stronger desire to give digitally, it’s important for charities to understand this shift in behaviour. We’re committed to continuing to support the not-for-profit sector play a vital role in helping our communities prosper and this includes providing real insights into giving trends. I look forward to sharing further insights in our next release, due in six months. - Rebecca Kotow, Head of Community Engagement, NAB Table 1. Charity categories Categories Examples of charities included Animals & Environment RSPCA; WWF Australia; Australian Conservation Foundation Cancer Cancer Council Donations; The Movember Group; Peter MacCullum Cancer Centre Community Service & Children/Family The Salvation Army; St Vincent de Paul; The Smith Family; Brotherhood of St Laurence Health & Disability Diabetes Australia; Fred Hollows Foundation; Vision Australia; Guide Dogs Australia Humanitarian Services World Vision; Oxfam; Red Cross Medical Research & Services Heart Research Institute; Royal Flying Doctor Service Charitable Lotteries* Boystown Lottery; Mater Prize Home; RSL Art Union Other** Everyday Hero, Go Fundraise, mycause.com.au *Charitable Lotteries has been extracted from the “Other” charities and will now feature as a standalone category. **Other includes charity aggregators and other charities that do not fit into any of the categories above. Chart 1: Growth in NAB Charitable Giving Index (percentage change, year-on-year) 12 10 8 6 4 2 0 2013 2014 2015 2012 Chart 2: Overall changes in spending behaviour (net balance) Groceries Savings, investments, super Children Use of credit Home improvements Travel Personal goods Charitable donations Eating out Major household items Entertainment Spending less Spending more Paying off debt Utilities Medical expences Transport -40 -20 -30 -10 0 10 Source: NAB Consumer Anxiety Report Q1 2015
Transcript of NAB Charitable Giving Index · NAB Charitable Giving Index ... Relative to incomes, however, the...

1
NAB Charitable Giving IndexIndepth report – 12 months to February 2015
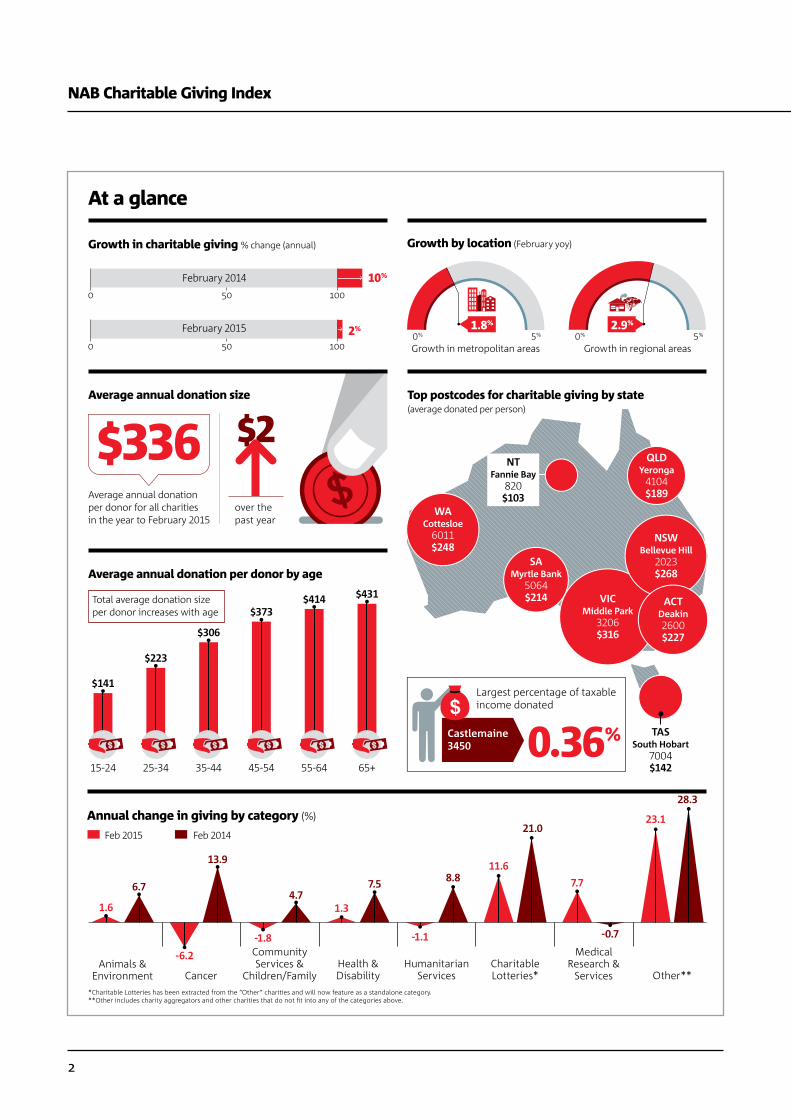
n Giving to charity grew by just 2% over the year to February 2015, down from 10% at the same time last year. Growth slowed in most age groups (except 65+), in all regions and there was significant divergence in the rate of charitable giving growth across charity categories (Chart 1).
The slowdown in giving mirrors some key findings from our Consumer Anxiety Reports which shows that Australians are responding to heightened stress by cutting back spending on “non essentials”, including charitable donations (Chart 2). Slower growth in charitable donations has also occurred against a backdrop of below trend economic growth and rising unemployment.
Despite these challenges, the average donation size for all charities increased by $2 over the past year to $336 per donor, with nearly all charity sectors experiencing an increase in average donation size.
For this update, we have undertaken a review of charity categorisations (Table 1) to improve how charities are represented in the publication. This has resulted in some changes, with around 50% of the “Other” category re-allocated to a new “Charitable Lotteries” category. Despite this change, Humanitarian Services charities continue to attract by far the biggest (albeit declining) share of all charity donations (35%).
Finally, we continue to see a very strong relationship between average dollar giving and average incomes with the affluent suburbs of Middle Park (3206), Bellevue Hill (2023) and Hunters Hill (2110) leading the country for generosity. Relative to incomes, however, the suburbs of Castlemaine (3450), Sturt (5047) and Fitzroy North (3068) lead the way for charity.
- Alan Oster, Group Chief Economist, NAB
n The NAB Charitable Giving Index provides a clear window into people’s contribution to charities – playing an important role in helping the not-for-profit sector realise the giving potential in Australia.
The Index is also a powerful indicator of how people are giving to their charities. Mobile apps and web-based charities are changing the landscape and revolutionising the way people donate. With more seamless channels for donation, and a much stronger desire to give digitally, it’s important for charities to understand this shift in behaviour.
We’re committed to continuing to support the not-for-profit sector play a vital role in helping our communities prosper and this includes providing real insights into giving trends. I look forward to sharing further insights in our next release, due in six months.
- Rebecca Kotow, Head of Community Engagement, NAB
Table 1. Charity categories
Categories Examples of charities included
Animals & Environment
RSPCA; WWF Australia; Australian Conservation Foundation
Cancer Cancer Council Donations; The Movember Group; Peter MacCullum Cancer Centre
Community Service & Children/Family
The Salvation Army; St Vincent de Paul; The Smith Family; Brotherhood of St Laurence
Health & Disability
Diabetes Australia; Fred Hollows Foundation; Vision Australia; Guide Dogs Australia
Humanitarian Services World Vision; Oxfam; Red Cross
Medical Research & Services
Heart Research Institute; Royal Flying Doctor Service
Charitable Lotteries*
Boystown Lottery; Mater Prize Home; RSL Art Union
Other** Everyday Hero, Go Fundraise, mycause.com.au
*Charitable Lotteries has been extracted from the “Other” charities and will now feature as a standalone category. **Other includes charity aggregators and other charities that do not fit into any of the categories above.
Chart 1: Growth in NAB Charitable Giving Index (percentage change, year-on-year)
12
10
8
6
4
2
02013 2014 20152012
Chart 2: Overall changes in spending behaviour (net balance)
GroceriesSavings, investments, superChildrenUse of creditHome improvementsTravelPersonal goodsCharitable donationsEating outMajor household itemsEntertainment
Spending less
Spending morePaying o� debt
UtilitiesMedical expences
Transport
-40 -20-30 -10 0 10Source: NAB Consumer Anxiety Report Q1 2015
2
Average annual donation per donor for all charities in the year to February 2015
over the past year
$336 $2Average annual donation size
Average annual donation per donor by age
$431$414$373
$306
$223
$141
1.8% 2.9%
Growth in metropolitan areas Growth in regional areas
Growth by location (February yoy)
10%
2%
Growth in charitable giving % change (annual)
Top postcodes for charitable giving by state(average donated per person)
0.36%Castlemaine 3450
Largest percentage of taxable income donated
February 2014
February 2015
At a glance
Annual change in giving by category (%)
Cancer
Community Services &
Children/FamilyHealth & Disability
Humanitarian Services
Charitable Lotteries*
Medical Research &
Services Other**Animals &
Environment
Feb 2015 Feb 2014
1.6
6.7
-6.2
13.9
-1.8
4.71.3
7.5
-1.1
8.811.6
21.0
7.7
-0.7
23.1
28.3
0 50 1000% 5% 0% 5%
0 50 100
*Charitable Lotteries has been extracted from the “Other” charities and will now feature as a standalone category. **Other includes charity aggregators and other charities that do not �t into any of the categories above.
VICMiddle Park
3206$316
QLDYeronga
4104$189
TASSouth Hobart
7004$142
SAMyrtle Bank
5064$214
WACottesloe
6011$248
NSWBellevue Hill
2023$268
ACTDeakin2600$227
NTFannie Bay
820$103
15-24 25-34 35-44 45-54 55-64 65+
Total average donation size per donor increases with age
NAB Charitable Giving Index

3
Indepth report
Growth in charitable giving has slowed sharply as consumers allocate less of their household spending to “non essentials”, including charitable donations.Giving to charity grew by just 2% over the year to February 2015, down from 10% at the same time last year (Table 2). This slowdown mirrors recent findings from NAB’s Consumer Anxiety Report which shows Australian consumers are responding to heightened anxiety by cutting back their spending on “non essentials”, including charitable donations (Chart 2).
Slower growth in charitable donations during this period has also occurred against a backdrop of below trend economic growth and rising unemployment, with the number of unemployed persons growing by almost 52,000 over the year to February 2015.
Charitable giving is slowing across all age groups (bar 65+) and in all regions. Growth in charitable giving is trending down across most age groups, except those aged 65+ (Chart 3).
The biggest slowdown was in the 45-54 age group, where growth slowed to 0.4% (8.9% one year earlier). Interestingly, NAB research also shows that middle-aged Australians are reporting the highest levels of consumer anxiety, especially in relation to their cost of living, which may help to explain the pull back in charitable giving over the past year.
Growth was however weakest in the 25 to 34 age group (-0.4%) and grew by just 0.8% among 15-24 year olds. During the year under review, younger Australians have faced growing employment challenges, with youth unemployment climbing to 13.7% from 12.5% a year earlier (more than double the national average). In response, NAB research reveals one area where younger Australians have also cut back is on charitable donations as growing concern over their job security underpins heightened consumer anxiety.
Table 2. Key Charitable Giving Statistics
Index (annual average) % change (annual)
Feb-14 Jan-15 Feb-15 Feb-14 Jan-15 Feb-15
NAB Charitable Giving Index 136.3 138.8 139.1 10.0 2.5 2.0
Animals & Environment 120.9 123.0 122.9 6.7 2.2 1.6
Cancer 291.0 273.1 273.0 13.9 -4.9 -6.2
Community Services & Children/Family 175.8 173.3 172.7 4.7 -1.0 -1.8
Health & Disability 205.2 206.3 207.9 7.5 2.9 1.3
Humanitarian Services 92.8 91.7 91.8 8.8 -1.2 -1.1
Charitable Lotteries 136.5 151.4 152.3 21.0 12.0 11.6
Medical Research & Services 175.2 187.8 188.7 -0.7 7.1 7.7
Other 458.4 561.8 564.1 28.3 23.4 23.1
All data is non-seasonally-adjusted (nsa). Data is produced by Quantium and includes donations via credit card, direct debit, BPAY and EFTPOS. Direct transfers into charity bank accounts are not captured (e.g. bequests and cheque donations may not be captured). Nearly 600 charity brands are included in this analysis.
15-24 years 25-34 years 35-44 years
45-54 years 55-64 years 65+ years
Chart 3: Growth in Charitable Giving Index by age group (percentage change, year-on-year)
18
15
12
9
6
3
0
-32012 2013 2014 2015
12
10
8
6
4
2
0
Metropolitan Regional
Chart 4: Growth in Charitable Giving Indexby region (percentage change, year-on-year)
2012 2013 2014 2015
4
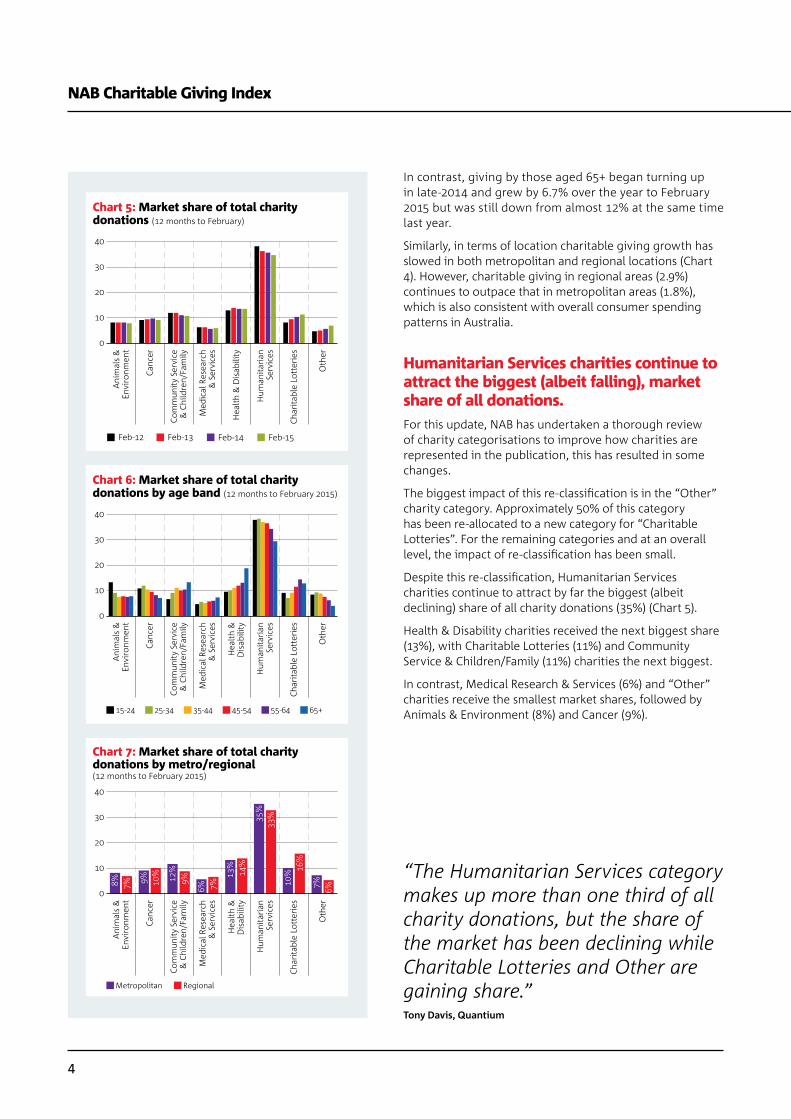
In contrast, giving by those aged 65+ began turning up in late-2014 and grew by 6.7% over the year to February 2015 but was still down from almost 12% at the same time last year.
Similarly, in terms of location charitable giving growth has slowed in both metropolitan and regional locations (Chart 4). However, charitable giving in regional areas (2.9%) continues to outpace that in metropolitan areas (1.8%), which is also consistent with overall consumer spending patterns in Australia.
Humanitarian Services charities continue to attract the biggest (albeit falling), market share of all donations.For this update, NAB has undertaken a thorough review of charity categorisations to improve how charities are represented in the publication, this has resulted in some changes.
The biggest impact of this re-classification is in the “Other” charity category. Approximately 50% of this category has been re-allocated to a new category for “Charitable Lotteries”. For the remaining categories and at an overall level, the impact of re-classification has been small.
Despite this re-classification, Humanitarian Services charities continue to attract by far the biggest (albeit declining) share of all charity donations (35%) (Chart 5).
Health & Disability charities received the next biggest share (13%), with Charitable Lotteries (11%) and Community Service & Children/Family (11%) charities the next biggest.
In contrast, Medical Research & Services (6%) and “Other” charities receive the smallest market shares, followed by Animals & Environment (8%) and Cancer (9%).
NAB Charitable Giving Index
Chart 5: Market share of total charity donations (12 months to February)
Med
ical
Res
earc
h&
Ser
vice
s
Oth
er
Canc
er
Hea
lth &
Dis
abili
ty
Hum
anita
rian
Serv
ices
Com
mun
ity S
ervi
ce&
Chi
ldre
n/Fa
mily
Ani
mal
s &
Envi
ronm
ent
Char
itabl
e Lo
tter
ies
40
30
20
10
0
Feb-13 Feb-14Feb-12 Feb-15
Chart 7: Market share of total charity donations by metro/regional (12 months to February 2015)
Hum
anita
rian
Serv
ices
Oth
er
Canc
er
Char
itabl
e Lo
tter
ies
Med
ical
Res
earc
h&
Ser
vice
s
Com
mun
ity S
ervi
ce&
Chi
ldre
n/Fa
mily
Ani
mal
s &
Envi
ronm
ent
Hea
lth &
Dis
abili
ty
40
30
20
10
0
Metropolitan Regional
35%
33%
13%
14%
6% 7%
12%
9%9% 10%
8% 7% 10% 16
%
7% 6%
Chart 6: Market share of total charity donations by age band (12 months to February 2015)
Hum
anita
rian
Serv
ices
Oth
er
Canc
er
Med
ical
Res
earc
h&
Ser
vice
s
Com
mun
ity S
ervi
ce&
Chi
ldre
n/Fa
mily
Ani
mal
s &
Envi
ronm
ent
Hea
lth &
Dis
abili
ty
40
30
20
10
0
15-24 25-34 35-44 45-54 55-64 65+
Char
itabl
e Lo
tter
ies
“The Humanitarian Services category makes up more than one third of all charity donations, but the share of the market has been declining while Charitable Lotteries and Other are gaining share.”Tony Davis, Quantium

5
Humanitarian Services charities enjoy the biggest share of donations across all age groups and regions.Humanitarian Services dominate market share of charitable giving in all age groups ranging from 29% (65+) to 38% (25 to 34 year olds) (Chart 6). In contrast, Medical Research & Services charities received the lowest share of donations from all age groups, except the over 65s, who allocated the smallest share of their total donations to “Other” charities.
Interestingly, younger Australians (aged between 15 to 34) tended to allocate a bigger share of their total giving to Humanitarian Services, Animal & Environment and Cancer charities, whereas older Australians gave more to Health & Disability, Community Service & Children/ Family charities (especially over 65s) and to Charitable Lotteries (55 to 64 year olds).
Humanitarian Services also account for the lion’s share of giving in both metropolitan and regional areas, capturing 35% and 33% of the charity market respectively (Chart 7). Within regional locations, Charitable Lotteries had the second highest market share at 16%, followed by Health & Disability (14%), Cancer (10%), Community Services (9%) and Animals & Environment (7%).
In metropolitan areas, Health & Disability (13%) enjoyed the second biggest market share, followed by Community Services & Children/Family (12%), Charitable Lotteries (10%), Cancer (9%) and Animals & Environment (8%). Medical Research & Services charities had the smallest market share (6%).
Charitable giving to “Other” charities is growing exceptionally quickly but giving to Cancer, Community Service & Children/Family and Humanitarian Services charities is contracting.We are seeing some significant divergence in the rate of charitable giving growth across charity categories (Chart 8).
“Other” charities are experiencing the fastest rate of growth (23.1%), and has been outperforming all other segments of the charity sector since late 2013. Solid growth was also seen in Charitable Lotteries (11.6%).
An upturn in giving to Medical Research & Services that began in late-2014 is also continuing, with growth rising to 7.7% over the year to February 2015.
In contrast, giving to Cancer fell 6.2%, well below the 13.9% increase seen over the year to February 2014. Giving to Community Service & Children/Family (-1.8%) and Humanitarian Services (-1.1%) is also contracting.
Chart 8: Growth in NAB Charitable Giving Index by category (percentage change, year-on-year)
40
30
20
10
0
-10
Cancer
Medical Research & Services
Humanitarian Services
Animals & Environment
Charitable Lotteries
Community Service & Children/Family
Health & Disability
Other Total
2012 2013 2014 2015
Chart 9A: Growth by category by age (year to February)
50
40
30
20
10
0
-10
-20
12 months to February 2015 12 months to February 2014
15 to
24
25 to
34
35 to
44
45 to
54
55 to
64
65+
15 to
24
25 to
34
35 to
44
45 to
54
55 to
64
65+
15 to
24
25 to
34
35 to
44
45 to
54
55 to
64
65+
15 to
24
25 to
34
35 to
44
45 to
54
55 to
64
65+
Animals Cancer CS & Family MedicalResearch
Chart 9B: Growth by category by age (year to February)
50
40
30
20
10
0
-10
-20
12 months to February 2015 12 months to February 2014
OtherHumanitarian LotteriesHealth &Disability
15 to
24
25 to
34
35 to
44
45 to
54
55 to
64
65+
15 to
24
25 to
34
35 to
44
45 to
54
55 to
64
65+
15 to
24
25 to
34
35 to
44
45 to
54
55 to
64
65+
15 to
24
25 to
34
35 to
44
45 to
54
55 to
64
65+
Indepth report

6
Medical Research & Services was the only charity category to experience faster growth across all age groups.Medical Research & Services were the only charity category to experience faster growth across all age groups (especially in the 25-34 and 65+ age groups) (Chart 9A and 9B). In contrast, giving slowed across all age groups in Cancer, Humanitarian Services, Health & Disability and Charitable Lotteries (although giving in this group is still growing at double-digit rates across all age groups).
Interestingly, older Australians aged 65+ (a demographic that also consistently reports among lowest levels of consumer anxiety) were the only group to report positive growth in giving across all charity categories.
Medical Research & Services was the only charity category to experience faster growth in both metro and regional areas.Growth in giving to Medical Research & Services charities was faster than in the previous year in both metropolitan and regional areas (Chart 10A and 10B).
Growth also accelerated in metropolitan areas for Health & Disability and for Community Service & Children/Family charities in regional areas.
All other charities experienced slower (or negative) growth in both metropolitan and regional areas. Particularly large falls were seen in giving to Cancer (especially in metropolitan areas where giving slowed from 14.2% over the year to February 2014 to -8.2% in the year to February 2015).
Average annual donations are greatest for Humanitarian Services and smallest for “Other”, Cancer and Medical Research charities.Over the year to February 2015, the average annual charity donation per donor increased marginally to $336, from $334 in February 2014 (Chart 11).
All categories experienced an increase in average donation size, except Medical Research & Services charities where the average donation fell from $158 to $156.
Humanitarian Services continue to receive the biggest average annual donation, growing 4.4% to $431. Community Services & Children/Family ($247), Animals & Environment ($213) and Charitable Lotteries ($212) were the next biggest.
NAB Charitable Giving Index
Chart 10A: Growth by category by region – metropolitan (year to February)
Med
ical
Res
earc
h&
Ser
vice
s
Oth
er
Canc
er
Hea
lth &
Dis
abili
ty
Hum
anita
rian
Serv
ices
Com
mun
ity S
ervi
ce&
Chi
ldre
n/Fa
mily
Ani
mal
s &
Envi
ronm
ent
Char
itabl
e Lo
tter
ies
50
40
30
20
10
0
-10
12 months to February 2015 12 months to February 2014
Chart 10B: Growth by category by region – regional (year to February)
Med
ical
Res
earc
h&
Ser
vice
s
Oth
er
Canc
er
Hea
lth &
Dis
abili
ty
Hum
anita
rian
Serv
ices
Com
mun
ity S
ervi
ce&
Chi
ldre
n/Fa
mily
Ani
mal
s &
Envi
ronm
ent
Char
itabl
e Lo
tter
ies
50
40
30
20
10
0
-10
12 months to February 2015 12 months to February 2014
12 mths to Feb 201512 mths to Feb 201412 mths to Feb 2013
Chart 11: Average annual donation per donor($A)
Med
ical
Res
earc
h&
Ser
vice
s
Oth
er
Canc
er
Tota
l
Hea
lth &
Dis
abili
ty
Hum
anita
rian
Serv
ices
Com
mun
ity S
ervi
ce&
Chi
ldre
n/Fa
mily
Ani
mal
s &
Envi
ronm
ent
Char
itabl
e Lo
tter
ies
500
400
300
200
100
0
7
The average donation to “Other” charities increased by over 5% to $119 but along with Cancer ($138) and Medical Research ($156), receives the smallest annual donation.
As part of Quantium’s regular review process, there has also been a re-alignment in how average annual donations per donor are calculated. As a result, there have been some upward revisions to average annual donations per donor relative to previous reports. Note that this only impacts the average annual donation metric, while other metrics (indices, market share and donations by postcode) are unchanged.
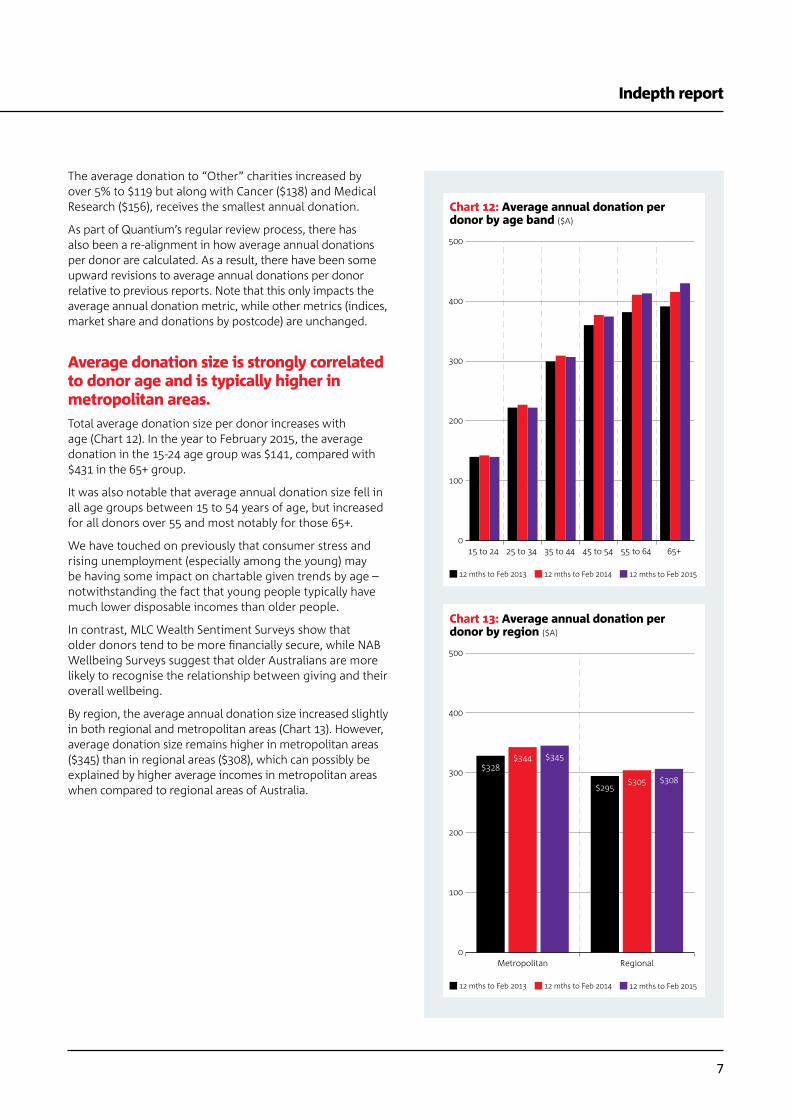
Average donation size is strongly correlated to donor age and is typically higher in metropolitan areas. Total average donation size per donor increases with age (Chart 12). In the year to February 2015, the average donation in the 15-24 age group was $141, compared with $431 in the 65+ group.
It was also notable that average annual donation size fell in all age groups between 15 to 54 years of age, but increased for all donors over 55 and most notably for those 65+.
We have touched on previously that consumer stress and rising unemployment (especially among the young) may be having some impact on chartable given trends by age – notwithstanding the fact that young people typically have much lower disposable incomes than older people.
In contrast, MLC Wealth Sentiment Surveys show that older donors tend to be more financially secure, while NAB Wellbeing Surveys suggest that older Australians are more likely to recognise the relationship between giving and their overall wellbeing.
By region, the average annual donation size increased slightly in both regional and metropolitan areas (Chart 13). However, average donation size remains higher in metropolitan areas ($345) than in regional areas ($308), which can possibly be explained by higher average incomes in metropolitan areas when compared to regional areas of Australia.
Indepth report
Chart 12: Average annual donation per donor by age band ($A)
500
400
300
200
100
015 to 24 25 to 34 35 to 44 45 to 54 55 to 64 65+
12 mths to Feb 201512 mths to Feb 201412 mths to Feb 2013
Chart 13: Average annual donation perdonor by region ($A)
500
400
300
200
100
0Metropolitan Regional
12 mths to Feb 201512 mths to Feb 201412 mths to Feb 2013
$328$344 $345
$295$305 $308
8
NAB Charitable Giving Index
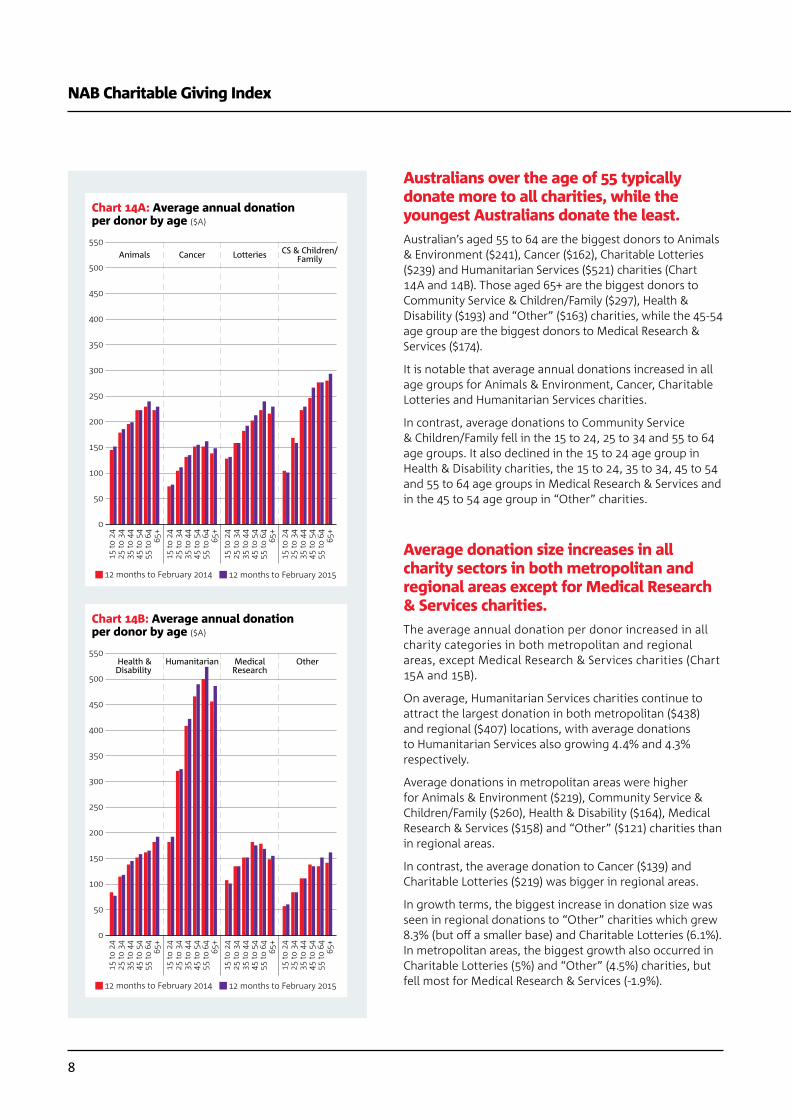
Australians over the age of 55 typically donate more to all charities, while the youngest Australians donate the least.Australian’s aged 55 to 64 are the biggest donors to Animals & Environment ($241), Cancer ($162), Charitable Lotteries ($239) and Humanitarian Services ($521) charities (Chart 14A and 14B). Those aged 65+ are the biggest donors to Community Service & Children/Family ($297), Health & Disability ($193) and “Other” ($163) charities, while the 45-54 age group are the biggest donors to Medical Research & Services ($174).
It is notable that average annual donations increased in all age groups for Animals & Environment, Cancer, Charitable Lotteries and Humanitarian Services charities.
In contrast, average donations to Community Service & Children/Family fell in the 15 to 24, 25 to 34 and 55 to 64 age groups. It also declined in the 15 to 24 age group in Health & Disability charities, the 15 to 24, 35 to 34, 45 to 54 and 55 to 64 age groups in Medical Research & Services and in the 45 to 54 age group in “Other” charities.
Average donation size increases in all charity sectors in both metropolitan and regional areas except for Medical Research & Services charities.The average annual donation per donor increased in all charity categories in both metropolitan and regional areas, except Medical Research & Services charities (Chart 15A and 15B).
On average, Humanitarian Services charities continue to attract the largest donation in both metropolitan ($438) and regional ($407) locations, with average donations to Humanitarian Services also growing 4.4% and 4.3% respectively.
Average donations in metropolitan areas were higher for Animals & Environment ($219), Community Service & Children/Family ($260), Health & Disability ($164), Medical Research & Services ($158) and “Other” ($121) charities than in regional areas.
In contrast, the average donation to Cancer ($139) and Charitable Lotteries ($219) was bigger in regional areas.
In growth terms, the biggest increase in donation size was seen in regional donations to “Other” charities which grew 8.3% (but off a smaller base) and Charitable Lotteries (6.1%). In metropolitan areas, the biggest growth also occurred in Charitable Lotteries (5%) and “Other” (4.5%) charities, but fell most for Medical Research & Services (-1.9%).
Chart 14A: Average annual donationper donor by age ($A)
550
500
450
400
350
300
250
200
150
100
50
0
12 months to February 2014 12 months to February 2015
15 to
24
25 to
34
35 to
44
45 to
54
55 to
64
65+
15 to
24
25 to
34
35 to
44
45 to
54
55 to
64
65+
15 to
24
25 to
34
35 to
44
45 to
54
55 to
64
65+
15 to
24
25 to
34
35 to
44
45 to
54
55 to
64
65+
Animals Cancer Lotteries CS & Children/Family
Chart 14B: Average annual donationper donor by age ($A)
550
500
450
400
350
300
250
200
150
100
50
0
12 months to February 2014 12 months to February 2015
15 to
24
25 to
34
35 to
44
45 to
54
55 to
64
65+
15 to
24
25 to
34
35 to
44
45 to
54
55 to
64
65+
15 to
24
25 to
34
35 to
44
45 to
54
55 to
64
65+
15 to
24
25 to
34
35 to
44
45 to
54
55 to
64
65+
Health &Disability
Humanitarian MedicalResearch
Other

9
Charitable Giving by Postcode
The average donation across all Australian postcodes was $88 per person. Middle Park (3206) in Victoria led the way, with an average donation of $316. As a share of income, Castlemaine (3450) also in Victoria was the most generous, donating 0.36%.The average donation per person across all Australian postcodes was $88 over the year to February 2015.
Among the top 20 suburbs for charitable giving nationally, the average donation was $226 per person (refer to Chart 16 to 33 for the top 20 postcodes in Australia and each state).
Middle Park (3206) in Victoria was the most generous suburb, donating on average $316 per person, or more than 3½ times the national average and around 18% more than in the next most generous suburb of Bellevue Hill NSW (2023) at $268, 20% more than third placed Hunters Hill NSW (2110) at $263 and almost 60% higher than the 20th highest suburb of Hawthorn East Victoria (3123) at $198.
We continue to see a very strong relationship between average dollar giving and average incomes. The average income in the top 20 postcodes was around $107,000, according to data from the Australian Tax Office or more than twice the national average.
Although donors from high income postcodes tend to donate more in dollar terms, they do not donate the most relative to their incomes.
Among the top 20 suburbs for charitable giving nationally as a percentage of their incomes, the average donation was 0.30% per person (compared with an average donation of 0.22% in the top 20 postcodes for dollar giving). Moreover, the average income in this group was just $59,000, around half the average of the top 20 suburbs for dollar giving.
By this measure, Castlemaine (3450) in Victoria was the most generous, donating 0.36% of their annual incomes to charity, followed by Sturt SA (5047) with 0.35%, Fitzroy North Victoria (3068) with 0.32%, Coolangatta QLD (4225) with 0.31%, Maleny QLD (4552) with 0.31%, Croydon NSW (2132) with 0.31% and Hamilton South NSW (2303) with 0.31%.
Middle Park (3206) Victoria, Fitzroy North (3068) Victoria and Myrtle Bank (5064) South Australia are the only suburbs to feature in the top 20 postcodes for charitable giving by dollar amount and as a percentage of their income. n
Indepth report
Chart 15A: Average annual donation per donor: metropolitan ($A)
450
400
350
300
250
200
150
100
50
0
Med
ical
Res
earc
h&
Ser
vice
s
Oth
er
Canc
er
Hea
lth &
Dis
abili
ty
Hum
anita
rian
Serv
ices
Com
mun
ity S
ervi
ce&
Chi
ldre
n/Fa
mily
Ani
mal
s &
Envi
ronm
ent
Char
itabl
e Lo
tter
ies
12 mths to Feb 201512 mths to Feb 201412 mths to Feb 2013
Chart 15B: Average annual donation per donor: regional ($A)
450
400
350
300
250
200
150
100
50
0
Med
ical
Res
earc
h&
Ser
vice
s
Oth
er
Canc
er
Hea
lth &
Dis
abili
ty
Hum
anita
rian
serv
ices
Com
mun
ity S
ervi
ce&
Chi
ldre
n/Fa
mily
Ani
mal
s &
Envi
ronm
ent
Char
itabl
e Lo
tter
ies
12 mths to Feb 201512 mths to Feb 201412 mths to Feb 2013

10
NAB Charitable Giving Index
*excluding postcodes with fewer than 5,000 residents
Chart 16: Top 20 postcodes for charitable giving: Australia (average spend per person, $A, 12 months to February 2015)
350
300
250
200
150
100
50
0
$316
$2
68
$263
$2
48
$245
$2
40
$227
$2
25
$219
$2
19
$215
$2
14
$209
$2
09
$208
$2
05
$202
$1
99
$199
$1
98
Mid
dle
Park
320
6Be
llevu
e H
ill 2
023
Hun
ters
Hill
211
0Co
ttes
loe
6011
Woo
llahr
a 20
25M
osm
an 2
088
Dea
kin
2600
Balm
ain
2041
Vau
clus
e 20
30A
rmad
ale
3143
Fitz
roy
Nor
th 3
068
Myr
tle B
ank
5064
Brig
hton
318
6To
orak
314
2G
ri�
th 2
603
Gor
don
2072
Padd
ingt
on 2
021
Killa
ra 2
071
Seaf
orth
209
2H
awth
orn
East
312
3
Chart 18: Top 20 postcodes for charitable giving: NSW (average spend per person, $A, 12 months to February 2015)
350
300
250
200
150
100
50
0Be
llevu
e H
ill 2
023
Hun
ters
Hill
211
0W
oolla
hra
2025
Mos
man
208
8Ba
lmai
n 20
41V
aucl
use
2030
Gor
don
2072
Padd
ingt
on 2
021
Killa
ra 2
071
Seaf
orth
209
2Li
nd�e
ld 2
070
Rose
ville
206
9Br
onte
202
4Cr
emor
ne 2
090
Pete
rsha
m 2
049
Dar
ling
Poin
t 202
7Ca
stle
crag
206
8H
amilt
on S
outh
230
3W
ahro
onga
207
6Tu
rram
urra
207
4
$268
$2
63
$245
$2
40
$225
$2
19
$205
$2
02
$199
$1
99
$197
$1
95
$194
$1
93
$186
$1
81
$181
$1
78
$175
$1
70
Chart 17: Top 20 postcodes for charitable giving: Australia (as a % of income, 12 months to February 2015)
0.40
0.35
0.30
0.25
0.20
0.15
0.10
0.05
0
Cast
lem
aine
345
0St
urt 5
047
Fitz
roy
Nor
th 3
068
Cool
anga
tta
4225
Mal
eny
4552
Croy
don
2132
Ham
ilton
Sou
th 2
303
Blax
land
277
4M
yrtle
Ban
k 50
64H
owra
h 70
18Pe
ters
ham
204
9Br
unsw
ick
East
305
7M
arri
ckvi
lle 2
204
Mac
leod
308
5M
iddl
e Pa
rk 3
206
O’C
onno
r 26
02Ki
ngsw
ood
5062
Alp
hing
ton
3078
Blac
kbur
n 31
30To
orak
Gar
dens
506
5
0.36
%
0.35
%
0.32
%
0.31
%
0.31
%
0.31
%
0.31
%
0.30
%
0.30
%
0.30
%
0.29
%
0.29
%
0.29
%
0.29
%
0.28
%
0.28
%
0.28
%
0.28
%
0.28
%
0.27
%
Chart 19: Top 20 postcodes for charitable giving: NSW (as a % of income, 12 months to February 2015)
0.40
0.35
0.30
0.25
0.20
0.15
0.10
0.05
0
Croy
don
2132
Ham
ilton
Sou
th 2
303
Blax
land
277
4Pe
ters
ham
204
9M
arri
ckvi
lle 2
204
New
Lam
bton
230
5A
lsto
nvill
e 24
77W
oy W
oy B
ay 2
256
Kato
omba
278
0G
oone
llaba
h 24
80G
ordo
n 20
72Ki
rraw
ee 2
232
Berr
y 25
35El
eeba
na 2
282
Spri
ngw
ood
2777
Stan
mor
e 20
48Su
mm
er H
ill 2
130
Mos
s V
ale
2577
Gle
be 2
037
Thor
nlei
gh 2
120
0.31
%
0.31
%
0.30
%
0.29
%
0.29
%
0.27
%
0.26
%
0.26
%
0.25
%
0.25
%
0.25
%
0.25
%
0.24
%
0.24
%
0.24
%
0.24
%
0.24
%
0.24
%
0.23
%
0.23
%

11
Indepth report
Chart 20: Top 20 postcodes for charitable giving: Victoria (average spend per person, $A, 12 months to February 2015)
350
300
250
200
150
100
50
0
Mid
dle
Park
320
6A
rmad
ale
3143
Fitz
roy
Nor
th 3
068
Brig
hton
318
6To
orak
314
2H
awth
orn
East
312
3M
alve
rn 3
144
Kew
310
1Ca
nter
bury
312
6Ca
mbe
rwel
l 312
4M
elbo
urne
300
4A
lphi
ngto
n 30
78Su
rrey
Hill
s 31
27Ba
lwyn
310
3A
shbu
rton
314
7N
orth
cote
307
0G
len
Iris
314
6Br
unsw
ick
East
305
7Sa
ndri
ngha
m 3
191
Mac
leod
308
5
$316
$2
19
$215
$2
09
$209
$1
98
$197
$1
96
$193
$1
87
$183
$1
82
$178
$1
63
$162
$1
58
$156
$1
56
$156
$1
53
Chart 22: Top 20 postcodes for charitable giving: Queensland (average spend per person, $A, 12 months to February 2015)
350
300
250
200
150
100
50
0Ye
rong
a 41
04Ch
apel
Hill
406
9A
shgr
ove
4060
Sher
woo
d 40
75Ba
rdon
406
5Pa
ddin
gton
406
4M
ooro
oka
4105
Haw
thor
ne 4
171
Wel
lingt
on P
oint
416
0Co
olan
gatt
a 42
25Sa
mfo
rd V
alle
y 45
20Th
e G
ap 4
061
Thor
nlan
ds 4
164
New
Far
m 4
005
Mal
eny
4552
Indo
oroo
pilly
406
8Co
orpa
roo
4151
Asc
ot 4
007
Clev
elan
d 41
63Ta
rrag
indi
412
1
$189
$1
75
$156
$1
46
$142
$1
41
$137
$1
36
$134
$1
34
$133
$1
32
$129
$1
25
$124
$1
24
$123
$1
20
$119
$1
18
Chart 21: Top 20 postcodes for charitable giving: Victoria (as a % of income, 12 months to February 2015)
0.40
0.35
0.30
0.25
0.20
0.15
0.10
0.05
0
Cast
lem
aine
300
0Fi
tzro
y N
orth
300
4Br
unsw
ick
East
300
6M
acle
od 3
008
Mid
dle
Park
301
1A
lphi
ngto
n 30
12Bl
ackb
urn
3013
Brun
swic
k 30
15A
shbu
rton
301
6N
orth
cote
301
8M
ontm
oren
cy 3
019
Burw
ood
3020
Burw
ood
East
302
1Es
send
on 3
023
Surr
ey H
ills
3024
Haw
thor
n Ea
st 3
025
Wat
soni
a N
orth
302
8Co
burg
302
9N
orth
Mel
bour
ne 3
030
Box
Hill
Sou
th 3
031
0.36
%
0.32
%
0.29
%
0.29
%
0.28
%
0.28
%
0.28
%
0.27
%
0.27
%
0.27
%
0.26
%
0.25
%
0.25
%
0.24
%
0.24
%
0.24
%
0.24
%
0.24
%
0.23
%
0.23
%
Chart 23: Top 20 postcodes for charitable giving: Queensland (as a % of income, 12 months to February 2015)
0.40
0.35
0.30
0.25
0.20
0.15
0.10
0.05
0
Cool
anga
tta
4225
Mal
eny
4552
Yero
nga
4104
Moo
rook
a 41
05Pa
lmw
oods
455
5Th
ornl
ands
416
4W
ellin
gton
Poi
nt 4
160
Dur
ack
4077
Sher
woo
d 40
75Ch
apel
Hill
406
9Co
oroy
456
3Bu
deri
m 4
556
Ash
grov
e 40
60Ta
mbo
rine
Mou
ntai
n 42
72D
oona
n 45
62Pe
trie
450
2Cl
onta
rf 4
019
Beer
wah
451
9Th
e G
ap 4
061
Ash
mor
e 42
14
0.31
%
0.31
%
0.27
%
0.25
%
0.25
%
0.24
%
0.23
%
0.23
%
0.23
%
0.22
%
0.22
%
0.21
%
0.21
%
0.21
%
0.21
%
0.21
%
0.21
%
0.21
%
0.21
%
0.20
%

12
NAB Charitable Giving Index
Chart 24: Top 20 postcodes for charitable giving: SA (average spend per person, $A, 12 months to February 2015)
350
300
250
200
150
100
50
0
Myr
tle B
ank
5064
Ston
yfel
l 506
6To
orak
Gar
dens
506
5Ki
ngsw
ood
5062
Med
indi
e 50
81St
Pet
ers
5069
Leab
rook
506
8M
alve
rn 5
061
Stur
t 504
7M
illsw
ood
5034
Pros
pect
508
2Be
lair
505
2N
orw
ood
5067
Hen
ley
Beac
h 50
22Pa
rksi
de 5
063
Coro
man
del V
alle
y 50
51N
orth
Hav
en 5
018
Mag
ill 5
072
Brig
hton
504
8G
lene
lg S
outh
504
5
$214
$1
96
$194
$1
93
$177
$1
77
$175
$1
67
$151
$1
50
$144
$1
44
$143
$1
38
$135
$1
33
$125
$1
24
$118
$1
18
Chart 26: Top 20 postcodes for charitable giving:WA (average spend per person, $A, 12 months to February 2015)
350
300
250
200
150
100
50
0Co
ttes
loe
6011
Clar
emon
t 601
0N
orth
Per
th 6
006
City
Bea
ch 6
015
Mou
nt L
awle
y 60
50N
edla
nds
6009
App
lecr
oss
6153
Subi
aco
6008
Mos
man
Par
k 60
12Fl
orea
t 601
4Ea
st F
rem
antle
615
8So
uth
Pert
h 61
51So
rren
to 6
020
Wes
t Lee
derv
ille
6007
New
man
675
3A
ttad
ale
6156
Tom
Pri
ce 6
751
Sout
h Fr
eman
tle 6
162
Hill
arys
602
5Co
mo
6152
$248
$1
89
$185
$1
83
$181
$1
80
$179
$1
73
$173
$1
67
$161
$1
54
$146
$1
44
$140
$1
40
$138
$1
34
$123
$1
21
Chart 25: Top 20 postcodes for charitable giving: SA(as a % of income, 12 months to February 2015)
0.40
0.35
0.30
0.25
0.20
0.15
0.10
0.05
0
Stur
t 504
7M
yrtle
Ban
k 50
64Ki
ngsw
ood
5062
Toor
ak G
arde
ns 5
065
Pros
pect
508
2St
onyf
ell 5
066
Bela
ir 5
052
Leab
rook
506
8Co
rom
ande
l Val
ley
5051
Woo
dvill
e 50
11St
Pet
ers
5069
Nor
th H
aven
501
8Br
ompt
on 5
007
Mill
swoo
d 50
34H
enle
y Be
ach
5022
Fair
view
Par
k 51
26M
edin
die
5081
Seac
li� 5
049
Brig
hton
504
8M
agill
507
2
0.35
%
0.30
%
0.28
%
0.27
%
0.26
%
0.26
%
0.26
%
0.26
%
0.25
%
0.25
%
0.25
%
0.25
%
0.24
%
0.24
%
0.24
%
0.24
%
0.23
%
0.23
%
0.23
%
0.23
%
Chart 27: Top 20 postcodes for charitable giving: WA (as a % of income, 12 months to February 2015)
0.40
0.35
0.30
0.25
0.20
0.15
0.10
0.05
0
Nor
th P
erth
600
6M
ount
Law
ley
6050
East
Fre
man
tle 6
158
App
lecr
oss
6153
Flor
eat 6
014
Sorr
ento
602
0H
illar
ys 6
025
Dia
nella
605
9W
inth
rop
6150
Sout
h Fr
eman
tle 6
162
Dun
sbor
ough
628
1In
glew
ood
6052
Subi
aco
6008
Clar
emon
t 601
0Ka
lam
unda
607
6Co
mo
6152
Rive
rton
614
8A
ttad
ale
6156
Sout
h Pe
rth
6151
Carr
amar
603
1
0.26
%
0.22
%
0.20
%
0.20
%
0.20
%
0.20
%
0.19
%
0.19
%
0.19
%
0.19
%
0.19
%
0.19
%
0.18
%
0.18
%
0.18
%
0.18
%
0.18
%
0.18
%
0.18
%
0.18
%

13
Indepth report
Chart 28: Top 20 postcodes for charitable giving:Tasmania (average spend per person, $A, 12 months to February 2015)
350
300
250
200
150
100
50
0
Sout
h H
obar
t 700
4H
owra
h 70
18Sa
ndy
Bay
7005
Wes
t Hob
art 7
000
Mar
gate
705
4Bl
ackm
ans
Bay
7052
Lind
isfa
rne
7015
King
ston
705
0N
ew T
own
7008
Rane
lagh
710
9La
unce
ston
725
0U
lver
ston
e 73
15W
ynya
rd 7
325
Wes
t Moo
nah
7009
Clar
emon
t 701
1D
evon
port
731
0So
uth
Laun
cest
on 7
249
Latr
obe
7307
Mon
tello
732
0Sm
ithto
n 73
30
$142
$1
39
$133
$1
08
$104
$1
02
$102
$1
01
$96
$86
$77
$70
$70
$68
$63
$60
$59
$57
$53
$45
Chart 30: Top 20 postcodes for charitable giving:ACT (average spend per person, $A, 12 months to February 2015)
350
300
250
200
150
100
50
0D
eaki
n 26
00G
ri�
th 2
603
Hug
hes
2605
O’C
onno
r 26
02Fa
rrer
260
7Ch
apm
an 2
611
Haw
ker
2614
Nar
rabu
ndah
260
4Ca
mpb
ell 2
612
Kam
bah
2902
Mon
ash
2904
Mac
greg
or 2
615
Kale
en 2
617
Lyon
s 26
06W
anni
assa
290
3N
icho
lls 2
913
Har
riso
n 29
14G
ordo
n 29
06Ca
lwel
l 290
5Ci
ty 2
601
$227
$208
$179
$178
$170
$168
$154
$152
$143
$132
$126
$115
$114
$111
$106
$91
$88
$81
$78
$57
Chart 29: Top 20 postcodes for charitable giving: Tasmania (as a % of income, 12 months to February 2015)
0.40
0.35
0.30
0.25
0.20
0.15
0.10
0.05
0
How
rah
7018
Sout
h H
obar
t 700
4Ki
ngst
on 7
050
Sand
y Ba
y 70
05Li
ndis
farn
e 70
15M
arga
te 7
054
Rane
lagh
710
9Bl
ackm
ans
Bay
7052
Wes
t Hob
art 7
000
New
Tow
n 70
08U
lver
ston
e 73
15W
ynya
rd 7
325
Laun
cest
on 7
250
Wes
t Moo
nah
7009
Clar
emon
t 701
1D
evon
port
731
0So
uth
Laun
cest
on 7
249
Latr
obe
7307
Mon
tello
732
0Sm
ithto
n 73
30
0.30
%
0.26
%
0.22
%
0.22
%
0.22
%
0.22
%
0.22
%
0.22
%
0.21
%
0.20
%
0.17
%
0.16
%
0.16
%
0.16
%
0.15
%
0.14
%
0.14
%
0.13
%
0.12
%
0.11
%
Chart 31: Top 20 postcodes for charitable giving: ACT (as a % of income, 12 months to February 2015)
0.40
0.35
0.30
0.25
0.20
0.15
0.10
0.05
0
O’C
onno
r 26
02Ch
apm
an 2
611
Dea
kin
2600
Farr
er 2
607
Haw
ker
2614
Hug
hes
2605
Kam
bah
2902
Cam
pbel
l 261
2G
ri�
th 2
603
Mac
greg
or 2
615
Mon
ash
2904
Nar
rabu
ndah
260
4Ka
leen
261
7W
anni
assa
290
3Ly
ons
2606
Nic
holls
291
3G
ordo
n 29
06H
arri
son
2914
Calw
ell 2
905
City
260
1
0.28
%0.
27%
0.27
%0.
26%
0.26
%0.
25%
0.23
%0.
22%
0.22
%0.
21%
0.20
%0.
20%
0.20
%0.
18%
0.18
%0.
15%
0.14
%0.
14%
0.14
%0.
10%

14
NAB Charitable Giving Index
Chart 32: Top 9 postcodes for charitable giving:NT (average spend per person, $A, 12 months to February 2015)
350
300
250
200
150
100
50
0
Fann
ie B
ay 8
20
Lean
yer
812
Nig
htcl
i� 8
10
Gill
en 8
70
Kath
erin
e 85
0
Dur
ack
830
Rose
bery
832
Hum
pty
Doo
836
Bees
Cre
ek 8
22
$103
$95
$89
$80
$72
$71
$64
$58
$38
Chart 33: Top 9 postcodes for charitable giving: NT (as a % of income, 12 months to February 2015)
0.40
0.35
0.30
0.25
0.20
0.15
0.10
0.05
0
Lean
yer
812
Nig
htcl
i� 8
10
Fann
ie B
ay 8
20
Gill
en 8
70
Kath
erin
e 85
0
Dur
ack
830
Rose
bery
832
Bees
Cre
ek 8
22
Hum
pty
Doo
836
0.17
%
0.16
%
0.15
%
0.15
%
0.14
%
0.13
%
0.11
%
0.10
%
0.10
%
About Quantium
Quantium is Australia’s leading data analytics and marketing strategy firm. Quantium has worked with NAB for more than 6 years, assessing de-identified transaction data to derive insights, trends and shopping habits of different customer groups. The resulting analysis forms Market Blueprint and is used by NAB and other businesses to drive innovation and business performance through customer, distribution and marketing strategies. www.quantium.com.au
Changes to the dataQuantium implements ongoing data improvements to Market Blueprint to better capture donation spend in their analysis. As the priority for the NAB Charitable Giving Index is to provide an accurate representation of the Australian donation landscape, Quantium is required to recalculate historical results at each release using the revised data.
For this update, NAB and Quantium have undertaken a thorough review of individual charity categorisations with the aim of improving how charities are represented in the publication. The main impact of this re-classification is the separation of charitable lotteries from “Other” into a standalone category. Medical Research has also been affected due to the reclassification of two major charities - Mater Prize Home (moved to Charitable Lotteries) and Fred Hollows Foundation (moved to Health & Disability). At an overall level and for the remaining categories, the impact of re-classification has been small.
Further to this, data improvements have been made to individual charities as at every release. At this release, improvements in data associated with Australian Red Cross have been made. Humanitarian Services and the overall index have been affected in particular.
As part of Quantium’s regular review process, there has also been a re-alignment in how average annual donations per donor are calculated. As a result, there have been some upward revisions to average annual donations per donor relative to previous reports. Note that this only impacts the average annual donation metric, while other metrics (indices, market share and donations by postcode) are unchanged.

15
Indepth report
Important notice.DISCLAIMER: While care has been taken in preparing this material, National Australia Bank Limited (ABN 12 004 044 937) does not warrant or represent that the information, recommendations, opinions or conclusions contained in this document (“Information”) are accurate, reliable, complete or current. The Information has been prepared for dissemination to professional investors for information purposes only and any statements as to past performance do not represent future performance. The Information does not purport to contain all matters relevant to any particular investment or financial instrument and all statements as to future matters are not guaranteed to be accurate. In all cases, anyone proposing to rely on or use the Information should independently verify and check the accuracy, completeness, reliability and suitability of the Information and should obtain independent and specific advice from appropriate professionals or experts.
To the extent permissible by law, the National shall not be liable for any errors, omissions, defects or misrepresentations in the Information or for any loss or damage suffered by persons who use or rely on such Information (including by reasons of negligence, negligent misstatement or otherwise). If any law prohibits the exclusion of such liability, the National limits its liability to the re-supply of the Information, provided that such limitation is permitted by law and is fair and reasonable. The National, its affiliates and employees may hold a position or act as a price maker in the financial instruments of any issuer discussed within this document or act as an underwriter, placement agent, adviser or lender to such issuer.
UK DISCLAIMER: If this document is distributed in the United Kingdom, such distribution is by National Australia Bank Limited, 88 Wood Street, London EC2V 7QQ. Registered in England BR1924. Head Office: 800 Bourke Street, Docklands, Victoria, 3008. Incorporated with limited liability in the State of Victoria, Australia. In the United Kingdom NAB is subject to regulation by the Financial Conduct Authority and limited regulation by the Prudential Regulation Authority.
U.S DISCLAIMER: If this document is distributed in the United States, such distribution is by nabSecurities, LLC. This document is not intended as an offer or solicitation for the purchase or sale of any securities, financial instrument or product or to provide financial services. It is not the intention of nabSecurities to create legal relations on the basis of information provided herein.
NEW ZEALAND DISCLAIMER: This publication has been provided for general information only. Although every effort has been made to ensure this publication is accurate the contents should not be relied upon or used as a basis for entering into any products described in this publication. To the extent that any information or recommendations in this publication constitute financial advice, they do not take into account any person’s particular financial situation or goals. Bank of New Zealand strongly recommends readers seek independent legal/financial advice prior to acting in relation to any of the matters discussed in this publication. Neither Bank of New Zealand nor any person involved in this publication accepts any liability for any loss or damage whatsoever may directly or indirectly result from any advice, opinion, information, representation or omission, whether negligent or otherwise, contained in this publication. National Australia Bank Limited is not a registered bank in New Zealand.
JAPAN DISCLAIMER: National Australia Bank Ltd. has no license of securities-related business in Japan. Therefore, this document is only for your information purpose and is not intended as an offer or solicitation for the purchase or sale of the securities described herein or for any other action.

© 2015 National Australia Bank Limited ABN 12 004 044 937 AFSL and Australian Credit Licence 230686 A116163-0515
To discuss this report in more detail, please speak with your NAB Relationship Manager, email [email protected], or contact:
Alan OsterGroup Chief Economist National Australia Bank+61 (0) 3 8634 2927 [email protected]
Tony Davis Director Quantium +61 (0) 2 9292 6400 [email protected]