NA PUA MAKANI WIND ENERGY PROJECT · 2015-12-11 · Na Pua Makani Power Partners, LLC (Na Pua...
218
FINAL NA PUA MAKANI WIND ENERGY PROJECT HABITAT CONSERVATION PLAN Prepared for Na Pua Makani Power Partners, LLC Prepared by November 2015
Transcript of NA PUA MAKANI WIND ENERGY PROJECT · 2015-12-11 · Na Pua Makani Power Partners, LLC (Na Pua...
FINAL
NA PUA MAKANI
WIND ENERGY PROJECT
HABITAT CONSERVATION PLAN
Prepared for
Na Pua Makani Power Partners, LLC
Prepared by
November 2015

FINAL HABITAT CONSERVATION PLAN
This page intentionally left blank
FINAL HABITAT CONSERVATION PLAN
Na Pua Makani Wind Energy Project i
Table of Contents 1 INTRODUCTION AND PROJECT OVERVIEW ............................................................................... 1
1.1 Introduction ................................................................................................................................... 1
1.2 Applicant History and Information ............................................................................................... 1
1.3 Project Description ........................................................................................................................ 4
1.3.1 Project History ...................................................................................................................... 4
1.3.2 Project Components .............................................................................................................. 4
1.3.3 Project Schedule .................................................................................................................... 8
1.3.4 List of Preparers .................................................................................................................... 8
1.4 Regulatory Framework and Relationship to Other Plans, Policies, and Laws .............................. 8
1.4.1 Federal Endangered Species Act ........................................................................................... 8
1.4.2 National Environmental Policy Act ...................................................................................... 9
1.4.3 Migratory Bird Treaty Act .................................................................................................. 10
1.4.4 National Historic Preservation Act ..................................................................................... 10
1.4.5 Hawaii Revised Statutes (HRS Chapter 195D) ................................................................... 10
1.4.6 Hawaii Revised Statutes (HRS Chapter 343) ...................................................................... 11
2 DESCRIPTION OF THE HABITAT CONSERVATION PLAN ...................................................... 11
2.1 Purpose and Need for the HCP ................................................................................................... 11
2.2 Scope and Term .......................................................................................................................... 12
2.2.1 HCP Scope .......................................................................................................................... 12
2.2.2 HCP Term ........................................................................................................................... 12
2.3 Surveys and Resources................................................................................................................ 12
3 ENVIRONMENTAL SETTING ........................................................................................................ 13
3.1 Regional Location ....................................................................................................................... 13
3.2 Land Use Designations ............................................................................................................... 13
3.3 Topography and Geology............................................................................................................ 13
3.4 Soils............................................................................................................................................. 13
3.5 Hydrology and Water Resources ................................................................................................ 15
3.6 Terrestrial Flora .......................................................................................................................... 15
3.7 Non-Listed Wildlife .................................................................................................................... 15
3.8 Listed Wildlife ............................................................................................................................ 16
3.8.1 Hawaiian Hoary Bat ............................................................................................................ 17
FINAL HABITAT CONSERVATION PLAN
Na Pua Makani Wind Energy Project ii
3.8.2 Newell’s Shearwater ........................................................................................................... 19
3.8.3 Hawaiian Goose .................................................................................................................. 24
3.8.4 Waterbirds ........................................................................................................................... 26
3.8.5 Hawaiian Short-eared Owl .................................................................................................. 35
3.8.6 Species Considered but Excluded ....................................................................................... 36
4 GOALS AND CONSERVATION MEASURES ............................................................................... 37
4.1 Biological Goals and Objectives ................................................................................................. 37
4.1.1 Goals ................................................................................................................................... 37
4.1.2 Objectives ........................................................................................................................... 37
4.2 Avoidance and Minimization of Impacts .................................................................................... 38
4.2.1 Project Components and Siting Considerations .................................................................. 38
4.2.2 General Project Development Measures ............................................................................. 39
5 ASSESSMENT OF POTENTIAL IMPACTS AND TAKE LIMITS ................................................ 40
5.1 Hawaiian Hoary bat .................................................................................................................... 41
5.1.1 Direct Take .......................................................................................................................... 41
5.1.2 Indirect Take ....................................................................................................................... 42
5.1.3 Authorized Take Request for ITP and ITL ......................................................................... 43
5.1.4 Assessment of Potential Population-Level Impacts ............................................................ 44
5.2 Newell’s Shearwater ................................................................................................................... 45
5.2.1 Direct Take .......................................................................................................................... 45
5.2.2 Indirect Take ....................................................................................................................... 47
5.2.3 Authorized Take Request for the ITP and ITL ................................................................... 47
5.2.4 Assessment of Potential Population-Level Impacts ............................................................ 48
5.3 Hawaiian Goose .......................................................................................................................... 48
5.3.1 Direct Take .......................................................................................................................... 48
5.3.2 Indirect Take ....................................................................................................................... 49
5.3.3 Authorized Take Request for ITP and ITL ......................................................................... 50
5.3.4 Assessment of Potential Population-Level Impacts ............................................................ 51
5.4 Waterbirds (Hawaiian Duck, Hawaiian Stilt, Hawaiian Coot, Hawaiian Moorhen) .................. 51
5.4.1 Direct Take .......................................................................................................................... 51
5.4.2 Indirect Take ....................................................................................................................... 52
5.4.3 Authorized Take Request for the ITP and ITL ................................................................... 52
5.4.4 Assessment of Potential Population-Level Impacts ............................................................ 52
FINAL HABITAT CONSERVATION PLAN
Na Pua Makani Wind Energy Project iii
5.5 Hawaiian Short-eared Owl .......................................................................................................... 53
5.5.1 Direct Take .......................................................................................................................... 53
5.5.2 Indirect Take ....................................................................................................................... 54
5.5.3 Authorized Take Request for the ITP and ITL ................................................................... 54
5.5.4 Assessment of Potential Population-Level Impacts ............................................................ 55
5.6 Cumulative Impacts .................................................................................................................... 55
6 MITIGATION FOR POTENTIAL IMPACTS ................................................................................... 55
6.1 Hawaiian Hoary Bat .................................................................................................................... 56
6.1.1 Mitigation Approach ........................................................................................................... 56
6.1.2 Mitigation ............................................................................................................................ 60
6.1.3 Net Benefit .......................................................................................................................... 64
6.1.4 Measures of Success ........................................................................................................... 64
6.1.5 Costs .................................................................................................................................... 65
6.2 Newell’s Shearwater ................................................................................................................... 65
6.2.1 Mitigation Approach ........................................................................................................... 65
6.2.2 Net Benefit .......................................................................................................................... 65
6.2.3 Measures of Success ........................................................................................................... 66
6.2.4 Costs .................................................................................................................................... 66
6.3 Hawaiian Goose .......................................................................................................................... 66
6.3.1 Mitigation Approach ........................................................................................................... 66
6.3.2 Net Benefit .......................................................................................................................... 68
6.3.3 Measures of Success ........................................................................................................... 68
6.3.4 Costs .................................................................................................................................... 68
6.4 Waterbirds (Hawaiian Duck, Hawaiian Stilt, Hawaiian Coot, Hawaiian Moorhen) .................. 68
6.4.1 Mitigation Approach ........................................................................................................... 68
6.4.2 Net Benefit .......................................................................................................................... 71
6.4.3 Measures of Success ........................................................................................................... 73
6.4.4 Costs .................................................................................................................................... 73
6.5 Hawaiian Short-eared Owl .......................................................................................................... 73
6.5.1 Mitigation Approach ........................................................................................................... 73
6.5.2 Net Benefit .......................................................................................................................... 73
6.5.3 Measures of Success ........................................................................................................... 74
6.5.4 Costs .................................................................................................................................... 74
FINAL HABITAT CONSERVATION PLAN
Na Pua Makani Wind Energy Project iv
7 MONITORING AND REPORTING .................................................................................................. 74
7.1 Project-Specific Take .................................................................................................................. 74
7.1.1 Monitoring Direct Take ...................................................................................................... 75
7.1.2 Estimating Indirect Take ..................................................................................................... 76
7.2 Reporting..................................................................................................................................... 76
8 ALTERNATIVES ............................................................................................................................... 77
8.1 Alternative 1: No Action Alternative .......................................................................................... 77
8.2 Alternative 2: Proposed Action ................................................................................................... 77
8.3 Alternative 3: Reduced ITP and ITL Permit Term ..................................................................... 78
8.4 Alternative 4: Smaller Project Size (less than approximately 25 MW) ...................................... 78
9 PLAN IMPLEMENTATION ............................................................................................................. 78
9.1 Responsibilities ........................................................................................................................... 78
9.2 Scope and Duration ..................................................................................................................... 79
9.3 Changed Circumstances, Unforeseen Circumstances, and No Surprises Policy ........................ 79
9.3.1 Changed Circumstances ...................................................................................................... 79
9.3.2 Unforeseen Circumstances and No Surprises Policy .......................................................... 81
9.4 Funding and Assurances ............................................................................................................. 82
9.5 Adaptive Management ................................................................................................................ 83
9.6 Revisions and Amendments ........................................................................................................ 84
9.6.1 Minor Amendments to the HCP .......................................................................................... 84
9.6.2 Major Amendments to the HCP .......................................................................................... 84
9.6.3 Permit Transfer ................................................................................................................... 85
10 REFERENCES ............................................................................................................................... 85
List of Tables Table 1: Project Components ........................................................................................................................ 5
Table 2: Listed Species with the Potential to Occur in the Project Area .................................................... 17
Table 3: Hawaiian Hoary Bat Fatalities Observed at Existing Wind Farms in the Hawaiian Islands ........ 19
Table 4: Newell’s Shearwater-like Targets Flight Characteristics from Oahu Wind Energy Facilities ..... 24
Table 5: Direct Take Estimates for Hawaiian Hoary Bat ........................................................................... 42
Table 6: Indirect Take Estimates for Hawaiian Hoary Bat ......................................................................... 43
Table 7: Authorized Take Request for Hawaiian Hoary Bat for 21-year Permit Term .............................. 44
Table 8: Direct Take Estimates for Newell’s Shearwaters ......................................................................... 45
FINAL HABITAT CONSERVATION PLAN
Na Pua Makani Wind Energy Project v
Table 9: Indirect Take Estimates for Newell’s Shearwaters ....................................................................... 47
Table 10: Authorized Take Request for Newell’s Shearwaters for 21-year Permit Term .......................... 48
Table 11: Direct Take Estimates for Hawaiian Goose1............................................................................... 50
Table 12: Indirect Take Estimates for Hawaiian Goose ............................................................................. 50
Table 13: Authorized Take Request for Hawaiian Goose for 21-year Permit Term .................................. 51
Table 14: Authorized Take Request for Hawaiian Waterbirds for 21-year Permit Term ........................... 52
Table 15: Indirect Take Estimates for Hawaiian Short-eared Owls............................................................ 54
Table 16: Authorized Take Request for Hawaiian Short-eared Owl for 21-year Permit Term .................. 54
Table 17: Proposed Mitigation for the Covered Species ............................................................................ 56
Table 18: Proposed Forest Restoration and Management Mitigation ......................................................... 62
Table 19: Estimated Breakdown of Activities at Each Poamoho Ridge Parcel .......................................... 63
Table 20: Hawaiian Waterbird Mitigation for Potential Hamakua Marsh Fencing Project ........................ 71
List of Figures Figure 1: Vicinity Map .................................................................................................................................. 2
Figure 2: Project Facilities ............................................................................................................................ 3
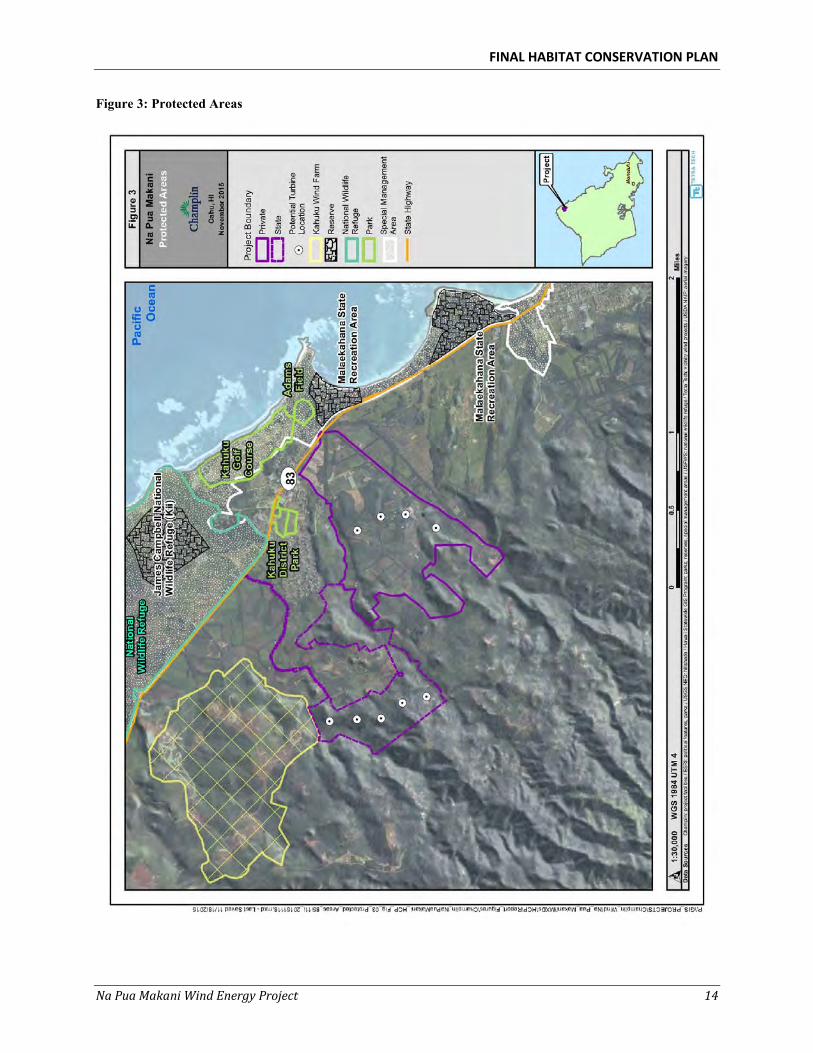
Figure 3: Protected Areas ............................................................................................................................ 14
Figure 4: Newell’s Shearwater Recovery Locations and Potential Breeding Habitat on Oahu .................. 23
Figure 5: Hawaiian Hoary Bat Mitigation Alternatives .............................................................................. 59
Figure 6: Hawaiian Goose Mitigation Area ................................................................................................ 67
Figure 7: Waterbird Mitigation Area .......................................................................................................... 70
Figure 8: Example Fence and Public Education Signs Consistent with Design Criteria for Proposed Hamakua Waterbird Mitigation Area Fence .................................................................................. 72
List of Appendices Appendix A: Post-Construction Monitoring Plan
Appendix B: Radar and Visual Studies of Seabirds and Bats at the Proposed Na Pua Makani Wind Energy Project, Oahu Island, Hawaii, Fall 2012, Spring 2013, and Summer 2013
Appendix C: Species Detected during the Biological Surveys at the Na Pua Makani Wind Energy Project
Appendix D: Records of Newell’s Shearwater Recovery Locations
Appendix E: Management Plan Annotated Outline for Poamoho Bat Mitigation Area
Appendix F: Estimated Mitigation Funding Matrix
FINAL HABITAT CONSERVATION PLAN
Na Pua Makani Wind Energy Project vi
Acronyms and Abbreviations amsl above mean sea level
BLNR Board of Land and Natural Resources
CFR Code of Federal Regulations
cm centimeter
DLNR Department of Land and Natural Resources
DOFAW DLNR Division of Forestry and Wildlife
EIS Environmental Impact Statement
ESA Endangered Species Act
ESRC Endangered Species Recovery Committee
ft foot, feet
ft/s feet per second
ha hectare
HCP Habitat Conservation Plan
HECO Hawaii Electric Company
HEPA Hawaii Environmental Policy Act
HRS Hawaii Revised Statutes
in inch(es)
ITL Incidental Take License
ITP Incidental Take Permit
JCNWR James Campbell National Wildlife Refuge
km kilometer(s)
KMWP Ko`olau Mountains Watershed Partnership
kph kilometers per hour
m meter(s)
m/s meters per second
MBTA Migratory Bird Treaty Act
met tower meteorological tower
mi mile(s)
mph miles per hour
MW megawatt(s)
FINAL HABITAT CONSERVATION PLAN
Na Pua Makani Wind Energy Project vii
Na Pua Makani Power Partners Na Pua Makani Power Partners, LLC
NEPA National Environmental Policy Act
NMFS US Department of Commerce, National Marine Fisheries Service
NFWF National Fish and Wildlife Foundation
O&M operation and maintenance
Project Na Pua Makani Wind Energy Project
Tetra Tech Tetra Tech, Inc.
USFWS U.S. Fish and Wildlife Service
USGS-BRD U.S. Geological Survey, Biological Resources Division
West Wind West Wind Works, LLC
WTG wind turbine generator

FINAL HABITAT CONSERVATION PLAN
Na Pua Makani Wind Energy Project viii
This page intentionally left blank
FINAL HABITAT CONSERVATION PLAN
Na Pua Makani Wind Energy Project 1
1 INTRODUCTION AND PROJECT OVERVIEW
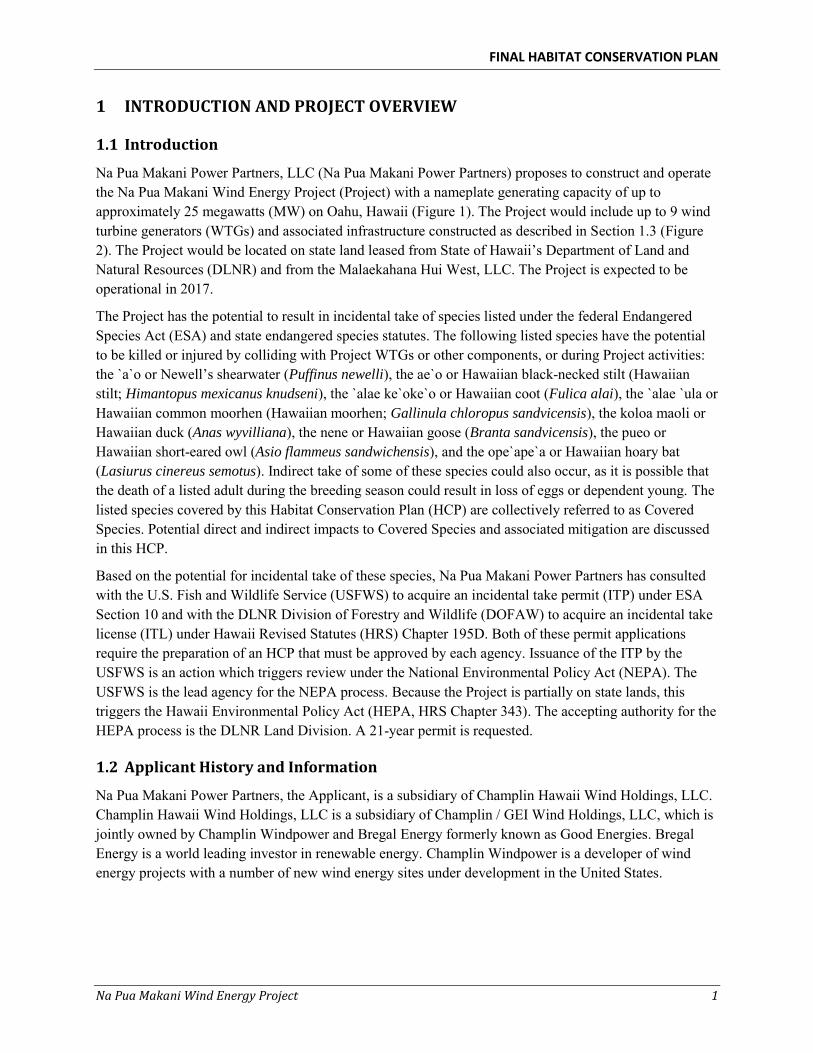
1.1 Introduction
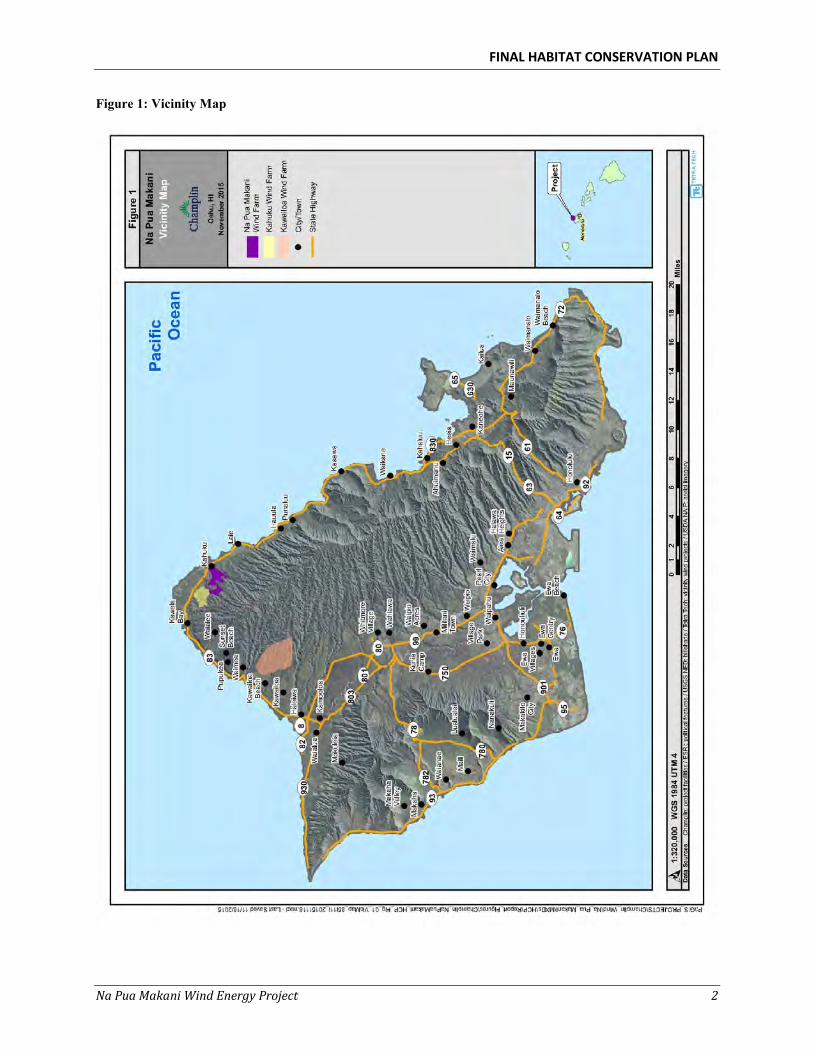
Na Pua Makani Power Partners, LLC (Na Pua Makani Power Partners) proposes to construct and operate the Na Pua Makani Wind Energy Project (Project) with a nameplate generating capacity of up to approximately 25 megawatts (MW) on Oahu, Hawaii (Figure 1). The Project would include up to 9 wind turbine generators (WTGs) and associated infrastructure constructed as described in Section 1.3 (Figure 2). The Project would be located on state land leased from State of Hawaii’s Department of Land and Natural Resources (DLNR) and from the Malaekahana Hui West, LLC. The Project is expected to be operational in 2017.
The Project has the potential to result in incidental take of species listed under the federal Endangered Species Act (ESA) and state endangered species statutes. The following listed species have the potential to be killed or injured by colliding with Project WTGs or other components, or during Project activities: the `a`o or Newell’s shearwater (Puffinus newelli), the ae`o or Hawaiian black-necked stilt (Hawaiian stilt; Himantopus mexicanus knudseni), the `alae ke`oke`o or Hawaiian coot (Fulica alai), the `alae `ula or Hawaiian common moorhen (Hawaiian moorhen; Gallinula chloropus sandvicensis), the koloa maoli or Hawaiian duck (Anas wyvilliana), the nene or Hawaiian goose (Branta sandvicensis), the pueo or Hawaiian short-eared owl (Asio flammeus sandwichensis), and the ope`ape`a or Hawaiian hoary bat (Lasiurus cinereus semotus). Indirect take of some of these species could also occur, as it is possible that the death of a listed adult during the breeding season could result in loss of eggs or dependent young. The listed species covered by this Habitat Conservation Plan (HCP) are collectively referred to as Covered Species. Potential direct and indirect impacts to Covered Species and associated mitigation are discussed in this HCP.
Based on the potential for incidental take of these species, Na Pua Makani Power Partners has consulted with the U.S. Fish and Wildlife Service (USFWS) to acquire an incidental take permit (ITP) under ESA Section 10 and with the DLNR Division of Forestry and Wildlife (DOFAW) to acquire an incidental take license (ITL) under Hawaii Revised Statutes (HRS) Chapter 195D. Both of these permit applications require the preparation of an HCP that must be approved by each agency. Issuance of the ITP by the USFWS is an action which triggers review under the National Environmental Policy Act (NEPA). The USFWS is the lead agency for the NEPA process. Because the Project is partially on state lands, this triggers the Hawaii Environmental Policy Act (HEPA, HRS Chapter 343). The accepting authority for the HEPA process is the DLNR Land Division. A 21-year permit is requested.
1.2 Applicant History and Information
Na Pua Makani Power Partners, the Applicant, is a subsidiary of Champlin Hawaii Wind Holdings, LLC. Champlin Hawaii Wind Holdings, LLC is a subsidiary of Champlin / GEI Wind Holdings, LLC, which is jointly owned by Champlin Windpower and Bregal Energy formerly known as Good Energies. Bregal Energy is a world leading investor in renewable energy. Champlin Windpower is a developer of wind energy projects with a number of new wind energy sites under development in the United States.
FINAL HABITAT CONSERVATION PLAN
Na Pua Makani Wind Energy Project 2
Figure 1: Vicinity Map
FINAL HABITAT CONSERVATION PLAN
Na Pua Makani Wind Energy Project 3
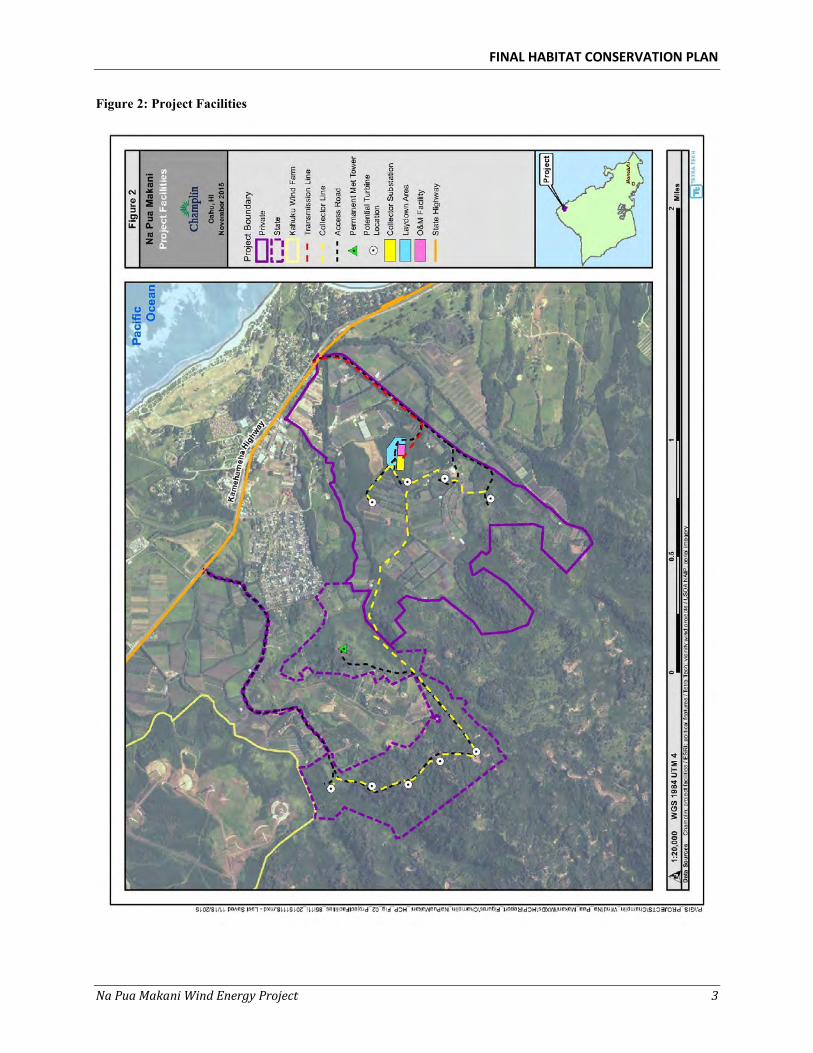
Figure 2: Project Facilities
FINAL HABITAT CONSERVATION PLAN
Na Pua Makani Wind Energy Project 4
1.3 Project Description
1.3.1 Project History
Champlin Hawaii Wind Holdings, LLC acquired the Project in 2012 from West Wind Works, LLC (West Wind). West Wind had been working to develop a wind project located on the DLNR portion of the current Project area. Following acquisition of the West Wind project, Na Pua Makani Power Partners expanded the Project area to include property owned by Malaekahana Hui West, LLC and propose the up to 9 WTG Project. The Project has been collecting wind resource data since 2009. In 2012, Na Pua Makani Power Partners initiated the site-specific biological surveys listed in Section 2.3.
1.3.2 Project Components
Na Pua Makani Power Partners is proposing to construct and operate the Project near Kahuku, Oahu. Assuming the use of up to 3.3 MW WTGs, the Project will consist of up to 9 WTGs and associated infrastructure (Table 1). The Project is proposed to begin construction in the second quarter of 2016 and begin commercial operation in 2017.
The anticipated life of the Project is 21 years. Prior to the expiration of the 21-year period, Na Pua Makani Power Partners will evaluate whether to continue operation of the Project or to decommission it. Should the period of Project operation be extended, the facility may also be upgraded and repowered with appropriate lease, permit, and approval extensions obtained.
If the Project is decommissioned, the power generation equipment and associated Project infrastructure will be removed and the site returned to a condition as close to its pre-construction state as practicable. The decommissioning process would be completed within one year as contractually required in both the land lease with DLNR and the Power Purchase Agreement with Hawaii Electric Company (HECO).
The major Project components are described below:
The 706.7-acre (ac; 286.0-hectare [ha]) wind farm site comprises 254.7 ac (103.1 ha) on DLNR land and 451.9 ac (182.9 ha) on private land. The wind farm components include:
o WTGs;
o Permanent meteorological tower (met tower);
o Access roads;
o Operation and maintenance (O&M) facilities;
o Electrical collection and interconnection infrastructure, including an electrical substation; and
o Temporary laydown area.
FINAL HABITAT CONSERVATION PLAN
Na Pua Makani Wind Energy Project 5
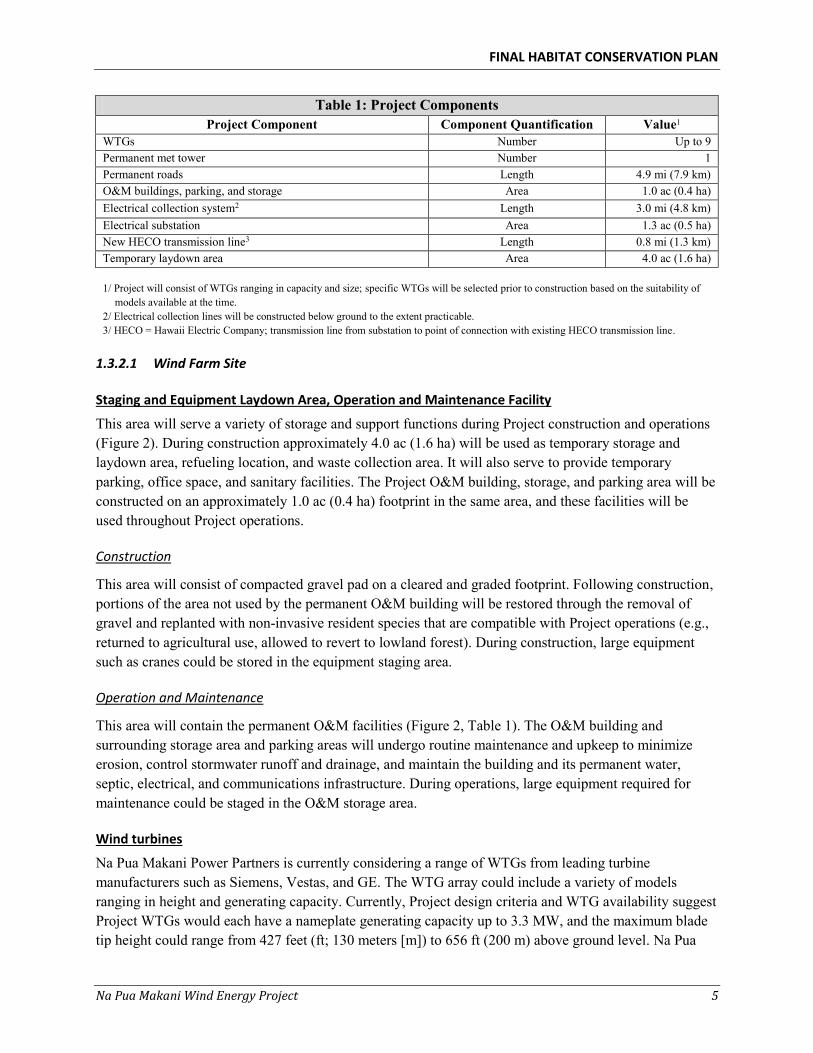
Table 1: Project Components Project Component Component Quantification Value1
WTGs Number Up to 9 Permanent met tower Number 1 Permanent roads Length 4.9 mi (7.9 km) O&M buildings, parking, and storage Area 1.0 ac (0.4 ha) Electrical collection system2 Length 3.0 mi (4.8 km) Electrical substation Area 1.3 ac (0.5 ha) New HECO transmission line3 Length 0.8 mi (1.3 km) Temporary laydown area Area 4.0 ac (1.6 ha) 1/ Project will consist of WTGs ranging in capacity and size; specific WTGs will be selected prior to construction based on the suitability of
models available at the time. 2/ Electrical collection lines will be constructed below ground to the extent practicable. 3/ HECO = Hawaii Electric Company; transmission line from substation to point of connection with existing HECO transmission line.
1.3.2.1 Wind Farm Site
Staging and Equipment Laydown Area, Operation and Maintenance Facility
This area will serve a variety of storage and support functions during Project construction and operations (Figure 2). During construction approximately 4.0 ac (1.6 ha) will be used as temporary storage and laydown area, refueling location, and waste collection area. It will also serve to provide temporary parking, office space, and sanitary facilities. The Project O&M building, storage, and parking area will be constructed on an approximately 1.0 ac (0.4 ha) footprint in the same area, and these facilities will be used throughout Project operations.
Construction
This area will consist of compacted gravel pad on a cleared and graded footprint. Following construction, portions of the area not used by the permanent O&M building will be restored through the removal of gravel and replanted with non-invasive resident species that are compatible with Project operations (e.g., returned to agricultural use, allowed to revert to lowland forest). During construction, large equipment such as cranes could be stored in the equipment staging area.
Operation and Maintenance
This area will contain the permanent O&M facilities (Figure 2, Table 1). The O&M building and surrounding storage area and parking areas will undergo routine maintenance and upkeep to minimize erosion, control stormwater runoff and drainage, and maintain the building and its permanent water, septic, electrical, and communications infrastructure. During operations, large equipment required for maintenance could be staged in the O&M storage area.
Wind turbines
Na Pua Makani Power Partners is currently considering a range of WTGs from leading turbine manufacturers such as Siemens, Vestas, and GE. The WTG array could include a variety of models ranging in height and generating capacity. Currently, Project design criteria and WTG availability suggest Project WTGs would each have a nameplate generating capacity up to 3.3 MW, and the maximum blade tip height could range from 427 feet (ft; 130 meters [m]) to 656 ft (200 m) above ground level. Na Pua
FINAL HABITAT CONSERVATION PLAN
Na Pua Makani Wind Energy Project 6
Makani Power Partners will select the most appropriate WTGs prior to construction. The Project will consist of up to 9 WTGs depending on WTG selection.
Construction
Each WTG will be transported from the Honolulu Harbor via highways and assembled on site on a constructed foundation (Figure 2; Table 1). Small- to large-sized cranes (approximately 35 – 500 ft [11 –152 m] tall) will be used to erect the tower and install various components. To minimize erosion after construction, a portion of the WTG pad area will be revegetated with non-invasive resident species that are compatible with Project operations (e.g., maintained in low growing vegetation to facilitate post-construction mortality monitoring).
Operation and Maintenance
On average a 2 ac (1 ha) area around each WTG will be maintained as a gravel pad to allow for O&M requirements. In addition, as is practicable, a site-specific area that could vary in size per WTG will be maintained to facilitate post-construction mortality monitoring efforts (Appendix A).
During operation, technicians will perform routine preventative maintenance on each WTG and troubleshoot problems. Routine maintenance and repairs require service vehicle access. Should there be a need for a major component replacement (i.e., blades, generator, or supporting tower), heavy equipment similar to that used during construction will be required. In that case, the access road, crane pad, and staging area will be used in a manner similar to their use during the original tower assembly and erection process.
Met tower
The Project will include one permanent un-guyed lattice-frame met tower (Figure 2). This tower will support weather instruments that measure and record weather data to measure performance and guide Project operation. The met tower will be approximately 262 ft (80 m) tall with base dimensions approximately 22 ft by 22 ft (7 m by 7 m) and reducing down to approximately 2 ft by 2 ft (1 m by 1 m) for the top 42 ft (13 m).
Construction
Construction of the met tower will require on-site tower assembly on a constructed footing using a large crane approximately 315 ft (96 m) tall. Following construction, revegetation will use non-invasive resident species that are compatible with Project operations (e.g., some areas may be allowed to revert to lowland forest).
Operation and Maintenance
The area of permanent impact will consist of a 0.1 ac (0.04 ha) gravel pad, which will be maintained around the base of the structure to allow for O&M requirements.
The met tower will require routine monitoring and maintenance during the period of operation. Routine monitoring and maintenance activities require vehicle access, but met towers do not typically require heavy equipment for servicing.
FINAL HABITAT CONSERVATION PLAN
Na Pua Makani Wind Energy Project 7
Roads
Roads used for the Project will include portions of an existing road network plus the addition of new roads.
Construction
The extent of new and improved roads to be developed during Project construction is described in Table 1. Existing roads will be improved, as needed, and expanded to meet construction and maintenance activity requirements. Following construction, any deteriorated permanent roadway surfaces will be repaired.
Operation and Maintenance
Permanent access roads that will be maintained following Project construction are quantified in Table 1. During operation, service vehicles and equipment will continue to use these roads for routine maintenance of the WTGs and associated Project infrastructure. Roads will be maintained in good working order through periodic grading and compacting to minimize naturally occurring erosion.
Electrical collection and interconnect system
Power from the WTGs is collected through an electrical collection system, and WTG operations are managed through a co-located communications system, most of which will be installed underground (Table 1). The electrical collection system feeds into an electrical substation, which steps-up the voltage and transmits the power to the island’s existing general transmission system via a new HECO owned and operated above ground 46-kilovolt transmission line.
Construction
To the extent practicable the collection and communications systems will be installed underground, but it could be necessary to install portions of the collection and communications systems above ground to respond to construction challenges or to avoid impacts to streams and other resources in the Project area. The locations of the collection and transmission lines are depicted in Figure 2 and their lengths are quantified in Table 1. Above ground portions will have a maximum pole height of 75 ft (23 m) and wire heights ranging 35 – 50 ft (11 – 15 m) above the ground.
The interconnection substation will be protected by a perimeter fence. The area will include the substation pad and below-grade electrical infrastructure. During construction, the substation area will be cleared and graded, and the substation pad will be compacted with well-graded material.
Construction of the collector system and new HECO transmission line will utilize standard industry procedures including surveying, corridor preparation, materials hauling, excavation, staging areas, cleanup, and replanting with non-invasive resident species that are compatible with Project operations (e.g., maintained in low growing vegetation to facilitate maintenance access or returned to agricultural use).
Operation and Maintenance
Project personnel will routinely monitor, inspect, and maintain the communication and electrical collector cables during Project operation. Typically small trucks will be used to inspect the system. Heavy
FINAL HABITAT CONSERVATION PLAN
Na Pua Makani Wind Energy Project 8
equipment will only be necessary if underground cables were determined to have failed, or if overhead conductor or supporting structures need to be repaired or replaced.
The interconnection substation will be operated and maintained by Project personnel. Maintenance activities will include routine inspections of each component and monitoring of equipment and electronics according to the manufacturer’s recommendations and owner’s and regulatory requirements. Routine maintenance of the interconnection substation will not typically require heavy construction equipment. However, if a major component (e.g., a main transformer) failed, then appropriate construction equipment will be required to replace the component.
1.3.3 Project Schedule
Project is proposed to begin construction in the second quarter of 2016 and begin commercial operation in 2017.
1.3.4 List of Preparers
This HCP was prepared by Alicia Oller, M.S., Thomas Snetsinger, M.S., and Susan Hurley, M.S. of Tetra Tech, Inc. (Tetra Tech). Reviews and input were provided by Mike Cutbirth of Na Pua Makani Power Partners. Additional input and review was provided by Afsheen Siddiqi, Angela Amlin, Norma Creps, Jason Misaki, and John Vetter of DOFAW and Jodi Charrier and Aaron Nadig of the USFWS.
1.4 Regulatory Framework and Relationship to Other Plans, Policies, and Laws
1.4.1 Federal Endangered Species Act
The ESA and its implementing regulations in Title 50 of the Code of Federal Regulations (CFR) Section 17 prohibit the take of any fish or wildlife species that is federally listed as threatened or endangered without prior approval pursuant to either Section 7 or Section 10 of the ESA.
Section 3 of the ESA defines “take” as “to harass, harm, pursue, hunt, shoot, wound, kill, trap, capture, or collect or to attempt to engage in any such conduct” (16 United States Code [USC] § 1532 (19)). Harm, in this case, means an act that actually kills or injures a federally listed wildlife species, and “may include significant habitat modification or degradation where it actually kills or injures wildlife by significantly impairing essential behavioral patterns, including breeding, feeding or sheltering” (50 CFR §17.3). To harass means to perform “an intentional or negligent act or omission which creates the likelihood of injury to wildlife by annoying it to such an extent as to significantly disrupt normal behavioral patterns which include but are not limited to, breeding, feeding or sheltering” (50 CFR § 17.3). In addition, Section 9 of the ESA details generally prohibited acts and Section 11 provides for both civil and criminal penalties for violators regarding species federally listed as threatened or endangered.
ESA Section 7(a)(2) requires each federal agency to ensure that any action authorized, funded, or carried out by such agency is not likely to jeopardize the continued existence of any endangered species or threatened species or result in the destruction or adverse modification of critical habitat (16 USC § 1536 (a)(2)). If the actions of a federal agency are not likely to jeopardize the continued existence of any endangered or threatened species, but could adversely affect the species or result in a take, the action must be addressed under Section 7 of the ESA (16 USC § 1536 (a)(2)).
Section 10 of the ESA allows a non-federal applicant, under certain terms and conditions, to incidentally take an ESA-listed species that would otherwise be prohibited under Section 9 of the ESA. When a non-
FINAL HABITAT CONSERVATION PLAN
Na Pua Makani Wind Energy Project 9
federal landowner wishes to proceed with an activity that is legal in all other respects, but that may result in the incidental taking of a listed species, an ITP, as defined under Section 10 of the ESA, is required. Incidental take is defined as take that is “incidental to, and not the purpose of, the carrying out of an otherwise lawful activity” (50 CFR § 17.3). Under Section 10, a USFWS-approved HCP is required to accompany an application for an ITP to demonstrate that all reasonable and prudent efforts have been made to avoid, minimize, and mitigate for the effects of the potential incidental take.
An ITP will be issued if the six criteria listed in 50 CFR § 17.22(b)(2) and 50 CFR § 17.32 (b)(2) are met:
All takings must be incidental;
Impacts of such taking must be minimized and mitigated “to the maximum extent practicable”;
There must be both adequate funding for the plan and provisions to address “unforeseen circumstances”;
The taking must “not appreciably reduce the likelihood of the survival and recovery of the species in the wild”;
The applicant must ensure that additional measures required by the Secretary will be implemented; and
Federal regulators must be assured that the HCP can and will be implemented.
Guidance for preparation and required components of an HCP are provided in the USFWS HCP Handbook (USFWS and NMFS 1996). The USFWS and National Marine Fisheries Service (NMFS) issued an addendum to the handbook in 2000 (USFWS and NMFS 2000). Known as the Five-point Policy, this addendum provides additional guidance on:
1. Establishing and stating biological goals for HCPs;
2. Clarifying and expanding the use of adaptive management where there is uncertainty about the experimental design and scientific evidence with respect to the HCP’s approach to conservation;
3. Clarifying the purpose and means of how to undertake species and habitat monitoring;
4. Providing criteria to be considered by USFWS and NMFS in determining incidental take permit duration; and
5. Expanding public participation.
The issuance of an ITP under Section 10 of the ESA is considered a federal action under Section 7. Therefore USFWS must comply with the requirements of NEPA.
1.4.2 National Environmental Policy Act
Issuance of an ITP by the USFWS is a federal action subject to NEPA compliance. The purpose of NEPA is to promote agency analysis and public disclosure of the environmental issues surrounding a proposed federal action. The scope of NEPA goes beyond that of the ESA by considering the impact of a federal action on non-wildlife resources such as water quality, air quality, and cultural resources including culturally important wildlife species. The USFWS will prepare and provide for public review an Environmental Impact Statement (EIS) to evaluate the potential environmental impacts of issuing an ITP and approving the implementation of the proposed Project HCP. The purpose of the EIS is to determine if
FINAL HABITAT CONSERVATION PLAN
Na Pua Makani Wind Energy Project 10
ITP issuance and HCP implementation would significantly affect the quality of the human environment. After the USFWS completes their review of the EIS, they will issue a Record of Decision of their findings. The USFWS will not issue an ITP until after the NEPA process is complete.
1.4.3 Migratory Bird Treaty Act
Under the Migratory Bird Treaty Act of 1918 (MBTA), as amended (16 USC § 703-712), taking, killing or possessing migratory birds is unlawful. Birds protected under this act include most native birds, including their body parts (e.g., feathers), nests, and eggs. A list of birds protected under the MBTA implementing regulations is provided on the USFWS’s Migratory Bird Program website (USFWS 2013).
Unless permitted by regulations, under the MBTA it is unlawful to pursue, hunt, take, capture or kill; attempt to take, capture or kill; possess, offer to or sell, barter, purchase, deliver or cause to be shipped, exported, imported, transported, carried, or received any migratory bird, part, nest, egg, or product. The MBTA provides no inherent process for authorizing incidental take of MBTA-protected birds. All birds included in the Covered Species are protected under the MBTA (USFWS 2013). If the HCP is approved and USFWS issues an ITP to the Project, the terms and conditions of that ITP would constitute a special purpose permit under 50 CFR Section 21.27 for the take of the Newell’s shearwater, Hawaiian stilt, Hawaiian coot, Hawaiian moorhen, Hawaiian duck, Hawaiian goose, and Hawaiian short-eared owl under the MBTA. Therefore, any such take of the Covered Species would not be in violation of the MBTA.
On March 23, 2012, the USFWS released Land-Based Wind Energy Guidelines (USFWS 2012a). These voluntary guidelines provide recommended approaches for assessing and avoiding impacts to wildlife and their habitats, including migratory birds, associated with wind energy project development. The guidelines also help ensure compliance with federal laws such as the MBTA. The approach described in this document for the proposed development of this Project is consistent with the intent of the guidelines.
1.4.4 National Historic Preservation Act
Section 106 of the National Historic Preservation Act of 1966, as amended (16 USC § 40 et seq.), requires federal agencies to take into account the effects of their proposed actions on properties eligible for inclusion in the National Register of Historic Places. “Properties” are defined as “cultural resources,” which includes prehistoric and historic sites, buildings, and structures that are listed or eligible for listing in the National Register of Historic Places. An undertaking is defined as a project, activity, or program funded in whole or in part under the direct or indirect jurisdiction of a federal agency; including those carried out by or on behalf of a federal agency; those carried out with federal financial assistance; those requiring a federal permit, license or approval; and those subject to state or local regulation administered pursuant to a delegation or approval by a federal agency. The issuance of an ITP is an undertaking subject to Section 106 of the National Historic Preservation Act. Cultural and archeological resources surveys have been conducted for the Project and USFWS is proceeding with Section 106 consultation.
1.4.5 Hawaii Revised Statutes (HRS Chapter 195D)
HRS Section 195D-4 states that any species of aquatic life, wildlife, or land plant that has been determined to be an endangered or threatened species under the ESA shall be deemed so under this state chapter, as well as any other indigenous species designated by DLNR as endangered or threatened by rule. The “take” of any endangered or threatened species is prohibited by both the ESA and state statute Subsection 195D-4(e). Similar to the ESA, Section 195D-2 defines “take” as “to harass, harm, pursue, hunt, shoot, wound, kill, trap, capture, or collect endangered or threatened species of aquatic life or
FINAL HABITAT CONSERVATION PLAN
Na Pua Makani Wind Energy Project 11
wildlife, or to cut, collect, uproot, destroy, injure, or possess endangered or threatened species of aquatic life or land plants, or to attempt to engage in any such conduct.” Per HRS Subsection 195D-4(g), the Board of Land and Natural Resources (BLNR) may issue an ITL to permit take otherwise prohibited under Subsection 195D-4(e) if the take is incidental to and not the purpose of, the carrying out of an otherwise lawful activity. As part of the ITL application process, an applicant must develop, fund, and implement a BLNR-approved HCP to minimize and mitigate the effects of the incidental take. The HCP must result in a net environmental benefit and increased likelihood that the species would survive and recover. The applicant must guarantee that adequate funding for the HCP and its mitigation measures will be provided. The required components of a state HCP are listed in Section 195D-21. HRS Section 195D-4(i) directs the DLNR to work cooperatively with federal agencies in concurrently processing state and federal HCPs and ITP and ITL applications.
HRS Section 195D-25 establishes the Endangered Species Recovery Committee (ESRC), an advisory committee created to review all applications and proposals for HCPs and ITLs and make recommendations to the BLNR whether or not to approve, amend, or reject the HCP or license. ESRC members include representatives of the USFWS, DLNR, the U.S. Geological Survey Biological Resources Division (USGS-BRD), the University of Hawaii Environmental Center, and other professionals with expertise in the area of conservation biology.
1.4.6 Hawaii Revised Statutes (HRS Chapter 343)
HRS Chapter 343 establishes a system of environmental review that ensures environmental concerns are given appropriate consideration along with economic and technical considerations in the decision making process of existing planning procedures of the state and counties. Because a portion of the Project occurs on DLNR (state) Lands, the Project must comply with the HRS Chapter 343 environmental review process. HRS Chapter 343-5(f) specifies that whenever an action is subject to both NEPA and Chapter 343, the Office of Environmental Quality Control and state agencies shall cooperate with federal agencies to the fullest extent possible to reduce duplication between federal and state requirements.
2 DESCRIPTION OF THE HABITAT CONSERVATION PLAN
2.1 Purpose and Need for the HCP
This HCP has been prepared to meet the requirements of the ESA and the HRS Chapter 195D. An HCP is needed because Project components have the potential to result in take of listed species that inhabit or may transit the Project area. Pursuant to Section 10(a)(1)(b) of the ESA, USFWS may authorize incidental take by a non-federal entity though the issuance of an ITP. Under HRS Section 195D-4(g), DLNR may authorize incidental take through the issuance of an ITL. In support of an application for both the ITP and ITL, the applicant must prepare an HCP. This document establishes the methods and measures of success required to meet the conservation needs of listed species potentially impacted by the Project. Importantly, it also provides a stable and predictable operating and regulatory environment and preserves the applicant’s ability to pursue their development objectives with assurances from the USFWS and DLNR that incidental take of Covered Species is authorized. The purpose of the HCP is to:
Quantify the potential impacts that the Project may have on the Covered Species;
Address the potential take of the listed species by setting forth measures that are intended to ensure that any such take caused by the Project will be incidental;
FINAL HABITAT CONSERVATION PLAN
Na Pua Makani Wind Energy Project 12
Ensure that the impacts of the take will, to the maximum extent practicable, be minimized and mitigated, including provisional procedures to deal with changed and unforeseen circumstances;
Ensure that mitigation for impacts to listed species that cannot be avoided will result in a net benefit to the Covered Species;
Ensure that adequate funding for implementation of the HCP will be provided; and
Ensure that the take of the listed species will not appreciably reduce the likelihood of the survival and recovery of these species in the wild.
2.2 Scope and Term
2.2.1 HCP Scope
The scope of the Project HCP and ITP and ITL covers all activities, facilities, and areas during construction, operation, and maintenance of the Project that have the potential to result in take of the Covered Species. The ITP and ITL applies to all lands leased by Na Pua Makani Power Partners and used for construction, operation, and maintenance of the Project (See Figure 2).
2.2.2 HCP Term
Na Pua Makani Power Partners is requesting a 21-year ITP and ITL term (permit term) that covers construction, operation, and maintenance of the Project. Before expiration of the ITP and ITL, and to the extent allowed by applicable laws and regulations, Na Pua Makani Power Partners reserves the right to apply to renew or amend the HCP and its associated permits and authorizations to extend its term of operation.
2.3 Surveys and Resources
In addition to peer-reviewed research and published literature, the following resources were used during the preparation of the HCP:
Radar and visual studies of seabirds and bats at the proposed Na Pua Makani Wind Energy Project, Oahu Island, Hawaii, 2012 – 2013 (Sanzenbacher and Cooper 2013 [Appendix B]);
Botanical, Avian, and Terrestrial Mammalian Resources Survey for the Na Pua Makani Wind Energy Project (Hobdy 2013a);
Avian point count survey study (October 2012 – October 2013; Tetra Tech 2014)
Anabat acoustic monitoring study (ongoing; initiated July 2013);
Hawaii Biodiversity Mapping Project data (HBMP 2007);
Various reports prepared for the Project providing information on other resources in the Project area (as cited throughout);
Personal communications and unpublished data from current studies provided by various DOFAW and USFWS biologists; and
Annual reports and HCPs from existing wind farm projects in Hawaii and other locations in the U.S.
FINAL HABITAT CONSERVATION PLAN
Na Pua Makani Wind Energy Project 13
3 ENVIRONMENTAL SETTING
3.1 Regional Location
The Project lies on 706.7 ac (286.0 ha) of land south and west of Kahuku, Oahu. The operational Kahuku Wind Project abuts the Project area to the northwest (Figure 3). It is surrounded by agricultural farm lands to the north; residential housing, community infrastructure, and agricultural farm lands to the east; a mixture of agricultural farm lands and undeveloped forest lands to the south; and undeveloped forest lands to the west. James Campbell National Wildlife Refuge (JCNWR) is approximately 0.75 miles (mi; 1.2 kilometers [km]) to the north and Malaekahana State Recreation Area is 0.1 mi (0.2 km) to the east (Figure 3).
3.2 Land Use Designations
The Project boundary is located almost entirely within the state agricultural land use district with only a small portion of Project area (2 ac [1 ha]) near Kamehameha Highway falling within the state urban land use district. All of the Project facilities are located within the state agricultural land use district. The Project is located within Honolulu County agricultural zoning districts: General Agricultural and Restricted Agricultural. The western portion of the Project is located on land owned by the DLNR (TMK (1) 5-6-008:006). The eastern portion of the Project is located on land owned by Malaekahana Hui West, LLC (TMK (1) 5-6-006:018). Higher elevations of the Project area occur on vegetated ridges not actively used for agriculture; lower elevations of the Project occur on cultivated lands. The area as a whole is highly fragmented habitat used for agriculture, with a wide array of crops being cultivated by lessees and private landowners. Some of the area is also fallow agricultural lands.
3.3 Topography and Geology
The Project area consists of steep, dissected ridges surrounding gently sloping valleys (Hobdy 2013a). The Project area ranges in elevation from approximately 3 ft (1 m) above mean sea level (amsl) on the northern edge to 614 ft (187 m) amsl on the southern edge.
3.4 Soils
Soils include Kaena Stony Clay, 12 – 20 percent slopes, Paumalu Badlands Complex which is highly dissected and steep, and with coral outcrops at elevations below 100 ft (30 m) amsl (Foote et al. 1972, Hobdy 2013a).
FINAL HABITAT CONSERVATION PLAN
Na Pua Makani Wind Energy Project 14
Figure 3: Protected Areas
FINAL HABITAT CONSERVATION PLAN
Na Pua Makani Wind Energy Project 15
3.5 Hydrology and Water Resources
The Project is completely contained in the 7.1 square mi (18.5 square km) Malaekahana Stream watershed. This watershed has an average annual rainfall of 44 – 159 inches (in; 113 – 403 centimeters [cm]; Giambelluca et al. 2013). The National Hydrography Dataset and National Wetland Inventory identify three streams and two aquatic features, which are small former plantation ponds, in the Project area. These resources were assessed in the Wetlands and Waters of the U.S. analysis for a proposed status determination under U.S. Army Corps of Engineers guidelines (Hobdy 2013b). Neither of the former human-made aquatic features had positive indicators of wetland hydrology, nor were they currently functioning as wetlands, having reverted to upland sites. There are three streams within the Project boundary: `Ohi`a Stream on the northern border; Kea`aulu Stream which runs through the middle of the Project, and Malaekahana Stream is on the southern border. The field assessment identified the Malaekahana Stream to be a perennial stream throughout the review area, and the remaining two streams were found to be intermittent non-Relatively Permanent Waters throughout the Project area. Based on preliminary analysis all three streams may qualify as Jurisdictional Waters of the U.S. (Hobdy 2013b).
3.6 Terrestrial Flora
A botanical survey of the proposed Project was conducted in June 2013 (Hobdy 2013a). The objective of the survey was to characterize vegetation communities within the Project area and to determine the presence of any federal- or state-listed, other special status, or rare plant species.
The Project area has been highly disturbed by agricultural activities, and the vegetation is dominated by a mixture of aggressive non-native weedy species that took over following the abandonment of sugar cane (Saccharum officinarum) agriculture. A total of 134 plant species were identified during botanical surveys; none of these species are listed as threatened, endangered, candidate, or proposed for listing. The most abundant species in the Project area is the common ironwood (Casuarina equisetifolia) and other non-native species such as parasol leaf tree (Macaranga tanarius), Formosa koa (Acacia confuse), Koster's curse (Clidemia hirta), strawberry guava (Psidium cattleianum), and Java plum (Syzygium
cumini) are common. Only 19 native species were observed, including 5 endemic species (Appendix C). The native species are largely intermixed with non-native species with the exception of a few ridge tops where the native `ulei (Osteomeles anthyllidifolia) forms large monotypic patches. Other common native species include `uhaloa (Waltheria indica) and `akia (Wikstroemia oahuensis). Each of the native species present in the Project area is known from multiple islands, and none are rare in the islands.
3.7 Non-Listed Wildlife
The Project area includes agricultural lands, grassland, shrub-scrub, and dryland forest, which provide habitat for: invertebrates; migratory, native and non-native birds; and a variety of introduced mammals. Field efforts to document wildlife species in the Project area included a general biological survey, avian point counts, and incidental observations from radar surveys. The general biological survey consisted of a pedestrian survey where the biologist recorded visual and auditory field observations and noted species presence and abundance as well as species sign (e.g., scat, trails, sign of feeding; Hobdy 2013a). The avian point counts were conducted over a one year period with surveys conducted twice monthly September – March when migratory species would be most likely to move through the area and monthly April – August (Tetra Tech 2014). During each survey, 20-minute point counts were conducted at two locations within the Project area, and all observations within a 2,625-ft (800-m) circle recorded to
FINAL HABITAT CONSERVATION PLAN
Na Pua Makani Wind Energy Project 16
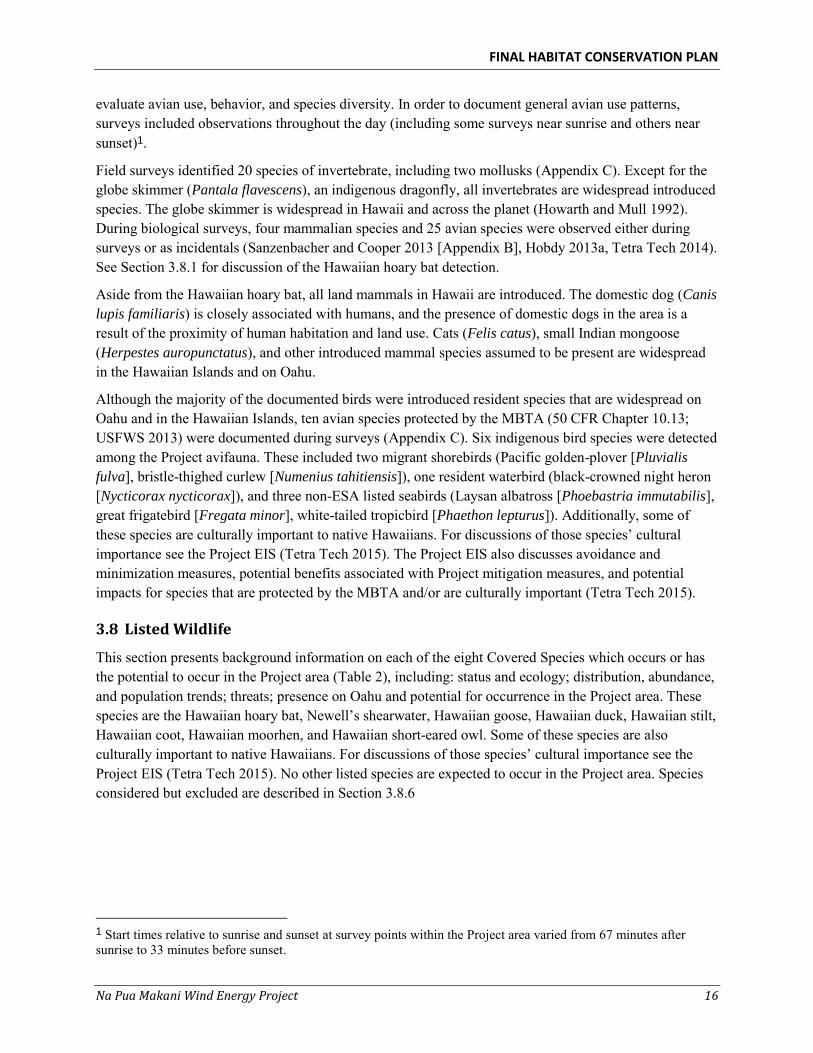
evaluate avian use, behavior, and species diversity. In order to document general avian use patterns, surveys included observations throughout the day (including some surveys near sunrise and others near sunset)1.
Field surveys identified 20 species of invertebrate, including two mollusks (Appendix C). Except for the globe skimmer (Pantala flavescens), an indigenous dragonfly, all invertebrates are widespread introduced species. The globe skimmer is widespread in Hawaii and across the planet (Howarth and Mull 1992). During biological surveys, four mammalian species and 25 avian species were observed either during surveys or as incidentals (Sanzenbacher and Cooper 2013 [Appendix B], Hobdy 2013a, Tetra Tech 2014). See Section 3.8.1 for discussion of the Hawaiian hoary bat detection.
Aside from the Hawaiian hoary bat, all land mammals in Hawaii are introduced. The domestic dog (Canis
lupis familiaris) is closely associated with humans, and the presence of domestic dogs in the area is a result of the proximity of human habitation and land use. Cats (Felis catus), small Indian mongoose (Herpestes auropunctatus), and other introduced mammal species assumed to be present are widespread in the Hawaiian Islands and on Oahu.
Although the majority of the documented birds were introduced resident species that are widespread on Oahu and in the Hawaiian Islands, ten avian species protected by the MBTA (50 CFR Chapter 10.13; USFWS 2013) were documented during surveys (Appendix C). Six indigenous bird species were detected among the Project avifauna. These included two migrant shorebirds (Pacific golden-plover [Pluvialis
fulva], bristle-thighed curlew [Numenius tahitiensis]), one resident waterbird (black-crowned night heron [Nycticorax nycticorax]), and three non-ESA listed seabirds (Laysan albatross [Phoebastria immutabilis], great frigatebird [Fregata minor], white-tailed tropicbird [Phaethon lepturus]). Additionally, some of these species are culturally important to native Hawaiians. For discussions of those species’ cultural importance see the Project EIS (Tetra Tech 2015). The Project EIS also discusses avoidance and minimization measures, potential benefits associated with Project mitigation measures, and potential impacts for species that are protected by the MBTA and/or are culturally important (Tetra Tech 2015).
3.8 Listed Wildlife
This section presents background information on each of the eight Covered Species which occurs or has the potential to occur in the Project area (Table 2), including: status and ecology; distribution, abundance, and population trends; threats; presence on Oahu and potential for occurrence in the Project area. These species are the Hawaiian hoary bat, Newell’s shearwater, Hawaiian goose, Hawaiian duck, Hawaiian stilt, Hawaiian coot, Hawaiian moorhen, and Hawaiian short-eared owl. Some of these species are also culturally important to native Hawaiians. For discussions of those species’ cultural importance see the Project EIS (Tetra Tech 2015). No other listed species are expected to occur in the Project area. Species considered but excluded are described in Section 3.8.6
1 Start times relative to sunrise and sunset at survey points within the Project area varied from 67 minutes after sunrise to 33 minutes before sunset.
FINAL HABITAT CONSERVATION PLAN
Na Pua Makani Wind Energy Project 17
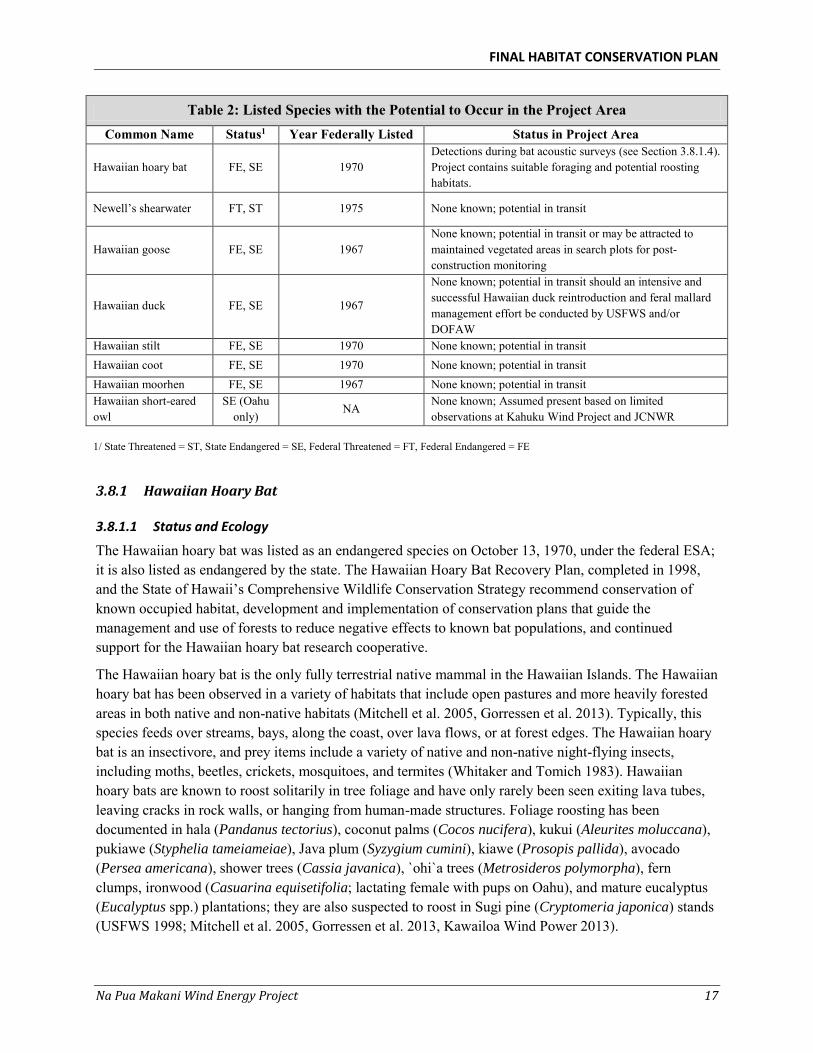
Table 2: Listed Species with the Potential to Occur in the Project Area
Common Name Status1 Year Federally Listed Status in Project Area
Hawaiian hoary bat FE, SE 1970 Detections during bat acoustic surveys (see Section 3.8.1.4). Project contains suitable foraging and potential roosting habitats.
Newell’s shearwater FT, ST 1975 None known; potential in transit
Hawaiian goose FE, SE 1967 None known; potential in transit or may be attracted to maintained vegetated areas in search plots for post-construction monitoring
Hawaiian duck FE, SE 1967
None known; potential in transit should an intensive and successful Hawaiian duck reintroduction and feral mallard management effort be conducted by USFWS and/or DOFAW
Hawaiian stilt FE, SE 1970 None known; potential in transit Hawaiian coot FE, SE 1970 None known; potential in transit Hawaiian moorhen FE, SE 1967 None known; potential in transit Hawaiian short-eared owl
SE (Oahu only)
NA None known; Assumed present based on limited observations at Kahuku Wind Project and JCNWR
1/ State Threatened = ST, State Endangered = SE, Federal Threatened = FT, Federal Endangered = FE
3.8.1 Hawaiian Hoary Bat
3.8.1.1 Status and Ecology
The Hawaiian hoary bat was listed as an endangered species on October 13, 1970, under the federal ESA; it is also listed as endangered by the state. The Hawaiian Hoary Bat Recovery Plan, completed in 1998, and the State of Hawaii’s Comprehensive Wildlife Conservation Strategy recommend conservation of known occupied habitat, development and implementation of conservation plans that guide the management and use of forests to reduce negative effects to known bat populations, and continued support for the Hawaiian hoary bat research cooperative.
The Hawaiian hoary bat is the only fully terrestrial native mammal in the Hawaiian Islands. The Hawaiian hoary bat has been observed in a variety of habitats that include open pastures and more heavily forested areas in both native and non-native habitats (Mitchell et al. 2005, Gorressen et al. 2013). Typically, this species feeds over streams, bays, along the coast, over lava flows, or at forest edges. The Hawaiian hoary bat is an insectivore, and prey items include a variety of native and non-native night-flying insects, including moths, beetles, crickets, mosquitoes, and termites (Whitaker and Tomich 1983). Hawaiian hoary bats are known to roost solitarily in tree foliage and have only rarely been seen exiting lava tubes, leaving cracks in rock walls, or hanging from human-made structures. Foliage roosting has been documented in hala (Pandanus tectorius), coconut palms (Cocos nucifera), kukui (Aleurites moluccana), pukiawe (Styphelia tameiameiae), Java plum (Syzygium cumini), kiawe (Prosopis pallida), avocado (Persea americana), shower trees (Cassia javanica), `ohi`a trees (Metrosideros polymorpha), fern clumps, ironwood (Casuarina equisetifolia; lactating female with pups on Oahu), and mature eucalyptus (Eucalyptus spp.) plantations; they are also suspected to roost in Sugi pine (Cryptomeria japonica) stands (USFWS 1998; Mitchell et al. 2005, Gorressen et al. 2013, Kawailoa Wind Power 2013).
FINAL HABITAT CONSERVATION PLAN
Na Pua Makani Wind Energy Project 18
Hawaiian hoary bats are found in both wet and dry areas from sea level to 13,000 ft (2,962 m) amsl, with most observations occurring below 7,500 ft (2,286 m) amsl. Although the Hawaiian hoary bat may migrate between islands and within topographical gradients on the islands, long-distance migration like that of the mainland hoary bat is not known (USFWS 1998). Seasonal and altitudinal differences in bat activity have been suggested (Menard 2001, Gorressen et al. 2013). Research indicates that Hawaiian hoary bats on the island of Hawaii use coastal lowlands during the breeding season and migrate to interior highlands during the winter (Gorressen et al. 2013). However, Hawaiian hoary bats can also range between habitats and elevations within a single night to target optimal local foraging opportunities (Gorressen et al. 2013).
Breeding activity takes place between April and August with pregnancy and birth of two young (twins) occurring from April to June (mean young per year = 1.83 young per year based on mainland hoary bat data; Bogan 1972, USFWS 1998, Koehler and Barclay 2000). Lactating females have been documented from June to August and post-lactating females have been documented from September to December (Menard 2001). Until weaning, young of the year are completely dependent on the female for survival. No data are available for the percentage of Hawaiian hoary bat young that survive to reproductive age.
3.8.1.2 Distribution, Abundance, and Population Trends
Confirmed reports of the Hawaiian hoary bat are known from all the main islands except Niihau and Kahoolawe (HBMP 2007), although this species is most often seen on Hawaii, Maui, and Kauai (Kepler and Scott 1990). Today, the largest known breeding populations are thought to occur on Kauai and Hawaii. Duvall and Gassmann-Duvall (1991) suggested that at least one resident, potentially breeding population of the Hawaiian hoary bat exists on Maui. Recent studies suggest that populations also persist on Oahu and Molokai (Day and Cooper 2002, 2008; SWCA 2011a); breeding was recently documented on Oahu (Kawailoa Wind Power 2013). Relatively little research has been conducted on the Hawaiian hoary bat, and data regarding its habitat and population status are very limited. Population estimates for this species range from hundreds to a few thousand; however, these estimates are based on limited and incomplete data due to the difficulty in estimating populations of patchily distributed bats (USFWS 2007).
3.8.1.3 Threats
The main potential threats to the Hawaiian hoary bat identified in the recovery plan are reduction in tree cover, increases in pesticide use, reduction in prey availability due to the introduction of non-native insects, and predation (USFWS 1998). It is unknown what effect these threats have on local population dynamics. Observation and specimen records do suggest that this species is now absent from historically occupied areas; however, the magnitude of any population decline is unknown.
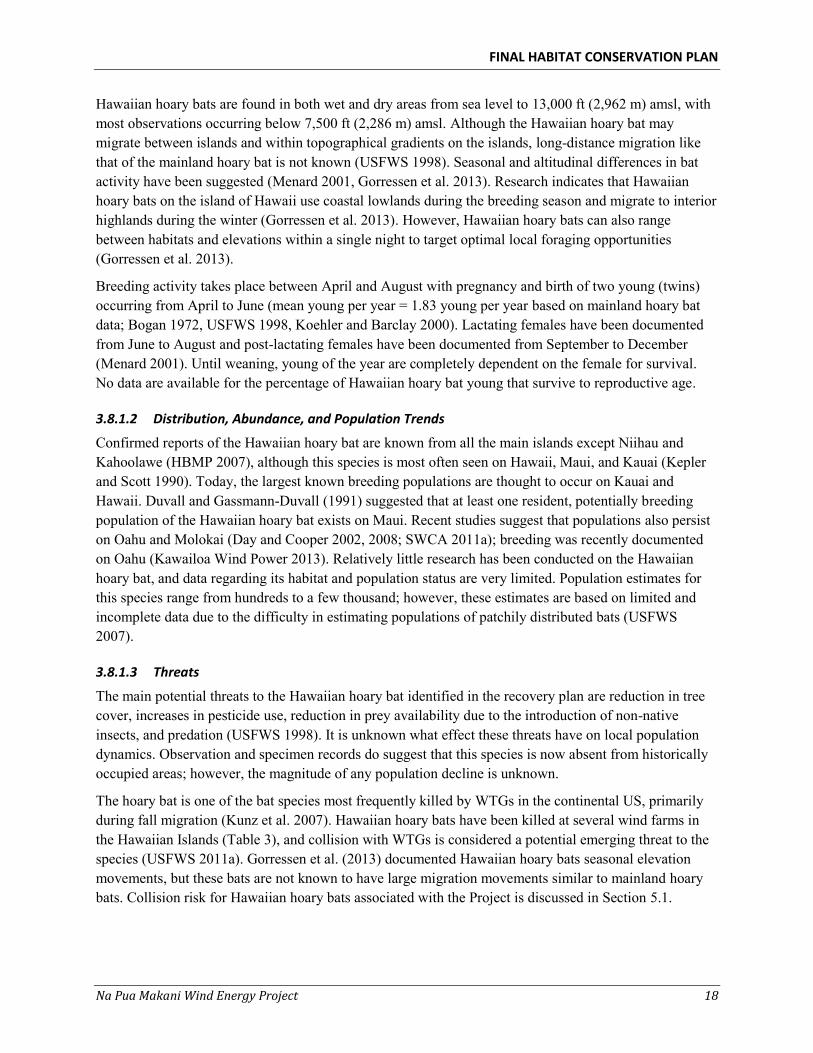
The hoary bat is one of the bat species most frequently killed by WTGs in the continental US, primarily during fall migration (Kunz et al. 2007). Hawaiian hoary bats have been killed at several wind farms in the Hawaiian Islands (Table 3), and collision with WTGs is considered a potential emerging threat to the species (USFWS 2011a). Gorressen et al. (2013) documented Hawaiian hoary bats seasonal elevation movements, but these bats are not known to have large migration movements similar to mainland hoary bats. Collision risk for Hawaiian hoary bats associated with the Project is discussed in Section 5.1.
FINAL HABITAT CONSERVATION PLAN
Na Pua Makani Wind Energy Project 19
Table 3: Hawaiian Hoary Bat Fatalities Observed at Existing Wind Farms in the Hawaiian Islands1
Project Island Operation Commencement Number of
WTGs Number of bat
fatalities observed Auwahi Wind Project Maui December 2012 8 5
Kaheawa Pastures I Wind Project
Maui June 2006 20 8
Kaheawa Pastures II Wind Project Maui July 2012 14 3
Kawailoa Wind Project
Oahu November 2012 30 25
Kahuku Wind Project
Oahu March 2011 (Idled August 2012 –August 2013)
12 4
Pakini Nui Wind Project
Hawaii April 2007 14 1
1/ Source L. Gibson, USFWS July 2015, pers. comm.
3.8.1.4 Presence on Oahu and Potential for Occurrence in the Project Area
Historically, Hawaiian hoary bats have been observed on Oahu (Baldwin 1950, Tomich 1986). Recent studies document the persistence of the species on the island and in the vicinity of the Project (Day and Cooper 2008, SWCA 2011a). A bat was potentially detected in 2013 during a night survey using a handheld detector in the Project area (Hobdy 2013a). In contrast, Hawaiian hoary bats were not observed during radar surveys at the Project site in October – November 2012 (1 survey—11 days), and April – June 2013 (2 surveys—24 days; Sanzenbacher and Cooper 2013; Appendix B). Two Anabat detectors were installed in summer 2013. Due to detector malfunctions, the Anabat detectors primarily recorded information from 2 ground-based detectors, and the Anabat detectors were replaced with Wildlife Acoustics detectors on February 6, 2015. Due to differences in technology, data from these two types of detectors are not directly comparable. Between July 2013 and February 6, 2015 the Anabat detectors recorded an average of 0.31 bat passes/detector night with higher acoustic detection rates June – August and in January. The Wildlife Acoustics detectors were originally deployed at ground level, and on June 30, 2015, one of the Wildlife Acoustics detectors was moved and re-deployed on to one of the temporary met towers with a high and low microphone approximately 148 ft (45 m) and 16 ft (5 m) above ground, respectively. Between February 6, 2015 and July 31, 2015 the Wildlife Acoustics detectors recorded an average of 0.03 bat passes/detector night and have shown relatively consistent and low levels of activity during each month of deployment. The Wildlife Acoustics will continue to provide additional information on bat activity within the Project area through December 2015. Based on detections of bats through the use of acoustic monitors at the Project, and the observed incidental take at the Kahuku Wind Project (Kahuku Wind Power 2013), bats use the Project area. Nevertheless, bat use is expected to be low and consistent with that observed at the Kahuku Wind Project, as Wildlife Acoustics detectors deployed there have shown similar results to the Project Wildlife Acoustics detectors (Kahuku Wind Power 2014).
3.8.2 Newell’s Shearwater
3.8.2.1 Status and Ecology
The Newell’s shearwater is a migratory, highly pelagic seabird endemic to the Hawaiian Islands and is listed as threatened under the ESA and by the state. Like other procellariids (i.e., shearwaters, petrels,
FINAL HABITAT CONSERVATION PLAN
Na Pua Makani Wind Energy Project 20
fulmars, and prions), the Newell’s shearwater spends up to 80 percent of its life at sea, only returning to land to breed. The Newell’s Shearwater Recovery Plan, completed in 1983, and the State of Hawaii’s Comprehensive Wildlife Conservation Strategy recommend several strategies to benefit Newell’s shearwaters. The first strategy is recommending efforts to reduce fallout. Seabird fallout occurs when birds are attracted to artificial lights causing disorientation, thus resulting in birds coming to the ground as a result of collision or exhaustion. Other recommended measures include the protection of known colonies, the development of efficient predator control methods, and the expansion of our knowledge of the species’ status and distribution (USFWS 1983, Mitchell et al. 2005).
The Newell’s shearwater is a colonial, burrow and crevice nesting species whose breeding colonies are typically located at middle to high elevations (range 525 – 3,937 ft [160 – 1,200 m] amsl), often in isolated locations (Ainley et al. 1997). Most Newell’s shearwaters excavate burrows on densely vegetated mountain slopes of 65 percent or greater, where vegetation typically consists of open native forest dominated by `ohi`a with a dense understory of uluhe fern (Dicranopteris linearis). On East Maui nests have been documented in `ama`u (Sadleria cyatheoides)-dominated fern cover (Wood and Bily 2008). However, breeding has also been documented on sparsely vegetated slopes along the Na Pali coast on Kauai and lower elevation sites (Vanderwerf et al. 2004, Mitchell et al. 2005).
The breeding season begins in April when adults arrive at the nesting colony to prospect for nest sites. A pre-laying exodus follows in late April and egg laying, which is highly synchronous, begins in early June. Pairs produce one egg, and the average incubation period is approximately 62 days based on a limited study (Telfer 1986), although the closely related and exhaustively studied Manx shearwater (Puffinus
puffinus) incubation period is 51 days (Brooke 1990). Newell’s shearwater nestlings remain in the nest approximately 92 days before fledging (Byrd et al. 1984). Young leave the nesting colony in October and November, with a few birds still fledging into December. Both parents incubate the egg, and brood and feed the chick. At night, parents forage offshore and return to colony to feed the chick. Adults do not care for young after they fledge (Ainley et al. 1997). Newell’s shearwaters exhibit strong philopatry, returning to their natal colony to breed and returning to the same nesting site over many years (Telfer 1986, Griesemer and Holmes 2011). Adults do not breed until age 6 or 7 and may not breed every year. Beginning at 2 years-old, Newell’s shearwaters return to the colony each breeding season, arriving earlier and spending more time courting and establishing pair bonds as they age. Most adult non-breeders depart the colony during the nestling stage.
Measures of breeding probability and success are limited by small sample sizes for the Newell’s shearwater. Telfer (1986) calculated 46.6 percent of historically occupied burrows were active in any given year. Ainley et al. (2001) adjusted this probability taking into account for the occupancy of some burrows by non-breeding aged individuals yielding a breeding probability of 54.7 percent for adults. Griesemer and Holmes (2011) observed that such low breeding rates cannot be representative of a stable population, and stable populations of Manx shearwater have breeding probabilities of 80 percent. A small colony of ‘super-breeders’ at Kilauea Point National Wildlife Refuge on Kauai, where predator control efforts are employed, has a breeding probability of 100 percent (Griesemer and Holmes 2011). Telfer (1986) reported 66.0 percent of nests with eggs fledged young. Over the long term a colony at Kalaheo, Kauai, had breeding success of 54 – 59 percent (Telfer 1986, Ainley et al. 1995). Griesemer and Holmes (2011) in a thorough review of the literature estimated 60 percent breeding success for a stable population, although in a summary of studies with predators present breeding success was 32 percent.
FINAL HABITAT CONSERVATION PLAN
Na Pua Makani Wind Energy Project 21
Newell’s shearwater life span is not reported in recent accounts of life history information and population modeling (Ainley et al. 1997, 2001; Griesemer and Holmes 2011). These accounts provide estimates of annual survival of 0.904 + 0.017 SE (Ainley et al. 1997, 2001) and 0.920 + 0.011 SE (Griesemer and Holmes 2011). Perrins et al. (1973) and Harris (1966a) report adult average lifespan estimates of 16 and 29 years, respectively, for the closely related Manx shearwater. The maximum known age of a Manx shearwater is 50 years 11 months (Fransson et al. 2010).
3.8.2.2 Distribution, Abundance, and Population Trends
The Newell’s shearwater only breeds in Hawaii and was once abundant on all the main Hawaiian Islands. Currently, 75 to 90 percent of the breeding population occurs on Kauai, with smaller colonies on the islands of Hawaii, Maui, and Molokai, and possibly also on Oahu; there is an isolated record of breeding from Lehua Islet near Niihau (Ainley et al. 1997; Reynolds and Ritchotte 1997; Day and Cooper 2002; Day et al. 2003; VanderWerf et al. 2004, 2007; Day and Cooper 2008; Wood and Bily 2008; USFWS 2011b). The non-breeding season distribution includes the eastern tropical Pacific.
Populations of Newell’s shearwaters have shown an apparent decline of 50 – 75 percent between 1993 and 2009 based on ornithological radar surveys (detections of shearwater-like targets) and the returns of downed birds to the Save Our Shearwaters program (the number of downed fledglings collected after attraction to artificial light; Day et al. 2003, Holmes et al. 2009). Declines in Newell’s shearwater populations appear to be supported by changes in population estimates based on observations of birds at sea with approximately 84,000 individuals estimated based on data collected between 1984 and 1993 (Spear et al. 1995) and approximately 27,000 individuals based on data collected 1998 – 2011 (Joyce 2013). However, differences in these estimates may at least partially reflect differences in sampling methodology and therefore are not directly comparable (Joyce 2013). In addition to apparent population declines, three colonies known to be active between 1980 and 1994 were documented as inactive 2006 – 2007, suggesting a breeding range contraction (Holmes et al. 2009).
Ainley et al. (2001) projected an annual population decline of 3.2 to 6.1 percent, but this assessment may underestimate recent Newell’s shearwater population declines based on a new modeling analysis (Griesemer and Holmes 2011). Griesemer and Holmes (2011) found that declines may be closer to 9 or 10 percent per year during the last two decades.
3.8.2.3 Threats
Important factors in the decline of the Newell’s shearwater include loss of breeding habitat, predation by introduced mammalian predators, and historical hunting by humans (USFWS 1983). Other threats include collisions with power lines and other human-made structures, disorientation and fall out associated with light attraction, impacts to pelagic habitat associated with climate change, and decline in food resources due to overfishing. Only land-based threats are discussed further here, as the spectrum of potential Project impacts and mitigation are inherently linked to these threats.
Historically, humans have impacted breeding habitat through the conversion of lowlands for agriculture and urban development. As breeding colonies are now mostly isolated from humans and at high elevations, the current threats to habitat are degradation by feral pigs (Sus scrofa) and non-native ungulates such as goats (Capra hirca) which crush burrows, compact the soil, and facilitate the invasion of aggressive non-native plants such as strawberry guava (Psidium cattleianum) and rose myrtle (Rhodomyrtus tomentosa). These invasive plants displace native vegetation and significantly alter
FINAL HABITAT CONSERVATION PLAN
Na Pua Makani Wind Energy Project 22
vegetation structure and substrate, reducing the suitability of breeding habitat (Troy and Holmes 2008, Holmes et al. 2009).
Predation by non-native animals is identified in the recovery plan as the primary threat to Newell’s shearwaters (USFWS 1983), and the 5-year status review (USFWS 2011b) characterizes predation as a severe threat. Cats, rats (Rattus spp.), small Indian mongooses, barn owls (Tyto alba), pigs, and dogs prey on adults, young, or eggs. Depredation by dogs and cats is particularly problematic in coastal areas when birds become grounded due to the effects of light attraction. Predation of breeding adults in particular can have devastating effects on a Newell’s shearwater population because low annual fecundity and delayed onset of reproduction limit the species’ ability to compensate for the loss of productive adults (Telfer 1986, Ainley et al. 2001, USFWS 2011b).
Urbanization and the resulting increase in nighttime lighting have been associated with the attraction, disorientation, and grounding (fall out) of fledgling Newell’s shearwaters on their first nocturnal flight to the ocean (USFWS 1983, 2011b). Disorientation exposes birds to increased risk of collision with power lines or structures, or increased risk of injury or death from impacts by vehicles or predation by non-native mammals if they become grounded. More recently, widespread use of shielded lights has reduced but not eliminated this threat (USFWS 2011b). Adult Newell’s shearwaters are not attracted to lights to the same degree as fledglings, but adults do collide with power lines (Ainley et al. 2001, Griesemer and Holmes 2011). The USFWS 5-year status review for the Newell’s shearwater also identifies wind farms as a new potential threat to this species (USFWS 2011b); however, there have been no reported Newell’s shearwater fatalities due to collision with WTGs (A. Nadig, USFWS, pers. comm. 2014). Collision risk for Newell’s shearwaters associated with the Project is discussed in Section 5.2.
3.8.2.4 Presence on Oahu and Potential for Occurrence in the Project Area
No Newell’s shearwater breeding colonies have been identified on Oahu, although suitable breeding habitat is present in the steep, uluhe fern-covered slopes of the Ko`olau and Waianae mountain ranges. Figure 4 displays potential suitable Newell’s shearwater breeding habitat based on topography, forest type, and elevation identified as important nesting colony parameters (Ainley et al. 1997)2.
The recovery of downed Newell’s shearwaters at interior locations since the 1950s suggests the potential presence of a colony on the leeward slopes of the Ko`olau Mountain Range above Honolulu (Figure 4, Appendix D; Pyle and Pyle 2009). The paucity of recovered birds along the eastern flank of the Ko`olau Mountains and in lowland areas around the Waianae Range may imply a lower likelihood than of breeding colonies elsewhere; however, this may be confounded by the lower level of light pollution and proximity of nesting habitat to the ocean in these areas. Both of these factors would be expected to result in fewer downed birds.
The Project area itself, consisting of low elevation habitat dominated by aggressive introduced species, is not appropriate Newell’s shearwater nesting habitat. However, Newell’s shearwaters could fly through the Project area when moving between potential unknown nesting colonies in the Ko`olau or Waianae mountain ranges and the ocean.
2 Based on habitat description from Ainley et al. (1997), suitable habitat includes slopes greater than or equal to 65 percent in native shrubland/sparse `ohi`a, native wet cliff vegetation, open koa-`ohi`a forest, open `ohi`a forest, `ohi`a forest, uncharacterized forest, uncharacterized shrubland (USGS 2011). Most nesting colonies occur above 500-ft elevation contour nesting colonies (Ainley et al. 1997).
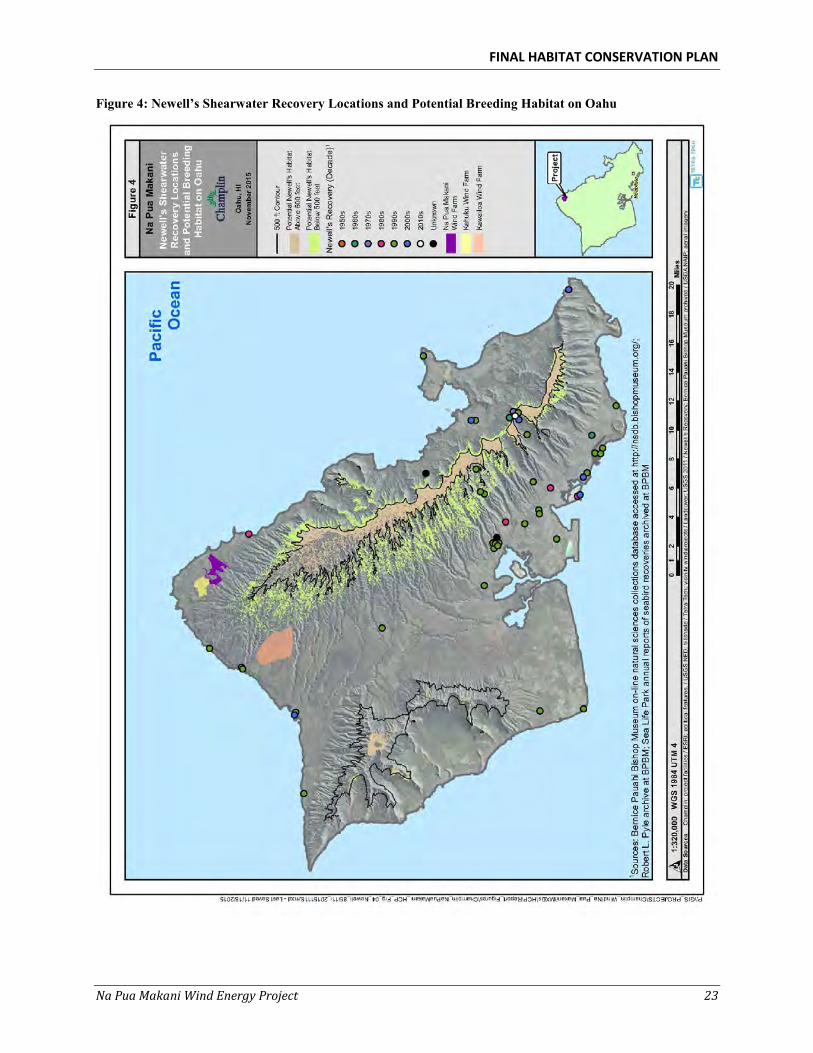
FINAL HABITAT CONSERVATION PLAN
Na Pua Makani Wind Energy Project 23
Figure 4: Newell’s Shearwater Recovery Locations and Potential Breeding Habitat on Oahu
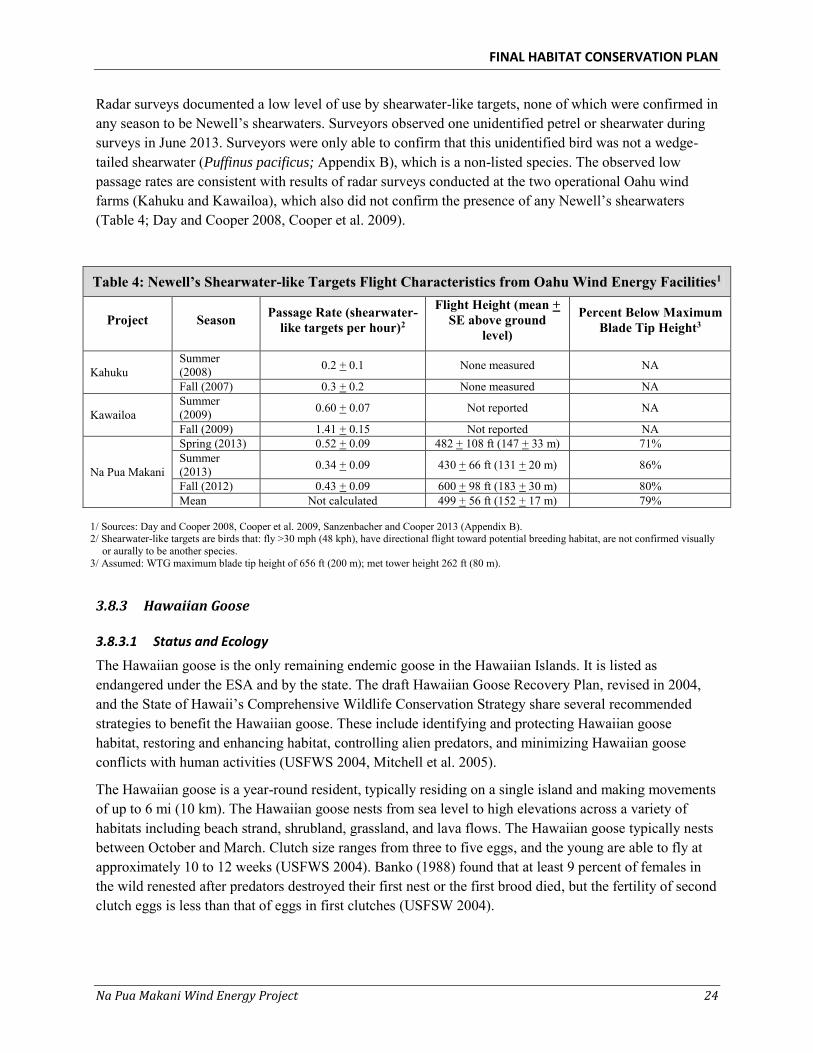
FINAL HABITAT CONSERVATION PLAN
Na Pua Makani Wind Energy Project 24
Radar surveys documented a low level of use by shearwater-like targets, none of which were confirmed in any season to be Newell’s shearwaters. Surveyors observed one unidentified petrel or shearwater during surveys in June 2013. Surveyors were only able to confirm that this unidentified bird was not a wedge-tailed shearwater (Puffinus pacificus; Appendix B), which is a non-listed species. The observed low passage rates are consistent with results of radar surveys conducted at the two operational Oahu wind farms (Kahuku and Kawailoa), which also did not confirm the presence of any Newell’s shearwaters (Table 4; Day and Cooper 2008, Cooper et al. 2009).
Table 4: Newell’s Shearwater-like Targets Flight Characteristics from Oahu Wind Energy Facilities1
Project Season Passage Rate (shearwater-like targets per hour)2
Flight Height (mean + SE above ground
level)
Percent Below Maximum Blade Tip Height3
Kahuku Summer (2008) 0.2 + 0.1 None measured NA
Fall (2007) 0.3 + 0.2 None measured NA
Kawailoa Summer (2009) 0.60 + 0.07 Not reported NA
Fall (2009) 1.41 + 0.15 Not reported NA
Na Pua Makani
Spring (2013) 0.52 + 0.09 482 + 108 ft (147 + 33 m) 71% Summer (2013) 0.34 + 0.09 430 + 66 ft (131 + 20 m) 86%
Fall (2012) 0.43 + 0.09 600 + 98 ft (183 + 30 m) 80% Mean Not calculated 499 + 56 ft (152 + 17 m) 79%
1/ Sources: Day and Cooper 2008, Cooper et al. 2009, Sanzenbacher and Cooper 2013 (Appendix B). 2/ Shearwater-like targets are birds that: fly >30 mph (48 kph), have directional flight toward potential breeding habitat, are not confirmed visually
or aurally to be another species. 3/ Assumed: WTG maximum blade tip height of 656 ft (200 m); met tower height 262 ft (80 m).
3.8.3 Hawaiian Goose
3.8.3.1 Status and Ecology
The Hawaiian goose is the only remaining endemic goose in the Hawaiian Islands. It is listed as endangered under the ESA and by the state. The draft Hawaiian Goose Recovery Plan, revised in 2004, and the State of Hawaii’s Comprehensive Wildlife Conservation Strategy share several recommended strategies to benefit the Hawaiian goose. These include identifying and protecting Hawaiian goose habitat, restoring and enhancing habitat, controlling alien predators, and minimizing Hawaiian goose conflicts with human activities (USFWS 2004, Mitchell et al. 2005).
The Hawaiian goose is a year-round resident, typically residing on a single island and making movements of up to 6 mi (10 km). The Hawaiian goose nests from sea level to high elevations across a variety of habitats including beach strand, shrubland, grassland, and lava flows. The Hawaiian goose typically nests between October and March. Clutch size ranges from three to five eggs, and the young are able to fly at approximately 10 to 12 weeks (USFWS 2004). Banko (1988) found that at least 9 percent of females in the wild renested after predators destroyed their first nest or the first brood died, but the fertility of second clutch eggs is less than that of eggs in first clutches (USFSW 2004).
FINAL HABITAT CONSERVATION PLAN
Na Pua Makani Wind Energy Project 25
Approximately 80 percent of all birds are paired in any given year, and 40 to 60 percent of these pairs will attempt to nest (Banko 1988). Pair formation typically occurs in the second year of life (Banko et al. 1999). Low elevation nests face high predation pressure, particularly where mongoose are present (Black and Banko 1994, USFWS 2004).
Studies show differences in survival and mortality of the Hawaiian goose based on sex, but factors associated with the release and subsequent management of captive-raised geese into the wild under differing conditions complicate interpretation of the results of a number of studies (Black et al. 1997). On the island of Hawaii, Hu (1998) found that annual mortality of wild females at least 4 years old was 13.2 percent, and annual mortality for wild males at least 3 years old was 11.3 percent. The differential survival of males versus females appears to be true in released birds as well, resulting in males outnumbering females among birds older than 1 year old in populations on Hawaii, Maui, and Kauai (Banko et al. 1999).
3.8.3.2 Distribution, Abundance, and Population Trends
Fossil evidence suggests that the endemic Hawaiian goose occurred on all of the main Hawaiian Islands, but populations on all but the island of Hawaii were extirpated by the early 1900s. As a result of recovery and management efforts initiated beginning in the 1950s, populations have increased from a low of 30 birds to a statewide population of approximately 2,000 birds (Banko et al. 1999, USFWS 2004). Populations are increasing on Kauai and Molokai, whereas the populations on Hawaii and Maui are stable (HNP 2009, Pyle and Pyle 2009, USFWS 2011c).
Management actions have established populations on Kauai, Maui, and Molokai and expanded the range of the population on Hawaii, but the distribution of the birds is strongly influenced by the locations of release sites of captive-bred birds (Banko et al. 1999). Birds typically remain on the islands on which they were hatched but may range over large intra-island areas following the fledging of young. The sedentary nature of the species suggests low levels of natural inter-island movement. A recent effort to translocate Hawaiian geese from Kauai to Hawaii and Maui, however, has resulted in the unexpected occurrence of birds on Oahu.
3.8.3.3 Threats
The draft recovery plan for Hawaiian goose lists predation by non-native mammals as the greatest factor limiting Hawaiian goose populations (USFWS 2004). Feral cats, dogs, rats, and mongoose are each likely to be predators on Oahu, where the few birds present are close to human populations. Other threats to the species include lack of access to seasonally important lowland habitats, insufficient nutritional resources for breeding females and for goslings, human-caused disturbance and mortality (e.g., road mortality), behavioral problems related to captive propagation, and inbreeding depression (USFWS 2011c).
3.8.3.4 Presence on Oahu and Potential for Occurrence in the Project Area
The Hawaiian goose is a recent arrival on Oahu after a pair of Hawaiian geese arrived in winter 2013 – 2014 after having dispersed from their translocation site on Hawaii. This pair bred and produced three goslings in 2014, two of which fledged (A. Nadig, USFWS, pers. comm. March 2014). As translocation efforts are expected to continue until 2016, the Hawaiian goose population on Oahu may grow as a result of additional translocated birds arriving and on-island reproduction. Habitats on Oahu that are most likely to support the Hawaiian goose are lowland areas managed as golf courses, habitat for Hawaiian
FINAL HABITAT CONSERVATION PLAN
Na Pua Makani Wind Energy Project 26
waterbirds, and grazed agricultural areas. In addition, areas where vegetation is mowed can be attractive to the Hawaiian goose, and these areas include resorts, playing fields, housing developments, and could include areas maintained beneath operational WTGs.
Thus, given the proximity of the Project to recently occupied habitat, it is possible that the Hawaiian goose will use the Project area to forage during the permit term. In addition to the potential use of the Project area, the Hawaiian goose has the potential to fly through the Project area in transit between foraging areas. The Hawaiian goose arrived on Oahu after the completion of avian point count surveys, so none were detected during Project surveys. However, given the potential growth of the population during the Project permit term, it is possible that in the future, Hawaiian geese will occasionally fly through the Project area and may forage within maintained areas under the WTGs.
3.8.4 Waterbirds
This section presents background information on each of the four waterbirds which occur or have the potential to occur in the Project area. The following sections are included for each species: status and ecology; distribution, abundance, and population trends; and presence on Oahu and potential for occurrence in the Project area. Aside from the threat of hybridization with feral mallards (Anas
platyrhynchos) for the Hawaiian duck, all waterbirds face the same suite of threats. To avoid repetition, the waterbirds section closes with a discussion of threats to the species as a group. The Revised Hawaiian Waterbirds Recovery Plan, completed in 2011, and the State of Hawaii’s Comprehensive Wildlife Conservation Strategy recommend preservation of wetland habitat and management of introduced predators in priority wetlands (Mitchell et al. 2005, USFWS 2011d).
3.8.4.1 Hawaiian Duck
Status and Ecology
The Hawaiian duck is small dabbling duck that is an endemic species of the Hawaiian Islands. The Hawaiian duck was declared an endangered species under the ESA in 1967, and it is also considered endangered by the State of Hawaii. Hawaiian ducks utilize a variety of wetland habitats, from sea level up to 10,000 ft (around 3,000 m) in elevation, including freshwater marshes, flooded grasslands, coastal ponds, streams, montane pools, forest swamplands, agricultural and artificial wetlands, and irrigation ditches (USFWS 2011d). Ephemeral wetlands are important foraging habitat for Hawaiian ducks (Engilis et al. 2002).
Hawaiian ducks breed year-round, although the majority of nesting records are from March through June (Giffin 1983). Nesting occurs on the ground near, but not necessarily adjacent to, water, but little else is known of specific Hawaiian duck nesting habits (USFWS 2011d). Clutch size ranges from 2 to 10 eggs, with a mean of 8.3 (Swedberg 1967). Incubation lasts approximately 28 days, with most chicks hatching in April – June. Only females incubate eggs (Giffin 1983). Young leave the nest as soon as the entire clutch has hatched. Young remain with the female after leaving the nest and have been observed with the female parent after developing flight at approximately 65 days old; however, the average length of attachment of young to the female is unknown (Engilis et al. 2002). Females are capable of breeding as 1-year-olds (Swedberg 1967), but some males may not breed until age 2 (Engilis et al. 2002). The species breeds each year and is capable of double-clutching, at least in captivity (DOFAW unpublished data as cited in Engilis et al. 2002).
FINAL HABITAT CONSERVATION PLAN
Na Pua Makani Wind Energy Project 27
Hawaiian ducks are non-migratory but exhibit some seasonal, altitudinal, and inter-island movements; however, the timing and mechanics of these movements are not well understood (Engilis et al. 2002). The species may use different habitats for nesting, feeding, and resting, and may move seasonally among areas (Engilis and Pratt 1993, Gee 2007). A seasonal pattern of high use of lowlands in the winter and declining use in the summer may reflect dispersal into montane areas during the breeding season (Gee 2007). Hawaiian ducks move regularly between Niihau and Kauai in response to above-normal precipitation and the flooding and drying of Niihau’s ephemeral wetlands (Engilis 1988, Engilis and Pratt 1993).
There is no information on the lifespan and survivorship from wild or captive flocks of Hawaiian ducks (Engilis et al. 2002). For the closely related mallard, mean life span is 1.8 years for birds banded as adults and 1.6 years for birds banded as juveniles (Anderson 1975); however, a wild individual survived more than 29 years (Kennard 1975 as cited in Drilling et al. 2002).
Distribution, Abundance, and Population Trends
Hawaiian ducks historically occurred on all the main Hawaiian Islands except Lanai and Kahoolawe (USFWS 2011d). By the 1960s, Hawaiian ducks were found in small numbers only on Kauai and probably on Niihau (USFWS 2011d). From the late 1950s through the early 1990s, Hawaiian ducks were reintroduced to Oahu, Maui, and Hawaii (Paton 1981, Bostwick 1982, Engilis et al. 2002) through captive propagation and release. Populations of Hawaiian ducks currently exist on Kauai, Niihau, Maui, and Hawaii; however, genetics studies show that the Oahu Hawaiian duck population is heavily compromised through hybridization with feral mallards, and few ducks with predominantly Hawaiian duck characteristics remain (Browne et al. 1993, Fowler et al. 2009, USFWS 2011d; A. Amlin, DOFAW, pers. comm. 2014).
Winter biannual waterbird surveys estimated the Hawaiian duck population at 2,200 birds, including 2,000 on Kauai and 200 on Hawaii as well as approximately 350 and 50 Hawaiian duck-like birds (presumed hybrids) on Oahu and Maui, respectively (Engilis et al. 2002). Based on the biannual waterbird counts, the Hawaiian duck population appears to be increasing overall, due to increases in the population on Kauai; pure Hawaiian duck populations are declining on other islands (USFWS 2011d). However, population trends may be inaccurate due to incomplete survey coverage and difficulty in distinguishing Hawaiian ducks from hybrids.
Presence on Oahu and Potential for Occurrence in the Project Area
Hawaiian ducks are believed to have been extirpated on Oahu by the 1960s and the population of Hawaiian duck-like birds there is comprised of mallard-Hawaiian duck hybrids (USFWS 2011d). Although pure Hawaiian ducks were released on Oahu from 1968 through 1982 (Engilis and Pratt 1993), feral mallards were not removed from the reintroduction sites prior to the releases, resulting in extensive hybridization and genetic introgression of mallards into the reestablished Hawaiian duck population on Oahu (USFWS 2011d).
The only mechanism for the development of a population of pure Hawaiian ducks on the Oahu would be an intensive Hawaiian duck reintroduction and feral mallard management effort conducted by USFWS and/or DOFAW. The Recovery Plan for Hawaiian Waterbirds identifies the removal of feral mallards on all islands as a critical element in the recovery of the species (USFWS 2011d). Furthermore, although the Recovery Plan for Hawaiian Waterbirds (USFWS 2011d) prioritizes the establishment of self-sustaining populations of Hawaiian ducks on Maui and/or Molokai, DOFAW has initiated planning of Hawaiian
FINAL HABITAT CONSERVATION PLAN
Na Pua Makani Wind Energy Project 28
duck recovery efforts that are to include populations on Oahu (A. Amlin, DOFAW, pers. comm. 2014). Therefore, Hawaiian ducks may occur in the Project vicinity during the permit term and are likely to occupy habitats currently used by hybrid individuals.
During biannual winter counts from 1999 – 2003, Hawaiian duck-like birds (presumed hybrids) were reported in low numbers (n = 1 – 15) at the following wetlands within 5 mi (8 km) of the Project: JCNWR (core wetland), Kahuku aquaculture ponds (supporting wetland), Laie wetlands (supporting wetland), the Kuilima Wastewater Treatment Plant at Turtle Bay (supporting wetland), and the Turtle Bay Golf Course Ponds (USFWS 2011d). Core wetlands are “areas that provide habitat essential for survival and recovery, supporting large populations of Hawaiian waterbirds,” and supporting wetlands are “areas that provide habitat important for survival and recovery, but may support only smaller waterbird populations or may be occupied only seasonally” (USFWS 2011d). These areas represent potential areas of future Hawaiian duck occupancy.
Assuming a reintroduction effort is successful, suitable habitat for Hawaiian ducks in the Project area is very limited. A small stretch of the Malaekahana Stream along the southern border of the Project area could be suitable habitat for Hawaiian ducks; however, the abundance of high quality habitat at managed wetland areas outside of the Project area would minimize the importance of this area. Therefore, if Hawaiian ducks occur in the Project area, this occurrence would be primarily limited to their transit of the area when flying between wetland habitats outside of the Project area.
No Hawaiian duck-like birds were observed within the Project area during avian point count surveys conducted over a 1-year period (Tetra Tech 2014). In contrast, surveyors recorded 61 Hawaiian duck-mallard hybrid in wetland areas adjacent to the Project (Tetra Tech 2014). Although these hybrids are not listed by the state or federal government, their presence indicates the suitability of habitat in the vicinity of the Project that could potentially be used by Hawaiian ducks, should they be successfully reintroduced to Oahu.
3.8.4.2 Hawaiian Stilt
Status and Ecology
The Hawaiian stilt is an endemic subspecies of the black-necked stilt, a moderately sized wading bird. The subspecies is listed as endangered under the ESA and by the state. Hawaiian stilts are associated with a variety of aquatic habitats, primarily within the lower elevation coastal plains of Hawaii, but are limited to habitats with a water depth of less than 9 in (24 cm), and sparse low-growing vegetation or exposed tidal mudflats (Robinson et al. 1999, USFWS 2011d).
Nesting generally occurs from mid-February through August on freshly exposed mudflats interspersed with low-growing vegetation (USFWS 2011d). Nesting season varies among years, possibly depending on water levels. Hawaiian stilts generally lay 3 to 4 eggs in a simple scrape on the ground adjacent to freshwater or brackish ponds (Shallenberger 1977). Eggs are incubated for approximately 24 days (Coleman 1981 as cited in USFWS 2011d, Chang 1990). Chicks leave the nest within 24 hours of hatching, but remain with both parents for several months after hatching (Coleman 1981 as cited in USFWS 2011d). Robinson et al. (1999) report a mean fledgling success rate of 0.934 fledglings per brood ± 0.431 SD with typically one brood per year (although two are possible). Hawaiian stilts have been observed breeding as 1-year-olds; however, most individuals probably do not breed until they are 2 years old (Robinson et al. 1999).
FINAL HABITAT CONSERVATION PLAN
Na Pua Makani Wind Energy Project 29
Hawaiian stilts are opportunistic feeders, eating a wide variety of invertebrates and other aquatic organisms that occur in shallow water and mudflats, including water boatmen, beetles, polychaete worms, small crabs, fish, and possibly brine fly larvae (Shallenberger 1977, Robinson et al. 1999, USFWS 2011d). Hawaiian stilts typically feed in shallow flooded wetlands that are ephemeral in nature, and have been documented moving within and between islands in order to exploit these seasonal food resources (Ueoka 1979 as cited in USFWS 2011d; Engilis and Pratt 1993; Reed et al. 1994, 1998a; USFWS 2011d). The probability of birds moving between wetlands during the breeding season decreases with age and many movements may be driven by birds prospecting for breeding opportunities (Reed et al. 1998a).
Little information on Hawaiian stilt life span is reported in recent accounts of life history information (Reed et al. 1998b, Robinson et al. 1999, USFWS 2011d). Hawaiian stilts have been documented to survive at least 15 years in the wild and captivity, and estimates of life span for the black-necked stilt are expected to be 10 years based on studies of related species including American avocet (Recurvirostra
americana) and pied avocet (R. avosetta; Robinson et al. 1997). Reed et al. (1998b) reported the probability of first year survival as 0.53 – 0.60 and survival from first to second year as 0.81.
Distribution, Abundance, and Population Trends
The Hawaiian stilt is found on all of the main Hawaiian Islands except Kahoolawe and is non-migratory except for seasonal movements between adjacent islands (Reed et al. 1994, 1998a; USFWS 2011d). Long-term census data show year-to-year variability in the number of Hawaiian stilts observed but indicate statewide populations have been relatively stable or slightly increasing through the late 1980s (Engilis and Pratt 1993, Reed and Oring 1993). Biannual Hawaiian waterbird surveys from 1998 through 2007 documented an average Hawaiian stilt population of 1,484 birds, ranging from approximately 1,100 to 2,100 birds (DOFAW 1976 – 2008 as cited in USFWS 2011d). The annual variability is at least partially a result of rainfall patterns and reproductive success (Engilis and Pratt 1993). Available habitat is thought to limit the carrying capacity for Hawaiian stilts. Models indicate that if the currently available habitat is maintained, primarily through predator control and regulation of water level fluctuations, the Hawaiian stilt population should increase to fill available habitat (Reed et al. 1998b). Conversely, altering the model parameters to reflect a cessation of predator control resulted in a 100 percent chance of extinction over 200 years, with a mean time to extinction of 32 years (Reed et al. 1998b, USFWS 2011d).
Presence on Oahu and Potential for Occurrence in the Project Area
Oahu supports the largest number of Hawaiian stilts in the Hawaiian Islands (Engilis 1988 as cited in USFWS 2011d), accounting for 35 to 50 percent of the state’s population over the past 5 years at approximately 450 to 700 birds counted during any single year (DOFAW 1976 – 2008 as cited in USFWS 2011d). On Oahu, Hawaiian stilts can be found in large concentrations at JCNWR, the Kahuku aquaculture ponds, and the Pearl Harbor National Wildlife Refuge (USFWS 2011d). Both JCNWR and Kahuku aquaculture ponds are within 5 mi (8 km) of the Project area, and are core and supporting wetlands for Hawaiian waterbirds (as defined under Hawaiian duck), respectively. Based on winter counts of adults from 1999 – 2003, other wetlands within 5 mi (8 km) of the Project where stilts have been observed include the Kahuku airstrip ponds, Coconut Grove Marsh, the Turtle Bay Golf Course Ponds, and the Kuilima Wastewater Treatment Plant at Turtle Bay (USFWS 2011d).
There is no suitable habitat for Hawaiian stilts in the Project area. Stilts require wetlands, marshes, or ponds, and these are not present in the Project area. Therefore, if Hawaiian stilts occur in the Project area,
FINAL HABITAT CONSERVATION PLAN
Na Pua Makani Wind Energy Project 30
this occurrence would be primarily limited to their transit of the area when flying between wetland habitats outside of the Project area.
No Hawaiian stilts were observed within the Project area during Project avian point count surveys conducted over a 1-year period (Tetra Tech 2014). In contrast, surveyors recorded 40 Hawaiian stilt detections in wetland areas adjacent to the Project (Tetra Tech 2014). Reed et al. (1998a) studied movement patterns of Hawaiian stilts at JCNWR and noted that few individuals moved from JCNWR to wetlands outside of the refuge and the adjacent shrimp ponds. Based on the known biology of the species and results of avian point counts, the frequency of Hawaiian stilts transiting the Project area is likely to be low.
3.8.4.3 Hawaiian Coot
Status and Ecology
The Hawaiian coot is a non-migratory species endemic to the Hawaiian Islands. Previously considered a subspecies of the American coot (Fulica americana), and originally listed under the ESA as such, the Hawaiian coot is now regarded as a distinct species (AOU 1993, 1998; USFWS 2011d). The species is listed as endangered under the ESA and by the state.
Hawaiian coots are associated with lowland wetland habitats that have emergent vegetation interspersed with open water (Pratt and Brisbin 2002, USFWS 2011d). They typically occur along the coastal plain of Hawaii, from sea level up to 850 ft (260 m; Pratt and Brisbin 2002; USFWS 2011d). Hawaiian coots are generalist feeders, consuming seeds and leaves of aquatic plants, snails, crustaceans, and aquatic or terrestrial insects, tadpoles, and small fish (Schwartz and Schwartz 1949 as cited in USFWS 2011d). They forage in mud, sand, or near the surface of the water, and they can dive up to 48 in (120 cm) below the water surface (USFWS 2011d).
Hawaiian coots nest on open freshwater and brackish ponds, flooded taro fields, shallow reservoirs, and irrigation ditches (Shallenberger 1977, Pratt and Brisbin 2002). They construct floating or semi-floating nests of aquatic vegetation in open water or at the outer margins of emergent vegetation around relatively deep bodies of water, respectively, and anchor their nests to either dense floating algal mats or emergent vegetation so that nests can move with changing water levels (Byrd et al. 1985 as cited in USFWS 2011d; Pratt and Brisbin 2002). Although previously thought to breed from early spring through fall, Hawaiian coots are now thought to breed opportunistically in response to rainfall, as active nests have been found year-round, but peak breeding occurs March – September (Shallenberger 1977; Byrd et al. 1985 as cited in USFWS 2011d; Pratt and Brisbin 2002). Clutch size averages 5 eggs with an incubation period of roughly 25 days (Shallenberger 1977; Byrd et al. 1985 as cited in USFWS 2011d). Chicks are able to swim as soon as their down has dried but are attended by parents for up to several months after hatching (Pratt and Brisbin 2002). There is limited information on Hawaiian coot life history parameters; however, the closely-related American coot has been studied extensively. Chang (1990) calculated a 28 percent fledging success rate for Hawaiian coots. Most American coots breed as 1-year-olds, and birds breed annually, renesting if they lose a brood or a clutch (Brisbin et al. 2002).
Hawaiian coots are non-migratory, but they exhibit pronounced irregular movements based on rainfall (Pratt and Brisbin 2002). Movements are associated with a reduction in water levels and food availability (USFWS 2011d). Many Kauai birds move to Niihau when suitable temporary ponds are available (Pratt and Brisbin 2002). Hawaiian coots commonly wander, and larger bodies of water may have large
FINAL HABITAT CONSERVATION PLAN
Na Pua Makani Wind Energy Project 31
concentrations of birds during the non-breeding season (Pratt and Brisbin 2002). As movements are associated with fall and winter rain events, which occur after the peak breeding season, movements between wetlands are most likely to occur after independence of young.
There is no information on the lifespan and survivorship of the Hawaiian coot (Pratt and Brisbin 2002, USFWS 2011d); however, an American coot lived to at least 22 years old (Klimkiewicz and Futcher 1989 as cited in Brisbin et al. 2002; Pratt and Brisbin 2002). Ryder (1963 as cited in Brisbin et al. 2002) reported annual survival rates of 49 percent for adult American coots and 44 percent for juvenile American coots.
Distribution, Abundance, and Population Trends
Hawaiian coots historically occurred on all the main Hawaiian Islands except Lanai and Kahoolawe as these islands lacked suitable wetland habitat (USFWS 2011d). Hawaiian coots are now also present on Lanai due to the creation of artificial wetlands or wetland-like features such as water treatment sites. Hawaiian coots have always occurred in greatest numbers on Oahu, Maui, and Kauai (Shallenberger 1977), and were likely once fairly common in large natural marshes and ponds.
Winter biannual waterbird surveys from 1997 through 2006 indicated a Hawaiian coot population average of approximately 2,000 birds, with minimum counts ranging from approximately 1,500 to 2,800 birds statewide (DOFAW 1976 – 2008 as cited in USFWS 2011d). Engilis and Pratt (1993) estimated a statewide Hawaiian coot population of 2,000 to 4,000 birds. Biannual winter waterbird counts indicate short-term population fluctuations and a slight long-term increase in population between 1976 and 2008 (DOFAW 1976 – 2008 as cited in USFWS 2011d). As Hawaiian coots disperse readily and exploit seasonally flooded wetlands, their populations naturally fluctuate according to climatic and hydrologic conditions (USFWS 2011d).
Presence on Oahu and Potential for Occurrence in the Project Area
During 1995 – 2007, the Hawaiian coot population on Oahu has fluctuated between approximately 500 and 1,000 birds (DOFAW 1976 – 2008 as cited in USFWS 2011d). Large concentrations of Hawaiian coots have been observed at JCNWR (core wetland, as defined under Hawaiian duck), the Kahuku aquaculture ponds (supporting wetland), the Kuilima wastewater treatment plant (supporting wetland), the Ka`elepulu Pond in Kailua, the Pearl Harbor National Wildlife Refuge, and the Hawaii Prince Golf Course (USFWS 2011d). JCNWR, Kahuku aquaculture ponds, and Kuilima wastewater treatment plant are within 5 mi (8 km) of the Project. Based on winter counts of adults from 1999 – 2003, other wetlands within 5 mi (8 km) of the Project where Hawaiian coots have been observed in smaller numbers include Coconut Grove Marsh, La`ie wetlands (supporting wetland), and the Turtle Bay golf course ponds.
There is no suitable habitat for Hawaiian coots in the Project area. In lowland environments, coots use wetlands, marshes, or ponds (Pratt and Brisbin 2002), and these are not present in the Project area. Therefore, if Hawaiian coots occur in the Project area, this occurrence would be primarily limited to their transit of the area when flying between wetland habitats outside of the Project area.
No Hawaiian coots were observed within the Project area during avian point count surveys conducted over a 1-year period (Tetra Tech 2014). In contrast, surveyors detected 14 individuals in wetland areas adjacent to the Project (Tetra Tech 2014). Based on the known biology of the species and the results of avian point counts, the frequency of Hawaiian coots transiting the Project area is likely to be low.
FINAL HABITAT CONSERVATION PLAN
Na Pua Makani Wind Energy Project 32
3.8.4.4 Hawaiian Moorhen
Status and Ecology
The Hawaiian moorhen is a non-migratory subspecies endemic to the Hawaiian Islands. The Hawaiian moorhen is listed under the ESA and by the state as endangered. The Hawaiian moorhen is predominantly associated with lowland wetland habitats that have emergent vegetation interspersed with open water including: natural ponds, marshes, streams, springs or seeps, lagoons, grazed wet meadows, taro and lotus fields, shrimp aquaculture ponds, reservoirs, sedimentation basins, sewage ponds, and drainage ditches (Shallenberger 1977, Nagata 1983, Banko 1987, Bannor and Kiviat 2002). They appear to have a preference for freshwater habitat over brackish (Engilis and Pratt 1993). In comparison to Hawaiian coot, the Hawaiian moorhen requires “relatively dense marginal vegetation” (Berger 1981). The key features for the Hawaiian moorhen are:
Dense stands of robust emergent vegetation near open water;
Floating or barely emergent mats of vegetation;
Water depth less than 3 ft (1 m); and
Fresh water (as opposed to saline or brackish water; USFWS 2011d3).
Although little specific information on the diet of the Hawaiian moorhen is available, they are apparently opportunistic feeders, and the diet likely varies by habitat (Shallenberger 1977). The moorhen’s diet includes algae, aquatic insects, mollusks, snails, seeds, other plant parts (Schwartz and Schwartz 1949 as cited in USFWS 2011d, Telfer [unpubl. data] as cited in USFWS 2011d). It gleans food from water surface and leaves of floating plants while swimming or walking on these plants. Although the Hawaiian moorhen typically forages in and along areas of dense vegetation, they also forage on open ground (Bannor and Kiviat 2002, USFWS 2011d).
Hawaiian moorhens typically nest over shallow water (less than 24 in [60 cm] deep) along emergent vegetation edges of narrow interconnecting waterways but also in wet meadows or on solid ground in the presence of tall cover (USFWS 2011d). Nests are typically formed by folding over emergent vegetation flattened to create a platform nest (Weller and Fredrickson 1973, Shallenberger 1977, Chang 1990). Hawaiian moorhens nest year round, but breeding activity is concentrated during March – August and is affected by both vegetation height and water levels (Shallenberger 1977, Byrd and Zeillemaker 1981 as cited in USFWS 2011d, and Chang 1990). Clutch size ranged from 4.9 to 5.6 eggs for two studies (Chang 1990, Byrd and Zeillemaker 1981 as cited in USFWS 2011d), with an incubation period ranging from 19 to 22 days (Byrd and Zeillemaker 1981 as cited in USFWS 2011d). Chicks are precocial and remain dependent on their parents for several weeks (USFWS 2011d). Average brood size at a study on Oahu was 4.4 chicks per brood (Smith and Polhemus 2003 as cited in USFWS 2011d). Birds may renest following failure, and multiple broods per year have been observed (Byrd and Zeillemaker 1981 as cited in USFWS 2011d).
Hawaiian moorhens are non-migratory and generally sedentary; however, they readily disperse in spring, presumably to breed (Nagata 1983). As with other Hawaiian waterbirds, dispersal may be related to the
3 The layout of this quote has been modified from the original, specifically changing the description of features from a text listing to a bulleted list in order to facilitate a clear presentation of the material.
FINAL HABITAT CONSERVATION PLAN
Na Pua Makani Wind Energy Project 33
timing of wet and dry periods (Engilis and Pratt 1993) with dispersal occurring with the creation of new seasonal habitat during periods of flooding. Inter-island movement has not been documented in the Hawaiian moorhen; however, it has been observed in the Mariana common moorhen (G. c. guami; Worthington 1998 as cited in USFWS 2011d, Takano and Haig 2004 as cited in USFWS 2011d). Given the short duration of dependence, sedentary nature of the species, and timing of dispersal events, Hawaiian moorhens are unlikely to move between wetland areas when caring for dependent young.
There is no information on the lifespan and annual survival of the Hawaiian moorhen (Bannor and Kiviat 2002, USFWS 2011d). A banded common moorhen was recaptured at an estimated age of 10.5 years old (Clapp et al. 1982 as cited in Bannor and Kiviat 2002).
Distribution, Abundance, and Population Trends
Hawaiian moorhens historically occurred on all of the main Hawaiian Islands except Lanai (probably due to a lack of wetland habitat) and probably Niihau (Munro 1960, Banko 1987). From the late 19th to the mid-20th centuries, moorhen populations on all but Kauai and Oahu were extirpated. Reintroduction efforts on the islands of Maui, Molokai, and Hawaii all failed, although there are unsubstantiated reports of moorhens from the islands of Hawaii and Maui from the late 20th century (USFWS 2011d).
Given the species’ preference for densely-vegetated wetlands, DOFAW biannual waterbird surveys provide only a rough measurement of recent population trends. Although other approaches have been explored to develop more accurate estimates, none have been implemented (USFWS 2011d). Statewide population counts have been stable during the last decade (1998 – 2007) with an average count of 287 birds (DOFAW 1976 – 2008 as cited in USFWS 2011d).
Presence on Oahu and Potential for Occurrence in the Project Area
Based on results of biannual waterbird surveys, approximately half of the Hawaiian moorhen population resides on Oahu. The species is most common on the northern and eastern coasts. Areas supporting the largest populations include: Dillingham Ranch large pond; Amorient Aquafarm (part of Kahuku Aquaculture Farms); JCNWR, Ki`i Unit (core wetland, as defined under Hawaiian duck); and Waimea Valley. Amorient Aquafarm and JCNWR are within 5 mi (8 km) of the Project. Based on winter counts of adults from 1999 – 2003, other wetlands within 5 mi (8 km) of the Project where Hawaiian moorhens have been observed in smaller numbers include Coconut Grove Marsh, La`ie wetlands (supporting wetland), Kahuku Prawn Farm (part of Kahuku Aquaculture Farms; supporting wetland), Punaho`olapa Marsh, and the Turtle Bay golf course ponds.
There is no suitable habitat for Hawaiian moorhens in the Project area. Moorhens use wetlands, marshes, or ponds (Bannor and Kiviat 2002), and these are not present in the Project area. Therefore, if Hawaiian moorhens occur in the Project area, this occurrence would be primarily limited to their transit of the area when flying between wetland habitats outside of the Project area.
No Hawaiian moorhens were observed within the Project area during Project avian point count surveys conducted over a 1-year period (Tetra Tech 2014). In contrast, surveyors detected 16 individuals in wetland areas adjacent to the Project (Tetra Tech 2014). Based on the known biology of the species and the results of avian point counts, the frequency of Hawaiian moorhens transiting the Project area is likely to be low.
FINAL HABITAT CONSERVATION PLAN
Na Pua Makani Wind Energy Project 34
3.8.4.5 Threats to Waterbirds
Historically, the greatest limiting factors for Hawaiian waterbirds have included predation by introduced animals and loss and degradation of wetland habitats (USFWS 2011d). Other threats to Hawaiian waterbirds have included hunting pressure, disease, and environmental contamination. Currently, predation by introduced animals and avian botulism may be the greatest threats to the Hawaiian stilt, Hawaiian coot, and Hawaiian moorhen, and hybridization with feral mallards (and resulting genetic introgression) is the most serious threat to the Hawaiian duck (USFWS 2011d).
Introduced predators have contributed to the decline of all four waterbird species, and continue to have a large impact on these ground-nesting birds. Predation is a major cause of waterbird mortality and nest failure (USFWS 2011d). Adult waterbirds are occasionally taken, but most depredation is of eggs and young (USFWS 2011d). Introduced mammals such as mongooses, cats, dogs, and rats are the primary predators, but depredation by both native and introduced birds (e.g., black-crowned night-heron, cattle egrets [Bubulcus ibis] and barn owls), introduced fish, and introduced amphibians (e.g., American bullfrogs [Rana catesbeiana]) has also been documented (Shallenberger 1977, Berger 1981, Robinson et al. 1999, Brisbin et al. 2002). The Recovery Plan for Hawaiian Waterbirds (USFWS 2011d) identifies long-term predator control at nesting sites as a critical element in the recovery of Hawaiian waterbirds.
Significant loss of wetland habitat, resulting from the conversion of land to agriculture and urbanization of lowland coastal areas, has contributed to the decline of all four waterbird species (USFWS 2011d). Coastal plain wetlands are the primary habitat used by the Hawaiian stilt, Hawaiian coot, and Hawaiian moorhen, and these habitats have also been degraded through modification of hydrologic regimes, alteration of habitat structure and vegetation composition by invasive non-native plants, loss of riparian vegetation and reductions in water quality due to grazing (USFWS 2011d). Currently, less than 70 percent of the coastal plain wetlands historically present in Hawaii remain (Dahl 1990 as cited in USFWS 2011d). Likewise, more than 80 percent of Hawaii’s perennial streams, which provide the primary wetland habitat used by the Hawaiian duck, have had some form of water diversion or alteration and are no longer considered pristine (USFWS 2011d). The Recovery Plan for Hawaiian Waterbirds (USFWS 2011d) identifies establishing and protecting a stable network of core and supporting wetlands as a critical element in the recovery of Hawaiian waterbirds.
Interbreeding of Hawaiian ducks with feral mallards and hybrids is resulting in the loss of the Hawaiian duck as a unique species. Hawaiian duck hybridization appears to be most severe on Oahu, where genetic studies have shown the population to be heavily compromised through hybridization with feral mallards (Browne et al. 1993, Fowler et al. 2009, USFWS 2011d). The Recovery Plan for Hawaiian Waterbirds (USFWS 2011d) describes the Hawaiian duck as having a high potential for recovery and identifies the removal of feral mallards on all islands and establishment of self-sustaining populations of Hawaiian ducks on Maui and/or Molokai as critical elements in the recovery of this species.
Although collision is not listed as a current threat to Hawaiian waterbirds in the Recovery Plan for Hawaiian Waterbirds (USFWS 2011d), birds have been identified as a wildlife group at risk because of collisions or other interactions with WTGs (Erickson et al. 2001; Arnett et al. 2007, 2008; Drewitt and Langston 2008). However, waterbird fatalities are not typically documented in high numbers at operational wind energy facilities despite high mean use in some locations (Erickson et al. 2002, Jain 2005, Johnson and Erickson 2011). Additionally, waterbirds, shorebirds, and seabirds have shown strong avoidance of WTGs at coastal wind energy facilities (Kingsley and Whittam 2001, 2005; Day et al. 2005;
FINAL HABITAT CONSERVATION PLAN
Na Pua Makani Wind Energy Project 35
Desholm and Kahlert 2005; Larsen and Guillemette 2007). Interactions between black-necked stilts, including Hawaiian stilts, and WTGs are not well documented. One black-necked stilt fatality has been documented at an operating wind energy facility in the United States (Altamont Pass Avian Monitoring Team 2008); however, this site includes older generation WTGs in dense, clustered arrangements not representative of conditions in newer generation wind energy facilities (Erickson et al. 2002). Collision risk for waterbirds associated with the Project is discussed in Section 5.4.
3.8.5 Hawaiian Short-eared Owl
3.8.5.1 Status and Ecology
The Hawaiian short-eared owl is an endemic subspecies of the short-eared owl. It likely colonized the islands following the arrival of Polynesians to the island chain and the concurrent introduction of the Polynesian rat (Rattus exulans). The Oahu population of the subspecies is listed as endangered by the state. The State of Hawaii’s Comprehensive Wildlife Conservation Strategy recommends a combination of conservation actions, monitoring, and research. These recommendations include continuing conservation efforts at refuges and wildlife sanctuaries, expanding survey efforts to monitor population status and trends on Oahu, and conducting research into limiting factors such as “sick owl syndrome” and vehicle collisions.
Hawaiian short-eared owls are most common in open habitats including grasslands, shrublands, and montane parklands; however, they use a broad spectrum of other habitats including wetlands, wet and dry forests, and urban areas. The Hawaiian short-eared owl has been found from sea level to 8,000 ft (2,450 m) amsl. Unlike its mainland counterpart, the Hawaiian subspecies is largely diurnal (Mitchell et al. 2005).
Little is known about the breeding biology of the subspecies, but active nests have been found year round (Mitchell et al. 2005). Males perform aerial breeding displays to attract prospective females. Females incubate eggs and brood nestlings, while males provision females with food for themselves and their young, and defend nests. Young remain dependent on their parents for approximately two months (Mitchell et al. 2005). Clutch size is unknown in Hawaii and averages 5.6 eggs in North America (Murray 1976). Fledging success rates are unknown in Hawaiian short-eared owls and variable in other populations of the species; in Montana researchers found an average of 5.5 nestlings (91.4 percent of average clutch size) dispersed from the nest (Wiggins et al. 2006). In Manitoba, 4.0 young fledged of 7.5 that hatched (Clark 1975 in Wiggins et al. 2006), and in Massachusetts 2.1 young fledged of 3.4 that hatched (Holt and Melvin 1986 in Wiggins et al. 2006). Based on a small study on the Galapagos Islands (n = 7 nests), island populations may have smaller clutches than mainland populations (average 3.3 eggs; Groot 1983 as cited in Wiggins et al. 2006). Age at first breeding is unknown in the Hawaiian short-eared owl and is based on anecdotal information for the widespread species; the short-eared owl appears to nest beginning at 1 year of age (Wiggins et al. 2006).
Hawaiian short-eared owls primarily consume small mammals, but their diet also includes a variety of bird species (Snetsinger et al. 1994, Mostello 1996). Hawaiian short-eared owls forage in a variety of habitats, and their prey likely vary with the habitat.
Life span of the Hawaiian short-eared owl is not known. Limited North American Bird Banding Laboratory recovery records provide a longevity record for a wild short-eared owl as 4 years, 2 months (Wiggins et al. 2006), but in Europe the longevity records for wild birds include 12 years, 9 months
FINAL HABITAT CONSERVATION PLAN
Na Pua Makani Wind Energy Project 36
(Cramp 1985 in Wiggins et al. 2006) and 20 years, 9 months (Fransson et al. 2010). Annual survival rates are unknown.
3.8.5.2 Distribution, Abundance, and Population Trends
Hawaiian short-eared owls historically occurred on all of the southeastern Hawaiian Islands including adjacent islets (Pyle and Pyle 2009). They are considered sacred by native Hawaiians, but early Caucasian settlers killed them, and populations had declined by the late 1800s (Perkins 1895). Klavitter (2009), in a summary of their natural history, noted substantial population size decreases on all occupied islands, especially Oahu. In the 2000s, however, Pyle and Pyle (2009) suggest all populations have stabilized, although the populations show episodic peaks and “die-offs.”
3.8.5.3 Threats
Hawaiian short-eared owls are susceptible to many of the same factors that threaten other native Hawaiian birds, including: loss and degradation of habitat, predation by introduced mammals, and disease, as well as pesticide poisoning, food shortages, and vehicle collisions (Mitchell et al. 2005). However, Hawaiian short-eared owls persist in modified landscapes and at elevations where extensive exposure to avian malaria (Plasmodium relictum) and avian pox (Poxvirus avium) is certain. This suggests the species is able to cope with some of these threats.
When foraging, short-eared owls typically fly low over open areas, often at dusk or dawn. When these areas are traversed by roads, the species may be pre-disposed to collisions with vehicles. Collision risk for Hawaiian short-eared owls associated with the Project is discussed in Section 5.5.
3.8.5.4 Presence on Oahu and Potential for Occurrence in the Project Area
Hawaiian short-eared owls are rare on Oahu (Klavitter 2009, Pyle and Pyle 2009). Although none were detected during biological surveys for the Project (Hobdy 2013a; Sanzenbacher and Cooper 2013, avian point counts 2012 – 2013), the species was detected once during pre-construction avian point count surveys and once during pre-construction radar surveys for the neighboring Kahuku Wind Project (Day and Cooper 2008, SWCA 2010). Habitat within the Project area is similar to that at the Kahuku Wind Project and is consistent with the habitat used by Hawaiian short-eared owls throughout the Hawaiian Islands. However, given the diurnal and crepuscular activity pattern exhibited by this species and the few records of use in the vicinity, the likelihood of the species breeding in the area is low and, for this reason in combination with the lack of detections during Project biological surveys, the species is assumed to occur as an irregular visitor to the Project area.
3.8.6 Species Considered but Excluded
In addition to the species discussed earlier in this section, there are four species that were considered for inclusion in the HCP but were ultimately excluded from the document and for which it was deemed appropriate to provide a formal explanation of the rationale: Hawaiian petrel (Pterodroma
sandwichensis), blackline Hawaiian damselfly (Megalagrion nigrohamatum nigrolineatum), oceanic Hawaiian damselfly (M. oceanicum), and crimson Hawaiian damselfly (M. leptodemas). Each of these was evaluated for their potential to occur in the vicinity of the Project, and evidence indicated that the species were not present in the Project area and would not be impacted by the Project.
FINAL HABITAT CONSERVATION PLAN
Na Pua Makani Wind Energy Project 37
3.8.6.1 Hawaiian petrel
The Hawaiian petrel is not known or expected to breed on the island of Oahu with the most recent evidence of breeding limited to sub-fossil remains which precede European contact (Pyle and Pyle 2009). As the species is highly pelagic, except when breeding, it is very unlikely that individuals would transit the Project area, and therefore take is highly unlikely. The decision to exclude the Hawaiian petrel from the HCP is consistent with technical advice we received from USFWS and DOFAW.
3.8.6.2 Hawaiian damselflies
The blackline Hawaiian damselfly, oceanic Hawaiian damselfly, and crimson Hawaiian damselfly require habitat where the Ko`olau core-dike complex geological formation is exposed and rainfall exceeds 75 in (191 cm) per year (Polhemus 2007, USFWS 2012b). There is critical habitat meeting both of these criteria within 1.5 mi (2.4 km) of the Project area for these listed damselflies (77 FR 57647 – 57862; Polhemus 2007, USFWS 2012b). However, the Project area falls outside of the Ko`olau core-dike complex geological formation and has average rainfall of 45 – 57 in (114 – 145 cm) per year. The decision to exclude these damselflies from the HCP, as suitable habitat does not occur in the Project area and the potential for take is highly unlikely, is consistent with technical advice we received from USFWS and DOFAW.
4 GOALS AND CONSERVATION MEASURES
This section describes the biological goals and objectives of the HCP and presents measures that have already been incorporated in the planning stage or would be implemented in the future to avoid and minimize impacts to the Covered Species. This section is prepared in accordance with Sections 10(a)(2)(A) and 10(a)(2)(B) of the ESA, Section 195D-21(b)(2)(D) of the HRS, and federal regulations (50 CFR §§ 17.21 and 17.22).
4.1 Biological Goals and Objectives
The purpose of identifying goals and objectives for the HCP is to establish a framework for developing the conservation measures as outlined in the USFWS Five-point Policy guidance for the HCP process (USFWS and NMFS 2000). The biological goals and objectives identified in this section are consistent with the recovery plans of the Covered Species.
4.1.1 Goals
Biological goals are intended to be broad, guiding principles that clarify the purpose and direction of the HCP (USFWS and NMFS 2000). The specific goals of this HCP are to:
Avoid and minimize adverse impacts to the Covered Species consistent with the best available science and onsite minimization measures;
Mitigate unavoidable impacts to Covered Species by implementing habitat restoration, research, or species protection measures.
4.1.2 Objectives
The following species-specific biological objectives for achieving the HCP goals are designed to result in a net benefit for each of the Covered Species:
FINAL HABITAT CONSERVATION PLAN
Na Pua Makani Wind Energy Project 38
Apply best available science to manage Project construction, operation, and maintenance to avoid and minimize to the extent practicable direct and indirect impacts to the Covered Species;
Offset the potential direct and indirect effects of the Project on the Hawaiian hoary bat that cannot be practicably avoided and provide a net benefit by implementing a mitigation plan that provides funding for research as well as habitat restoration and/or habitat acquisition;
Offset the potential direct and indirect effects of the Project on the Newell’s shearwater that cannot be practicably avoided and provide a net benefit by implementing a mitigation plan that provides funding for management, habitat restoration and/or preservation, and/or research;
Offset the potential direct and direct and indirect effects of the Project on the Hawaiian goose that cannot be practicably avoided and provide a net benefit by implementing a mitigation plan that provides funding for management and/or research;
Offset the potential direct and indirect effects of the Project on the Hawaiian duck, Hawaiian stilt, Hawaiian coot, and Hawaiian moorhen that cannot be practicably avoided and provide a net benefit by implementing a mitigation plan that provides funding for management; and
Offset the potential direct and indirect effects of the Project on the Hawaiian short-eared owl that cannot be practicably avoided and provide a net benefit by implementing a mitigation plan that provides funding for management and/or research.
4.2 Avoidance and Minimization of Impacts
Sections 10(a)(2)(A)(ii) and 10(a)(2)(B)(ii) of the ESA require that an HCP describe the steps that will be taken to avoid, minimize, and mitigate the effects of the take provided for in the plan. Where avoidance of take is not possible, take must be minimized and mitigated to the maximum extent practicable. Na Pua Makani Power Partners has incorporated siting and design measures and identified operational measures that will avoid and minimize take of the Covered Species, and these measures would do the same for other bird species. These measures include the selection of Project components, siting considerations, as well as general Project development measures.
4.2.1 Project Components and Siting Considerations
The three Project temporary guyed met towers were fitted with bird flight diverters and/or white poly tape (1-in [2.5 cm]) to increase visibility and, as a result, the likelihood of avoidance by Covered Species.
The Project plans to install an un-guyed, free-standing permanent met tower to maximize the detectability of all features of the structure for birds and bats and minimize the risk of collision. This permanent tower would replace one temporary guyed met tower, and the remaining temporary met towers would be removed before the commercial operation date.
The majority of the wind facility is sited in disturbed agricultural habitat, which minimizes impacts to most native species.
The Project area does not have suitable listed waterbird breeding or foraging habitat thereby minimizing Hawaiian duck, Hawaiian stilt, Hawaiian coot, and Hawaiian moorhen use of the Project area and minimizing potential Project impacts to these species.
FINAL HABITAT CONSERVATION PLAN
Na Pua Makani Wind Energy Project 39
To minimize potential impacts to wildlife, on-site lighting at the O&M building and substation will be shielded and/or directed downward, triggered by a motion detector, and fitted with non-white light bulbs. Lighting is only expected to be used when workers are at the site at night. Most operations and maintenance activities are expected to occur during daylight hours. Nighttime activity during construction is addressed in Section 4.2.2.
Barbed wire will not be used on perimeter fences required to secure Project infrastructure to avoid the risk of entangling bats.
Nacelle lighting will not be used except as required by FAA standards. Flashing red lights have been shown to not be attractive to birds and will be used in accordance with FAA requirements.
The collection line will be placed below ground to the maximum extent practicable, thereby reducing the risk of collision of the Covered Species.
New above-ground portions of power lines associated with the Project will use line marking devices to improve visibility to birds and follow Avian Protection Plan Guidelines (APLIC 2012).
4.2.2 General Project Development Measures
Hawaiian hoary bats roost in non-native and native woody vegetation that is at least 15 ft (4.5 m) or taller. To minimize potential impacts to the Hawaiian hoary bat, woody plants greater than 15 ft (4.5 m) tall will not be removed or trimmed between June 1 and September 15 during the installation and ongoing maintenance of the Project structures.
Na Pua Makani Power Partners will implement low wind speed curtailment to reduce potential impacts to Hawaiian hoary bats. Proposed implementation will include increasing manufacturer’s recommended cut-in speeds to 16 feet per second (ft/s; 5 meter per second [m/s]) and feathering WTG blades into the wind below 16 ft/s (5 m/s). Low wind speed curtailment will be instituted March – November between sunset and sunrise. In addition to the intended benefit of reducing bat fatalities, low wind speed curtailment will reduce the risk to Newell’s shearwaters, which could transit the Project at night April – November.
Na Pua Makani Power Partners will deploy bat acoustic monitors at the Project to document bat acoustic activity for a period during operations. Results from this monitoring may potentially be used to adaptively manage implementation of low wind speed curtailment to reduce observed and unobserved bat fatalities.
A daytime speed limit of 25 miles per hour (mph; 40 kilometers per hour [kph]) and a nighttime speed limit of 10 mph (16 kph) will be observed on Project area roads to minimize the potential for vehicle collisions with Covered Species.
Should the Hawaiian goose begin to use the Project area for foraging or nesting, Na Pua Makani Power Partners will reduce daytime speed limits to 10 mph (16 kph) to minimize the potential for vehicle collisions.
Stormwater management on the Project including the WTG tower pads and roads will be designed to avoid the potential for accumulating standing water, which could serve as an attractant to waterbird species.
FINAL HABITAT CONSERVATION PLAN
Na Pua Makani Wind Energy Project 40
As appropriate to control erosion or other site-specific concerns, disturbed areas will be replanted with non-invasive resident species that are compatible with Project operations, such as being suitable for post-construction mortality monitoring within search areas. To the extent practicable, Na Pua Makani Power Partners will minimize the creation of suitable Hawaiian goose nesting habitat (shrubs adjacent to low-growing grass) in developing post-construction monitoring search plots.
Trash will be collected in lidded receptacles and removed from the construction area on a weekly basis to avoid attraction of ants and other animals such as mongooses, cats, and rats that may negatively affect the Covered Species or Na Pua Makani Power Partners’ ability to detect fatalities of the Covered Species.
Na Pua Makani Power Partners will maximize the amount of construction activity that can occur in daylight during the seabird breeding season including the peak fledging period (approximately October 15 – November 23).
Should nighttime construction be required, Na Pua Makani Power Partners will use shielded lights and maximize the use of non-white lights if construction safety is not compromised to minimize the attractiveness of construction lights to wildlife. Na Pua Makani Power Partners will also have a biological monitor in the construction area to watch for the presence of Covered Species at all times during nighttime construction. Should a Covered Species be observed, the monitor will stop construction activities and shut down construction lighting until the individual(s) move out of the area.
To address concerns about fire safety, Na Pua Makani Power Partners will establish fire safety-related construction and O&M requirements (including landscaping considerations), response protocols, and responsibilities. This information will be included in the Project EIS.
An invasive species, chromolaena (Chromolaena odorata), occurs on the nearby Kahuku training area. Na Pua Makani Power Partners will coordinate with the Oahu Invasive Species Committee to identify and implement measures to minimize the risk of introducing chromolaena to the Project area. Approaches to minimize risk may include periodic site inspections by qualified personnel to search for the presence of plants and cleaning of equipment used in Project areas.
5 ASSESSMENT OF POTENTIAL IMPACTS AND TAKE LIMITS
The requested take limit for each Covered Species consists of three components: estimated direct take, estimated indirect take, and additional adjustments to the combined direct and indirect take estimates to achieve an overall conservative estimate of potential Project take. The rationale for each of these is described in subsections (Direct Take, Indirect Take, and Authorized Take Request for ITP and ITL) for each of the Covered Species. Na Pua Makani Power Partners is currently considering WTG models from leading turbine manufacturers including Siemens, Vestas, and GE. The Project WTG array could include a combination of models from a single manufacturer ranging in generating capacity and dimensions. To meet county setback requirements shorter WTGs may be constructed at locations nearer to the parcel boundary. However, to conservatively assess estimated take for each species, a WTG array consisting of 9 WTGs with the tallest expected maximum blade tip height is used. The largest WTG under consideration at this time has a hub height of 443 ft (135 m) and a rotor diameter of 426.5 ft (130 m); as a result the maximum blade tip height for this model is 656 ft (200 m). In reality, if the largest WTG model were
FINAL HABITAT CONSERVATION PLAN
Na Pua Makani Wind Energy Project 41
selected a total of 8 WTGs would be constructed. It is assumed that risk to the Covered Species would be less than assessed in this HCP if a smaller WTG model were selected.
5.1 Hawaiian Hoary bat
5.1.1 Direct Take
The most likely potential source of direct bat mortality is a collision or barotrauma associated with an operational WTG, as has been documented at other Oahu wind facilities (Kahuku Wind Power 2013, Kawailoa Wind Power 2013). The Kahuku Wind Project provides the best available data to estimate potential direct take resulting from WTG interactions at the Project for multiple reasons. First, the Kahuku Wind Project is immediately adjacent to the proposed Na Pua Makani site, so the sites have similarities in landscape features (e.g., slope, aspect, elevation). Second, the Kahuku Wind Project has the longest operational history on Oahu, which provides the most comprehensive dataset for these estimates. Finally, the Kahuku Wind Project has a similar number of WTGs as the Project.
Estimates of direct take for the Project were derived by adjusting observed take at the Kahuku Wind Project to the maximum number of WTGs at Na Pua Makani and scaling these values for unobserved take. Calculations were based on the Kahuku Wind Project’s fatality monitoring data while the Kahuku Wind Project was operational March 2011 – August 2012 and August 2013 – July 20154. During a portion of this period the Kahuku Wind Project implemented low wind speed curtailment to reduce the risk of bat fatalities. The Kahuku Wind Project documented three observed bat fatalities during approximately 1.17 years (March 2011 – April 2012) when operations did not include seasonal low wind speed curtailment and 1 observed bat fatality during 2.17 years when operations included seasonal low wind speed curtailment. This translates to an observed bat mortality of 0.21 bats per WTG per year when low wind speed curtailment was not implemented and 0.04 bats per WTG per year when turbines were operated using seasonal low wind speed curtailment. In order to develop a single observed fatality rate for the Kahuku Wind Project, fatalities occurring during the low wind speed curtailment period were increased by 65 percent (the estimated benefit of low wind speed curtailment; see Section 5.1.3), and this value was combined with the observed fatality rate when low wind speed curtailment was not used. The resulting value represents an overall estimate of observed annual take per WTG at the Kahuku Wind Project under no low wind speed curtailment.
Not all fatalities are expected to be found and to evaluate actual direct take, estimates need to account for undiscovered fatalities. The probability that a carcass is available to be found when the search takes place (i.e., it has not been scavenged prior to the search) and the likelihood that a searcher actually observes an available carcass both have an effect on the proportion of actual fatalities that are discovered by searchers. Post-construction monitoring efforts at the Kahuku Wind Project have been adaptively managed over time with changes including the implementation of scavenger trapping and the training and deployment of canine search teams. Through these changes, the Kahuku Wind Project have increased carcass persistence times and improved searcher efficiency. Based on analyses in the 2014 annual HCP compliance report from the Kahuku Wind Project, approximately one undetected bat fatality may be present for each detected fatality. To conservatively estimate actual take at the Kahuku Wind Project for use in the Project analysis, it is assumed on average 2 undetected bat fatalities may occur for each observed bat fatality.
4 The Kahuku Wind Project remains operational, but estimates are based on observed fatality data through July 31, 2015.
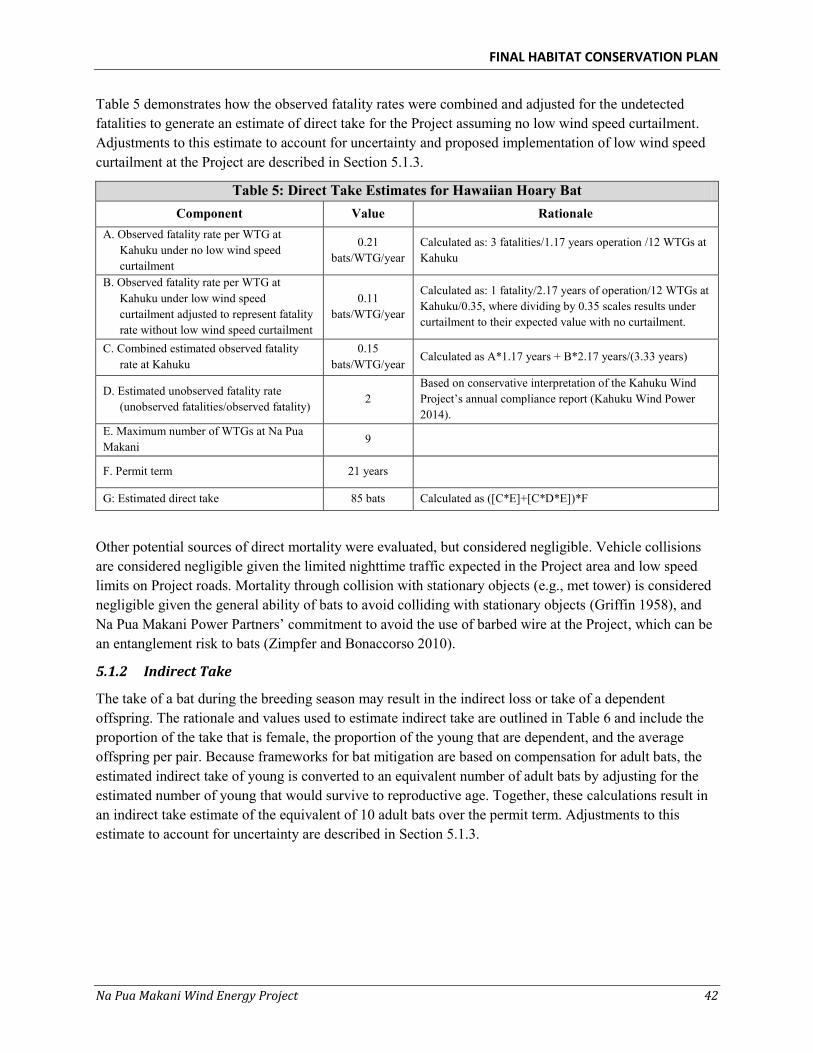
FINAL HABITAT CONSERVATION PLAN
Na Pua Makani Wind Energy Project 42
Table 5 demonstrates how the observed fatality rates were combined and adjusted for the undetected fatalities to generate an estimate of direct take for the Project assuming no low wind speed curtailment. Adjustments to this estimate to account for uncertainty and proposed implementation of low wind speed curtailment at the Project are described in Section 5.1.3.
Table 5: Direct Take Estimates for Hawaiian Hoary Bat Component Value Rationale
A. Observed fatality rate per WTG at Kahuku under no low wind speed curtailment
0.21 bats/WTG/year
Calculated as: 3 fatalities/1.17 years operation /12 WTGs at Kahuku
B. Observed fatality rate per WTG at Kahuku under low wind speed curtailment adjusted to represent fatality rate without low wind speed curtailment
0.11 bats/WTG/year
Calculated as: 1 fatality/2.17 years of operation/12 WTGs at Kahuku/0.35, where dividing by 0.35 scales results under curtailment to their expected value with no curtailment.
C. Combined estimated observed fatality rate at Kahuku
0.15 bats/WTG/year
Calculated as A*1.17 years + B*2.17 years/(3.33 years)
D. Estimated unobserved fatality rate (unobserved fatalities/observed fatality)
2 Based on conservative interpretation of the Kahuku Wind Project’s annual compliance report (Kahuku Wind Power 2014).
E. Maximum number of WTGs at Na Pua Makani
9
F. Permit term 21 years
G: Estimated direct take 85 bats Calculated as ([C*E]+[C*D*E])*F
Other potential sources of direct mortality were evaluated, but considered negligible. Vehicle collisions are considered negligible given the limited nighttime traffic expected in the Project area and low speed limits on Project roads. Mortality through collision with stationary objects (e.g., met tower) is considered negligible given the general ability of bats to avoid colliding with stationary objects (Griffin 1958), and Na Pua Makani Power Partners’ commitment to avoid the use of barbed wire at the Project, which can be an entanglement risk to bats (Zimpfer and Bonaccorso 2010).
5.1.2 Indirect Take
The take of a bat during the breeding season may result in the indirect loss or take of a dependent offspring. The rationale and values used to estimate indirect take are outlined in Table 6 and include the proportion of the take that is female, the proportion of the young that are dependent, and the average offspring per pair. Because frameworks for bat mitigation are based on compensation for adult bats, the estimated indirect take of young is converted to an equivalent number of adult bats by adjusting for the estimated number of young that would survive to reproductive age. Together, these calculations result in an indirect take estimate of the equivalent of 10 adult bats over the permit term. Adjustments to this estimate to account for uncertainty are described in Section 5.1.3.
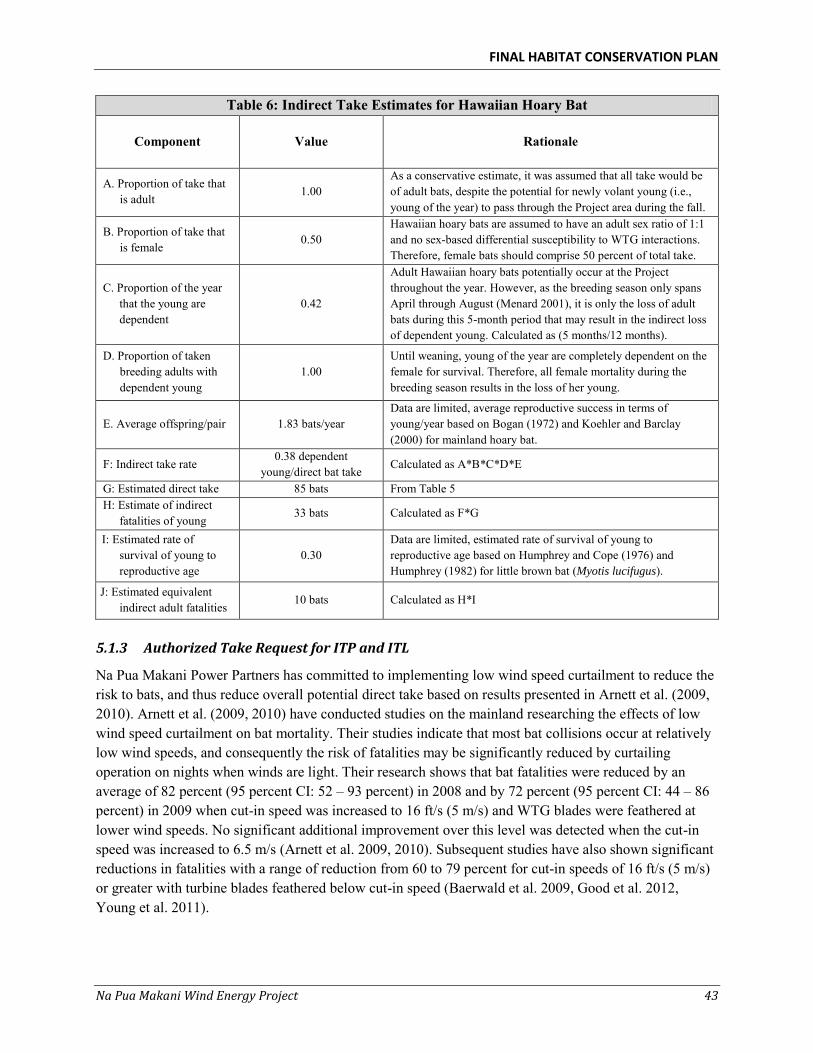
FINAL HABITAT CONSERVATION PLAN
Na Pua Makani Wind Energy Project 43
Table 6: Indirect Take Estimates for Hawaiian Hoary Bat
Component Value Rationale
A. Proportion of take that is adult
1.00 As a conservative estimate, it was assumed that all take would be of adult bats, despite the potential for newly volant young (i.e., young of the year) to pass through the Project area during the fall.
B. Proportion of take that is female
0.50 Hawaiian hoary bats are assumed to have an adult sex ratio of 1:1 and no sex-based differential susceptibility to WTG interactions. Therefore, female bats should comprise 50 percent of total take.
C. Proportion of the year that the young are dependent
0.42
Adult Hawaiian hoary bats potentially occur at the Project throughout the year. However, as the breeding season only spans April through August (Menard 2001), it is only the loss of adult bats during this 5-month period that may result in the indirect loss of dependent young. Calculated as (5 months/12 months).
D. Proportion of taken breeding adults with dependent young
1.00 Until weaning, young of the year are completely dependent on the female for survival. Therefore, all female mortality during the breeding season results in the loss of her young.
E. Average offspring/pair 1.83 bats/year Data are limited, average reproductive success in terms of young/year based on Bogan (1972) and Koehler and Barclay (2000) for mainland hoary bat.
F: Indirect take rate 0.38 dependent
young/direct bat take Calculated as A*B*C*D*E
G: Estimated direct take 85 bats From Table 5 H: Estimate of indirect
fatalities of young 33 bats Calculated as F*G
I: Estimated rate of survival of young to reproductive age
0.30 Data are limited, estimated rate of survival of young to reproductive age based on Humphrey and Cope (1976) and Humphrey (1982) for little brown bat (Myotis lucifugus).
J: Estimated equivalent indirect adult fatalities
10 bats Calculated as H*I
5.1.3 Authorized Take Request for ITP and ITL
Na Pua Makani Power Partners has committed to implementing low wind speed curtailment to reduce the risk to bats, and thus reduce overall potential direct take based on results presented in Arnett et al. (2009, 2010). Arnett et al. (2009, 2010) have conducted studies on the mainland researching the effects of low wind speed curtailment on bat mortality. Their studies indicate that most bat collisions occur at relatively low wind speeds, and consequently the risk of fatalities may be significantly reduced by curtailing operation on nights when winds are light. Their research shows that bat fatalities were reduced by an average of 82 percent (95 percent CI: 52 – 93 percent) in 2008 and by 72 percent (95 percent CI: 44 – 86 percent) in 2009 when cut-in speed was increased to 16 ft/s (5 m/s) and WTG blades were feathered at lower wind speeds. No significant additional improvement over this level was detected when the cut-in speed was increased to 6.5 m/s (Arnett et al. 2009, 2010). Subsequent studies have also shown significant reductions in fatalities with a range of reduction from 60 to 79 percent for cut-in speeds of 16 ft/s (5 m/s) or greater with turbine blades feathered below cut-in speed (Baerwald et al. 2009, Good et al. 2012, Young et al. 2011).
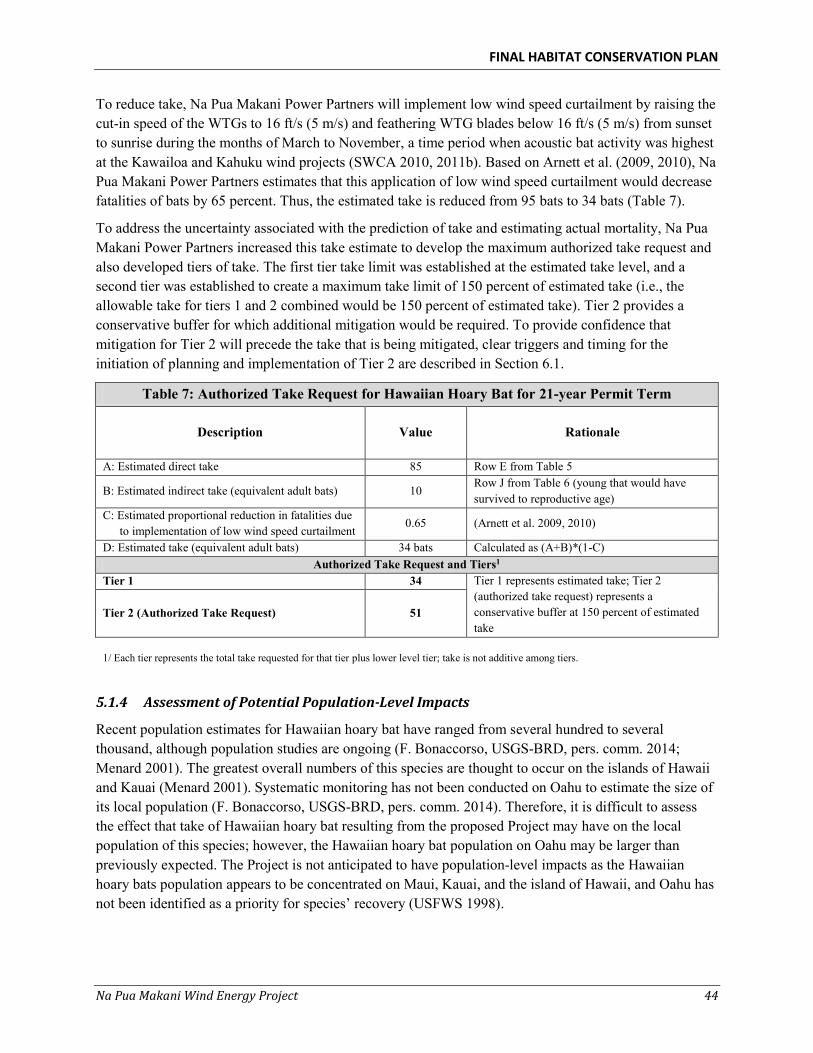
FINAL HABITAT CONSERVATION PLAN
Na Pua Makani Wind Energy Project 44
To reduce take, Na Pua Makani Power Partners will implement low wind speed curtailment by raising the cut-in speed of the WTGs to 16 ft/s (5 m/s) and feathering WTG blades below 16 ft/s (5 m/s) from sunset to sunrise during the months of March to November, a time period when acoustic bat activity was highest at the Kawailoa and Kahuku wind projects (SWCA 2010, 2011b). Based on Arnett et al. (2009, 2010), Na Pua Makani Power Partners estimates that this application of low wind speed curtailment would decrease fatalities of bats by 65 percent. Thus, the estimated take is reduced from 95 bats to 34 bats (Table 7).
To address the uncertainty associated with the prediction of take and estimating actual mortality, Na Pua Makani Power Partners increased this take estimate to develop the maximum authorized take request and also developed tiers of take. The first tier take limit was established at the estimated take level, and a second tier was established to create a maximum take limit of 150 percent of estimated take (i.e., the allowable take for tiers 1 and 2 combined would be 150 percent of estimated take). Tier 2 provides a conservative buffer for which additional mitigation would be required. To provide confidence that mitigation for Tier 2 will precede the take that is being mitigated, clear triggers and timing for the initiation of planning and implementation of Tier 2 are described in Section 6.1.
Table 7: Authorized Take Request for Hawaiian Hoary Bat for 21-year Permit Term
Description Value Rationale
A: Estimated direct take 85 Row E from Table 5
B: Estimated indirect take (equivalent adult bats) 10 Row J from Table 6 (young that would have survived to reproductive age)
C: Estimated proportional reduction in fatalities due to implementation of low wind speed curtailment
0.65 (Arnett et al. 2009, 2010)
D: Estimated take (equivalent adult bats) 34 bats Calculated as (A+B)*(1-C) Authorized Take Request and Tiers1
Tier 1 34 Tier 1 represents estimated take; Tier 2 (authorized take request) represents a conservative buffer at 150 percent of estimated take
Tier 2 (Authorized Take Request) 51
1/ Each tier represents the total take requested for that tier plus lower level tier; take is not additive among tiers.
5.1.4 Assessment of Potential Population-Level Impacts
Recent population estimates for Hawaiian hoary bat have ranged from several hundred to several thousand, although population studies are ongoing (F. Bonaccorso, USGS-BRD, pers. comm. 2014; Menard 2001). The greatest overall numbers of this species are thought to occur on the islands of Hawaii and Kauai (Menard 2001). Systematic monitoring has not been conducted on Oahu to estimate the size of its local population (F. Bonaccorso, USGS-BRD, pers. comm. 2014). Therefore, it is difficult to assess the effect that take of Hawaiian hoary bat resulting from the proposed Project may have on the local population of this species; however, the Hawaiian hoary bat population on Oahu may be larger than previously expected. The Project is not anticipated to have population-level impacts as the Hawaiian hoary bats population appears to be concentrated on Maui, Kauai, and the island of Hawaii, and Oahu has not been identified as a priority for species’ recovery (USFWS 1998).
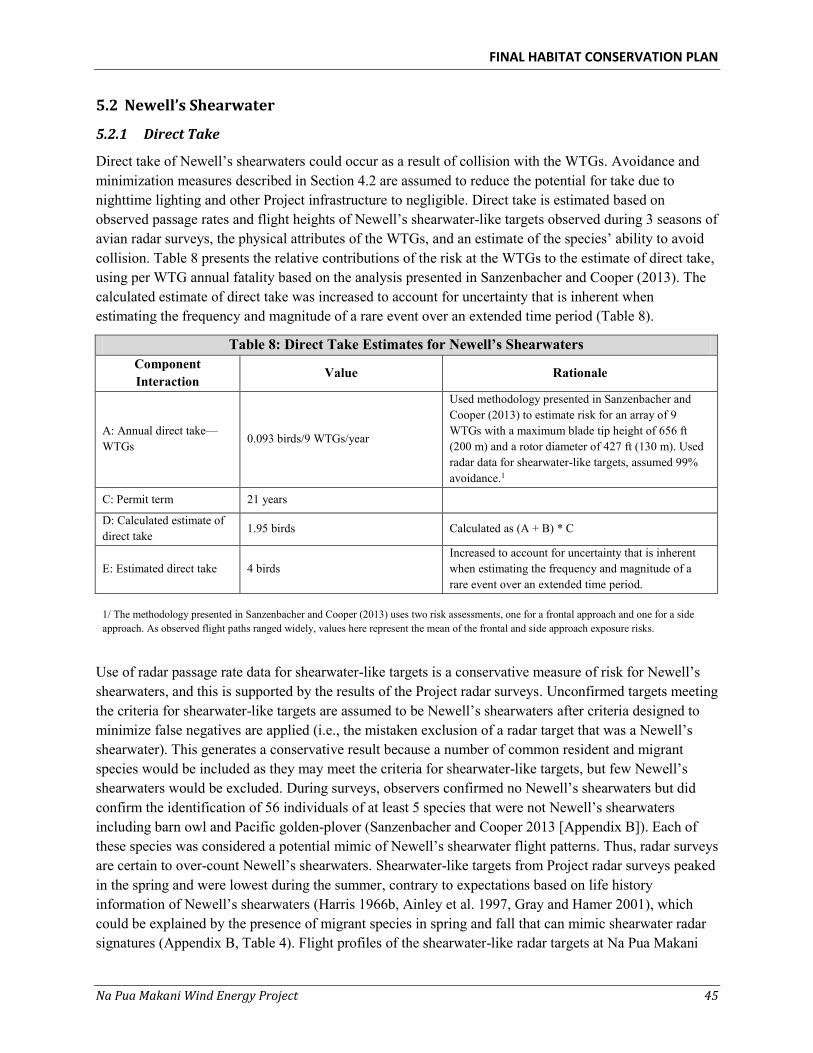
FINAL HABITAT CONSERVATION PLAN
Na Pua Makani Wind Energy Project 45
5.2 Newell’s Shearwater
5.2.1 Direct Take
Direct take of Newell’s shearwaters could occur as a result of collision with the WTGs. Avoidance and minimization measures described in Section 4.2 are assumed to reduce the potential for take due to nighttime lighting and other Project infrastructure to negligible. Direct take is estimated based on observed passage rates and flight heights of Newell’s shearwater-like targets observed during 3 seasons of avian radar surveys, the physical attributes of the WTGs, and an estimate of the species’ ability to avoid collision. Table 8 presents the relative contributions of the risk at the WTGs to the estimate of direct take, using per WTG annual fatality based on the analysis presented in Sanzenbacher and Cooper (2013). The calculated estimate of direct take was increased to account for uncertainty that is inherent when estimating the frequency and magnitude of a rare event over an extended time period (Table 8).
Table 8: Direct Take Estimates for Newell’s Shearwaters Component Interaction
Value Rationale
A: Annual direct take—WTGs 0.093 birds/9 WTGs/year
Used methodology presented in Sanzenbacher and Cooper (2013) to estimate risk for an array of 9 WTGs with a maximum blade tip height of 656 ft (200 m) and a rotor diameter of 427 ft (130 m). Used radar data for shearwater-like targets, assumed 99% avoidance.1
C: Permit term 21 years
D: Calculated estimate of direct take 1.95 birds Calculated as (A + B) * C
E: Estimated direct take 4 birds Increased to account for uncertainty that is inherent when estimating the frequency and magnitude of a rare event over an extended time period.
1/ The methodology presented in Sanzenbacher and Cooper (2013) uses two risk assessments, one for a frontal approach and one for a side approach. As observed flight paths ranged widely, values here represent the mean of the frontal and side approach exposure risks.
Use of radar passage rate data for shearwater-like targets is a conservative measure of risk for Newell’s shearwaters, and this is supported by the results of the Project radar surveys. Unconfirmed targets meeting the criteria for shearwater-like targets are assumed to be Newell’s shearwaters after criteria designed to minimize false negatives are applied (i.e., the mistaken exclusion of a radar target that was a Newell’s shearwater). This generates a conservative result because a number of common resident and migrant species would be included as they may meet the criteria for shearwater-like targets, but few Newell’s shearwaters would be excluded. During surveys, observers confirmed no Newell’s shearwaters but did confirm the identification of 56 individuals of at least 5 species that were not Newell’s shearwaters including barn owl and Pacific golden-plover (Sanzenbacher and Cooper 2013 [Appendix B]). Each of these species was considered a potential mimic of Newell’s shearwater flight patterns. Thus, radar surveys are certain to over-count Newell’s shearwaters. Shearwater-like targets from Project radar surveys peaked in the spring and were lowest during the summer, contrary to expectations based on life history information of Newell’s shearwaters (Harris 1966b, Ainley et al. 1997, Gray and Hamer 2001), which could be explained by the presence of migrant species in spring and fall that can mimic shearwater radar signatures (Appendix B, Table 4). Flight profiles of the shearwater-like radar targets at Na Pua Makani
FINAL HABITAT CONSERVATION PLAN
Na Pua Makani Wind Energy Project 46
also suggest that some of the shearwater-like targets are not Newell’s shearwaters, as flight heights observed at Na Pua Makani varied seasonally (Sanzenbacher and Cooper 2013 [Appendix B]). Variation in flight height by season is most likely a result of seasonal changes in the composition of species that make up the shearwater-like targets. These observations indicate that the measured passage rate of shearwater-like targets at Na Pua Makani is higher than the passage rate of actual Newell’s shearwaters, which ultimately results in a conservative estimate of take.
Pre-construction radar studies at other northern Oahu wind projects support that radar results provide a conservative picture of use in the area, and results from post-construction mortality monitoring efforts at these projects support that the risk to Newell’s shearwaters on Oahu is low. No Newell’s shearwaters were confirmed during radar surveys at the Kahuku or Kawailoa wind projects, and summer passage rates of shearwater-like targets at the two projects were comparable to the summer passage rate documented at Na Pua Makani (Day and Cooper 2008, Cooper et al. 2009). In each case, fall passage rates were higher than during the expected summer peak period (Table 4). Fall passage rates at Kawailoa were more than twice the summer rates, and contamination of their fall radar data by non-shearwater mimics was highlighted as a likely cause (Cooper et al. 2009). Post-construction mortality monitoring efforts on Oahu wind projects during 1 peak breeding season at Kawailoa and 2 peak breeding seasons at Kahuku have not documented a single Newell’s shearwater fatality, nor have any been found at operational wind facilities on Maui, where the species is known to breed (Wood and Bily 2008; A. Nadig, USFWS, pers. comm. 2014).
In assessing the risk of interactions with wind energy facilities, the term avoidance rate is defined as the probability that an individual bird that nears the airspace of a WTG is able to avoid colliding with it. Behavioral studies of Hawaiian procellariids (shearwaters and petrels) are few. Due to small sample sizes, the similarity of flight characteristics, and similar evolutionary environments, avoidance information for these taxa are best considered as a group. Evidence suggests that Hawaiian petrels and Newell’s shearwaters have very high avoidance rates, perhaps greater than 99 percent (Sanzenbacher and Cooper 2013), but collisions with power lines remain a concern especially on Kauai. Likely drivers for collision fatalities on Kauai are the large population of breeding birds in combination with the parallel orientation of power lines relative to the coast line and the presence of power lines that are in strong relief relative to the surrounding topography and vegetation (Griesemer and Holmes 2011). Swift (2004) documented only one collision of a Hawaiian petrel with a fence line in 1,539 passes.
Given the strong likelihood that some of the shearwater-like targets are not Newell’s shearwaters and evidence that Hawaiian procellariids’ avoidance is close to 99 percent, 99 percent avoidance is used to assess risk for Newell’s shearwaters at Project WTGs (Table 8). Na Pua Makani Power Partners also will implement low wind speed curtailment during March – November to reduce Hawaiian hoary bat fatalities a measure which would also benefit Newell’s shearwaters. This minimization measure is not taken into account in the estimate of direct take for Newell’s shearwaters, increasing the conservative nature of the direct take estimate. Furthermore, this risk analysis assumes that WTGs are spinning 24 hours per day year round, which is a highly conservative assumption, given that WTGs typically produce power approximately 40 percent of the time (Na Pua Makani Power Partners, pers. comm. 2014).
The likelihood for Newell’s shearwaters to collide with Project components such as construction cranes, the permanent met tower, and vehicles, if driven at night, is negligible. Construction equipment would be present for relatively short periods and is highly visible. There are no known Newell’s shearwater breeding colonies on Oahu, and passage rates of potential Newell’s shearwaters during Project nocturnal
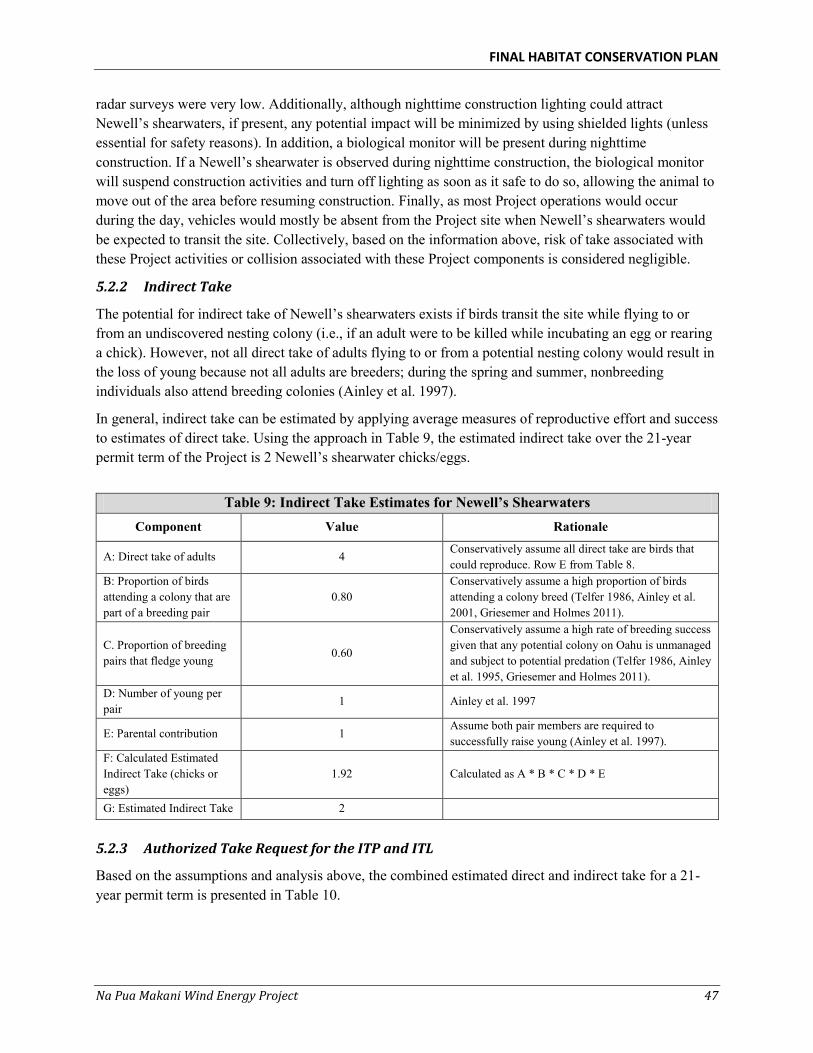
FINAL HABITAT CONSERVATION PLAN
Na Pua Makani Wind Energy Project 47
radar surveys were very low. Additionally, although nighttime construction lighting could attract Newell’s shearwaters, if present, any potential impact will be minimized by using shielded lights (unless essential for safety reasons). In addition, a biological monitor will be present during nighttime construction. If a Newell’s shearwater is observed during nighttime construction, the biological monitor will suspend construction activities and turn off lighting as soon as it safe to do so, allowing the animal to move out of the area before resuming construction. Finally, as most Project operations would occur during the day, vehicles would mostly be absent from the Project site when Newell’s shearwaters would be expected to transit the site. Collectively, based on the information above, risk of take associated with these Project activities or collision associated with these Project components is considered negligible.
5.2.2 Indirect Take
The potential for indirect take of Newell’s shearwaters exists if birds transit the site while flying to or from an undiscovered nesting colony (i.e., if an adult were to be killed while incubating an egg or rearing a chick). However, not all direct take of adults flying to or from a potential nesting colony would result in the loss of young because not all adults are breeders; during the spring and summer, nonbreeding individuals also attend breeding colonies (Ainley et al. 1997).
In general, indirect take can be estimated by applying average measures of reproductive effort and success to estimates of direct take. Using the approach in Table 9, the estimated indirect take over the 21-year permit term of the Project is 2 Newell’s shearwater chicks/eggs.
Table 9: Indirect Take Estimates for Newell’s Shearwaters
Component Value Rationale
A: Direct take of adults 4 Conservatively assume all direct take are birds that could reproduce. Row E from Table 8.
B: Proportion of birds attending a colony that are part of a breeding pair
0.80 Conservatively assume a high proportion of birds attending a colony breed (Telfer 1986, Ainley et al. 2001, Griesemer and Holmes 2011).
C. Proportion of breeding pairs that fledge young 0.60
Conservatively assume a high rate of breeding success given that any potential colony on Oahu is unmanaged and subject to potential predation (Telfer 1986, Ainley et al. 1995, Griesemer and Holmes 2011).
D: Number of young per pair
1 Ainley et al. 1997
E: Parental contribution 1 Assume both pair members are required to successfully raise young (Ainley et al. 1997).
F: Calculated Estimated Indirect Take (chicks or eggs)
1.92 Calculated as A * B * C * D * E
G: Estimated Indirect Take 2
5.2.3 Authorized Take Request for the ITP and ITL
Based on the assumptions and analysis above, the combined estimated direct and indirect take for a 21-year permit term is presented in Table 10.
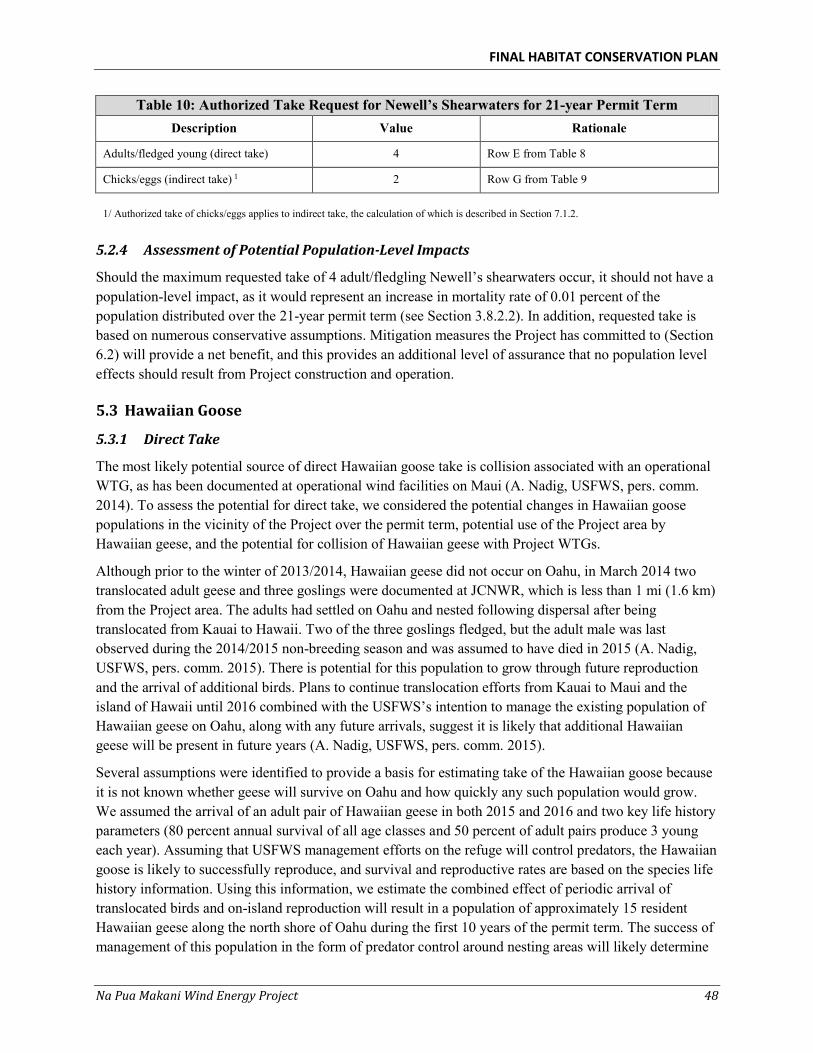
FINAL HABITAT CONSERVATION PLAN
Na Pua Makani Wind Energy Project 48
Table 10: Authorized Take Request for Newell’s Shearwaters for 21-year Permit Term Description Value Rationale
Adults/fledged young (direct take) 4 Row E from Table 8
Chicks/eggs (indirect take) 1 2 Row G from Table 9
1/ Authorized take of chicks/eggs applies to indirect take, the calculation of which is described in Section 7.1.2.
5.2.4 Assessment of Potential Population-Level Impacts
Should the maximum requested take of 4 adult/fledgling Newell’s shearwaters occur, it should not have a population-level impact, as it would represent an increase in mortality rate of 0.01 percent of the population distributed over the 21-year permit term (see Section 3.8.2.2). In addition, requested take is based on numerous conservative assumptions. Mitigation measures the Project has committed to (Section 6.2) will provide a net benefit, and this provides an additional level of assurance that no population level effects should result from Project construction and operation.
5.3 Hawaiian Goose
5.3.1 Direct Take
The most likely potential source of direct Hawaiian goose take is collision associated with an operational WTG, as has been documented at operational wind facilities on Maui (A. Nadig, USFWS, pers. comm. 2014). To assess the potential for direct take, we considered the potential changes in Hawaiian goose populations in the vicinity of the Project over the permit term, potential use of the Project area by Hawaiian geese, and the potential for collision of Hawaiian geese with Project WTGs.
Although prior to the winter of 2013/2014, Hawaiian geese did not occur on Oahu, in March 2014 two translocated adult geese and three goslings were documented at JCNWR, which is less than 1 mi (1.6 km) from the Project area. The adults had settled on Oahu and nested following dispersal after being translocated from Kauai to Hawaii. Two of the three goslings fledged, but the adult male was last observed during the 2014/2015 non-breeding season and was assumed to have died in 2015 (A. Nadig, USFWS, pers. comm. 2015). There is potential for this population to grow through future reproduction and the arrival of additional birds. Plans to continue translocation efforts from Kauai to Maui and the island of Hawaii until 2016 combined with the USFWS’s intention to manage the existing population of Hawaiian geese on Oahu, along with any future arrivals, suggest it is likely that additional Hawaiian geese will be present in future years (A. Nadig, USFWS, pers. comm. 2015).
Several assumptions were identified to provide a basis for estimating take of the Hawaiian goose because it is not known whether geese will survive on Oahu and how quickly any such population would grow. We assumed the arrival of an adult pair of Hawaiian geese in both 2015 and 2016 and two key life history parameters (80 percent annual survival of all age classes and 50 percent of adult pairs produce 3 young each year). Assuming that USFWS management efforts on the refuge will control predators, the Hawaiian goose is likely to successfully reproduce, and survival and reproductive rates are based on the species life history information. Using this information, we estimate the combined effect of periodic arrival of translocated birds and on-island reproduction will result in a population of approximately 15 resident Hawaiian geese along the north shore of Oahu during the first 10 years of the permit term. The success of management of this population in the form of predator control around nesting areas will likely determine
FINAL HABITAT CONSERVATION PLAN
Na Pua Makani Wind Energy Project 49
the long-term trajectory of the population, but assuming ongoing and successful active management and the same life history parameters, we estimate a population of approximately 50 Hawaiian geese could be resident on the north shore of Oahu by the end of the 21-year permit term.
These birds are likely to use JCNWR, surrounding wetland areas, golf courses, and other areas where short grass or vegetation provides opportunities to forage. To facilitate required post-construction monitoring efforts at some operational wind projects, vegetated areas beneath WTGs are regularly maintained, and these may attract the Hawaiian goose. Therefore, it is likely that Hawaiian geese in the vicinity will fly through the Project area as well as potentially use the post-construction monitoring plots for foraging.
During the first 9.33 years of operation at the 20-WTG Kaheawa Pastures I Wind Project on Maui, 21 Hawaiian goose fatalities were found, or 0.11 fatalities/WTG/year. However, the population of Hawaiian geese is currently much higher on Maui than on Oahu, with a flock of more than 100 currently resident in the vicinity of the Kaheawa Pastures I Wind Project (A. Nadig, USFWS, pers. comm. 2014). Therefore, take at the Project is likely to be substantially lower than that observed on Maui. Assuming risk of collision is a function of population in the vicinity and assuming that population will grow over time, annual per WTG fatalities of the Hawaiian goose would be expected to increase through the permit term. Because the estimated population on Oahu, given the conservative assumptions described above, would be approximately 50 Hawaiian geese at the end of the permit term, it is assumed the fatality rate at the end of the permit term would be approximately half that currently found at Kaheawa Pastures I Wind Project (Table 11).
5.3.2 Indirect Take
Hawaiian goose biology suggests they are not likely to collide with WTGs and associated structures when they are breeding, as they are unlikely to fly during this period; therefore, the potential for indirect take of the Hawaiian goose is low. The Hawaiian goose is extremely territorial during the breeding season. Males strongly defend nesting territories while the females are incubating, and both parents attend and defend goslings until they fledge (Banko et al. 1999). Finally, adults molt and are flightless during the last four to six weeks of the breeding season (USFWS 2004). All of these factors suggest there is a low likelihood that the fatality of an adult Hawaiian goose would result in the indirect take of dependent young or eggs. Nevertheless, take of the Hawaiian goose has occurred during the peak breeding months (October – March) at Kaheawa Pastures I Wind Project (A. Nadig, USFWS, pers. comm. 2014), and it is possible that some of these birds were caring for young.
Hu (1998) found that the average pair of Hawaiian geese produced 0.30 fledglings annually. Applying this information with other assumptions we present estimates of indirect take for the Hawaiian goose in Table 12.
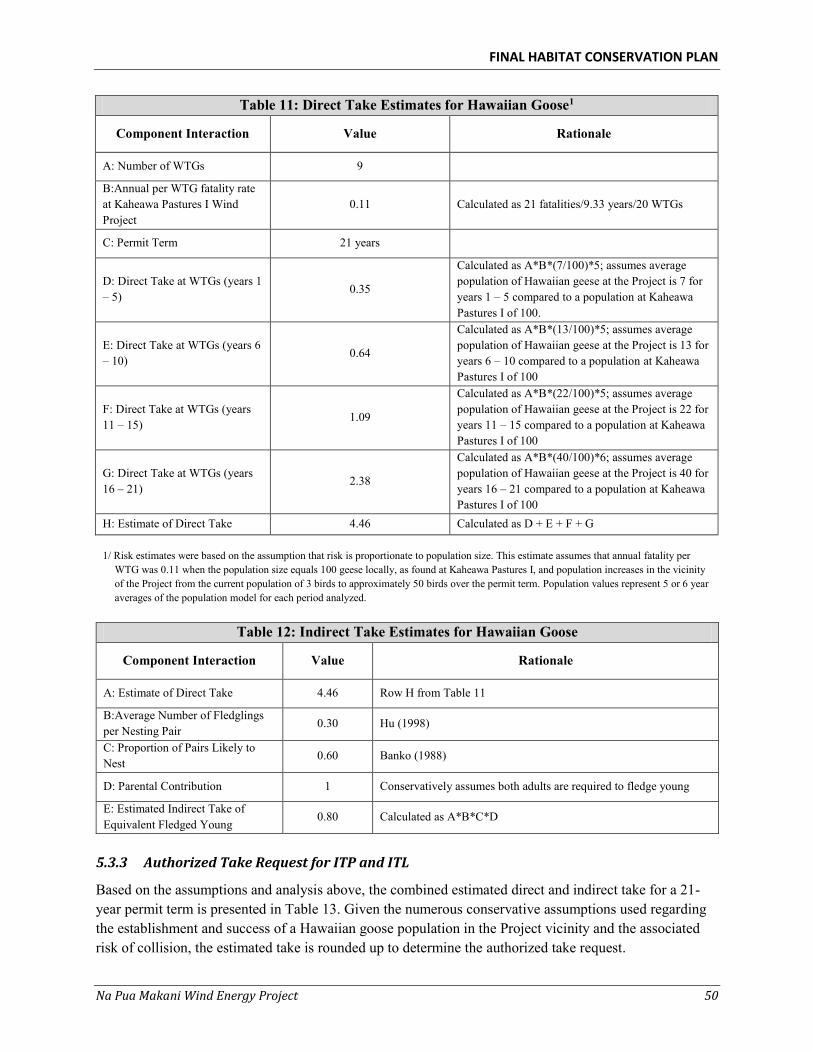
FINAL HABITAT CONSERVATION PLAN
Na Pua Makani Wind Energy Project 50
Table 11: Direct Take Estimates for Hawaiian Goose1
Component Interaction Value Rationale
A: Number of WTGs 9
B:Annual per WTG fatality rate at Kaheawa Pastures I Wind Project
0.11 Calculated as 21 fatalities/9.33 years/20 WTGs
C: Permit Term 21 years
D: Direct Take at WTGs (years 1 – 5) 0.35
Calculated as A*B*(7/100)*5; assumes average population of Hawaiian geese at the Project is 7 for years 1 – 5 compared to a population at Kaheawa Pastures I of 100.
E: Direct Take at WTGs (years 6 – 10) 0.64
Calculated as A*B*(13/100)*5; assumes average population of Hawaiian geese at the Project is 13 for years 6 – 10 compared to a population at Kaheawa Pastures I of 100
F: Direct Take at WTGs (years 11 – 15) 1.09
Calculated as A*B*(22/100)*5; assumes average population of Hawaiian geese at the Project is 22 for years 11 – 15 compared to a population at Kaheawa Pastures I of 100
G: Direct Take at WTGs (years 16 – 21)
2.38
Calculated as A*B*(40/100)*6; assumes average population of Hawaiian geese at the Project is 40 for years 16 – 21 compared to a population at Kaheawa Pastures I of 100
H: Estimate of Direct Take 4.46 Calculated as D + E + F + G 1/ Risk estimates were based on the assumption that risk is proportionate to population size. This estimate assumes that annual fatality per
WTG was 0.11 when the population size equals 100 geese locally, as found at Kaheawa Pastures I, and population increases in the vicinity of the Project from the current population of 3 birds to approximately 50 birds over the permit term. Population values represent 5 or 6 year averages of the population model for each period analyzed.
Table 12: Indirect Take Estimates for Hawaiian Goose
Component Interaction Value Rationale
A: Estimate of Direct Take 4.46 Row H from Table 11
B:Average Number of Fledglings per Nesting Pair 0.30 Hu (1998)
C: Proportion of Pairs Likely to Nest
0.60 Banko (1988)
D: Parental Contribution 1 Conservatively assumes both adults are required to fledge young
E: Estimated Indirect Take of Equivalent Fledged Young
0.80 Calculated as A*B*C*D
5.3.3 Authorized Take Request for ITP and ITL
Based on the assumptions and analysis above, the combined estimated direct and indirect take for a 21-year permit term is presented in Table 13. Given the numerous conservative assumptions used regarding the establishment and success of a Hawaiian goose population in the Project vicinity and the associated risk of collision, the estimated take is rounded up to determine the authorized take request.
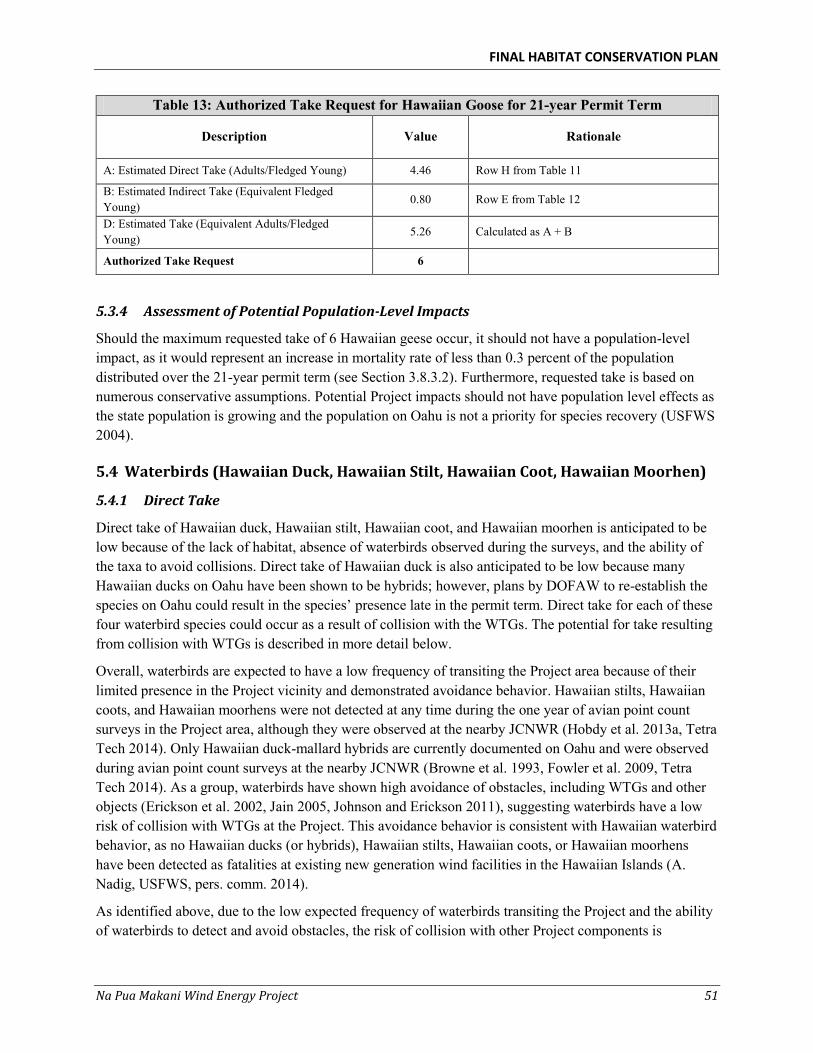
FINAL HABITAT CONSERVATION PLAN
Na Pua Makani Wind Energy Project 51
Table 13: Authorized Take Request for Hawaiian Goose for 21-year Permit Term
Description Value Rationale
A: Estimated Direct Take (Adults/Fledged Young) 4.46 Row H from Table 11
B: Estimated Indirect Take (Equivalent Fledged Young) 0.80 Row E from Table 12
D: Estimated Take (Equivalent Adults/Fledged Young)
5.26 Calculated as A + B
Authorized Take Request 6
5.3.4 Assessment of Potential Population-Level Impacts
Should the maximum requested take of 6 Hawaiian geese occur, it should not have a population-level impact, as it would represent an increase in mortality rate of less than 0.3 percent of the population distributed over the 21-year permit term (see Section 3.8.3.2). Furthermore, requested take is based on numerous conservative assumptions. Potential Project impacts should not have population level effects as the state population is growing and the population on Oahu is not a priority for species recovery (USFWS 2004).
5.4 Waterbirds (Hawaiian Duck, Hawaiian Stilt, Hawaiian Coot, Hawaiian Moorhen)
5.4.1 Direct Take
Direct take of Hawaiian duck, Hawaiian stilt, Hawaiian coot, and Hawaiian moorhen is anticipated to be low because of the lack of habitat, absence of waterbirds observed during the surveys, and the ability of the taxa to avoid collisions. Direct take of Hawaiian duck is also anticipated to be low because many Hawaiian ducks on Oahu have been shown to be hybrids; however, plans by DOFAW to re-establish the species on Oahu could result in the species’ presence late in the permit term. Direct take for each of these four waterbird species could occur as a result of collision with the WTGs. The potential for take resulting from collision with WTGs is described in more detail below.
Overall, waterbirds are expected to have a low frequency of transiting the Project area because of their limited presence in the Project vicinity and demonstrated avoidance behavior. Hawaiian stilts, Hawaiian coots, and Hawaiian moorhens were not detected at any time during the one year of avian point count surveys in the Project area, although they were observed at the nearby JCNWR (Hobdy et al. 2013a, Tetra Tech 2014). Only Hawaiian duck-mallard hybrids are currently documented on Oahu and were observed during avian point count surveys at the nearby JCNWR (Browne et al. 1993, Fowler et al. 2009, Tetra Tech 2014). As a group, waterbirds have shown high avoidance of obstacles, including WTGs and other objects (Erickson et al. 2002, Jain 2005, Johnson and Erickson 2011), suggesting waterbirds have a low risk of collision with WTGs at the Project. This avoidance behavior is consistent with Hawaiian waterbird behavior, as no Hawaiian ducks (or hybrids), Hawaiian stilts, Hawaiian coots, or Hawaiian moorhens have been detected as fatalities at existing new generation wind facilities in the Hawaiian Islands (A. Nadig, USFWS, pers. comm. 2014).
As identified above, due to the low expected frequency of waterbirds transiting the Project and the ability of waterbirds to detect and avoid obstacles, the risk of collision with other Project components is
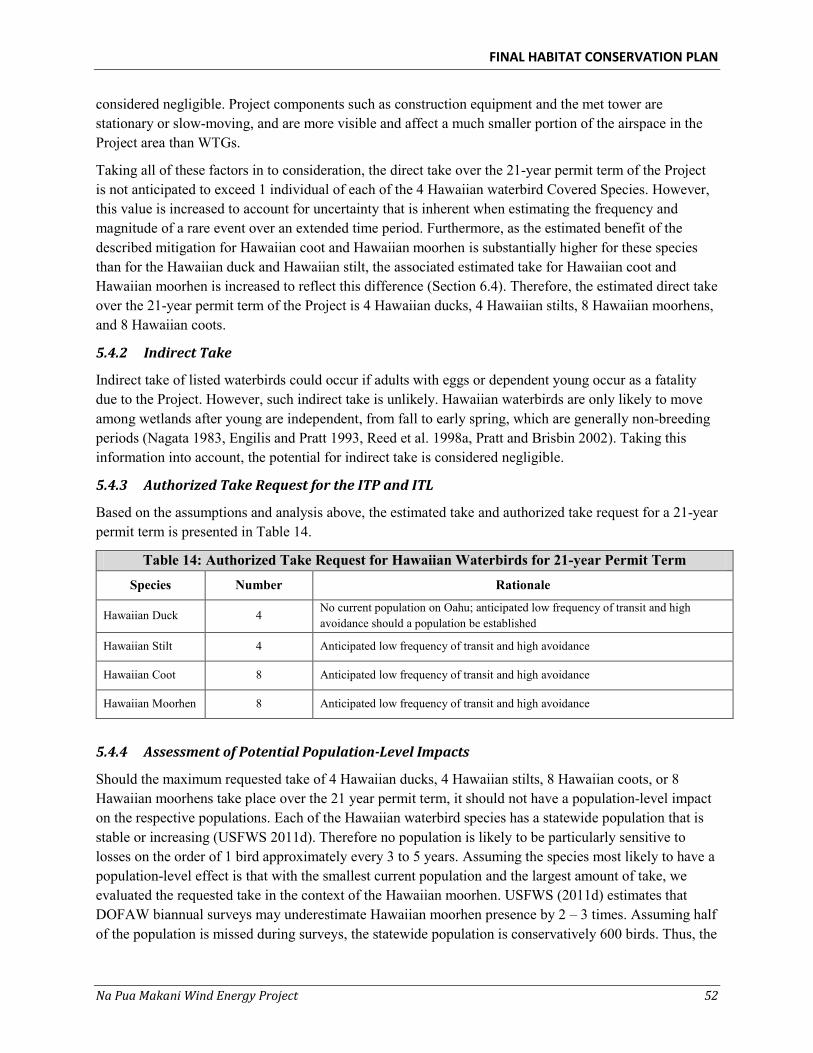
FINAL HABITAT CONSERVATION PLAN
Na Pua Makani Wind Energy Project 52
considered negligible. Project components such as construction equipment and the met tower are stationary or slow-moving, and are more visible and affect a much smaller portion of the airspace in the Project area than WTGs.
Taking all of these factors in to consideration, the direct take over the 21-year permit term of the Project is not anticipated to exceed 1 individual of each of the 4 Hawaiian waterbird Covered Species. However, this value is increased to account for uncertainty that is inherent when estimating the frequency and magnitude of a rare event over an extended time period. Furthermore, as the estimated benefit of the described mitigation for Hawaiian coot and Hawaiian moorhen is substantially higher for these species than for the Hawaiian duck and Hawaiian stilt, the associated estimated take for Hawaiian coot and Hawaiian moorhen is increased to reflect this difference (Section 6.4). Therefore, the estimated direct take over the 21-year permit term of the Project is 4 Hawaiian ducks, 4 Hawaiian stilts, 8 Hawaiian moorhens, and 8 Hawaiian coots.
5.4.2 Indirect Take
Indirect take of listed waterbirds could occur if adults with eggs or dependent young occur as a fatality due to the Project. However, such indirect take is unlikely. Hawaiian waterbirds are only likely to move among wetlands after young are independent, from fall to early spring, which are generally non-breeding periods (Nagata 1983, Engilis and Pratt 1993, Reed et al. 1998a, Pratt and Brisbin 2002). Taking this information into account, the potential for indirect take is considered negligible.
5.4.3 Authorized Take Request for the ITP and ITL
Based on the assumptions and analysis above, the estimated take and authorized take request for a 21-year permit term is presented in Table 14.
Table 14: Authorized Take Request for Hawaiian Waterbirds for 21-year Permit Term
Species Number Rationale
Hawaiian Duck 4 No current population on Oahu; anticipated low frequency of transit and high avoidance should a population be established
Hawaiian Stilt 4 Anticipated low frequency of transit and high avoidance
Hawaiian Coot 8 Anticipated low frequency of transit and high avoidance
Hawaiian Moorhen 8 Anticipated low frequency of transit and high avoidance
5.4.4 Assessment of Potential Population-Level Impacts
Should the maximum requested take of 4 Hawaiian ducks, 4 Hawaiian stilts, 8 Hawaiian coots, or 8 Hawaiian moorhens take place over the 21 year permit term, it should not have a population-level impact on the respective populations. Each of the Hawaiian waterbird species has a statewide population that is stable or increasing (USFWS 2011d). Therefore no population is likely to be particularly sensitive to losses on the order of 1 bird approximately every 3 to 5 years. Assuming the species most likely to have a population-level effect is that with the smallest current population and the largest amount of take, we evaluated the requested take in the context of the Hawaiian moorhen. USFWS (2011d) estimates that DOFAW biannual surveys may underestimate Hawaiian moorhen presence by 2 – 3 times. Assuming half of the population is missed during surveys, the statewide population is conservatively 600 birds. Thus, the
FINAL HABITAT CONSERVATION PLAN
Na Pua Makani Wind Energy Project 53
maximum estimated take could represent 1.3 percent of the current population distributed over the 21-year permit term. Taking into account the mitigation described in Section 6.4, this estimated mortality should not have a population-level effect on the Hawaiian moorhen. Furthermore, given that the Project is not anticipated to have a population-level effect on the Hawaiian moorhen, the more robust populations of Hawaiian duck, Hawaiian stilt, and Hawaiian coot should also not experience population-level effects.
5.5 Hawaiian Short-eared Owl
5.5.1 Direct Take
Direct take of Hawaiian short-eared owl could occur as a result of collision with the WTGs. However, WTG collision associated fatalities are likely to be low for two reasons. First, Hawaiian short-eared owls are expected to use the Project area only as irregular visitors (see Section 3.8.5.4). Second, given the low likelihood of breeding in the area and that flights high above the ground are typically used only as pre-breeding display flights, Hawaiian short-eared owls using the area are unlikely to fly within the rotor swept area (Wiggins et al. 2006).
No Hawaiian short-eared owl fatalities have been documented at operational wind farms on Oahu (A. Nadig, USFWS, pers. comm. 2014). This may be due to the low density of Hawaiian short-eared owls on Oahu, where the subspecies is rare (Klavitter 2009, Pyle and Pyle 2009). Conversely, owl fatalities have occurred at the operational Kaheawa Pastures I Wind Project on Maui where Hawaiian short-eared owls were detected regularly during preconstruction surveys (Kaheawa Pastures I Wind Project 2006), and where the species is much more common than on Oahu (Klavitter 2009, Pyle and Pyle 2009). This information suggests the risk of Hawaiian short-eared owl collision with WTGs may be related to owl density and/or breeding activity, which is either very low or does not exist on the Project.
No Hawaiian short-eared owls were detected during Project surveys within or in the vicinity of the Project area. However, a single observation from the Kahuku Wind Project during pre-construction radar surveys (Day and Cooper 2008) indicates the species may occur as an irregular visitor to the Project area. Based on the rarity of observations of the species during pre-construction survey efforts at the Project and the Kahuku Wind Project (SWCA 2010, Tetra Tech 2014), it is unlikely that the Hawaiian short-eared owl breeds in the Project area. The low frequency of use of the Project area by Hawaiian short-eared owls and the low likelihood of the presence of breeding pairs suggest the risk of collision for Hawaiian short-eared owls with WTGs is low. In addition, Na Pua Makani Power Partners will implement low wind speed curtailment during March – November to reduce Hawaiian hoary bat fatalities, which would also benefit this species. This minimization measure should further reduce the potential for a collision by a Hawaiian short-eared owl because although Hawaiian short-eared owls are largely diurnal, they are also sometimes active at night.
The risk of collision with other Project components is considered negligible due to the avoidance and minimization measures proposed, the low potential for the owl to use the Project area, and the owl’s highly maneuverable flight (Wiggins et al. 2006). A 25 mph (40 kph) speed limit during the day and 10 mph (16 kph) speed limit at night will minimize the risk of Hawaiian short-eared owls colliding with Project vehicles. Similarly, the selection of an un-guyed, free-standing met tower, maximizes the ability of owls to detect the structure and avoid collision. The low frequency of use of the area by Hawaiian short-eared owls and their estimated ability to detect and avoid Project components during typical foraging activities makes the risk of collision with Project construction equipment negligible.
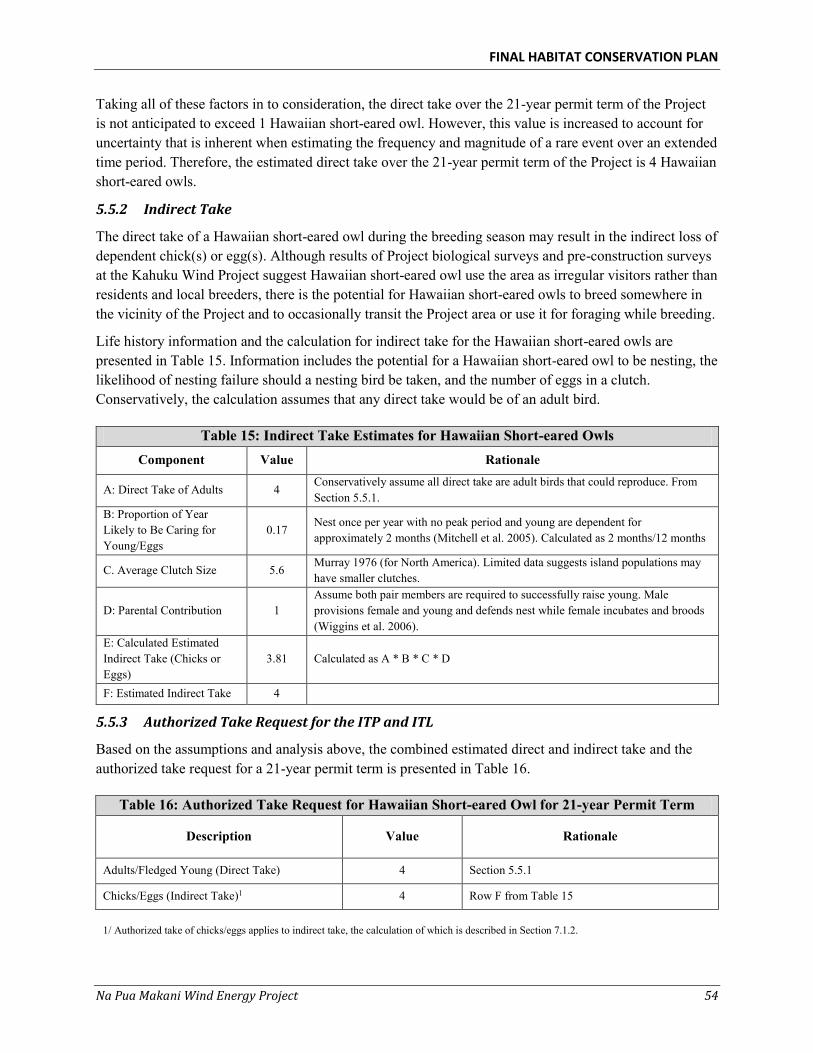
FINAL HABITAT CONSERVATION PLAN
Na Pua Makani Wind Energy Project 54
Taking all of these factors in to consideration, the direct take over the 21-year permit term of the Project is not anticipated to exceed 1 Hawaiian short-eared owl. However, this value is increased to account for uncertainty that is inherent when estimating the frequency and magnitude of a rare event over an extended time period. Therefore, the estimated direct take over the 21-year permit term of the Project is 4 Hawaiian short-eared owls.
5.5.2 Indirect Take
The direct take of a Hawaiian short-eared owl during the breeding season may result in the indirect loss of dependent chick(s) or egg(s). Although results of Project biological surveys and pre-construction surveys at the Kahuku Wind Project suggest Hawaiian short-eared owl use the area as irregular visitors rather than residents and local breeders, there is the potential for Hawaiian short-eared owls to breed somewhere in the vicinity of the Project and to occasionally transit the Project area or use it for foraging while breeding.
Life history information and the calculation for indirect take for the Hawaiian short-eared owls are presented in Table 15. Information includes the potential for a Hawaiian short-eared owl to be nesting, the likelihood of nesting failure should a nesting bird be taken, and the number of eggs in a clutch. Conservatively, the calculation assumes that any direct take would be of an adult bird.
Table 15: Indirect Take Estimates for Hawaiian Short-eared Owls Component Value Rationale
A: Direct Take of Adults 4 Conservatively assume all direct take are adult birds that could reproduce. From Section 5.5.1.
B: Proportion of Year Likely to Be Caring for Young/Eggs
0.17 Nest once per year with no peak period and young are dependent for approximately 2 months (Mitchell et al. 2005). Calculated as 2 months/12 months
C. Average Clutch Size 5.6 Murray 1976 (for North America). Limited data suggests island populations may have smaller clutches.
D: Parental Contribution 1 Assume both pair members are required to successfully raise young. Male provisions female and young and defends nest while female incubates and broods (Wiggins et al. 2006).
E: Calculated Estimated Indirect Take (Chicks or Eggs)
3.81 Calculated as A * B * C * D
F: Estimated Indirect Take 4
5.5.3 Authorized Take Request for the ITP and ITL
Based on the assumptions and analysis above, the combined estimated direct and indirect take and the authorized take request for a 21-year permit term is presented in Table 16.
Table 16: Authorized Take Request for Hawaiian Short-eared Owl for 21-year Permit Term
Description Value Rationale
Adults/Fledged Young (Direct Take) 4 Section 5.5.1
Chicks/Eggs (Indirect Take)1 4 Row F from Table 15
1/ Authorized take of chicks/eggs applies to indirect take, the calculation of which is described in Section 7.1.2.
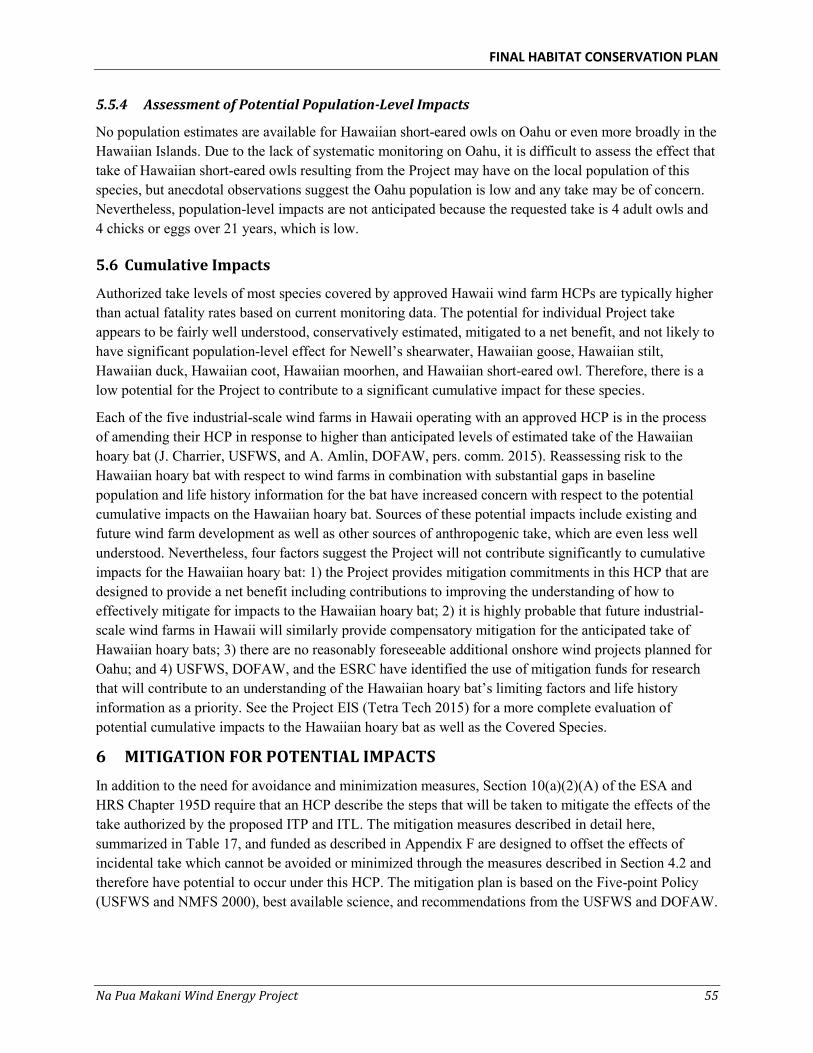
FINAL HABITAT CONSERVATION PLAN
Na Pua Makani Wind Energy Project 55
5.5.4 Assessment of Potential Population-Level Impacts
No population estimates are available for Hawaiian short-eared owls on Oahu or even more broadly in the Hawaiian Islands. Due to the lack of systematic monitoring on Oahu, it is difficult to assess the effect that take of Hawaiian short-eared owls resulting from the Project may have on the local population of this species, but anecdotal observations suggest the Oahu population is low and any take may be of concern. Nevertheless, population-level impacts are not anticipated because the requested take is 4 adult owls and 4 chicks or eggs over 21 years, which is low.
5.6 Cumulative Impacts
Authorized take levels of most species covered by approved Hawaii wind farm HCPs are typically higher than actual fatality rates based on current monitoring data. The potential for individual Project take appears to be fairly well understood, conservatively estimated, mitigated to a net benefit, and not likely to have significant population-level effect for Newell’s shearwater, Hawaiian goose, Hawaiian stilt, Hawaiian duck, Hawaiian coot, Hawaiian moorhen, and Hawaiian short-eared owl. Therefore, there is a low potential for the Project to contribute to a significant cumulative impact for these species.
Each of the five industrial-scale wind farms in Hawaii operating with an approved HCP is in the process of amending their HCP in response to higher than anticipated levels of estimated take of the Hawaiian hoary bat (J. Charrier, USFWS, and A. Amlin, DOFAW, pers. comm. 2015). Reassessing risk to the Hawaiian hoary bat with respect to wind farms in combination with substantial gaps in baseline population and life history information for the bat have increased concern with respect to the potential cumulative impacts on the Hawaiian hoary bat. Sources of these potential impacts include existing and future wind farm development as well as other sources of anthropogenic take, which are even less well understood. Nevertheless, four factors suggest the Project will not contribute significantly to cumulative impacts for the Hawaiian hoary bat: 1) the Project provides mitigation commitments in this HCP that are designed to provide a net benefit including contributions to improving the understanding of how to effectively mitigate for impacts to the Hawaiian hoary bat; 2) it is highly probable that future industrial-scale wind farms in Hawaii will similarly provide compensatory mitigation for the anticipated take of Hawaiian hoary bats; 3) there are no reasonably foreseeable additional onshore wind projects planned for Oahu; and 4) USFWS, DOFAW, and the ESRC have identified the use of mitigation funds for research that will contribute to an understanding of the Hawaiian hoary bat’s limiting factors and life history information as a priority. See the Project EIS (Tetra Tech 2015) for a more complete evaluation of potential cumulative impacts to the Hawaiian hoary bat as well as the Covered Species.
6 MITIGATION FOR POTENTIAL IMPACTS
In addition to the need for avoidance and minimization measures, Section 10(a)(2)(A) of the ESA and HRS Chapter 195D require that an HCP describe the steps that will be taken to mitigate the effects of the take authorized by the proposed ITP and ITL. The mitigation measures described in detail here, summarized in Table 17, and funded as described in Appendix F are designed to offset the effects of incidental take which cannot be avoided or minimized through the measures described in Section 4.2 and therefore have potential to occur under this HCP. The mitigation plan is based on the Five-point Policy (USFWS and NMFS 2000), best available science, and recommendations from the USFWS and DOFAW.
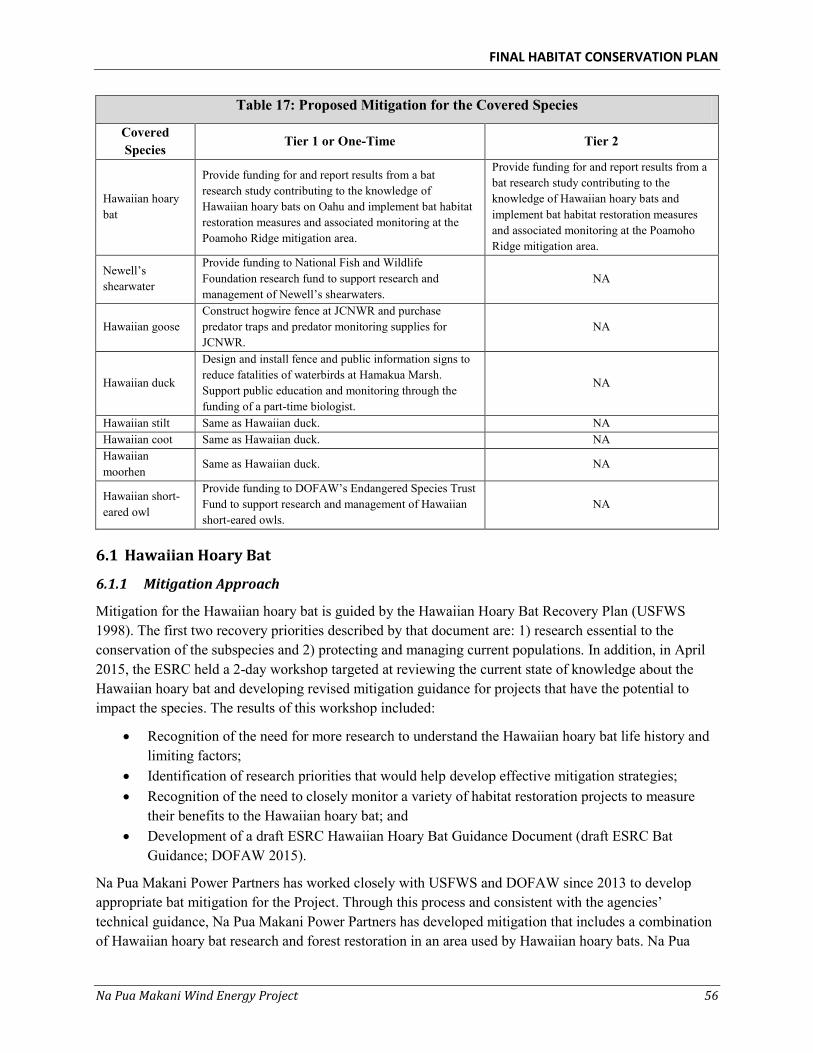
FINAL HABITAT CONSERVATION PLAN
Na Pua Makani Wind Energy Project 56
Table 17: Proposed Mitigation for the Covered Species
Covered Species
Tier 1 or One-Time Tier 2
Hawaiian hoary bat
Provide funding for and report results from a bat research study contributing to the knowledge of Hawaiian hoary bats on Oahu and implement bat habitat restoration measures and associated monitoring at the Poamoho Ridge mitigation area.
Provide funding for and report results from a bat research study contributing to the knowledge of Hawaiian hoary bats and implement bat habitat restoration measures and associated monitoring at the Poamoho Ridge mitigation area.
Newell’s shearwater
Provide funding to National Fish and Wildlife Foundation research fund to support research and management of Newell’s shearwaters.
NA
Hawaiian goose Construct hogwire fence at JCNWR and purchase predator traps and predator monitoring supplies for JCNWR.
NA
Hawaiian duck
Design and install fence and public information signs to reduce fatalities of waterbirds at Hamakua Marsh. Support public education and monitoring through the funding of a part-time biologist.
NA
Hawaiian stilt Same as Hawaiian duck. NA Hawaiian coot Same as Hawaiian duck. NA Hawaiian moorhen
Same as Hawaiian duck. NA
Hawaiian short-eared owl
Provide funding to DOFAW’s Endangered Species Trust Fund to support research and management of Hawaiian short-eared owls.
NA
6.1 Hawaiian Hoary Bat
6.1.1 Mitigation Approach
Mitigation for the Hawaiian hoary bat is guided by the Hawaiian Hoary Bat Recovery Plan (USFWS 1998). The first two recovery priorities described by that document are: 1) research essential to the conservation of the subspecies and 2) protecting and managing current populations. In addition, in April 2015, the ESRC held a 2-day workshop targeted at reviewing the current state of knowledge about the Hawaiian hoary bat and developing revised mitigation guidance for projects that have the potential to impact the species. The results of this workshop included:
Recognition of the need for more research to understand the Hawaiian hoary bat life history and limiting factors;
Identification of research priorities that would help develop effective mitigation strategies; Recognition of the need to closely monitor a variety of habitat restoration projects to measure
their benefits to the Hawaiian hoary bat; and Development of a draft ESRC Hawaiian Hoary Bat Guidance Document (draft ESRC Bat
Guidance; DOFAW 2015).
Na Pua Makani Power Partners has worked closely with USFWS and DOFAW since 2013 to develop appropriate bat mitigation for the Project. Through this process and consistent with the agencies’ technical guidance, Na Pua Makani Power Partners has developed mitigation that includes a combination of Hawaiian hoary bat research and forest restoration in an area used by Hawaiian hoary bats. Na Pua
FINAL HABITAT CONSERVATION PLAN
Na Pua Makani Wind Energy Project 57
Makani Power Partners has also included land acquisition as a mitigation alternative. Because of the uncertainty with the estimation of bat take, Na Pua Makani Power Partners is proposing mitigation associated with tiers of take. In order to ensure that mitigation will precede take (i.e., that mitigation is implemented ahead of take occurring), Na Pua Makani Power Partners will initiate planning for the subsequent tier of mitigation when 75 percent of the take associated with the current mitigation tier is reached, and projections suggest take for the permit term will exceed the threshold for that current tier. Planning will include Na Pua Makani Power Partners providing notice to DOFAW and USFWS that planning for Tier 2 mitigation is being initiated, and this notice will occur within 60 days of reaching the 75 percent of Tier 1 take threshold. The next tier of mitigation would be initiated before the take limit for the current tier is reached. Should Tier 1 take be exceeded late in the permit term, and it is unlikely that the Tier 2 authorized take limit will be approached, Na Pua Makani Power Partners will work with USFWS and DOFAW to amend the HCP to adjust Tier 2 take and associated mitigation to appropriate levels (See Section 9.6.1). A general description of each mitigation element is provided, followed by Na Pua Makani Power Partners’ detailed mitigation proposal.
6.1.1.1 Research
The Hawaiian Hoary Bat Recovery Plan identifies research as one of the primary actions needed to move toward recovery and delisting of the species (USFWS 1998). Although progress has been made on understanding the ecology of Hawaiian hoary bats, many basic research questions still exist. During the April 2015 ESRC Hawaiian hoary bat workshop, researchers, agency personnel, and other interested parties developed a list of research priorities to target the collection of data that would allow for the development of more effective Hawaiian hoary bat mitigation measures. Priority research areas identified in the workshop were reviewed by USFWS and DOFAW. The priority research areas the agencies supported as compensatory mitigation priorities were described in the draft ESRC Bat Guidance (DOFAW 2015) and included:
Hawaiian hoary bat population size and trend and population distribution on each island;
Habitat selection and suitability for roosting, foraging, and breeding;
Diet studies including prey selection, prey presence/absence and availability; and
In-depth monitoring of bat response to a variety of bat mitigation projects.
As part of its mitigation, Na Pua Makani Power Partners will provide funding for and ensure completion of a Hawaiian hoary bat research project targeting one of the research priorities identified in the draft ESRC Bat Guidance. In addition to the research priorities above, other research that addresses the ecology, population dynamics, or other to be identified studies could be implemented, as appropriate. For Tier 1 mitigation, Na Pua Makani Power Partners will either contribute to expanding an ongoing research project or will work with a qualified bat biologist, approved by DOFAW and USFWS, to design a study for Hawaiian hoary bat research on Oahu, consistent with the recommendations in the Hawaiian Hoary Bat Recovery Plan and recommendations from the April 2015 ESRC workshop. Na Pua Makani Power Partners may fund research that will supplement mitigation monitoring as part of the forest restoration mitigation actions at Poamoho Ridge (see Section 6.1.1.2). This research would target collecting data to document changes in measures related to improvements in bat habitat associated with the restoration efforts. Timing for the development of a Tier 1 research plan and implementation of the research are described in Section 6.1.4. If an additional tier of mitigation associated with research is required, the
FINAL HABITAT CONSERVATION PLAN
Na Pua Makani Wind Energy Project 58
research question funded would be decided with USFWS and DOFAW based on the knowledge gaps at that time, with planning and implementation of mitigation as described in section 6.1.1 (Mitigation Approach).
6.1.1.2 Forest Restoration and Management
The Hawaiian Hoary Bat Recovery Plan and the State of Hawaii’s Comprehensive Wildlife Conservation Strategy recommend conservation of known occupied bat habitat (USFWS 1998, Mitchell et al. 2005). Conservation may include the acquisition of land to protect it from development, or restoration of protected land to improve habitat quality. To prevent ongoing habitat degradation of conservation lands, most restoration areas in Hawaii must be fenced and managed to prevent non-native ungulates from destroying native species and introducing and fostering invasive plant species, remove invasive species, and foster a native plant-dominated community. This approach to forest restoration and management reduces the pressures from invasive species and allows natural forest restoration processes to occur.
Based on discussions with DLNR, Ko`olau Mountains Watershed Partnership (KMWP), Army Natural Resources, and Kamehameha Schools, Na Pua Makani Power Partners concluded that the most effective forest restoration efforts would be to work in collaboration with these existing conservation partnerships to fund long-term forest restoration in an area where fencing efforts are already underway. These resource groups do not currently have sufficient funding for the long-term forest restoration and management of these fenced parcels. Ongoing management of the lands is crucial to maximizing the restoration benefits to these lands, as fencing alone is not sufficient. The execution of the long-term forest restoration and management will enhance native species recruitment and forest growth, which, in turn, will benefit Hawaiian hoary bat foraging, roosting, and breeding areas. Therefore, Na Pua Makani Power Partners identified that funding the management of newly-fenced areas provides a net benefit for bats and fills a great need for conservation lands in Hawaii.
Based on the discussions with DLNR, KMWP, Army Natural Resources, and Kamehameha Schools, the best candidate for this restoration and management funding was the DLNR’s Poamoho Ridge. Poamoho Ridge is state-owned (DLNR) forested habitat occurring along the leeward summit of the central Ko`oloau Mountains. It is located above Wahiawa in the Ewa Forest Reserve (Figure 5), and is proposed to be part of the state Natural Area Reserve System. Native, high-elevation forest occurs in the Poamoho Ridge parcel, but invasive plant species are present and feral pigs are a significant problem (M. Zoll, DLNR, pers. comm. 2014). Goats do not occur in the vicinity of Poamoho Ridge, and DLNR is actively managing the goat population at Kualoa (the closest known goat population) to keep the goats from expanding their range (M. Ikagawa, KMWP, pers. comm. 2015). The area has received funding for two units to be fenced, one 654 ac (265 ha) and the other 653 ac (264 ha), to protect areas from ongoing damage due to feral pigs5. DLNR is responsible for long-term management of the area, but has identified a significant need to obtain secure funding for the long-term management and maintenance of these parcels.
5 The northern fencing unit includes 70 ac on Kamehameha Schools’ property within the Kawailoa Training Military Reservation.
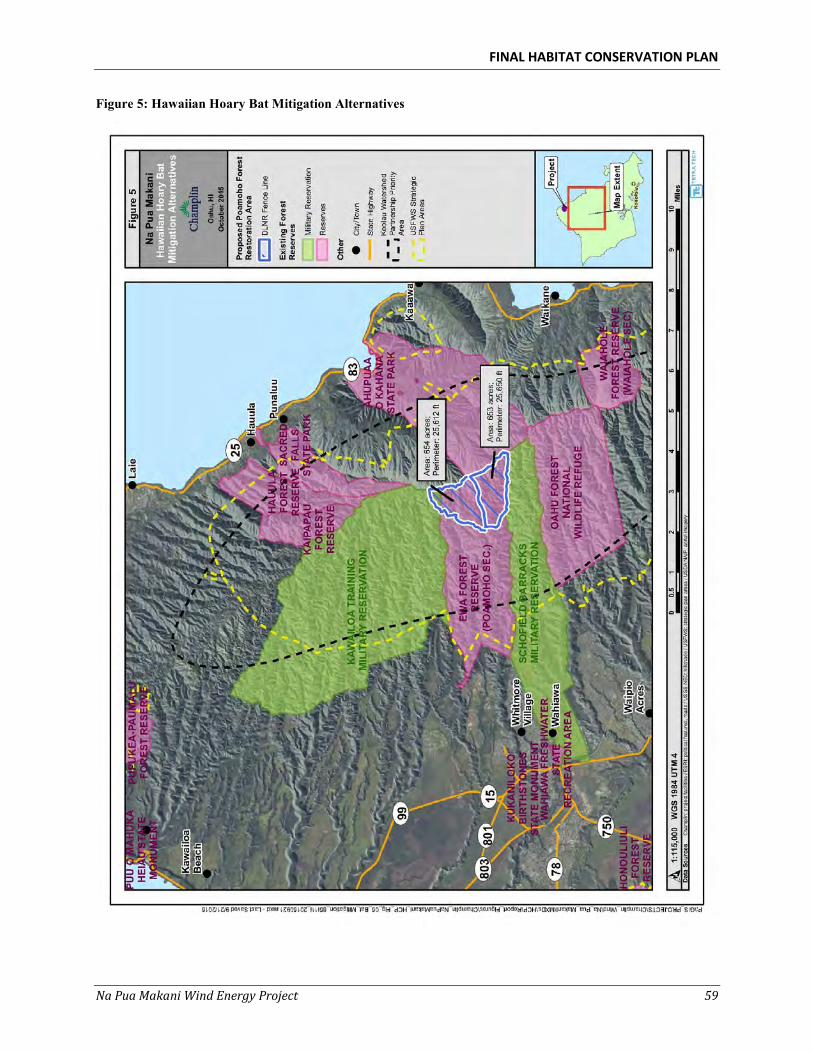
FINAL HABITAT CONSERVATION PLAN
Na Pua Makani Wind Energy Project 59
Figure 5: Hawaiian Hoary Bat Mitigation Alternatives
FINAL HABITAT CONSERVATION PLAN
Na Pua Makani Wind Energy Project 60
Poamoho Ridge meets the mitigation needs of the Project for multiple reasons. First, DNLR has secured funding for fencing the parcel and is in the process of installing fence around these units; therefore, there is certainty that the fence will be put into place in a timely manner. Second, DNLR does not have secure funding for long-term forest restoration and management of this parcel including fence maintenance, pig removal, and invasive species removal; thus, the need exists for funds to ensure project success. Third, bats have been documented within the Poamoho Ridge parcel via acoustic monitoring efforts initiated by the Project in coordination with KMWP and DLNR in April 2014 and nearby monitoring studies have documented bats in similar habitats (F. Bonaccorso, USGS-BRD, pers. comm., 2014). Fourth, given the presence of feral pigs and invasive plants, this habitat is steadily decreasing in quality and will continue to degrade without active management. Pig and invasive plant removal will stop the steady degradation and increase the quality of the habitat inside the fence. Fifth, the restoration and management activities will foster the growth of additional bat roosting and foraging habitat, and will support a forested corridor connected with the Ahupua`a O Kahana State Park and forested habitat managed for conservation in neighboring military reservation areas (Figure 5). Finally, restoration efforts in a native forest that is under pressure from non-native plants and ungulates provide an opportunity to develop a better understanding of the potential benefits of this type of forest restoration project to the Hawaiian hoary bat to better direct future mitigation resources.
6.1.1.3 Acquisition
As described above, conservation of bat habitat may include the acquisition of unprotected land to safeguard it from development. On Oahu, both human population and visitors to the island have been growing since 1990 (DBEDT 2013), increasing development pressure on the island. Acquisition provides a significant upfront benefit to bats that is consistent with the priorities identified in the Hawaiian Hoary Bat Recovery Plan. Acquisition provides for protection of bat habitat in perpetuity that may have otherwise been developed or used for purposes not consistent with conservation of bats. Given the range of habitats used by the Hawaiian hoary bat, if bats currently occupy forested habitat (native or introduced), it can be assumed that its protection from development would benefit Hawaiian hoary bats.
Na Pua Makani Power Partners is considering acquisition as an alternative mitigation approach to forest restoration and management. If this approach were used, proposed parcels for acquisition would be evaluated in consultation with USFWS and DOFAW and review by the ESRC to determine their suitability for mitigation. Some factors to be considered in the evaluation of prospective parcels for acquisition would be the parcel size, current land use, current use by the Hawaiian hoary bat, connectivity to other areas of potential bat use, and availability.
6.1.2 Mitigation
As described in Section 5.1.3, a tiered approach for authorized take of the Hawaiian hoary bat was used to provide flexibility in case of lower or higher than estimated fatality rates. Na Pua Makani Power Partners proposes the following mitigation actions by tier of Hawaiian hoary bat take. Tier 1 planning and implementation deadlines are described in Section 6.1.4. Planning for subsequent tiers would be implemented when 75 percent of the take associated with the current tier is reached provided take for the tier is likely to be exceeded during the permit term. The proposed mitigation of research and forest restoration as described below is consistent with Hawaiian Hoary Bat Recovery Plan (USFWS 1998) priorities and recommendations in the draft ESRC Bat Guidance (DOFAW 2015) including the recommended mitigation funding target of $50,000 per bat.
FINAL HABITAT CONSERVATION PLAN
Na Pua Makani Wind Energy Project 61
Tier 1 Provide Hawaiian hoary bat research funding and Provide 8 years of funding for forest restoration, fence maintenance, and acoustic monitoring at
both Poamoho Ridge units (1,307 ac [529 ha]) Tier 2
Provide Hawaiian hoary bat research funding and Provide 4 years of funding for forest restoration, fence maintenance, and acoustic monitoring at
both Poamoho Ridge units.
6.1.2.1 Research
Where research funding is proposed, Na Pua Makani Power Partners will either independently fund a research project or will contribute funding to expand an existing research project. Na Pua Makani Power Partners will provide $100,000 of research funding for Tier 1 mitigation and an additional $50,000 of research funding should Tier 2 mitigation be triggered. The Tier 1 research plan will be finalized and approved by USFWS and DOFAW within 6 months from the commercial operation date for the Project and then initiated within 1 year from the commercial operation date of the Project, depending on the nature of the research. This timeline assumes timely agency review and agreement to the research proposal. Reports summarizing annual research efforts will be provided to USFWS and DOFAW as part of Na Pua Makani Power Partners’ annual reports and to document completion of the research.
Na Pua Makani Power Partners would begin planning for research projects associated with Tier 2 when 75 percent of the take associated with Tier 1 is reached, and USFWS, DOFAW, or Na Pua Makani Power Partners deem it likely that take for Tier 1 would be exceeded during the remainder of the permit term. Research projects could include those described in Section 6.1.1.1 or could be other research on Hawaiian hoary bats that is more appropriate at that time. The research project will be identified and agreed upon by Na Pua Makani Power Partners, USFWS, and DOFAW and will be initiated prior to take associated with Tier 2 occurring.
6.1.2.2 Forest Restoration, Management, and Monitoring
Forest restoration, fence maintenance and acoustic monitoring on both Poamoho fence units is proposed for each mitigation tier with the length of the effort varying by tier. A preliminary draft management plan in Appendix E describes the initial management approach for addressing mitigation needs and is summarized in the following paragraphs.
Na Pua Makani Power Partners worked with KMWP and DLNR to identify management needs and associated costs for mitigation. Na Pua Makani Power Partners proposes to provide annual funds to KMWP or another mutually agreed upon organization for one 8-year period and potentially up to one additional 4-year period. These funds would cover the costs of two full-time employees per year performing forest restoration, management, and monitoring activities including fence maintenance, bat acoustic monitoring, pig/goat control and monitoring, and invasive plant removal and monitoring within the fenced area, as well as needed supplies and helicopter time (Table 18). Shortly after fence installation, management work would focus on removal of pigs and, if present, goats. In later years, the focus would likely shift to invasive plant removal to allow for natural recruitment, and fence maintenance. The employees’ time is estimated to be allocated roughly according to the breakdown in Table 19. The approach to forest restoration to be conducted at Poamoho Ridge reduces the pressures from invasive
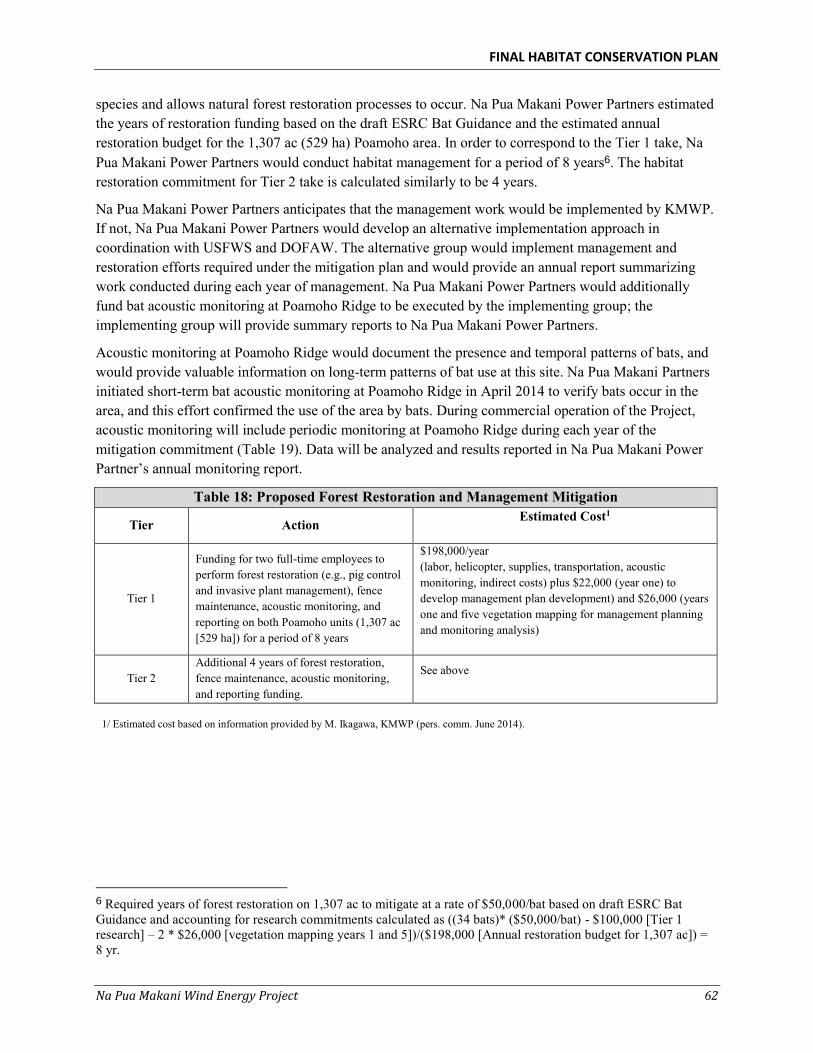
FINAL HABITAT CONSERVATION PLAN
Na Pua Makani Wind Energy Project 62
species and allows natural forest restoration processes to occur. Na Pua Makani Power Partners estimated the years of restoration funding based on the draft ESRC Bat Guidance and the estimated annual restoration budget for the 1,307 ac (529 ha) Poamoho area. In order to correspond to the Tier 1 take, Na Pua Makani Power Partners would conduct habitat management for a period of 8 years6. The habitat restoration commitment for Tier 2 take is calculated similarly to be 4 years.
Na Pua Makani Power Partners anticipates that the management work would be implemented by KMWP. If not, Na Pua Makani Power Partners would develop an alternative implementation approach in coordination with USFWS and DOFAW. The alternative group would implement management and restoration efforts required under the mitigation plan and would provide an annual report summarizing work conducted during each year of management. Na Pua Makani Power Partners would additionally fund bat acoustic monitoring at Poamoho Ridge to be executed by the implementing group; the implementing group will provide summary reports to Na Pua Makani Power Partners.
Acoustic monitoring at Poamoho Ridge would document the presence and temporal patterns of bats, and would provide valuable information on long-term patterns of bat use at this site. Na Pua Makani Partners initiated short-term bat acoustic monitoring at Poamoho Ridge in April 2014 to verify bats occur in the area, and this effort confirmed the use of the area by bats. During commercial operation of the Project, acoustic monitoring will include periodic monitoring at Poamoho Ridge during each year of the mitigation commitment (Table 19). Data will be analyzed and results reported in Na Pua Makani Power Partner’s annual monitoring report.
Table 18: Proposed Forest Restoration and Management Mitigation
Tier Action Estimated Cost1
Tier 1
Funding for two full-time employees to perform forest restoration (e.g., pig control and invasive plant management), fence maintenance, acoustic monitoring, and reporting on both Poamoho units (1,307 ac [529 ha]) for a period of 8 years
$198,000/year (labor, helicopter, supplies, transportation, acoustic monitoring, indirect costs) plus $22,000 (year one) to develop management plan development) and $26,000 (years one and five vegetation mapping for management planning and monitoring analysis)
Tier 2 Additional 4 years of forest restoration, fence maintenance, acoustic monitoring, and reporting funding.
See above
1/ Estimated cost based on information provided by M. Ikagawa, KMWP (pers. comm. June 2014).
6 Required years of forest restoration on 1,307 ac to mitigate at a rate of $50,000/bat based on draft ESRC Bat Guidance and accounting for research commitments calculated as ((34 bats)* ($50,000/bat) - $100,000 [Tier 1 research] – 2 * $26,000 [vegetation mapping years 1 and 5])/($198,000 [Annual restoration budget for 1,307 ac]) = 8 yr.
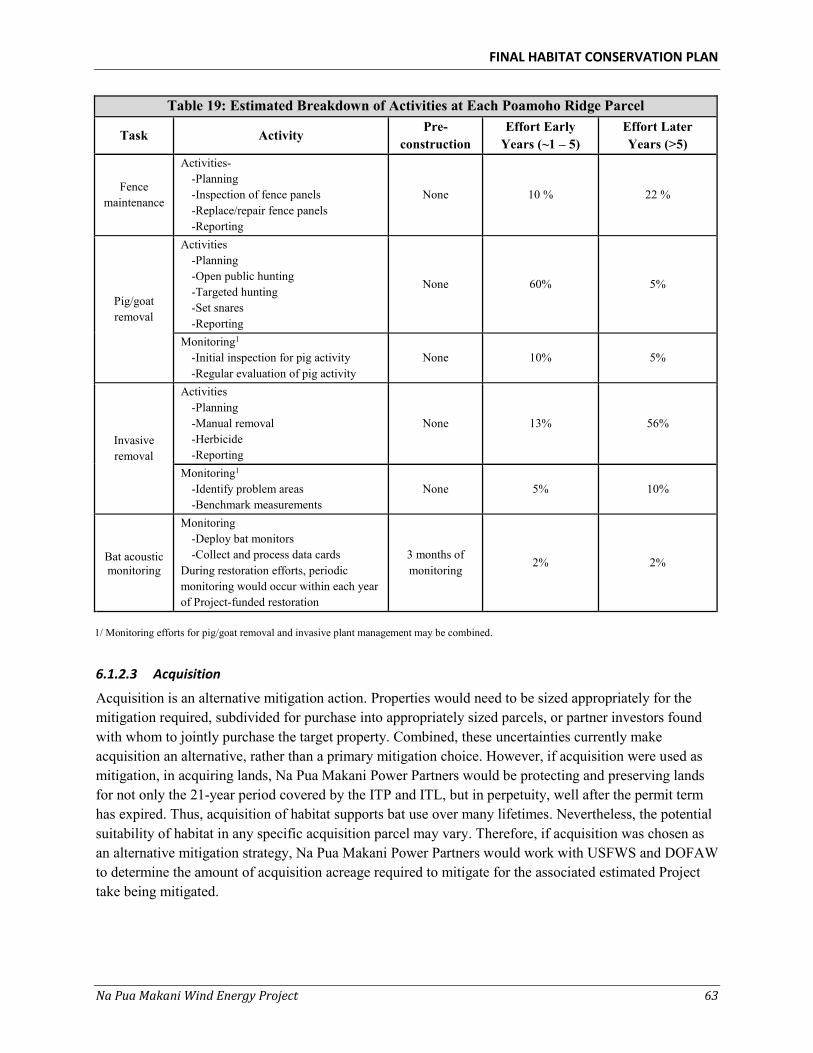
FINAL HABITAT CONSERVATION PLAN
Na Pua Makani Wind Energy Project 63
Table 19: Estimated Breakdown of Activities at Each Poamoho Ridge Parcel
Task Activity Pre-
construction Effort Early
Years (~1 – 5) Effort Later Years (>5)
Fence maintenance
Activities- -Planning -Inspection of fence panels -Replace/repair fence panels -Reporting
None 10 % 22 %
Pig/goat removal
Activities -Planning -Open public hunting -Targeted hunting -Set snares -Reporting
None 60% 5%
Monitoring1 -Initial inspection for pig activity -Regular evaluation of pig activity
None 10% 5%
Invasive removal
Activities -Planning -Manual removal -Herbicide -Reporting
None 13% 56%
Monitoring1 -Identify problem areas -Benchmark measurements
None 5% 10%
Bat acoustic monitoring
Monitoring -Deploy bat monitors -Collect and process data cards
During restoration efforts, periodic monitoring would occur within each year of Project-funded restoration
3 months of monitoring
2% 2%
1/ Monitoring efforts for pig/goat removal and invasive plant management may be combined.
6.1.2.3 Acquisition
Acquisition is an alternative mitigation action. Properties would need to be sized appropriately for the mitigation required, subdivided for purchase into appropriately sized parcels, or partner investors found with whom to jointly purchase the target property. Combined, these uncertainties currently make acquisition an alternative, rather than a primary mitigation choice. However, if acquisition were used as mitigation, in acquiring lands, Na Pua Makani Power Partners would be protecting and preserving lands for not only the 21-year period covered by the ITP and ITL, but in perpetuity, well after the permit term has expired. Thus, acquisition of habitat supports bat use over many lifetimes. Nevertheless, the potential suitability of habitat in any specific acquisition parcel may vary. Therefore, if acquisition was chosen as an alternative mitigation strategy, Na Pua Makani Power Partners would work with USFWS and DOFAW to determine the amount of acquisition acreage required to mitigate for the associated estimated Project take being mitigated.
FINAL HABITAT CONSERVATION PLAN
Na Pua Makani Wind Energy Project 64
6.1.3 Net Benefit
Funding for forest restoration and management or Hawaiian hoary bat research or land acquisition would all provide a net benefit to bats. The funding for Poamoho Ridge is a long-term effort that, among other goals, provides protection for bat foraging and roosting habitat. Na Pua Makani Power Partners’ contributions to Poamoho Ridge forest restoration and management effort would create, protect, and enhance suitable habitat for Hawaiian hoary bats over the permit term and thereafter. A net benefit to the species will be realized by these mitigation efforts because the protected habitat would continue to be used by adult bats and their offspring beyond the term of the ITP and ITL. Funding for Hawaiian hoary bat research provides a net benefit to the species by increasing the knowledge base about the species, thus allowing for more effective mitigation and conservation efforts, and bat research is paired with restoration and management actions which could benefit from the information developed through this research. Acquisition and conservation of land currently being used by bats provides a net benefit to bats in perpetuity on lands that could have otherwise been lost to development.
6.1.4 Measures of Success
All Tier 1 mitigation actions will be implemented within milestones described here whether or not any take occurs. Hawaiian hoary bat mitigation efforts will be considered successful and Na Pua Makani Power Partners will be deemed to have fulfilled their mitigation requirements for the species if the following occur under a research and forest restoration approach:
For Tier 1, the preparation of the proposed research plan will be initiated by the Project commercial operation date, and the research plan will be completed within 1 year of the commercial operation date of the Project. Assuming timely agency review and agreement to the research proposal, the research plan will be initiated within 6 months of the approval of the research plan.
Research plans for Tier 2 are complete and, assuming timely review by agencies, are ready for initiation prior to take occurring for Tier 2.
The preparation of the Poamoho restoration area management plan will be initiated by the Project commercial operation date, and the management plan will be completed within 1 year of the Project commercial operation date. The management plan will include goals, objectives, and timelines associated with reduction in targeted invasive species and pig/goat removal.
Acoustic monitoring for bats is conducted at the forest restoration area for the period of restoration applicable to the appropriate mitigation tier, and results of the monitoring efforts are provided in the annual report to the agencies;
Status/results of the restoration efforts applicable to the appropriate tier are provided in the annual report to the agencies;
Status/results of the research efforts applicable to the appropriate tier are provided in the annual report to the agencies;
Monitoring efforts indicate pig/goat removal in the management area has been achieved and restoration efforts have reduced invasive plant species targeted for management;
FINAL HABITAT CONSERVATION PLAN
Na Pua Makani Wind Energy Project 65
Activities outlined for forest restoration and management and proposed research above are executed; and
Goals, objectives, and timelines associated with reduction in targeted invasive species and pig/goat removal as identified in the management plan are met.
Based on draft ESRC Bat Guidance (DOFAW 2015), Na Pua Makani Power Partners will fund Tier 1 mitigation consisting of research and forest restoration at $50,000 per bat as identified in Tier 1. If Tier 1 take is exceeded, Na Pua Makani Power Partners will fund Tier 2 mitigation consisting of research and forest restoration at $50,000 per bat as identified in Tier 2.
Should habitat acquisition be used as an alternative mitigation approach, Na Pua Makani Power Partners, USFWS, and DOFAW will identify and agree upon an appropriate mitigation parcel and an official agreement (e.g., transfer of title, easement) will be executed between Na Pua Makani Power Partners and the land manager to conserve the parcel in perpetuity.
6.1.5 Costs
Appendix F provides estimated costs and time of payment for the Hawaiian hoary bat mitigation measures described above.
6.2 Newell’s Shearwater
6.2.1 Mitigation Approach
The USFWS Newell’s Shearwater Recovery Plan and the State of Hawaii’s Comprehensive Wildlife Conservation Strategy for Newell’s shearwaters recommend efforts to reduce fallout, protect known colonies, and develop efficient predator control methods while expanding knowledge of the species’ status and distribution (USFWS 1983, Mitchell et al. 2005). Due to the low level of anticipated impact to Newell’s shearwaters and a desire to maximize the positive effects of investments in mitigation, the USFWS and DOFAW have recommended mitigation for this species be carried out through contributions to a National Fish and Wildlife Foundation (NFWF) fund. The NFWF fund is a general mitigation fund established for the expressed purpose of mitigating impacts to Newell’s shearwaters. The overall intent is that pooled resources can be used to fund larger management projects or to resolve larger research questions targeted at the recovery of Newell’s shearwater than could have been supported through smaller scale investments.
Based on a review of data from Kauai, USFWS and DOFAW estimated $28,000 would be required to mitigate for one adult Newell’s shearwater and $11,000 for one Newell’s shearwater chick or egg, plus administration costs of 20 percent (A. Nadig, USFWS, and A. Amlin, DOFAW, pers. comm. 2014).
6.2.2 Net Benefit
The funding for the NFWF research and management fund supports a long-term effort that, among other goals, is designed to:
Support habitat management and predator control efforts at known colonies;
Refine methods to identify new colonies;
Develop techniques to establish new colonies;
FINAL HABITAT CONSERVATION PLAN
Na Pua Makani Wind Energy Project 66
Improve predator control and habitat management techniques; and
Improve population monitoring techniques.
This mitigation will provide a net benefit to the species because the research for or management of the species implemented from the funding will contribute to the knowledge of the species or improve its habitat. Information developed through these efforts will fill in data gaps and contribute to the ability to adaptively manage mitigation efforts in the future. The mitigation resources from multiple sources will be pooled, thereby increasing the potential scope of research and management efforts and the value of the research or management to the species.
6.2.3 Measures of Success
Newell’s shearwater mitigation efforts will be considered successful and Na Pua Makani Power Partners will be deemed to have fulfilled their mitigation requirements for the species if:
Funding to adequately cover the estimated take of 4 adults/fledged young and 2 chicks/eggs is provided to NFWF by the commercial operation date and
Status of the research or management efforts are provided in the annual report to the agencies.
6.2.4 Costs
Appendix F provides costs and estimated time of payment for the Newell’s shearwater mitigation measures described above.
6.3 Hawaiian Goose
6.3.1 Mitigation Approach
Given the small size of the Hawaiian goose population on Oahu, USFWS and DOFAW have proposed a mitigation approach consisting of funding for habitat management to reduce potential impacts of predation in suitable habitat. Consistent with this recommendation, Na Pua Makani Power Partners proposes to fund fence construction efforts within a portion of JCNWR that contains suitable Hawaiian goose nesting habitat and is in proximity to the area where the adult pair of Hawaiian geese nested in the winter of 2013/2014. This area remains an area of frequent use for the Oahu resident Hawaiian geese (J. Charrier, USFWS, pers. comm. October 2015). Furthermore, the area is expected to be used by Hawaiian geese into the future, and those birds are expected to benefit from these actions because: 1) the species exhibits strong site fidelity and natal philopatry (Banko et al. 1999), 2) the population is assumed to grow over time at least partially due to natural reproduction, and 3) USFWS is committed to providing long term fence maintenance and management of the area. Therefore, this effort is anticipated to reduce threats to the current Oahu resident Hawaiian geese as well as future offspring or arrivals. Specifically, this effort will increase productivity and survival of the Hawaiian goose should the population grow and, as expected, use the managed area. The proposed hogwire fence will significantly reduce the predation risk from dogs, which have been identified as a predator of concern for the Hawaiian goose at this site (J. Charrier, USFWS, pers. comm. 2015). Na Pua Makani Power Partners will fund fence construction in one of two proposed JCNWR fencing units (Figure 6).
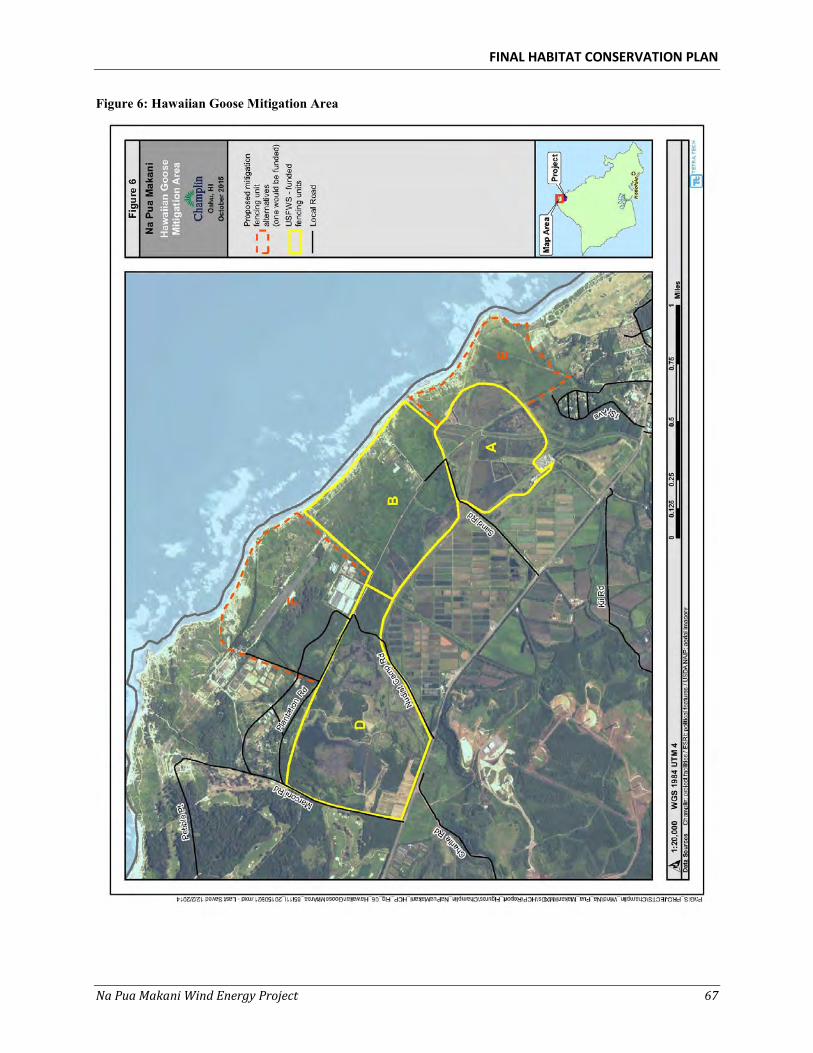
FINAL HABITAT CONSERVATION PLAN
Na Pua Makani Wind Energy Project 67
Figure 6: Hawaiian Goose Mitigation Area
FINAL HABITAT CONSERVATION PLAN
Na Pua Makani Wind Energy Project 68
6.3.2 Net Benefit
The funding of the construction of hogwire fence to reduce the predation pressure from dogs supports recovery efforts for the Hawaiian goose on Oahu. Should the population of Hawaiian geese expand on Oahu, the mitigation is designed to:
Contribute to improved reproductive success and survival of the Hawaiian goose on Oahu; and
Expand the population of Hawaiian goose on Oahu.
This mitigation will provide a net benefit to the species because mitigation benefits are likely to precede any take. The current population of the Hawaiian goose on Oahu is three, making take in the early years of the Project very unlikely, but birds that are present at that time will benefit from the reduction in predation pressure resulting from the mitigation efforts.
6.3.3 Measures of Success
Hawaiian goose mitigation efforts will be considered successful and Na Pua Makani Power Partners will be deemed to have fulfilled their mitigation requirements for the species if:
Na Pua Makani Power Partners, USFWS, and DOFAW agree on design criteria for the hogwire fence within 1 year from the commercial operation date;
The hogwire fence is constructed within 2 years from the commercial operation date;
Status/results of the construction of fence are provided in the annual report to USFWS and DOFAW.
6.3.4 Costs
Appendix F provides estimated costs and time of payment for the Hawaiian goose mitigation measures described above.
6.4 Waterbirds (Hawaiian Duck, Hawaiian Stilt, Hawaiian Coot, Hawaiian Moorhen)
6.4.1 Mitigation Approach
The Recovery Plan for Hawaiian Waterbirds (USFWS 2011d) identifies habitat loss and degradation and predation by introduced mammals as the primary threats to the Hawaiian stilt, Hawaiian moorhen, and Hawaiian coot, and it also identifies these factors as the most important causes of decline in the Hawaiian duck. Appropriate habitat management of USFWS (2011d) core wetlands is the first recovery criterion listed in the USFWS Recovery Plan for Hawaiian Waterbirds for each of the resident waterbird species.
6.4.1.1 Hamakua Marsh
Hamakua Marsh is a state-owned (DLNR) waterbird sanctuary located on the edge of the town of Kailua and is adjacent to Kawainui Marsh, the DLNR-owned and managed waterbird management area. The 23-ac (9-ha) Hamakua Marsh waterbird mitigation area includes wetlands, a canal, and limited adjacent upland habitat (Figure 7). The Hamakua Marsh mitigation area is managed as breeding habitat for Hawaiian stilts, Hawaiian coots, and Hawaiian moorhens and is likely to provide future habitat for the Hawaiian duck, should a population become established on Oahu through planned recovery efforts. The marsh is identified as a core wetland in the USFWS (2011d) Recovery Plan for Hawaiian Waterbirds.
FINAL HABITAT CONSERVATION PLAN
Na Pua Makani Wind Energy Project 69
DOFAW is responsible for long-term management of the area, but DOFAW has also received support for predator control, habitat management, and waterbird monitoring in the area through a mitigation agreement for potential impacts to waterbirds associated with the Kahuku Wind Project HCP (SWCA 2010). Monitoring of the mitigation efforts for the Kahuku Wind Project identified ongoing mortality associated with the listed waterbirds being struck by vehicles in a shopping center parking area because they were being fed by the public (L. Salbosa, DOFAW, pers. comm. 2013).
This state waterbird sanctuary has an unprotected perimeter in an area of high human traffic, which has resulted in a number of negative impacts including the death and disturbance of listed waterbirds and an accumulation of trash at the site. A portion of the north boundary of the Hamakua Marsh mitigation area abuts a shopping center along the Kawainui Canal (Figure 7). Local residents, shopping center restaurants, and others frequently use the area in ways that jeopardize resident, listed waterbirds. Local residents and nearby restaurants often discard bread or other food in the parking area for the local birds to consume. Attracted by the food, waterbirds leave the marsh and forage for crumbs in the parking area, and these birds are regularly killed by vehicles and occasionally killed by people (L. Salbosa, DOFAW, pers. comm. 2013). Dog owners throw tennis balls into the marsh for their dogs to retrieve, which disturbs nesting birds or can result in direct predation (L. Salbosa, DOFAW, pers. comm. 2013). Finally, open access to the wetland invites trespassing and the illegal disposal of garbage, degrading nesting habitat.
As part of mitigation efforts for the Kahuku Wind Project, an on-site monitor tracked fatalities and their cause in the Hamakua Marsh area 2012 – 2013 (Table 20; A. Siddiqi, DOFAW, pers. comm. 2013; A. Amlin, DOFAW, pers. comm. 2014). The actual number of fatalities exceeds reported numbers because they do not account for the bias of birds that are killed but not discovered and/or not reported.
To address the complex management problems at Hamakua Marsh, Na Pua Makani Power Partners proposes to fund the design, construction, and limited-term maintenance of a partial fence, as well as fund a part-time staff biologist that would act as an on-site monitor, conduct public outreach, and provide technical support to DOFAW during a public meeting prior to fence construction. The proposed 1,555-ft (474-m) stretch of fence would create a boundary between the shopping center and the edge of the Hamakua Marsh mitigation area, controlling access to limit the illegal dumping of garbage, reducing the movement of waterbirds into the parking lot, and eliminating the use of the marsh by dogs. The part-time biologist would serve to educate local shop owners and the public about the harm caused by feeding waterbirds, as well as monitoring the area for waterbird fatalities. Although the fence will impede movement of birds from the marsh to the parking area, USFWS, DOFAW, and Na Pua Makani Power Partners agreed that the benefits of the fence will be magnified by an active public outreach program managed by an on-site biologist.
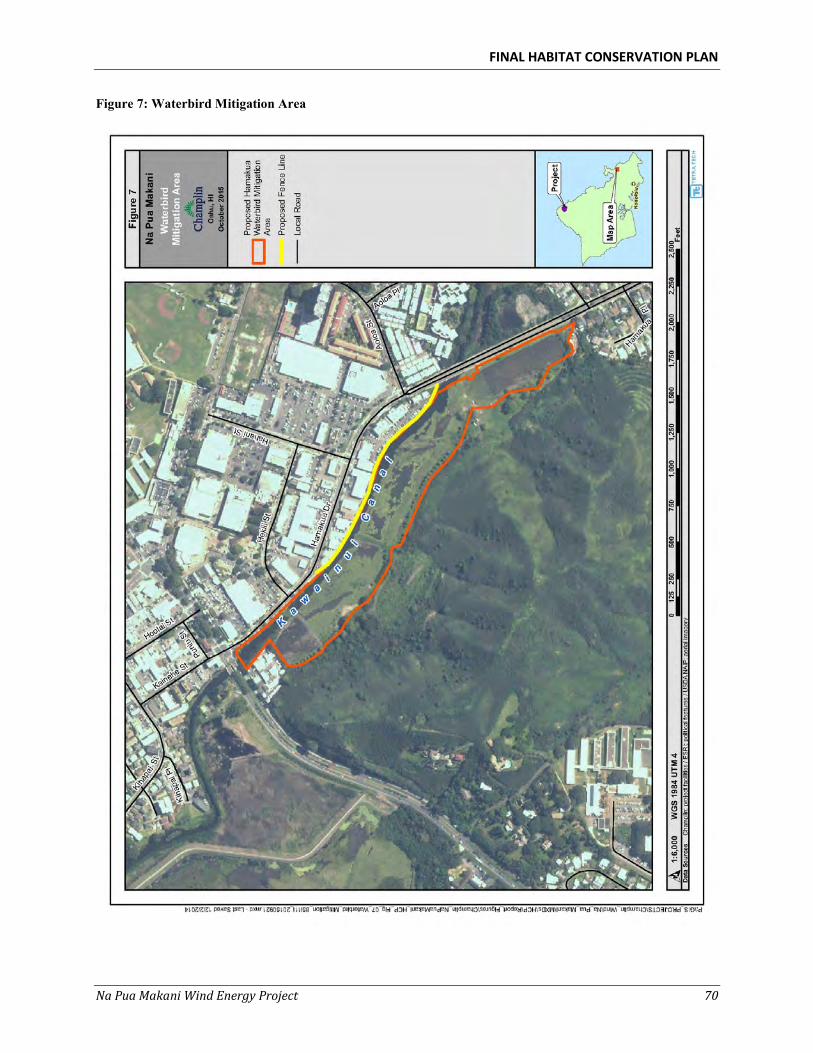
FINAL HABITAT CONSERVATION PLAN
Na Pua Makani Wind Energy Project 70
Figure 7: Waterbird Mitigation Area
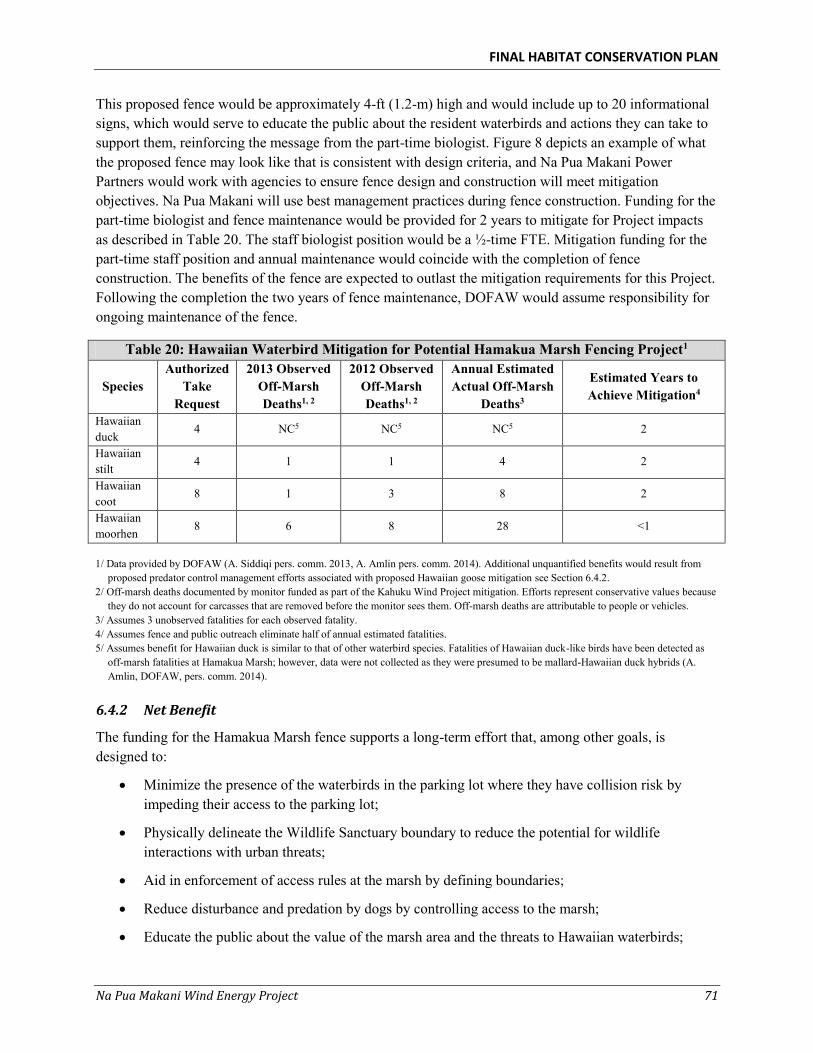
FINAL HABITAT CONSERVATION PLAN
Na Pua Makani Wind Energy Project 71
This proposed fence would be approximately 4-ft (1.2-m) high and would include up to 20 informational signs, which would serve to educate the public about the resident waterbirds and actions they can take to support them, reinforcing the message from the part-time biologist. Figure 8 depicts an example of what the proposed fence may look like that is consistent with design criteria, and Na Pua Makani Power Partners would work with agencies to ensure fence design and construction will meet mitigation objectives. Na Pua Makani will use best management practices during fence construction. Funding for the part-time biologist and fence maintenance would be provided for 2 years to mitigate for Project impacts as described in Table 20. The staff biologist position would be a ½-time FTE. Mitigation funding for the part-time staff position and annual maintenance would coincide with the completion of fence construction. The benefits of the fence are expected to outlast the mitigation requirements for this Project. Following the completion the two years of fence maintenance, DOFAW would assume responsibility for ongoing maintenance of the fence.
6.4.2 Net Benefit
The funding for the Hamakua Marsh fence supports a long-term effort that, among other goals, is designed to:
Minimize the presence of the waterbirds in the parking lot where they have collision risk by impeding their access to the parking lot;
Physically delineate the Wildlife Sanctuary boundary to reduce the potential for wildlife interactions with urban threats;
Aid in enforcement of access rules at the marsh by defining boundaries;
Reduce disturbance and predation by dogs by controlling access to the marsh;
Educate the public about the value of the marsh area and the threats to Hawaiian waterbirds;
Table 20: Hawaiian Waterbird Mitigation for Potential Hamakua Marsh Fencing Project1
Species Authorized
Take Request
2013 Observed Off-Marsh Deaths1, 2
2012 Observed Off-Marsh Deaths1, 2
Annual Estimated Actual Off-Marsh
Deaths3
Estimated Years to Achieve Mitigation4
Hawaiian duck
4 NC5 NC5 NC5 2
Hawaiian stilt 4 1 1 4 2
Hawaiian coot
8 1 3 8 2
Hawaiian moorhen 8 6 8 28 <1
1/ Data provided by DOFAW (A. Siddiqi pers. comm. 2013, A. Amlin pers. comm. 2014). Additional unquantified benefits would result from
proposed predator control management efforts associated with proposed Hawaiian goose mitigation see Section 6.4.2. 2/ Off-marsh deaths documented by monitor funded as part of the Kahuku Wind Project mitigation. Efforts represent conservative values because
they do not account for carcasses that are removed before the monitor sees them. Off-marsh deaths are attributable to people or vehicles. 3/ Assumes 3 unobserved fatalities for each observed fatality. 4/ Assumes fence and public outreach eliminate half of annual estimated fatalities. 5/ Assumes benefit for Hawaiian duck is similar to that of other waterbird species. Fatalities of Hawaiian duck-like birds have been detected as
off-marsh fatalities at Hamakua Marsh; however, data were not collected as they were presumed to be mallard-Hawaiian duck hybrids (A. Amlin, DOFAW, pers. comm. 2014).
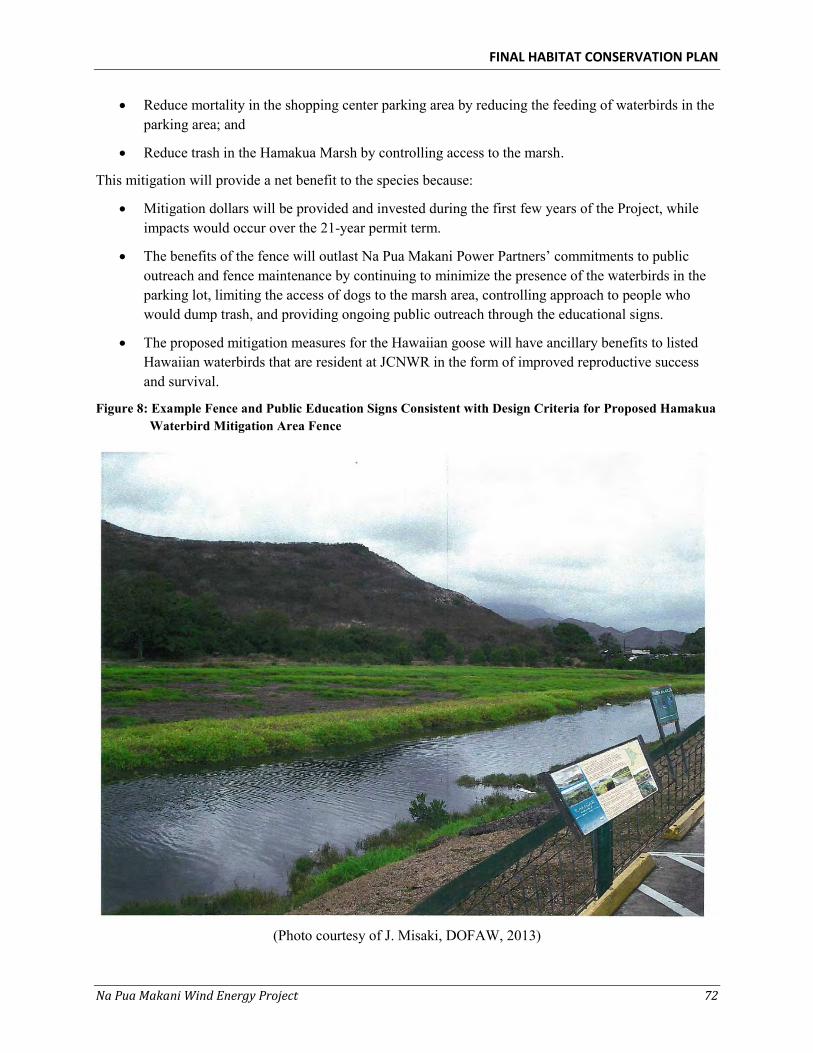
FINAL HABITAT CONSERVATION PLAN
Na Pua Makani Wind Energy Project 72
Reduce mortality in the shopping center parking area by reducing the feeding of waterbirds in the parking area; and
Reduce trash in the Hamakua Marsh by controlling access to the marsh.
This mitigation will provide a net benefit to the species because:
Mitigation dollars will be provided and invested during the first few years of the Project, while impacts would occur over the 21-year permit term.
The benefits of the fence will outlast Na Pua Makani Power Partners’ commitments to public outreach and fence maintenance by continuing to minimize the presence of the waterbirds in the parking lot, limiting the access of dogs to the marsh area, controlling approach to people who would dump trash, and providing ongoing public outreach through the educational signs.
The proposed mitigation measures for the Hawaiian goose will have ancillary benefits to listed Hawaiian waterbirds that are resident at JCNWR in the form of improved reproductive success and survival.
Figure 8: Example Fence and Public Education Signs Consistent with Design Criteria for Proposed Hamakua Waterbird Mitigation Area Fence
(Photo courtesy of J. Misaki, DOFAW, 2013)
FINAL HABITAT CONSERVATION PLAN
Na Pua Makani Wind Energy Project 73
6.4.3 Measures of Success
Hawaiian waterbird mitigation efforts will be considered successful and Na Pua Makani Power Partners will be deemed to have fulfilled their mitigation requirements for these Hawaiian waterbirds for Project impacts if the following occur:
A fence meeting design criteria mutually agreed to by Na Pua Makani Power Partners and USFWS and DOFAW and 20 informational signs are constructed along the boundary between the shopping center and Hamakua Marsh within 2 years from the commercial operation date of the Project, assuming timely review and agreement on fence design;
Two annual payments of funding sufficient to pay for fence maintenance are provided to DOFAW. The first payment will be due upon the completion of the fence and the second payment will be due one year after the first payment;
Two annual payments of funding sufficient to hire a ½-time FTE biologist and provide outreach materials are provided to DOFAW. The first payment will be due upon the completion of the fence and the second payment will be due one year after the first payment; and
Results of the funded management efforts are provided in the annual report to the agencies.
6.4.4 Costs
Appendix F provides estimated costs and time of payment for the Hawaiian duck, Hawaiian stilt, Hawaiian coot, and Hawaiian moorhen mitigation measures described above.
6.5 Hawaiian Short-eared Owl
6.5.1 Mitigation Approach
The State of Hawaii’s Comprehensive Wildlife Conservation Strategy recommends a combination of conservation actions, monitoring, and research to address threats to the Hawaiian short-eared owl. These recommendations include continuing conservation efforts at refuges and wildlife sanctuaries, expanding survey efforts to monitor population status and trends on Oahu, and conducting research into limiting factors such as “sick owl syndrome” and vehicle collisions. Due to the low level of anticipated impact to Hawaiian short-eared owls and a general desire to maximize the positive effects of investments in mitigation, DOFAW will use the Endangered Species Trust Fund to consolidate contributions for Hawaiian short-eared owl mitigation from approved projects. These funds will be used for the expressed purpose of mitigating impacts to Hawaiian short-eared owls. The overall intent is that pooled resources can be used to fund larger management projects or to resolve larger research questions targeted at the recovery of Hawaiian short-eared owls on Oahu than could have been supported through smaller scale investments.
In consultation with DOFAW, all parties agreed $25,000 would be required to mitigate for Project impacts to Hawaiian short-eared owls.
6.5.2 Net Benefit
The funding for research and management supports a long-term effort that, among other goals, is designed to:
Identify and understand limiting factors on Oahu;
FINAL HABITAT CONSERVATION PLAN
Na Pua Makani Wind Energy Project 74
Develop habitat management approaches to reduce the impact of limiting factors;
Improve predator control and habitat management techniques;
Improve population monitoring techniques; and
Improve risk assessment techniques for wind energy facilities.
This mitigation will provide a net benefit to the species because the research for or management of the species implemented from the funding will contribute to the knowledge of the species or improve its habitat. Information developed through these efforts will fill in data gaps and contribute to the ability to adaptively manage mitigation efforts in the future. The mitigation resources from multiple sources will be pooled, thereby increasing the potential scope of research and management efforts and the value of the research or management to the species.
6.5.3 Measures of Success
Hawaiian short-eared owl mitigation efforts will be considered successful, and Na Pua Makani Power Partners will be deemed to have fulfilled their mitigation requirements for the species if:
Within 6 months of the commercial operation date of the Project and assuming prompt review and agreement by DOFAW, Na Pua Makani Power Partners and DOFAW develop an agreement documenting that mitigation funds provided by the Project are reserved for research and/or management efforts contributing to improving management, monitoring, or understanding risk factors for the Hawaiian short-eared owl on Oahu;
Funding to adequately cover the estimated take of 4 adults and 4 chicks/eggs of the Hawaiian short-eared owl is provided to the DOFAW’s Endangered Species Trust Fund by the commercial operation date of the Project; and
Status of the funding for the research or management efforts are provided in the annual report to the agencies.
6.5.4 Costs
Appendix F provides estimated costs and time of payment for the Hawaiian short-eared owl mitigation measures described above.
7 MONITORING AND REPORTING
7.1 Project-Specific Take
Monitoring and reporting will address compliance with the provisions, take limits, and mitigation requirements of the HCP and the associated ITP and ITL. Monitoring will ensure that:
Authorized levels of take are not exceeded;
The effects of take are minimized; and
The mitigation requirements are met.
Annual reports will be provided to USFWS and DOFAW to demonstrate that Na Pua Makani Power Partners has performed required tasks and activities according to the provisions of the HCP.
FINAL HABITAT CONSERVATION PLAN
Na Pua Makani Wind Energy Project 75
7.1.1 Monitoring Direct Take
A Post-construction Monitoring Plan will be implemented as a means to document impacts to the Covered Species as a result of operation of the Project, and to ensure compliance with the authorized provisions and take limits of the HCP and the associated ITP and ITL (Appendix A). The monitoring protocol is consistent with post-construction mortality monitoring being conducted for 5 other wind projects in Hawaii and elsewhere in the continental United States (Arnett 2005; Kerns et al. 2005; Kaheawa Pastures I Wind Project 2006; Arnett et al. 2009; Kaheawa Pastures II Wind Project 2010; SWCA 2010, 2011b; Tetra Tech 2012). Any changes to the protocol from the baseline provided herein would require review and approval by USFWS and DOFAW.
Key components of the Post-construction Monitoring Plan include: Use of Na Pua Makani Power Partners staff and/or contracted biologists with experience in
WTG-bird/bat interaction studies and implementation of wind energy post-construction monitoring protocol;
Monitoring will be divided into two periods, standardized searches and interim operational monitoring;
Standardized carcass searches conducted during the initial 3-year post-construction monitoring period under the operating WTGs and in later years as described in the Post-construction Monitoring Plan. Search intensity may be modified based on the results of the initial monitoring period. Na Pua Makani Power Partners will consult with the USFWS and DOFAW before transitioning to the initial interim monitoring period;
Specific triggers for identifying if take during the interim monitoring period is likely to exceed take estimated based on the previous standardized search effort(s) will be developed in consultation with USFWS and DOFAW during the initial standardized search period.
Carcass removal and searcher efficiency trials during standardized carcass searches to adjust observed fatality numbers for bias associated with the removal of carcasses by scavengers or other means and the ability of searchers to locate carcasses, respectively (See Appendix A);
Fatalities occurring during the interim monitoring periods will be estimated based on results from the preceding standardized searches, as detailed in the Post-construction Monitoring Plan (Appendix A);
A Wildlife Education and Incidental Reporting Program for reporting incidental observations of Project-related fatalities made by onsite staff;
A protocol for the recovery, handling, and reporting of downed wildlife;
After the initial 3 years of monitoring, monitoring efforts may be reduced with approval of USFWS and DOFAW, if available data suggest a low potential for fatalities of Covered Species or other measures are implemented to assume take/mitigation is appropriately accounted for; and
Na Pua Makani Power Partners will evaluate new technologies and/or methods in post-construction mortality monitoring that may become available during the permit term for logistical and economic feasibility as well as their potential to increase monitoring effectiveness.
FINAL HABITAT CONSERVATION PLAN
Na Pua Makani Wind Energy Project 76
7.1.2 Estimating Indirect Take
Monitoring of direct take will also be used to assess Project-related indirect take. It is assumed that take of an adult Hawaiian hoary bat, Newell’s shearwater, Hawaiian goose, or Hawaiian short-eared owl during the breeding season may result in the indirect loss or take of dependent young. For carcasses confirmed to have been breeding adults, it will be assumed that these individuals have produced the average number of young estimated for the species, unless the number of actual young is known. Where the approach to take estimation converts the loss of young to equivalent adults, this measure will incorporate the survivorship of young to adulthood (See Tables 6 and 12 for Hawaiian hoary bat and Hawaiian goose, respectively). For carcasses of individuals which can be confirmed to not be breeding (based on necropsy results) or for individuals determined to have been taken outside of the species’ breeding season, no indirect take will be assumed. For any carcass of these species detected during their respective breeding seasons and for which the current breeding status is not known, appropriate modifiers as described in Section 5 will be applied to estimate indirect take. Finally, for carcasses not found but estimated to have been killed in collision with Project WTGs (direct unobserved take), temporal patterns of observed take and the sex ratio of observed take (if statistically appropriate) at the Project, will be used in combination with the application of appropriate modifiers as described in Section 5 to estimate associated indirect take. If Project data are insufficient to determine temporal patterns of fatalities at the Project, indirect take will be estimated based on average reproductive rates and juvenile dependency assuming an equal probability of the fatality having occurred at any time during the year. This estimate will account for the likelihood that a given adult would be reproductively active and, if reproductively active, the number of young or eggs that would be lost as a result of the adult’s fatality (See Section 5). As described in in Section 5.4.2, there is a very low probability for listed waterbird species to experience indirect take; therefore, indirect take for these waterbirds is assumed to be negligible.
7.2 Reporting
Na Pua Makani Power Partners will prepare and submit annual reports summarizing the results of post-construction monitoring and mitigation conducted since the last report. Report components will include:
A summary of post-construction mortality monitoring conducted including a description of survey protocol implemented, and any adjustments made subsequent to the previous reporting period;
A summary of direct take, including observed take and adjusted take, for each species. As the specific value of adjusted take using available statistical tools is represented by a range of potential values within which the actual value is likely to occur, the report will include a discussion of adjusted take with respect to Project estimated take and identified tiers of take and associated mitigation;
A summary of indirect take associated with the identified direct take;
A summary of other downed wildlife documented and incidental observations (fatalities documented independently of the standardized searches);
Results of the carcass removal and searcher efficiency trials;
A discussion of the efficacy of the current monitoring protocols and whether or not adjustments need to be made;
FINAL HABITAT CONSERVATION PLAN
Na Pua Makani Wind Energy Project 77
A summary of HCP mitigation efforts conducted; and
A discussion of changed circumstances or adaptive management measures, if necessary.
Annual reports will be submitted to the USFWS and DOFAW August 1 to coincide with the end of DOFAW’s fiscal year. Na Pua Makani Power Partners will confer with the USFWS and DOFAW following the submittal of the annual report to review the results and discuss future HCP implementation issues, if needed. Annual reports will also be made available to the ESRC. Na Pua Makani Power Partners will consult with the USFWS and DOFAW to review the results of post-construction monitoring in relation to Project take limits, if needed, and discuss changed circumstances or adaptive management measures as necessary.
In accordance with the Post-construction Monitoring Plan (Appendix A), USFWS and DOFAW will be notified by phone as soon as is practicable, but within 24 hours of the discovery of a dead or injured individual of the Covered Species. An associated incident report will be filed within 3 business days. Reporting requirements associated with species not covered under this HCP are described in the Post-construction Monitoring Plan (Appendix A).
8 ALTERNATIVES
Section 10(a)(2)(A)(iii) of the ESA requires that alternatives to the incidental take of listed species be considered and that reasons such alternatives are not implemented be discussed. The following section describes alternatives that were evaluated during the selection of the proposed Project design. Due to limitations associated with county setback requirements, restrictions due to adjacent federal ownership, and other constraints, an alternative financially viable project that would result in less take was not possible.
8.1 Alternative 1: No Action Alternative
Under the No Action alternative, Na Pua Makani Power Partners would either not apply for the ITP or would not be granted the ITP and, thus, the Project would not be constructed or operated. Under this alternative, there would be no Project impacts and no Project mitigation for the Covered Species. As a result, the No Action alternative would not provide the additional ecological benefits that would be provided with the development and implementation of the HCP. Current activities would continue, and there would be no change to the existing on-site conditions.
8.2 Alternative 2: Proposed Action
Under the Proposed Action, Na Pua Makani Power Partners would apply for and be granted the ITP, and the Project would be constructed and operated with incidental take coverage. In response to public and agency comments during the public review process, Na Pua Makani Power Partners has developed a Modified Proposed Action Option that is described in detail Section 1.3 and analyzed in the EIS. Potential Project avoidance and minimization, impacts, and mitigation for this Modified Proposed Action Option are described in the HCP. The renewable energy generated by the Project would provide a dependable source of electrical energy and eliminate the need for an equivalent amount of fossil-fueled derived energy and capacity, which reduces use of nonrenewable resources and limits atmospheric pollution. The issuance of the ITP by the USFWS under the Proposed Action (i.e., the Modified Proposed Action Option) would result in protections (via mitigation and conservation measures) to the Covered Species
FINAL HABITAT CONSERVATION PLAN
Na Pua Makani Wind Energy Project 78
due to implementation of the HCP. The HCP that would be implemented under this alternative would also minimize impacts to birds protected under the MBTA.
8.3 Alternative 3: Reduced ITP and ITL Permit Term
This alternative would include an ITP and ITL of shorter duration than the proposed term of 21 years. This alternative was considered because it would reduce the level of take authorized by accounting for fewer years of Project operation. However, in doing so this alternative would not be consistent with the USFWS 5-Point Policy, which requires that the USFWS consider the expected duration of the covered activities. As described above, the anticipated operating life of the Project is 20 years plus up to one year for construction.
Additionally, a reduced permit term has the potential to create a legal liability for Na Pua Makani Power Partners associated with non-compliance with the ESA and Chapter 195D if additional incidental take were to occur outside of the permit term during the remaining years of Project operation. Even if the ITP and ITL were to be amended to cover the remaining years of Project operation, there would be financial and potentially operational implications associated with reopening consultation with the USFWS and DOFAW and with the interim period between expiration of the ITP and ITL and when the period of coverage could be extended. For these reasons, this alternative was not carried forward for consideration.
8.4 Alternative 4: Smaller Project Size (less than approximately 25 MW)
A reduction in Project size and generating capacity (i.e., a project smaller than the Proposed Action) would reduce resource impacts and potential incidental take levels, but would not have economies of scale and would not be economically feasible for Na Pua Makani Power Partners to develop. That is, a smaller wind farm would be unlikely to offset Project infrastructure and development costs. The Project is proposed as a single, integrated power plant, not individual pieces where some turbines may be eliminated and others kept. The Project, through its Power Purchase Agreement, has a defined power output, based on site and design characteristics, market demand, and Applicant objectives. These objectives include providing a minimum level of generation at a competitive price to be attractive to HECO, which is seeking to fulfill their renewable portfolio standard requirements, as well as providing a return on investment to the Applicant. In order to provide this return, Na Pua Makani Power Partners has determined that the Project must be capable of producing a minimum of approximately 25 MW. The number of wind turbines in the wind farm site has already been minimized to the extent practicable in light of the Project’s purpose and need and criteria considerations. Accordingly, if any turbines are removed from the Project design, other locations must be found to replace those turbines and maintain the minimum necessary capacity. Reducing the generating capacity for the Project would also decrease the Project’s contribution to Oahu’s renewable portfolio standard and consequently reduce the benefits to the State. For these reasons, the size and generating capacity of the Project was determined to be appropriate, and a smaller project size was eliminated from further evaluation.
9 PLAN IMPLEMENTATION
9.1 Responsibilities
This HCP will be administered by Na Pua Makani Power Partners. As necessary, Na Pua Makani Power Partners will seek guidance from USFWS and DOFAW in addition to other experts in the area of
FINAL HABITAT CONSERVATION PLAN
Na Pua Makani Wind Energy Project 79
conservation biology associated with other government agencies (e.g., USGS-BRD), academia, various conservation organizations or partnerships, and consulting firms to execute the HCP.
Na Pua Makani Power Partners will meet with the USFWS and DOFAW on an as needed basis to provide an update on plan implementation, including the status of monitoring and mitigation efforts and observed levels of incidental take. These meetings will also provide an opportunity to consider recommendations for adaptive management measures or modifications to monitoring protocols or mitigation strategies, if appropriate. The USFWS and DOFAW may request additional meetings to address immediate questions or concerns.
9.2 Scope and Duration
The HCP is designed to authorize potential incidental take of eight Covered Species as a result of construction and operation of the Project for a permit term of 21 years. If operation continues past 21 years or if it appears as though take may be exceeded, the HCP and associated ITP and ITL would need to be amended or extended in accordance with then-applicable laws and regulations.
9.3 Changed Circumstances, Unforeseen Circumstances, and No Surprises Policy
The USFWS’s No Surprises Policy (50 CFR 17.22, 17.32) provides that once an ITP has been issued, and so long as the HCP is being properly implemented, the USFWS will not require the commitment of additional conservation or mitigation measures by the permittee (including additional land, water, or financial contribution, or additional restrictions on the use of land, water, or other natural resources) beyond the level provided in the HCP, without the permittee’s consent. At the state level similar assurances are provided in HRS Section 195D-23. This regulation precludes the imposition of mandatory changes in conservation or mitigation measures, which would impose an additional financial burden on the permittee, resulting from circumstances not considered in an approved and properly implemented HCP except as provided for under changed circumstances as set forth under Section 9.3.1 below or adaptive management. No Surprises is also not applicable to situations where authorized take levels are exceeded.
An HCP must identify and analyze reasonably foreseeable changed circumstances that could affect a species or geographic area during the permit term (50 CFR 17.3). Should such a changed circumstance occur, the permittee is required to implement the measures specified in the HCP to respond to this circumstance. Conditions that are not analyzed, and for which the No Surprises assurances are designed, are called unforeseen circumstances. Unforeseen circumstances are events affecting a species or geographic area covered by the HCP that: 1) could not reasonably have been anticipated by the applicant, USFWS, and DOFAW during the development of the HCP, and 2) result in a substantial and adverse change in the status of a Covered Species.
9.3.1 Changed Circumstances
Circumstances may change or occur during the life of the HCP, some of which can be anticipated and for which contingency plans can be developed. Changes in the mitigation measures implemented for any of the Covered Species due to these changed circumstances will be developed in consultation among Na Pua Makani Power Partners, USFWS, and DOFAW. Mitigation measures used to address changed circumstances must be approved by USFWS and DOFAW. Changed circumstances which are reasonably foreseeable by Na Pua Makani Power Partners, the USFWS, and DOFAW are described below.
FINAL HABITAT CONSERVATION PLAN
Na Pua Makani Wind Energy Project 80
9.3.1.1 Listing of New Species or Delisting of a Covered Species
If the federal or state government add a new species that occurs on Oahu to the federal or state endangered species list, Na Pua Makani Power Partners will evaluate the likelihood of incidental take of the species due to Project operation. If incidental take appears possible, Na Pua Makani Power Partners may seek coverage for the newly listed species under an amendment to the existing HCP. Na Pua Makani Power Partners may also reinitiate consultation with the USFWS and DOFAW to discuss whether mitigation measures in place provide a net benefit to the newly listed species or if additional measures may be warranted. Should any of the Covered Species become delisted over the permit term, Na Pua Makani Power Partners will engage with USFWS and DOFAW to determine if mitigation measures should be discontinued.
9.3.1.2 Designation of Critical Habitat
If the USFWS designates Critical Habitat, and such Critical Habitat may be adversely affected by the activities covered in the HCP, the USFWS may consider this to be a changed circumstance. If the USFWS makes such a determination, Na Pua Makani Power Partners, in consultation with USFWS, may implement adjustments in covered activities in the area of designated Critical Habitat to ensure that Project activities are not likely to result in adverse modification of the Critical Habitat. Na Pua Makani Power Partners will consider practicable adjustments in activities until Na Pua Makani Power Partners has applied for and the USFWS has approved an amendment of the ITP, if agreed to be appropriate, in accordance with then applicable statutory and regulatory requirements, or until the USFWS notifies Na Pua Makani Power Partners that the these adjustments are no longer necessary.
9.3.1.3 Hurricane
Hurricanes periodically strike or affect the Hawaiian Islands, and the likelihood of a hurricane causing severe damage on Oahu during the term of the HCP is high enough to merit treatment as a changed circumstance. A hurricane could affect the activities covered by the HCP in several ways:
Cause significant damage to or destruction of Project facilities;
Pose a threat to the Covered Species by causing injury or death either directly, or indirectly through the destruction of habitat; or
Alter the natural and built environment in areas surrounding Project facilities in ways that increase or decrease the potential effects of Project facilities on the Covered Species.
Na Pua Makani Power Partners will construct its facilities consistent with applicable codes and industry standards, which are intended to avoid significant damage in severe weather conditions. Should a hurricane cause significant damage to Oahu during the term of the HCP, any resulting effects on the Covered Species will be considered based on the best available information at the time. The HCP mitigation efforts will be modified to respond to impacts from a hurricane should USFWS and DOFAW reasonably determine in consultation with Na Pua Makani Power Partners that such a response is necessary.
9.3.1.4 Invasive Species
Introduced animal and plant species have had, and will continue to have, a detrimental effect on the Covered Species. The likelihood that the threat from this source will increase during the term of this HCP
FINAL HABITAT CONSERVATION PLAN
Na Pua Makani Wind Energy Project 81
is sufficient to warrant treating this threat as a changed circumstance. The habitat enhancement and management measures to be implemented through this HCP could be compromised by new and/or increased populations of invasive species. Should these measures be compromised by invasive species during the term of this HCP, the HCP mitigation efforts will be modified should USFWS and DOFAW reasonably determine in consultation with Na Pua Makani Power Partners that such a response is necessary.
9.3.1.5 Disease Outbreaks in a Covered Species
Hawaiian endemics evolved in the absence of many pathogens, and as a result, their lack of resistance to some diseases has played an important role in the declines of many endemic species. The estimated risk of the Covered Species to disease outbreaks varies by species, but this threat is highlighted in the State of Hawaii’s Comprehensive Wildlife Conservation Strategy as a need for future research for the Hawaiian short-eared owl (Mitchell et al. 2005), and Hawaiian waterbirds have been found to be susceptible to outbreaks of avian botulism (USFWS 2011d). No disease outbreaks have been documented among Hawaiian hoary bat or Newell’s shearwater populations, although Newell’s shearwater fledglings have been found with mild symptoms of avian pox (Ainley et al. 1997). Should the prevalence of disease increase and become identified as a major threat to the survival of any of these species by DOFAW and USFWS, the HCP mitigation efforts may be modified should USFWS and DOFAW reasonably determine in consultation with Na Pua Makani Power Partners that such a response is necessary.
9.3.1.6 Changes in Distribution of Currently Listed Species
New research could alter the understanding of the potential impacts to species listed at the time this HCP was prepared. The likelihood that our understanding of risks to species and/or the distribution of their populations would change in a manner that would alter the assessment made in preparing this HCP is sufficient to warrant treating this possibility as a changed circumstance. If, as a result of new information, incidental take of a non-covered state or federally listed species appears possible, or if an increase in take of covered species is reasonably anticipated, Na Pua Makani Power Partners would seek coverage under an amendment to the existing HCP. Na Pua Makani Power Partners would also reinitiate consultation with the USFWS and DOFAW to discuss whether mitigation measures in place meet permit issuance criteria for the non-covered listed species or if additional measures are warranted.
9.3.2 Unforeseen Circumstances and No Surprises Policy
Should the USFWS determine, based on considerations outlined in 50 CFR § 17.22(b)(5)(iii)(c), that unforeseen circumstances have arisen during the permit term, the USFWS and DOFAW will notify Na Pua Makani Power Partners in writing.
The federally listed Newell’s shearwater, Hawaiian goose, Hawaiian stilt, Hawaiian coot, Hawaiian moorhen, Hawaiian duck, and Hawaiian hoary bat are considered adequately addressed under this HCP and are, therefore, covered by the USFWS’s No Surprises assurances. Similar state No Surprises assurances under HRS 195D-23 apply to the listed species above, as well as the state-listed Hawaiian short-eared owl, as the HCP conditions described for each of these species satisfy the permit issuance criteria under HRS 195D-21.
In the event that it is demonstrated by the USFWS and DOFAW that unforeseen circumstances exist during the permit term, and additional conservation or mitigation measures are recommended to respond
FINAL HABITAT CONSERVATION PLAN
Na Pua Makani Wind Energy Project 82
to unforeseen circumstances, Na Pua Makani Power Partners will evaluate the additional proposed measures to see if they can be practicably implemented. Provided the HCP is being properly implemented, additional conservation or mitigation measures are limited in that the USFWS and DOFAW:
Shall neither require the commitment of additional land, water, or financial compensation by Na Pua Makani Power Partners without Na Pua Makani Power Partners’ consent nor shall they impose additional restrictions on the use of land, water, or other natural resources otherwise available for use by Na Pua Makani Power Partners under the original terms of the HCP, including additional restrictions on covered actions that are permitted under this HCP.
Shall have the burden of demonstrating that such unforeseen circumstances exist, using the best scientific and commercial data available. Their findings must be clearly documented and based upon reliable technical information regarding the status and habitat requirements of the affected species. In determining whether an event constitutes an unforeseen circumstance, the USFWS and DOFAW will consider, but not be limited to, the following factors:
o Size of the current range of the affected Covered Species;
o Percentage of the range adversely affected by the HCP;
o Percentage of range conserved by the HCP;
o Ecological significance of that portion of the range affected by the HCP;
o Level of knowledge about the affected Covered Species and the degree of specificity of the species’ conservation program under the HCP; and
o Whether failure to adopt additional conservation measures would appreciably reduce the likelihood of survival and recovery of the affected Covered Species in the wild.
Shall not require additional mitigation for a species from the HCP permittee where the terms of a properly functioning HCP agreement were designed to provide an overall net benefit for that species and contained measurable criteria for the biological success of the HCP, which have been or are being met.
Nothing in this policy shall be construed to limit or constrain the USFWS, DOFAW, or any other governmental agency from taking additional actions at its own expense to protect or conserve a species included in this HCP.
9.4 Funding and Assurances
The ESA and HRS require that HCPs detail the funding that will be made available to implement the proposed monitoring and mitigation plans. HCP implementation typically requires funding for activities associated with Project implementation (e.g., post-construction monitoring) and mitigation measures (e.g., habitat restoration or contributions to research). Costs provided in Section 6.0 and Appendix F are estimates. Na Pua Makani Power Partners is committed to providing the funds necessary to complete the mitigation, post-construction monitoring, reporting, and adaptive management as described in this HCP and the associated Post-construction Monitoring Plan (Appendix A). Funding assurances consistent with state and federal requirements will be provided.
FINAL HABITAT CONSERVATION PLAN
Na Pua Makani Wind Energy Project 83
Section 10(a)(2)(B)(iii) of the ESA requires an HCP applicant to ensure that adequate funding for the plan will be provided. Similarly, HRS Section 195D-4(g) requires the applicant to guarantee that adequate funding for the plan will be provided through a financial tool (e.g., an irrevocable letter of credit,), depositing a sum of money in the endangered species trust fund created by HRS Section 195D-31, or provide other means approved by the BLNR, adequate to ensure monitoring of the species by the state and to ensure that the applicant takes all actions necessary to minimize and mitigate the impacts of the take.
Funding assurances include a budget for DOFAW to conduct compliance monitoring should a significant issue arise that cannot be resolved between Na Pua Makani Power Partners and DOFAW. These funds would be used by DOFAW to verify compliance of Na Pua Makani Power Partners’ post-construction fatality monitoring if: 1) DOFAW has identified and notified Na Pua Makani Power Partners about a potential compliance issue; 2) DOFAW has determined that Na Pua Makani Power Partner has not satisfactorily addressed the issue; and 3) Attempts to resolve the issue through meeting and conferring with the parties, arbitration, or other means have not succeeded.
Na Pua Makani Power Partners will provide financial assurances for an amount sufficient to cover the costs of implementing its obligations under this HCP (up to Tier 1, where appropriate). Financial assurances for $3,736,050 will ensure funding for Tier 1 mitigation, the Post-construction Monitoring Plan (Appendix A), and any required DOFAW compliance monitoring. The financial assurances will be provided within six (6) months of issuance by USFWS of the ITP and issuance by DOFAW of the ITL. The take authorization contained in the ITP and ITL is not effective until Na Pua Makani Power Partners provides USFWS and DOFAW executed copies of the letter of credit (or other approved financial tool) containing terms reasonably acceptable to the USFWS and DOFAW. Upon triggering Tier 2 mitigation, financial assurances for an additional $894,000 will be provided to ensure funding for Tier 2 mitigation. An estimate of the costs for implementing the HCP is provided in Appendix F.
9.5 Adaptive Management
The U.S. Department of the Interior defines adaptive management as a structured approach to decision making in the face of uncertainty that makes use of the experience of management and the results of research in an embedded feedback loop of monitoring, evaluation, and adjustments in management strategies (Williams et al. 2009). Uncertainties may include a lack of biological information for the Covered Species, a lack of knowledge about the effectiveness of mitigation or management techniques, or doubt about the anticipated effects of the Project. Adaptive management is a required component of HCPs that allows for the incorporation of new information into conservation and mitigation measures during HCP implementation. Effective implementation of this approach requires explicit and measurable objectives, and identifies what actions are to be taken and when they are to occur. Adaptive management measures do not trigger the need for an amendment (see Section 9.6).
Although Na Pua Makani Power Partners used the best available information to evaluate take of the Covered Species, uncertainties exist in the anticipated effect of the operation of the Project on all species but, particularly, the Hawaiian hoary bat (Section 6.1). Because of the limited data for bat interactions with wind facilities in Hawaii, uncertainty regarding the number of fatalities that are found at operational facilities, and variable methods available for estimating collision risk for this species, Na Pua Makani Power Partners created a tiered structure to ensure that mitigation was proportional to take. This tiered structure clearly states that if the take within a tier is reached, the next level of mitigation will
FINAL HABITAT CONSERVATION PLAN
Na Pua Makani Wind Energy Project 84
automatically be initiated (i.e., adaptive management is engaged). Furthermore, clearly defined triggers are identified to initiate planning and implementation of Tier 2 mitigation, providing assurance that mitigation will be timed appropriately with associated take (Section 6.1.1). Should the authorized take limit (i.e., the Tier 2 take limit) be approached, Na Pua Makani Power Partners will consult with the USFWS and DOFAW to determine an appropriate approach to remain in compliance with the terms of the HCP and associated ITP and ITL and may amend the HCP.
To ensure an accurate measurement of take for Covered Species, detected fatalities will be adjusted based on searcher efficiency and carcass persistence trials if appropriate and as described in the Post-construction Monitoring Plan (Appendix A). Furthermore, the Post-construction Monitoring Plan describes Na Pua Makani Power Partners’ approach to the review and potential implementation of adaptive management measures to detect any take. Therefore, all incidental take will be documented and mitigated as described in this HCP, and Na Pua Makani Power Partners will implement the use of proven new technologies or measures to minimize take as approved by and reasonably determined to be necessary by USFWS and DOFAW in consultation with Na Pua Makani Power Partners.
As part of Na Pua Makani Power Partners’ commitment to minimizing take, the Project will manage Project operations under a seasonal low wind speed curtailment approach. Using the best available information, Na Pua Makani Power Partners determined March – November from sunset to sunrise was the most appropriate period during which to implement low wind speed curtailment. The temporal distribution of fatalities may differ from what is expected, and should fatalities be observed during other periods, Na Pua Makani Power Partners would consult with USFWS and DOFAW to determine if an adjustment to the low wind speed curtailment program would be practicable and appropriate. A variety of factors in the evaluation would be considered including the overall estimated take of Hawaiian hoary bats at the Project and the proportion of bat fatalities occurring during non-curtailment periods.
9.6 Revisions and Amendments
It is necessary to establish a procedure by which the ITP and ITL can be amended. However, the cumulative effect of any amendments must not jeopardize any threatened or endangered species or statutory or regulatory permit issuance criteria. The USFWS and DOFAW must approve all proposed amendments that may affect any federal- or state-listed species, respectively.
9.6.1 Minor Amendments to the HCP
Minor amendments involve routine administrative revisions and minor changes to operations and management, post-construction monitoring and mitigation monitoring programs, the mitigation plan, schedule of mitigation milestones, or the development area and design that do not diminish the level or means of mitigation or increase take. Such minor amendments do not materially alter the terms of the ITP or ITL. Upon the written request by Na Pua Makani Power Partners, the USFWS and DOFAW are authorized to approve minor amendments to the HCP.
9.6.2 Major Amendments to the HCP
Other amendments that substantively alter the requested take, term of the HCP, or mitigation provided to compensate for take would be considered major amendments to the ITP and ITL. Two examples of a major amendment would be 1) adding a new species to the list of Covered Species or 2) extending the HCP and associated ITP and ITL beyond their original 21-year term. A major amendment requires
FINAL HABITAT CONSERVATION PLAN
Na Pua Makani Wind Energy Project 85
submittal to USFWS and DOFAW of a written request and implementation of all permit processing procedures applicable to an original ITP and ITL. A request for an extension of the existing HCP and associated ITP and ITL without major amendments should be submitted a minimum of 6 months prior to the expiration of the ITP and ITL. If provided for by the regulations existing at that time, the HCP will remain valid and in effect during the processing of this request if the renewal or extension is processed during the original permit term and other regulatory criteria are met.
9.6.3 Permit Transfer
In the event of sale of the Project, the new owner(s) will commit to all requirements regarding the take authorization and mitigation obligations of this HCP, unless otherwise specified in the Assumption Agreement and agreed to in advance by the new owner(s), USFWS, and DOFAW. The permit will be transferred if authorized by the applicable regulations existing at that time.
10 REFERENCES
Ainley, D.G., R. Podolsky, L. de Forest, G. Spencer, N. Nur. 1995. Kauai Endangered Seabird Study Volume 2. The ecology of Newell’s shearwater and dark-rumped petrel on the island of Kauai, Hawaii. Final report prepared for Electric Power Research Institute, Palo Alto, CA. Stinson Beach, CA: Prepared by Point Reyes Bird Observatory. 74 pp.
Ainley, D.G., T.C. Telfer, and M.H. Reynolds. 1997. Townsend’s and Newell’s shearwater (Puffinus
auricularis). The Birds of North America, No. 297 (A. Poole and F. Gill, eds.). Academy of Natural Sciences, Philadelphia and American Ornithologists’ Union, Washington, DC. 20 pp
Ainley, D.G., R. Podolsky, L. de Forest, G. Spencer, and N. Nur. 2001. The status and population trends of the Newell’s shearwater on Kauai: insights from modeling. Studies Avian Biology 22: 108 – 123.
Altamont Pass Avian Monitoring Team. 2008. Altamont Pass Wind Resource Area bird fatality study. July. (ICF J&S 61119.06.) Portland, OR. Prepared for Altamont County Community Development Agency.
Anderson, D. R. 1975. Population ecology of the Mallard: V. Temporal and geographic estimates of survival, recovery and harvest rates. U.S. Fish Wildl. Serv. Resour. Publ. 125.
AOU (American Ornithologists’ Union). 1993. Thirty-ninth supplement of the American Ornithologists’ Union Checklist of North American Birds. Auk 110: 675 – 682.
AOU. 1998. Checklist of North American birds, 7th edition, as revised through annual supplements 1999 – 2012. American Ornithologists’ Union. Washington, DC. 829 pp.
APLIC (Avian Power Line Interaction Committee). 2012. Reducing avian collisions with power lines: the state of the art in 2012. Edison Electric Institute and APLIC. Washington, D.C.
Arnett, E.B. 2005. Relationships between bats and wind turbines in Pennsylvania and West Virginia: an assessment of bat fatality search protocols, patterns of fatality, and behavioral interactions with wind turbines. A final report submitted to the Bats and Wind Energy Cooperative. Austin, TX: Bat Conservation International.
Arnett, E.B., D.B. Inkley, D.H. Johnson, R.P. Larkin, S. Manes, A.M. Manville, J.R. Mason, M.L. Morrison, M.D. Strickland, and R. Thresher. 2007. Impacts of wind energy facilities on wildlife

FINAL HABITAT CONSERVATION PLAN
Na Pua Makani Wind Energy Project 86
and wildlife habitat. Wildlife Society Technical Review 07-2. The Wildlife Society, Bethesda, MD, USA.
Arnett, E.B., W.K. Brown, W.P. Erickson, K.K. Fiedler, B.L. Hamilton, T.H. Henry, A. Jain, G.D. Johnson, J. Kerns, R.R. Koford, C.P. Nicholson, T.J. O’Connell, M.D. Piorkowski, and R.D. Tankersley, Jr. 2008. Patterns of bat fatalities at wind energy facilities in North America. Journal of Wildlife Management 72: 61 – 78.
Arnett, E.B., M. Schirmacher, M.M.P. Huso, and J. Hayes. 2009. Effectiveness of changing wind turbine cut-in speed to reduce bat fatalities at wind facilities. An annual report submitted to the Bats and Wind Energy Cooperative. Bat Conservation International, Austin, Texas, USA.
Arnett, E.B., J.P. Hayes, M.M.P. Huso, and M. Schirmacher. 2010. Effectiveness of changing wind turbine cut-in speed to reduce bat fatalities at wind facilities. Austin, TX: Bat Conservation International. www.batsandwind.org/pdf/Curtailment Final Report 5-15-10 v2.pdf.
Baerwald, E.F., J. Edworthy, M. Holder, and R.M.R. Barclay. 2009. A large-scale mitigation experiment to reduce bat fatalities at wind energy facilities. Journal of Wildlife Management 73(7): 1077 – 1081.
Baldwin, P.H. 1950. Occurrence and behavior of the Hawaiian bat. Journal of Mammalogy 31: 455 – 456.
Banko, W.E. 1987. History of endemic Hawaiian birds. Part I. Population histories – species accounts. Freshwater birds: Hawaiian Gallinule (`Alae-`ula). CPSU-UH Avian History Report 12A:1-138.
Banko, P.C. 1988. Breeding biology and conservation of the nene, Hawaiian goose (Nesochen
sandvicensis). Ph.D. dissertation, University of Washington, Seattle, WA.
Banko, P.C., J.M. Black, and W.E. Banko. 1999. Hawaiian Goose (Branta sandvicensis), The Birds of North America Online (A. Poole, Ed.). Ithaca: Cornell Lab of Ornithology; Retrieved from the Birds of North America Online: http://bna.birds.cornell.edu/bna/species/434 doi:10.2173/bna.434
Bannor, B.K and E. Kiviat. 2002. Common moorhen (Gallinula chloropus). The Birds of North America, No.685 (A. Poole and F. Gill, eds.). The Birds of North America, Inc., Philadelphia, PA. 27 pp.
Berger, A.J. 1981. Hawaiian birdlife, second edition. University of Hawaii Press, Honolulu, HI. 275 pp.
Black, J.M. and P.C. Banko. 1994. Is the Hawaiian Goose (Branta sandvicensis) saved from extinction? Pages 394 – 410 in P.J.S. Olney, G.M. Mace and A.T.C. Feistner (editors). Creative conservation—interactive management of wild and captive animals. Chapman and Hall, London, U.K.
Black, J.M., A.P. Marshall, A. Gilburn, N. Santos, H. Hoshide, J. Medeiros, J. Mello, C. Natividad Hodges, and L. Katahira. 1997. Survival, movements, and breeding of released Hawaiian geese: an assessment of the reintroduction program. Journal of Wildlife Management 6:1161 – 1173.
Bogan, M.A. 1972. Observations on parturition and development in the hoary bat, Lasiurus cinereus. Journal of Mammalogy 53: 611–614.
Bonaccorso, F.J., C.M. Todd, A. C. Miles, and P.M. Gorresen. 2015. Foraging range movements of the endangered Hawaiian hoary bat, Lasiurus cinereus semotus (Chiroptera: Vespertilionidae). Journal of Mammalogy, 96(1):64–71.
FINAL HABITAT CONSERVATION PLAN
Na Pua Makani Wind Energy Project 87
Bostwick, J.M. 1982. Habitat loss and hybridization: the dual threat to the koloa. Senior honors thesis, Department of Zoology, University of Hawaii, Honolulu, HI. 80 pp.
Brisbin, I.L., H.D. Pratt, and T.B. Mowbray. 2002. American coot (Fulica americana) and Hawaiian coot (Fulica alai). The Birds of North America, No. 697 (A. Poole and F. Gill, eds.). The Birds of North America, Inc., Philadelphia, PA.
Brooke, M. 1990. The Manx shearwater. T. & A. D. Poyser, London.
Brooke, M. 2004. Albatrosses and petrels across the world. Oxford University Press, Oxford
Browne, R.A., C.R. Griffin, P.R. Chang, M. Hubley, and A.E. Martin. 1993. Genetic divergence among populations of the Hawaiian duck, Laysan duck, and mallard. Auk 110: 49 – 56.
Byrd, G.V. and C.F. Zeillemaker. 1981. Ecology of nesting Hawaiian common gallinules at Hanalei, Hawaii. Western Birds 12: 105 – 136.
Byrd, G.V., J.L. Sincock, T.C. Telfer, D.I. Moriarty, and B.G. Brady. 1984. A cross-fostering experiment with Newell’s race of Manx shearwater. Journal of Wildlife Management 48: 163 – 168.
Byrd, G.V., R.A. Coleman, R.J. Shallenberger, and C.S. Arume. 1985. Notes on the breeding biology of the Hawaiian race of the American Coot. `Elepaio 45: 57 – 63.
Chang, P.R. 1990. Strategies for managing endangered waterbirds on Hawaiian National Wildlife Refuges. M.S. thesis, University Massachusetts, Department of Forestry and Wildlife Management, Amherst, MA. 87 pp.
Clapp, R.B., M.K. Klimkiewicz, and J.H. Kennard. 1982. Longevity records of North American birds: gaviidae through alcidae. Journal of Field Ornithology 53: 81 – 124.
Clark, R. J. 1975. A field study of the short-eared owl (Asio flammeus) Pontoppidan in North America. Wildlife Monographs: 47: 1 – 67.
Coleman, R.A. 1981. The reproductive biology of the Hawaiian subspecies of the black-necked stilt, Himantopus mexicanus knudseni. Ph.D. dissertation, Pennsylvania State University, PA. 106 pp.
Cooper, B.A. and R.H. Day. 1998. Summer behavior and mortality of Dark-rumped petrels and Newell’s shearwaters at power lines on Kauai. Colonial Waterbirds 21: 11 – 19.
Cooper, B.A., P.M. Sanzenbacher, and R.H. Day. 2009. Radar and visual studies of seabirds at the proposed Kawailoa Wind Energy Facility, Oahu Island, Hawaii, 2009. Unpublished report prepared for First Wind LLC, Newton, MA by ABR, Inc., Forest Grove, OR, and Fairbanks, AK. 32 pp. Appendix 3 in Kawailoa Wind Power Draft Habitat Conservation Plan. July 2011. Prepared by SWCA, Honolulu, HI, for Kawailoa Wind Power LLC, Honolulu, HI. 144 pp + appendices.
Cramp, S. 1985. The birds of the western Palearctic, volume 4. Oxford University Press, Oxford.
Dahl, T.E. 1990. Wetland losses in the United States 1780s to 1980s. U.S. Department of Interior, U.S. Fish and Wildlife Service, Washington, D.C. 13 pp.
Day, R.H. and B.A. Cooper. 2002. Petrel and shearwater surveys near Kalaupapa, Molokai Island, June, 2002. Final report to the National Park Service, Hawaii National Park. ABR, Inc., Fairbanks, AK.
FINAL HABITAT CONSERVATION PLAN
Na Pua Makani Wind Energy Project 88
Day, R.H. and B.A. Cooper. 2008. Results of endangered seabird and Hawaiian hoary bat surveys on northern Oahu Island, October 2007 and July 2008. Unpublished report prepared for First Wind, Newton, MA, by ABR, Inc.—Environmental Research & Services, Fairbanks, AK, and Forest Grove, OR. 27 pp. Appendix 3 in Kahuku Wind Power Draft Habitat Conservation Plan. August 2009. Prepared by SWCA, Honolulu, HI, for Kahuku Wind Power LLC, Honolulu, HI. 144 pp + appendices.
Day, R.H., B.A. Cooper, and T.C. Telfer. 2003. Decline of Townsend’s (Newell’s) shearwaters (Puffinus
auricularis newelli) on Kauai, Hawaii. Auk 120: 669 – 679.
Day, R.H., A.K. Prichard, and J.R. Rose. 2005. Migration and collision avoidance of eiders and other birds at Northstar Island, Alaska, 2001 – 2004: Final Report. Prepared for BP Exploration (Alaska) Inc. Anchorage, AK. Prepared by ABR, Inc.—Environmental Research & Services, Fairbanks, AK.
DBEDT (Department of Business, Economic Development & Tourism). 2013. Research and economic analysis. Accessed October 2013 at: http://dbedt.hawaii.gov/economic/
Desholm, M. and J. Kahlert. 2005. Avian collision risk at an offshore wind farm. Royal Society Biology Letters. 1: 296 – 298.
DOFAW (Hawaii Department of Land and Natural Resources, Division of Forestry and Wildlife). 1976 – 2008. Biannual Hawaiian waterbird survey data. Summarized by Hawaii Natural Heritage Program and Pacific Islands Fish and Wildlife Office, Honolulu, HI.
DOFAW. 2015. Endangered Species Recovery Committee Hawaiian hoary bat guidance document. State of Hawaii Department of Land and Natural Resources, Division of Forestry and Wildlife, Honolulu, HI. Draft dated July 2015
Drewitt, A.L. and R.H.W. Langston. 2008. Collision effects of wind-power generators and other obstacles on birds. Year in Ecology and Conservation Biology 2008. R.S. Ostfeld and W.H. Schlesinger. Oxford, Blackwell Publishing. 1134: 233 – 266.
Drilling, N., R. Titman, and F. Mckinney. 2002. Mallard (Anas platyrhynchos), The Birds of North America Online (A. Poole, Ed.). Ithaca: Cornell Lab of Ornithology; Retrieved from the Birds of North America Online: http://bna.birds.cornell.edu/bna/species/658. doi:10.2173/bna.658.
Duvall, F. and R. Gassmann-Duvall. 1991. No bats on Maui? Look again. `Elepaio 51: 1 – 2.
Engilis, A., Jr. 1988. Surveys and inventories of waterbirds in the State of Hawaii, a ten-year trend analysis. Unpublished Pittman-Robertson Report W-18-R-12, R-III-A.
Engilis, A., Jr. and T.K. Pratt. 1993. Status and population trends of Hawaii’s native waterbirds, 1977 – 1987. Wilson Bulletin 105: 142 – 158.
Engilis, A., Jr., K.J. Uyehara, and J.G. Giffin. 2002. Hawaiian duck (Anas wyvilliana). The Birds of North America Online (A. Poole, ed.). Ithaca: Cornell Lab of Ornithology; Retrieved from the Birds of North America Online: http://bna.birds.cornell.edu/bna/species/694. doi:10.2173/bna.694.
Erickson, M. 1942. A coot and a plane. News from the Bird-Banders 17: 7.
FINAL HABITAT CONSERVATION PLAN
Na Pua Makani Wind Energy Project 89
Erickson, W.P., G.D. Johnson, M.D. Strickland, D.P. Young Jr., K.J. Sernka, and R.E. Good. 2001. Avian collisions with wind turbines: a summary of existing studies and comparisons to other sources of avian collision mortality in the United States. National Wind Coordinating Committee, Washington, DC. Accessed at http://www.nationalwind.org/assets/archive/Avian_Collisions_with_Wind_Turbines_-_A_Summary_of_Existing_Studies_and_Comparisons_to_Other_Sources_of_Avian_Collision_Mortality_in_the_United_States__2001_.pdf.
Erickson, W.P., G.D. Johnson, D.P. Young, Jr., M.D. Strickland, R.E. Good, M. Bourassa, and K. Bay. 2002. Synthesis and comparison of baseline avian and bat use, raptor nesting and mortality information from proposed and existing wind developments. Technical Report prepared for Bonneville Power Administration, Portland, OR.
Foote, D.E., E.L. Hill, S. Nakamura, and F. Stephens. 1972. Soil survey of the islands of Kauai, Oahu, Maui, Molokai, and Lanai, State of Hawaii. US Department of Agriculture. Washington, D.C.: U.S. Government Printing Office.
Fowler, A.C., J.M. Eadie, and A. Engilis, Jr. 2009. Identification of endangered Hawaiian ducks (Anas
wyvilliana), introduced North American mallards (A. platyrhynchos), and their hybrids using multilocus genotypes. Conservation Genetics 10: 1747 – 1758.
Fransson, T., T. Kolehmainen, C. Kroon, L. Jansson, and T. Wenninger. 2010. EURING list of longevity records for European birds. http://www.euring.org/data_and_codes/longevity.htm.
Gee, H.K. 2007. Habitat characteristics of refuge wetlands and taro lo`i used by endangered waterbirds at Hanalei National Wildlife Refuge, Hawaii. M.S. thesis, South Dakota State University. 154 pp.
Giambelluca, T.W., Q. Chen, A.G. Frazier, J.P. Price, Y.-L. Chen, P.-S. Chu, J.K. Eischeid, and D.M. Delparte, 2013: Online rainfall atlas of Hawaii. Bulletin of the American Meteorological Society 94: 313 – 316. doi: 10.1175/BAMS-D-11-00228.1.
Giffin, J. 1983. Abundance and distribution of koloa on the Island of Hawaii. Hawai`i Department of Land and Natural Resources PR Project No. W-18-R-7. Honolulu, Hawaii. 9 pp.
Good, R.E., A. Merrill, S. Simon, K. Murray, and K. Bay. 2012. Bat monitoring studies at the Fowler Ridge Wind Farm, Benton County, Indiana: April 1 – October 31, 2011. Prepared for the Fowler Ridge Wind Farm. Prepared by Western EcoSystems Technology, Inc. (WEST), Bloomington, Indiana.
Gorressen, M.P., F.J. Bonaccorso, C.A. Pinzari, C.M. Todd, K. Montoya-Aiona, and K. Brinck. 2013. A five-year study of Hawaiian hoary bat (Lasiurus cinereus semotus) occupancy on the island of Hawai’i. Technical report HCSU-041. University of Hawai’i at Hilo. Hilo, HI.
Gray, C.M. and K.C. Hamer. 2001. Prefledging mass recession in Manx shearwaters: parental desertion or nestling anorexia? Animal Behaviour 62:705 – 709.
Griesemer, A.M. and N.D. Holmes. 2011. Newell’s shearwater population modeling for habitat conservation plan and recovery planning. Technical Report No. 176. The Hawaii-Pacific Islands Cooperative Ecosystem Studies Unit & Pacific Cooperative Studies Unit, University of Hawaii, Honolulu, Hawaii. 68 pp.
FINAL HABITAT CONSERVATION PLAN
Na Pua Makani Wind Energy Project 90
Griffin, D.R. 1958. Listening in the dark: the acoustic orientation of bats and men. Yale University Press, New Haven, Connecticut. 413 pp.
Groot, R.S. De. 1983. Origin, status and ecology of the owls in Galapagos. Ardea 71: 167 – 182.
Harris, M.P. 1966a. Age of return to the colony, age of breeding, and adult survival of Manx shearwaters. Bird Study 13: 84 – 95.
Harris, M.P. 1966b. Breeding biology of the Manx shearwater Puffinus puffinus. Ibis 108: 17 – 33.
HBMP (Hawaii Biodiversity Mapping Program). 2007. Hawaiian hoary bat. Available online at: http://hbmp.hawaii.edu/printpage.asp?spp=AMACC05031.
HNP (Haleakala National Park). 2009. Endangered Species Management. Prepared 10/18/05.
Hobdy, R. 2013a. Biological resources survey Na Pua Makani Wind Energy Project, Kahuku, Ko`olauloa, Oahu, Hawaii. Kokomo, Maui, HI. Prepared for Na Pua Makani Power, LLC.
Hobdy, R. 2013b. Wetlands and waters of the U.S. assessment and determination for the Na Pua Makani Wind Energy Project, Kahuku, Ko`olauloa, Oahu, Hawaii. Kokomo, Maui, HI. Prepared for Na Pua Makani Power, LLC.
Holmes, N., T.W. Joyce, J.R. Troy, and D. Burney. 2009. Status and conservation of Newell’s shearwaters on Kauai, Hawaii. Reduction in breeding range and developments towards protecting colonies. Spoken paper, Hawaii Conservation Conference. Honolulu, Hawaii.
Holt, D.W. and S.M. Melvin. 1986. Population dynamics, habitat use, and management needs of the short-eared owl in Massachusetts: Summary of 1985 research. Massachusetts Division of Fish and Wildlife, Natural Heritage Program. Boston, MA.
Howarth, F.G. and W.P. Mull. 1992. Hawaiian insects and their kin. University of Hawaii Press, Honolulu, HI.
Hu, D.E. 1998. Causes of extinction and endangerment in Hawaiian birds. Ph.D. dissertation, University of California, Davis, CA.
Humphrey, S.R. 1982. Bats, Vespertilionidae and Molossidae. Pp 52 – 70 in Wild mammals of North America: biology, management, and economics (J.A. Chapman and G.A. Feldhamer, eds.). Johns Hopkins University Press, Baltimore, MD.
Humphrey, S.R. and J.B. Cope. 1976. Population ecology of the little brown bat, Myotis lucifugus, in Indiana and north-central Kentucky. American Society of Mammalogists. Stillwater, OK.
IUCN (International Union for Conservation of Nature and Natural Resources). 2013. IUCN red list of threatened species. Version 2013.1. <www.iucnredlist.org>. Downloaded on 02 July 2013.
Jain, A.A. 2005. Bird and bat behavior and mortality at a northern Iowa windfarm. M.S. thesis. Iowa State University, Ames, IA.
Johnson, G.D. and W.P. Erickson. 2011. Avian, bat and habitat cumulative impacts associated with wind energy development in the Columbia Plateau Ecoregion of eastern Washington and Oregon. Prepared by West, Inc. for Klickitat County, Washington.
FINAL HABITAT CONSERVATION PLAN
Na Pua Makani Wind Energy Project 91
Joyce, T.W. 2013. Abundance estimates of the Hawaiian petrel (Pterodroma sanwichensis) and Newell’s shearwater (Puffinus newelli) based on data collected at sea, 1998 – 2011. Scripps Institution of Oceanography, La Jolla, CA. 31 pp.
Kaheawa Pastures I Wind Project. 2006. Habitat Conservation Plan. Kaheawa Wind Power, LLC. Ukumehame, Hawaii.
Kaheawa Pastures I Wind Project. 2013. Kaheawa Habitat Conservation Plan—ITL 08: FY 2012 Annual Report—Year 7. Wailuku, HI.
Kaheawa Pastures II Wind Project. 2010. Habitat Conservation Plan. Kaheawa Wind Power II Wind Energy Generation Facility. Ukumehame, Maui, Hawaii.
Kahuku Wind Power. 2013. Kahuku Habitat Conservation Plan—ITL 10: FY 2013 Annual Report—Year 3. Kahuku, HI.
Kahuku Wind Power. 2014. Kahuku Habitat Conservation Plan—ITL 10: FY 2014 Annual Report—Year 4. Kahuku, HI.
Kawailoa Wind Power. 2013. Kawailoa Habitat Conservation Plan—ITL 14: FY 2013 Annual Report—Year 1. Haleiwa, HI.
Kennard, J.H. 1975. Longevity records of North American birds. Bird-Banding 46:55 – 73.
Kepler, C.B. and J.M. Scott. 1990. Notes on distribution and behavior of the endangered Hawaiian hoary bat (Lasiurus cinereus semotus), 1964 – 1983. `Elepaio 50: 59 – 64.
Kerns, J., W.P. Erickson, and E.B. Arnett. 2005. Bat and bird fatality at wind energy facilities in Pennsylvania and West Virginia. Pages 24 – 95 in Relationships between bats and wind turbines in Pennsylvania and West Virginia: An Assessment of bat fatality search protocols, patterns of fatality, and behavioral interactions with wind turbines (E.B. Arnett, technical editor). A final report submitted to the Bats and Wind Energy Cooperative. Bat Conservation International. Austin, TX.
Kingsley, A. and B. Whittam. 2001. Potential impacts of wind turbines on birds at North Cape, Prince Edward Island. A report for the Prince Edward Island Energy Corporation.
Kingsley, A. and B. Whittam. 2005. Wind turbines and birds: a background review for environmental assessment, Draft. Canadian Wildlife Service, Environment Canada, Gatineau, Quebec.
Klavitter, J. 2009. The ecology and conservation of Hawaiian raptors. Pp. 293 – 311 in Conservation biology of Hawaiian forest birds (T.K. Pratt et al., eds.). Yale University Press, New Haven, CT.
Klimkiewicz, M.K. and A.G. Futcher. 1989. Longevity records of North American birds supplement 1. Journal of Field Ornithology 60: 469 – 494.
Koehler, C.E. and R.M.R. Barclay. 2000. Post-natal growth and breeding biology of the hoary bat (Lasiurus cinereus). Journal of Mammalogy 81: 234 – 244.
Kunz, T.H., E.B. Arnett, W.P. Erickson, A.R. Hoar, G.D. Johnson, R.P. Larkin, M.D. Strickland, R.W. Thresher, and M.D. Tuttle. 2007. Ecological impacts of wind energy development on bats: questions, research needs, and hypotheses. Frontiers in Ecology 5: 315 – 324.
FINAL HABITAT CONSERVATION PLAN
Na Pua Makani Wind Energy Project 92
Larsen, J.K. and M. Guillemette. 2007. Effects of wind turbines on flight behaviour of wintering common eiders: implications for habitat use and collision risk. Journal of Applied Ecology 44: 516 – 522.
Menard, T. 2001. Activity patterns of the Hawaiian hoary bat (Lasiurus cinereus semotus) in relation to reproductive time periods. M.S. thesis, University of Hawaii, Honolulu.
Mitchell, C., C. Ogura, D.W. Meadows, A. Kane, L. Strommer, S. Fretz, D. Leonard, and A. McClung. October 2005. Hawaii’s comprehensive wildlife conservation strategy. Department of Land and Natural Resources. Honolulu, Hawaii. 722 pp.
Mostello, C.S. 1996. Diets of the pueo, barn owl, the cat, and the mongoose in Hawaii: Evidence for Competition. M.S. thesis, University of Hawaii, Honolulu, HI.
Munro, G.C. 1960. Birds of Hawaii. Charles E. Tuttle Company, Rutland, VT and Tokyo, Japan. 192 pp.
Murray, G.A. 1976. Geographic variation in the clutch size of seven owl species. Auk 93:602 – 613.
Nagata, S.E. 1983. Status of the Hawaiian gallinule on lotus farms and a marsh on Oahu, Hawaii. M.S. thesis, Colorado State University, Fort Collins, CO.
Paton, P.W.C. 1981. The koloa (Hawaiian duck) on the island of Hawaii. `Elepaio 41: 131 – 133.
Perkins, R.C.L. 1895. Notes on some Hawaiian Birds. Ibis (7th series) 1: 117 – 129.
Perrins, C. M., M.P. Harris, and C.K. Britton. 1973. Survival of Manx shearwaters (Puffinus puffinus). Ibis 115: 535 – 548.
Polhemus, D.A. 2007. Biology recapitulates geology: the distribution of Megalagrion damselflies on the Ko`olau Volcano of Oahu, Hawaii. Biology of Hawaiian streams and estuaries. Edited by N.L. Evenhuis and J.M. Fitzsimons. Bishop Museum Bulletin in Cultural and Environmental Studies 3: 233 – 246.
Pratt, H.D. and I.L. Brisbin Jr. 2002. Hawaiian Coot (Fulica alai). The Birds of North America Online (A. Poole, ed.). Ithaca: Cornell Lab of Ornithology; Retrieved from the Birds of North America Online: http://bna.birds.cornell.edu/bna/species/697bdoi:10.2173/bna.697b.
Pyle, R.L. and P. Pyle. 2009. The birds of the Hawaiian Islands: occurrence, history, distribution, and status. B.P. Bishop Museum, Honolulu, HI, U.S.A. Version 1 (31 December 2009) http://hbs.bishopmuseum.org/birds/rlp-monograph. Accessed April 2, 2013.
Reed, J.M. and L.W. Oring. 1993. Long-term population trends of the endangered Ae`o (Hawaiian stilt, Himantopus mexicanus knudseni). Transactions of the Western Section of The Wildlife Society 29: 54 – 60.
Reed, J.M., L.W. Oring, and M. Silbernagle. 1994. Metapopulation dynamics and conservation of the endangered Hawaiian stilt (Himantopus mexicanus knudseni). Transactions of the Western Section of The Wildlife Society 30: 7 – 14.
Reed, J.M., M.D. Silbernagle, K. Evans, A. Engilis, Jr., and L. Oring. 1998a. Subadult movement patterns of the endangered Hawaiian stilt (Himantopus mexicanus knudseni) as revealed by banding evidence. Auk 115: 791 – 797.
Reed, J.M., C.S. Elphick, and L. Oring. 1998b. Life-history and viability analysis of the endangered Hawaiian stilt. Biological Conservation 84: 35 – 45.
FINAL HABITAT CONSERVATION PLAN
Na Pua Makani Wind Energy Project 93
Reynolds, M.H. and G.L. Ritchotte. 1997. Evidence of Newell’s shearwater breeding in Puna District, Hawaii. Journal of Field Ornithology 68: 26 – 32.
Robinson, J A., L.W. Oring, J.P. Skorupa, and R. Boettcher. 1997. American avocet (Recurvirostra
americana). The Birds of North America Online (A. Poole, ed.). Ithaca: Cornell Lab of Ornithology; Retrieved from the Birds of North America Online: http://bna.birds.cornell.edu/bna/species/275.
Robinson, J.A., J.M. Reed, J.P. Skorupa, and L.W. Oring. 1999. Black-necked stilt (Himantopus
mexicanus). The Birds of North America Online (A. Poole, ed.). Ithaca: Cornell Lab of Ornithology; Retrieved from the Birds of North America Online: http://bna.birds.cornell.edu/bna/species/449doi:10.2173/bna.449.
Ryder, R. A. 1963. Migration and population dynamics of American coots in western North America. Proceedings XIII International Ornithological Congress: 441 – 453.
Sanzenbacher, P.M and B.A. Cooper. 2013. Radar and visual studies of seabirds and bats at the proposed Na Pua Makani Wind Energy Project, Oahu Island, Hawaii, fall 2012, spring 2013, and summer 2013. ABR, Inc.—Environmental Research & Services, Forest Grove, OR.
Schwartz, C.W. and E.R. Schwartz. 1949. The game birds in Hawaii. Hawaii Division of Fish and Game and Board of Commissioners of Agriculture and Forestry, Honolulu, HI. 168 pp.
Shallenberger, R.J. 1977. An ornithological survey of Hawaiian wetlands. U.S. Army Corps of Engineers Contract DACW 84-77-C-0036, Honolulu, HI. 406 pp.
Smith, D.G. and J.T. Polhemus. 2003. Habitat use and nesting activity by the Hawaiian stilt (Himantopus
mexicanus knudseni) and Hawaiian moorhen (Gallinula chloropus sandvicensis) at the Hamakua Marsh State Wildlife Sanctuary, Kailua, Oahu. `Elepaio 63: 59 – 62.
Snetsinger, T.J., S.G. Fancy, J.C. Simon, and J.D. Jacobi. 1994. Diets of owls and feral cats in Hawaii. `Elepaio 54: 47 – 50.
Spear, L.B., D.G. Ainley, N. Nur, S.N.G. Howell. 1995. Population size and factors affecting at-sea distributions of four endangered procellariids in the tropical Pacific. Condor 97: 613 – 638.
SWCA (SWCA Environmental Consultants). 2010. Kahuku Wind Power Habitat Conservation Plan. Prepared for Kahuku Wind Power, LLC, Kahului, HI.
SWCA. 2011a. Kawailoa Wind Power wildlife monitoring report for waterbirds and bats, October 2009 – April 2011. Prepared by SWCA, Honolulu, HI, for First Wind, Honolulu, HI. 26 pp. Appendix 4 in Kawailoa Wind Power Draft Habitat Conservation Plan. Prepared by SWCA, Honolulu, HI, for Kawailoa Wind Power LLC, Honolulu, HI. 144 pp + appendices. http://hawaii.gov/dlnr/dofaw/hcp. Accessed April 2013.
SWCA. 2011b. Kawailoa Wind Power Final Habitat Conservation Plan. Prepared for Kawailoa Wind Power, LLC, Honolulu, HI.
Swedberg, G.E. 1967. The koloa, a preliminary report on the life history and status of the Hawaiian duck (Anas wyvilliana). Federal Aid to Wildlife Restoration Act Report (W-5-R), Department of Land and Natural Resources, Division of Fish and Game, Honolulu, HI. 56 pp.
FINAL HABITAT CONSERVATION PLAN
Na Pua Makani Wind Energy Project 94
Swift, R. 2004. Potential effects of ungulate exclusion fencing on displaying Hawaiian petrels (Pterodroma sandwichensis) at Hawaii Volcanoes National Park. M.S. thesis, Oregon State University, Corvallis, OR.
Takano, L.L. and S.M. Haig. 2004. Seasonal movement and home range of the Mariana common moorhen. Condor 106: 652-663.
Telfer, T.C. 1986. Newell’s shearwater nesting colony establishment study on the island of Kauai. Final report, Statewide Pittman-Robertson Program. Department of Land and Natural Resources, State of Hawaii. Honolulu, HI.
Tetra Tech (Tetra Tech, Inc.). 2012. The Auwahi Wind Farm Project, Final Habitat Conservation Plan. Document prepared for Auwahi Wind Farm LLC.
Tetra Tech. 2013a. Hawaiian hoary bat acoustic monitoring results for the Na Pua Makani Wind Energy Project. Unpublished data.
Tetra Tech. 2013b. Database of post-construction mortality monitoring results from North American wind projects. Unpublished data.
Tetra Tech. 2014. Na Pua Makani Wind Farm 2012 – 2013 Avian report. Prepared for Na Pua Makani Power Partners, LLC by Tetra Tech, Inc. Honolulu, HI.
Tetra Tech. 2015. Na Pua Makani Wind Farm Environmental Impact Statement. Prepared for US Fish and Wildlife Service, accepting authority Department of Land and Natural Resources, Land Division.
Tomich, P.Q. 1986. Mammals in Hawaii. Bishop Museum Press, Honolulu, HI. 375 pp.
Troy, J.R. and N.D. Holmes. 2008. Reduction in the breeding range of Newell’s Shearwaters Puffinus
newelli on Kauai, Hawaii: evidence and insights from field surveys and GIS modeling. Poster presentation, The Waterbird Society Annual Meeting. South Padre Island, TX.
Ueoka, M. 1979. Limited study of nesting stilt on the islands. Hawaii Department of Land and Natural Resources, Division of Forestry and Wildlife, Wailuku, Maui, Hawaii. Unpublished Pittman-Robert Report W-18-R-1/4, R-III-C.
USGS (U.S. Geological Survey). 2011. Gap Analysis Program, national land cover, version 2. Accessed at: http://dingo.gapanalysisprogram.com/landcoverv2/.
USFWS (U.S. Fish and Wildlife Service). 1983. Hawaiian dark-rumped petrel and Newell’s Manx shearwater recovery plan. Portland, Oregon.
USFWS. 1998. Recovery plan for the Hawaiian hoary bat. U.S. Fish and Wildlife Service, Portland, OR. 50 pp.
USFWS. 2004. Draft Revised Recovery Plan for the nene or Hawaiian goose (Branta sandvicensis). U.S. Fish and Wildlife Service, Portland, OR. 148 + xi pp.
USFWS. 2007. Threatened and Endangered Animals in the Hawaiian and Pacific Islands. Available online at: http://pacificislands.fws.gov/wesa/hawanimalsindex.html.
USFWS. 2011a. Ope`ape`a or Hawaiian hoary bat (Lasiurus cinereus semotus) 5-year review summary and evaluation. U.S. Fish and Wildlife Service. Pacific Islands Fish and Wildlife Service, Honolulu, HI. 13 pp.
FINAL HABITAT CONSERVATION PLAN
Na Pua Makani Wind Energy Project 95
USFWS. 2011b. Newell’s shearwater (Puffinus auricularis newelli), 5-year review summary and evaluation. U.S. Fish and Wildlife Service, Pacific Islands Fish and Wildlife Service, Honolulu, HI. 17 pp.
USFWS. 2011c. Nene or Hawaiian goose (Branta sandvicensis), 5-year review summary and evaluation. U.S. Fish and Wildlife Service, Pacific Islands Fish and Wildlife Service, Honolulu, HI. 16pp.
USFWS. 2011d. Recovery plan for Hawaiian waterbirds, Second Revision. U.S. Fish and Wildlife Service, Portland, Oregon. xx + 233 pp.
USFWS. 2012a. Land-based wind energy guidelines. March 23, 2012. Available online at: http://www.fws.gov/windenergy/docs/WEG_final.pdf.
USFWS. 2012b. Endangered and threatened wildlife and plants; endangered status for 23 species on Oahu and designation of critical habitat for 124 species 77 FR 57647 – 57862.
USFWS. 2013. Species protected under the Migratory Bird Treaty Act. USFWS Migratory Bird Program. Accessed at: http://www.fws.gov/migratorybirds/regulationspolicies/mbta/mbtandx.html.
USFWS and NMFS (National Marine Fisheries Service). 1996. Habitat conservation planning and incidental take permit processing handbook. U.S. Fish and Wildlife Service.
USFWS and NMFS. 2000. Availability of a final addendum to the Handbook for Habitat Conservation Planning and Incidental Take Permitting Process; Notice. 65 FR 35242 – 35257.
VanderWerf, E.A., K.R. Wood, C. Swenson, M. LeGrande, H. Eijzenga, and R.L. Walker. 2004. Biological inventory and assessment of Lehua Islet Kauai County, Hawaii, final report prepared for the U.S. Fish and Wildlife Service Pacific Islands Fish and Wildlife Office USFWS Research Grant No: 12200-1-J014 May 24, 2004.
VanderWerf, E.A, K.R. Wood, C. Swenson, M. LeGrande, H. Eijzenga, and R.L. Walker. 2007. Avifauna of Lehua Islet, Hawaii, conservation and value management needs. Pacific Science 61: 39 – 52.
Weller, M. W. and L. H. Fredrickson. 1973. Avian ecology of a managed glacial marsh. Living Bird 12: 269 – 291.
Whitaker, J.O., Jr. and P.Q. Tomich. 1983. Food habits of the hoary bat, Lasiurus cinereus, from Hawaii. Journal of Mammalogy 64: 151 – 152.
Wiggins, D.A., D.W. Holt, and S.M. Leasure. 2006. Short-eared Owl (Asio flammeus). The Birds of North America Online (A. Poole, ed.). Ithaca: Cornell Lab of Ornithology; Retrieved from the Birds of North America Online: http://bna.birds.cornell.edu/bna/species/062.
Williams, B.K., R.C. Szaro, and C.D. Shapiro. 2009. Adaptive management: the U.S. Department of the Interior technical guide. Adaptive Management Working Group, U.S. Department of the Interior, Washington, DC.
Wood, K.R. and P. Bily. 2008. Vegetation description of a nesting site for Newell’s Shearwater (Puffinus
auricularis newelli), Pi`ina`au Stream, East Maui, Hawaii. `Elepaio 68: 63 – 66.
Worthington, D.V. 1998. Inter-island dispersal of the Mariana common Moorhen: a recolonization by an endangered species. Wilson Bulletin 110: 414 – 417.
FINAL HABITAT CONSERVATION PLAN
Na Pua Makani Wind Energy Project 96
Young, D.P. Jr., S. Nomani, W. Tidhar, and K. Bay. 2011. NedPower Mount Storm Wind Energy Facility, Post-construction avian and bat monitoring: July – October 2010. Prepared for NedPower Mount Storm, LLC, Houston, Texas. Prepared by Western EcoSystems Technology (WEST), Inc., Cheyenne, Wyoming.
Zimpfer, J. and F. Bonaccorso. 2010. Barbed wire fences and Hawaiian hoary bats: what we know. Hawaii Conservation Conference August 4 – 6, 2010. Honolulu, HI.

FINAL HABITAT CONSERVATION PLAN
Na Pua Makani Wind Energy Project
Appendices

FINAL HABITAT CONSERVATION PLAN
Na Pua Makani Wind Energy Project
This page intentionally left blank
FINAL HABITAT CONSERVATION PLAN
Na Pua Makani Wind Energy Project
Appendix A: Post-construction Monitoring Plan

FINAL HABITAT CONSERVATION PLAN
Na Pua Makani Wind Energy Project
This page intentionally left blank
NA PUA MAKANI
WIND ENERGY PROJECT
POST-CONSTRUCTION MONITORING PLAN
Prepared for
Na Pua Makani Power Partners, LLC
Prepared by
Tetra Tech Inc.
November 2015

This page intentionally left blank
Na Pua Makani Wind Energy Project Post-Construction Monitoring Plan
i
TABLE OF CONTENTS
PAGE
1.0 INTRODUCTION ............................................................................................................................... 1
2.0 APPROACH TO FATALITY MONITORING ............................................................................ 1
3.0 STANDARDIZED CARCASS SEARCHES .................................................................................. 2 3.1 Search Methods ......................................................................................................................... 3
3.1.1 Search Interval and Definition of Seasons ................................................................ 3 3.1.2 Search Plot Size ............................................................................................................. 3 3.1.3 Field Methods ................................................................................................................ 4
3.2 Delineation of Searchable Areas and Vegetation Conditions ............................................. 5 3.3 Carcass Persistence .................................................................................................................... 8
3.3.1 Field Trials ...................................................................................................................... 8 3.3.2 Analysis ........................................................................................................................... 9
3.4 Searcher Efficiency Trials ......................................................................................................... 9 3.4.1 Field Trials .................................................................................................................... 10 3.4.2 Analysis ......................................................................................................................... 10
3.5 Adjusted Take Calculation ..................................................................................................... 11
4.0 INTERIM OPERATIONAL MONITORING ............................................................................ 12
5.0 OTHER PERMITS ............................................................................................................................ 13
6.0 WILDLIFE EDUCATION AND INCIDENTAL REPORTING PROGRAM ................... 13
7.0 ADAPTIVE MANAGEMENT OF THE PCMP ......................................................................... 14
8.0 ANNUAL REPORT .......................................................................................................................... 15
9.0 REFERENCES ................................................................................................................................... 16
Na Pua Makani Wind Energy Project Post-Construction Monitoring Plan
ii
LIST OF FIGURES
Figure 1. Example hypothetical search plot with 50 and 75 percent MBTH areas .......................... 4
Figure 2. Preliminary post-construction search plots ............................................................................ 7
LIST OF TABLES
Table 2-1. Schedule of post-construction monitoring over the 21-year ITP and ITL term .............. 2
LIST OF APPENDICES
Appendix A. Joint Agency Downed Wildlife Protocol
Na Pua Makani Wind Energy Project Post-Construction Monitoring Plan
1
1.0 INTRODUCTION
Na Pua Makani Power Partners, LLC (Na Pua Makani Power Partners) has developed a post-construction monitoring plan (PCMP) to document incidental take of Covered Species at the Na Pua Makani Wind Energy Project (Project). Estimated Project-related take is used to ensure compliance with the authorized take limits set forth under the U.S. Fish and Wildlife Service (USFWS) incidental take permit (ITP) and the Hawaii Department of Land and Natural Resources, Division of Forestry and Wildlife (DOFAW) incidental take license (ITL), as outlined in the Habitat Conservation Plan (HCP; Tetra Tech 2015). Covered Species include the Hawaiian hoary bat, Newell’s shearwater, Hawaiian goose, Hawaiian duck, Hawaiian coot, Hawaiian moorhen, Hawaiian stilt, and Hawaiian short-eared owl. Although the PCMP is designed around the detection of Covered Species, all avian and bat fatalities will be recorded.
2.0 APPROACH TO FATALITY MONITORING
Na Pua Makani Power Partners proposes a long-term monitoring approach consisting of standardized carcass searches alternating with interim monitoring at Project WTGs (Table 2-1). Standardized searches including bias trials will be used to estimate the take of Covered Species. Interim monitoring will be used to ensure that years without standardized searches are reflective of an average fatality year. Using the information provided from each type of monitoring, Na Pua Makani Power Partners will track estimated take, which may be zero, throughout the life of the Project. The take estimates will be measured against the authorized take levels to ensure compliance with the HCP and will provide Na Pua Makani Power Partners with information relevant to the required timing of implementation of tiers of bat mitigation; this will provide for timely planning for implementation of the next tier of mitigation. This approach may be adaptively managed to improve the effectiveness and efficiency of the post-construction mortality monitoring program in a cost-effective and logistically feasible manner by using monitoring results, new science, or new methods for post-construction monitoring. Any such changes would require review and approval from USFWS and DOFAW (see Section 7.0).
A three-year period of standardized carcass searches will be initiated upon the start of commercial operations (Section 3.0). Na Pua Power Partners assumes that the surveys conducted during the first three-year period will provide sufficient data to adequately describe fatality levels and the spatial and temporal trends in fatalities within the wind farm. Na Pua Makani Power Partners will consult with the USFWS and DOFAW before transitioning to the initial interim monitoring period, and the timing of future standardized searches may be adaptively managed in consultation with USFWS and DOFAW based on information developed through post-construction morality monitoring (see Section 7.0). This period will be followed by a four-year period of interim monitoring (Section 4.0). After the initial set of standardized and interim searches, 2-year standardized search periods will be followed by 4 – 5 year interim monitoring periods for the remainder of the permit term (Table 2-1).
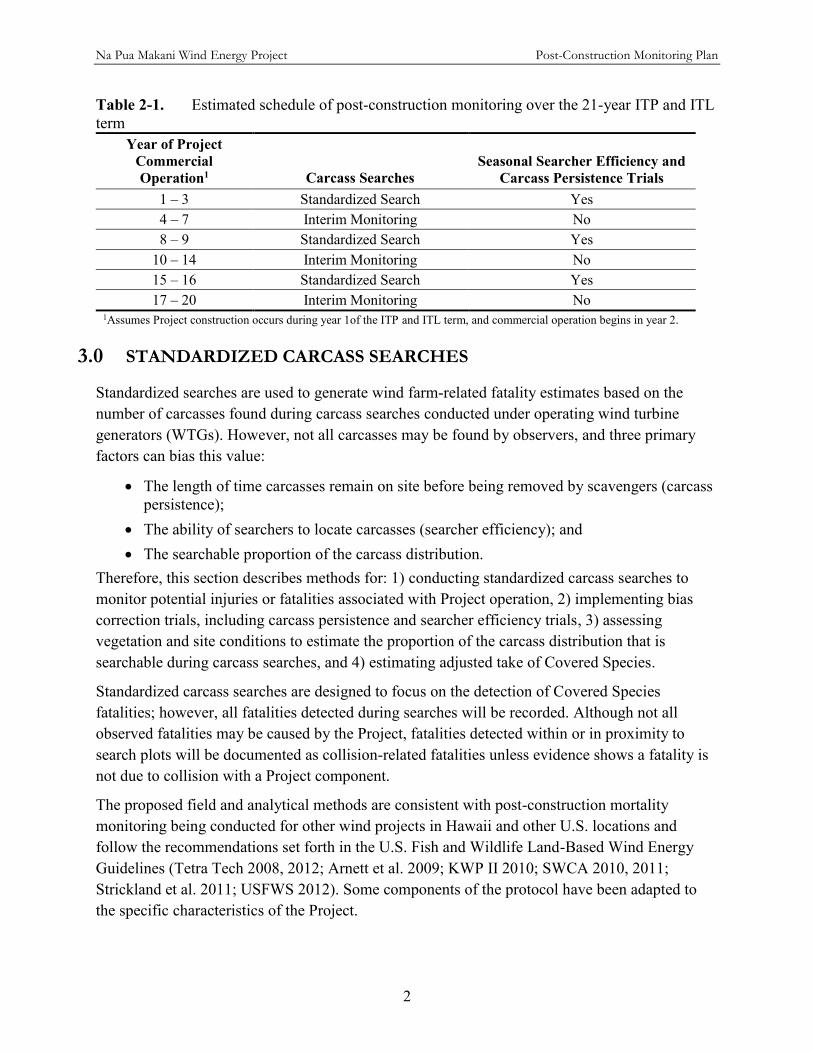
Na Pua Makani Wind Energy Project Post-Construction Monitoring Plan
2
Table 2-1. Estimated schedule of post-construction monitoring over the 21-year ITP and ITL term
Year of Project Commercial Operation1 Carcass Searches
Seasonal Searcher Efficiency and Carcass Persistence Trials
1 – 3 Standardized Search Yes 4 – 7 Interim Monitoring No 8 – 9 Standardized Search Yes
10 – 14 Interim Monitoring No 15 – 16 Standardized Search Yes 17 – 20 Interim Monitoring No
1Assumes Project construction occurs during year 1of the ITP and ITL term, and commercial operation begins in year 2.
3.0 STANDARDIZED CARCASS SEARCHES
Standardized searches are used to generate wind farm-related fatality estimates based on the number of carcasses found during carcass searches conducted under operating wind turbine generators (WTGs). However, not all carcasses may be found by observers, and three primary factors can bias this value:
The length of time carcasses remain on site before being removed by scavengers (carcass persistence);
The ability of searchers to locate carcasses (searcher efficiency); and The searchable proportion of the carcass distribution.
Therefore, this section describes methods for: 1) conducting standardized carcass searches to monitor potential injuries or fatalities associated with Project operation, 2) implementing bias correction trials, including carcass persistence and searcher efficiency trials, 3) assessing vegetation and site conditions to estimate the proportion of the carcass distribution that is searchable during carcass searches, and 4) estimating adjusted take of Covered Species.
Standardized carcass searches are designed to focus on the detection of Covered Species fatalities; however, all fatalities detected during searches will be recorded. Although not all observed fatalities may be caused by the Project, fatalities detected within or in proximity to search plots will be documented as collision-related fatalities unless evidence shows a fatality is not due to collision with a Project component.
The proposed field and analytical methods are consistent with post-construction mortality monitoring being conducted for other wind projects in Hawaii and other U.S. locations and follow the recommendations set forth in the U.S. Fish and Wildlife Land-Based Wind Energy Guidelines (Tetra Tech 2008, 2012; Arnett et al. 2009; KWP II 2010; SWCA 2010, 2011; Strickland et al. 2011; USFWS 2012). Some components of the protocol have been adapted to the specific characteristics of the Project.
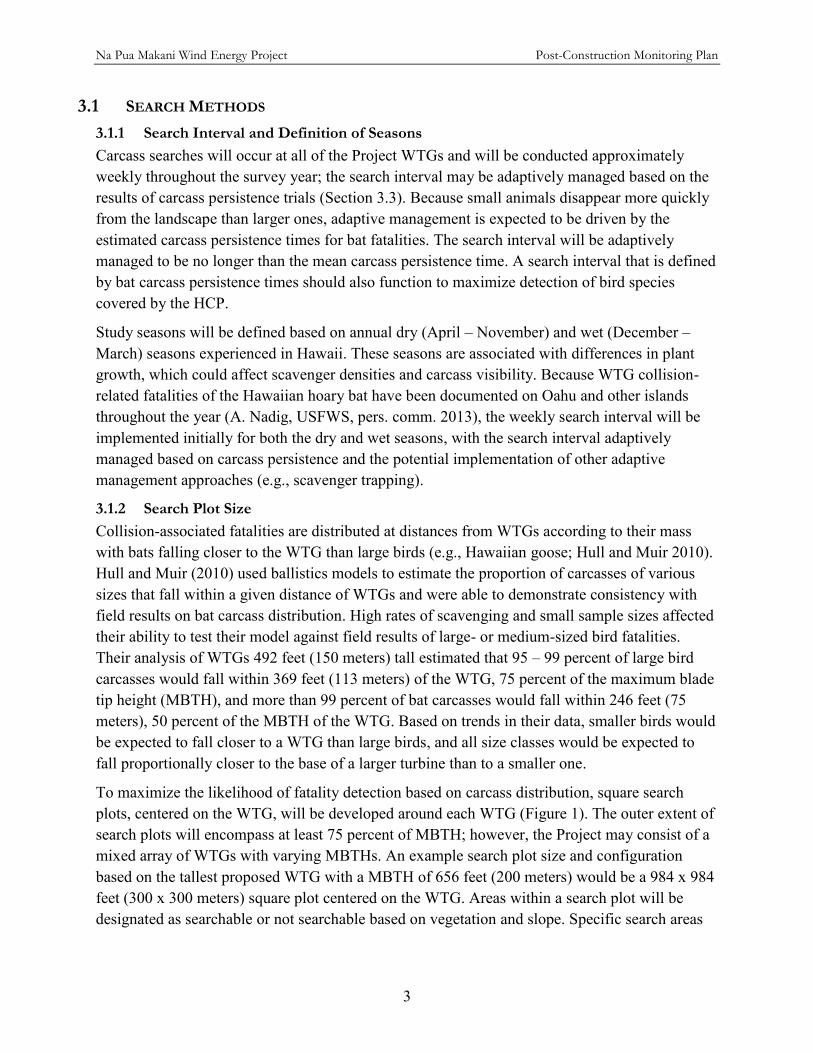
Na Pua Makani Wind Energy Project Post-Construction Monitoring Plan
3
3.1 SEARCH METHODS
3.1.1 Search Interval and Definition of Seasons
Carcass searches will occur at all of the Project WTGs and will be conducted approximately weekly throughout the survey year; the search interval may be adaptively managed based on the results of carcass persistence trials (Section 3.3). Because small animals disappear more quickly from the landscape than larger ones, adaptive management is expected to be driven by the estimated carcass persistence times for bat fatalities. The search interval will be adaptively managed to be no longer than the mean carcass persistence time. A search interval that is defined by bat carcass persistence times should also function to maximize detection of bird species covered by the HCP.
Study seasons will be defined based on annual dry (April – November) and wet (December – March) seasons experienced in Hawaii. These seasons are associated with differences in plant growth, which could affect scavenger densities and carcass visibility. Because WTG collision-related fatalities of the Hawaiian hoary bat have been documented on Oahu and other islands throughout the year (A. Nadig, USFWS, pers. comm. 2013), the weekly search interval will be implemented initially for both the dry and wet seasons, with the search interval adaptively managed based on carcass persistence and the potential implementation of other adaptive management approaches (e.g., scavenger trapping).
3.1.2 Search Plot Size
Collision-associated fatalities are distributed at distances from WTGs according to their mass with bats falling closer to the WTG than large birds (e.g., Hawaiian goose; Hull and Muir 2010). Hull and Muir (2010) used ballistics models to estimate the proportion of carcasses of various sizes that fall within a given distance of WTGs and were able to demonstrate consistency with field results on bat carcass distribution. High rates of scavenging and small sample sizes affected their ability to test their model against field results of large- or medium-sized bird fatalities. Their analysis of WTGs 492 feet (150 meters) tall estimated that 95 – 99 percent of large bird carcasses would fall within 369 feet (113 meters) of the WTG, 75 percent of the maximum blade tip height (MBTH), and more than 99 percent of bat carcasses would fall within 246 feet (75 meters), 50 percent of the MBTH of the WTG. Based on trends in their data, smaller birds would be expected to fall closer to a WTG than large birds, and all size classes would be expected to fall proportionally closer to the base of a larger turbine than to a smaller one.
To maximize the likelihood of fatality detection based on carcass distribution, square search plots, centered on the WTG, will be developed around each WTG (Figure 1). The outer extent of search plots will encompass at least 75 percent of MBTH; however, the Project may consist of a mixed array of WTGs with varying MBTHs. An example search plot size and configuration based on the tallest proposed WTG with a MBTH of 656 feet (200 meters) would be a 984 x 984 feet (300 x 300 meters) square plot centered on the WTG. Areas within a search plot will be designated as searchable or not searchable based on vegetation and slope. Specific search areas
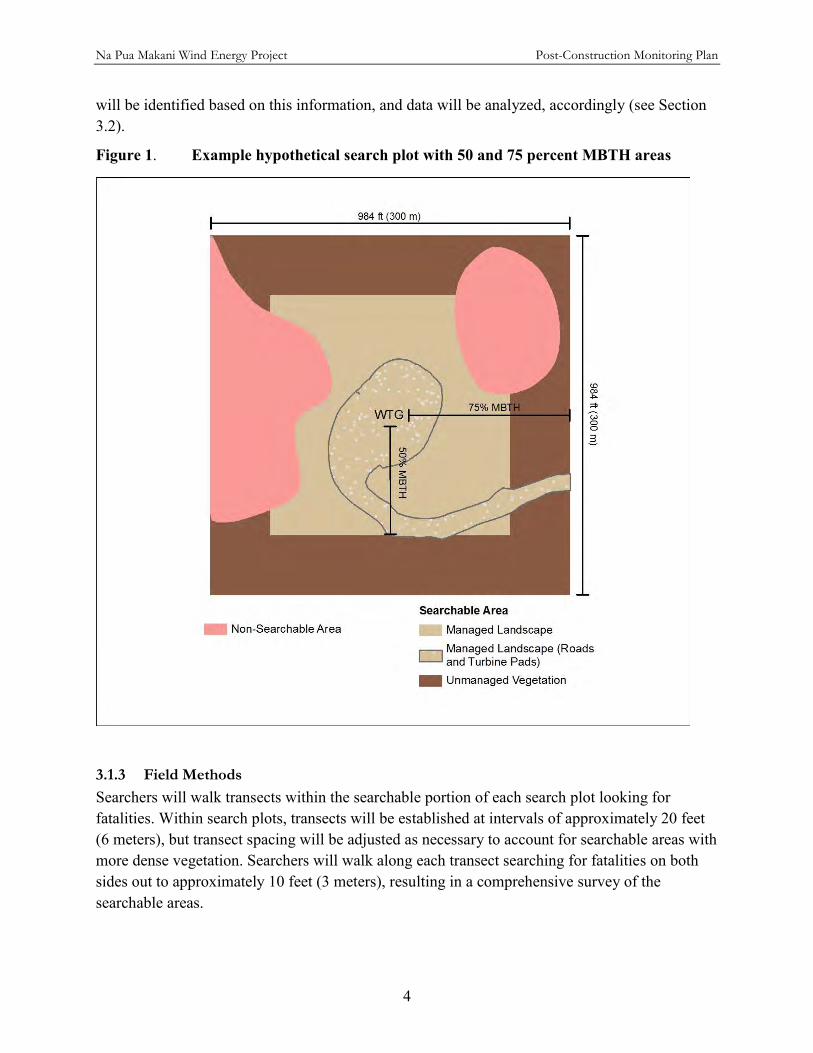
Na Pua Makani Wind Energy Project Post-Construction Monitoring Plan
4
will be identified based on this information, and data will be analyzed, accordingly (see Section 3.2).
Figure 1. Example hypothetical search plot with 50 and 75 percent MBTH areas
3.1.3 Field Methods
Searchers will walk transects within the searchable portion of each search plot looking for fatalities. Within search plots, transects will be established at intervals of approximately 20 feet (6 meters), but transect spacing will be adjusted as necessary to account for searchable areas with more dense vegetation. Searchers will walk along each transect searching for fatalities on both sides out to approximately 10 feet (3 meters), resulting in a comprehensive survey of the searchable areas.
Na Pua Makani Wind Energy Project Post-Construction Monitoring Plan
5
Documentation of Turbine-related Fatalities All carcasses found during standardized carcass searches will be labeled with a unique number, and searchers will record information as described in the joint agency downed wildlife protocol (Downed Wildlife Protocol; DOFAW and USFWS 2014; Appendix A). This information includes: date and time observed; location (GPS coordinate and distance/direction from the closest WTG); habitat (managed landscape or unmanaged vegetation); weather information; a description of the carcass condition; to the extent possible, species, sex, and age; any comments relating to field observations associated with the potential cause of death or condition of the carcass; and a description of actions taken by the observer.
A series of photographs will be taken for all fatalities. Photographs will include in-situ photos documenting the fatality as found and, if permits are in place, a series of ex-situ photographs that will highlight any distinguishing characteristics which may be useful in identification. If a carcass is removed from the field, a copy of the field data will be kept in a separate bag with the carcass at all times. Following a search day, searchers will complete a summary, reporting: names of the searchers, date, fatalities found, and WTGs searched.
Searchers may discover bird or bat carcasses incidental to formal carcass searches (e.g., outside of regularly scheduled search times or outside of designated search areas). For each incidentally discovered bird or bat carcass, the searcher will identify, photograph, and record data using the same protocol used for carcasses found during formal scheduled searches. Such carcasses, however, would be coded as incidental discoveries.
Reporting Protocol and Collection Procedures
Downed birds or Hawaiian hoary bats may be found dead or injured during standardized searches or incidentally. The observer will report any bird or bat fatality to the approved agency contacts via e-mail or by phone as described in the Downed Wildlife Protocol (DOFAW and USFWS 2014). Fatalities will also be documented in the HCP annual report (Section 8.0).
The final disposition of any carcasses collected will be based on the Downed Wildlife Protocol and input from designated agency representatives (DOFAW and USFWS 2014). If collection permits are obtained, carcasses of non-listed species may be collected and used for searcher efficiency and/or carcass persistence trials, or disposed of at an approved location, as directed by applicable permits (Section 5.0).
3.2 DELINEATION OF SEARCHABLE AREAS AND VEGETATION CONDITIONS
The amount of searchable area and the ability of searchers to find fatalities under different vegetation types will influence the proportion of the fatalities that can be detected (Huso 2011). Specifically, topography and vegetation provide challenges to finding fatalities, particularly of bats. Therefore, global positioning system (GPS) will be used to physically delineate the boundaries of the searchable area within each search plot. Within each plot, an interior square representing 50 percent of the MBTH (656 x 656 feet [200 x 200 meters] in the 656-foot (200-meter) MBTH WTG example, where the bulk of all bat fatalities are expected to occur, will be
Na Pua Makani Wind Energy Project Post-Construction Monitoring Plan
6
designated for landscape management to facilitate locating carcasses (Figures 1 – 2). Within this area, Na Pua Makani Power Partners proposes to do minor earthwork, clearing, and manage vegetation, where practicable and permitted, based on topography, current land use, logistics, and cost. The remainder of the search plot will be searched to the extent possible based on the existing landscape and vegetation.
Search plots will be delineated according to the following parameters: Searchable Managed Landscape
o All cleared, graded areas, consisting of roads and variably sized WTG pads formed of compacted gravel with little or no growing vegetation.
o Portions of the 50 percent MBTH search area that can be practicably maintained for searching through mowing or other means. Practicable landscape management will be confined to areas with a slope of approximately less than 15 percent and without landowner constraints.
o The actual areas of searchable managed landscape will be delineated in the field. Searchable Unmanaged Vegetation
o Areas where the existing vegetation allows searchers a reasonable opportunity to observe a large bird fatality.
o Located in the area between the 50 percent and 75 percent MBTH search plot. o No active vegetation management will occur within these areas. o The actual areas of searchable unmanaged vegetation will be delineated in the
field. Non-Searchable Areas
o Areas within 50 percent of the MBTH where it would not be practicable to maintain low-growing vegetation.
o Areas between 50 percent and 75 percent of the MBTH where large bird fatalities are unlikely to be observed based on topography and/or vegetation.
An example hypothetical search plot and preliminary post-construction search plots for the Project showing 50 percent and 75 percent MBTH with areas of managed landscape and unmanaged vegetation are depicted in Figures 1 and 2, respectively.
The proportion of the carcass distribution to be searched at the Project was estimated through a desktop analysis using: 1) scaled estimates of carcass distribution from Hull and Muir (2010) using carcass distribution based on the percent of the MBTH for large turbines; 2) aerial photo interpretation of vegetation and agricultural use within the search plots described above; 3) preliminary design describing Project infrastructure and grading; and 4) topography. Based on this analysis, Na Pua Makani Power Partners anticipates searching 87 percent of the distribution of potential bat carcasses and 62 percent of the distribution of potential listed bird species carcasses at the Project. These estimates will be updated to reflect values based on the Project as it is constructed.
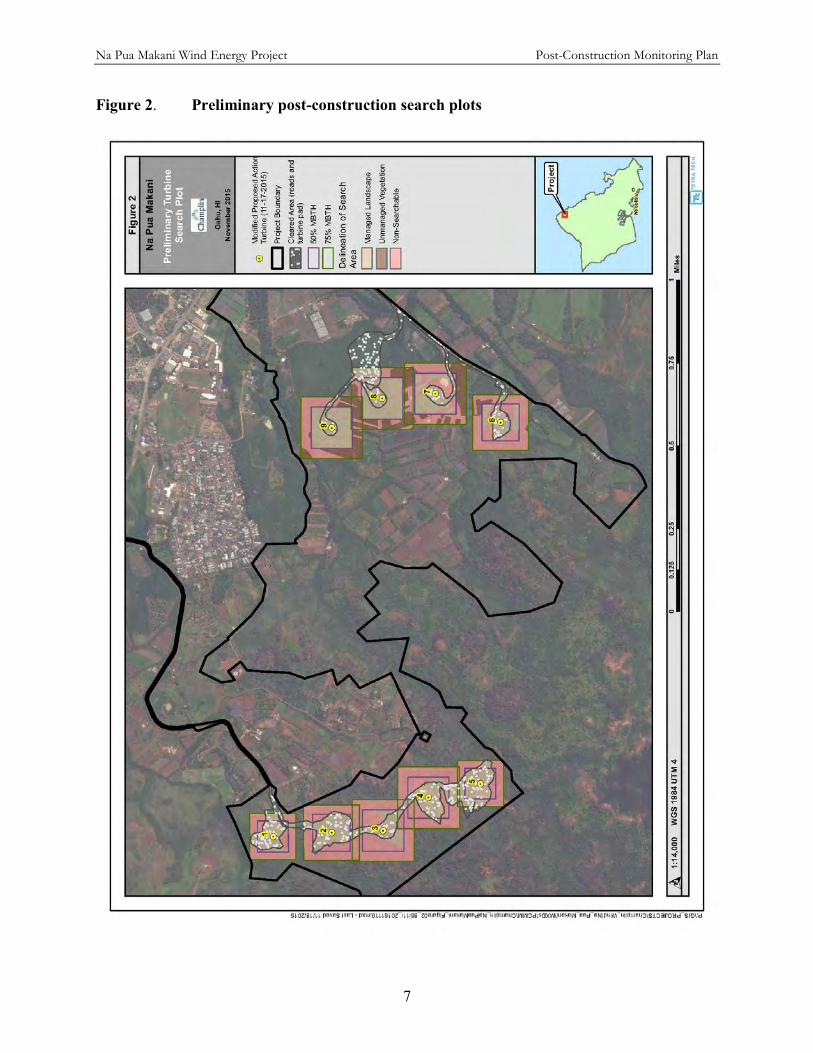
Na Pua Makani Wind Energy Project Post-Construction Monitoring Plan
7
Figure 2. Preliminary post-construction search plots
Na Pua Makani Wind Energy Project Post-Construction Monitoring Plan
8
3.3 CARCASS PERSISTENCE
The objective of carcass persistence trials is to document the length of time carcasses persist in the search area before removal and thus are available to be found by searchers. If sample size allows, these data are then used to provide an adjustment for study bias introduced by sources of carcass removal (e.g., scavengers). Additionally, the length of time carcasses persist helps determine the frequency with which carcass searches should be conducted, with the goal of maximizing the probability that a fatality will be available to be found by a searcher. Possible differences in carcass persistence rates due to season or carcass size will be taken into account when evaluating the effect of carcass persistence rates on fatality estimates (Sections 3.3.2 and 3.5).
3.3.1 Field Trials
Carcasses used in the trials will be selected to represent the range of sizes found among the Covered Species, with species selection ultimately determined by availability. For the Newell’s Shearwater, Hawaiian coot, Hawaiian moorhen, Hawaiian stilt, Hawaiian duck, Hawaiian goose, and Hawaiian short-eared owl, carcasses may include legally obtained seabirds (e.g., wedge-tailed shearwaters), if available; otherwise, surrogates for these species could include commercially and locally available adult game birds or cryptically colored chickens. Surrogates will also be used to simulate bat carcasses. Research by Hale and Karsten (2010) found that bats persisted on average 3 days longer than mice, which are often used as surrogates for bats in field trials, and shorter persistence times for these rodents resulted in an upward bias of fatality estimates. Although such a bias could result from the use of rats as surrogates for bats, for consistency with other post-construction mortality studies in Hawaii, carcasses of small dark-colored rats will be used to simulate bats, as practicable; however, the types of carcasses used as surrogates may be adaptively managed to meet sample size requirements or if conditions change.
Carcass persistence trials will be conducted as part of post-construction monitoring efforts during all years standardized carcass searches are conducted (Table 2-1). Two carcass persistence trials will be conducted per season with approximately 20 carcasses of each type (bird or bat surrogate) placed per trial, depending on carcass availability. This seasonal sample size results in a goal of 80 trial carcasses used in carcass persistence trials for an entire year, depending on carcass availability. The trials will be spaced out within each survey season to capture the potential effects of varying weather, vegetation conditions, and scavenger densities. The resulting carcass persistence data will be incorporated into the estimation of adjusted take.
Carcass persistence trial carcasses will be placed at stratified random locations within the Project searchable areas to account for potential differences between areas where vegetation is managed and those where it is not. Prior to initiating the trial, a set of stratified random locations will be generated to determine the location of trial carcasses. These locations will subsequently be loaded into a GPS as waypoints to allow the accurate placement of the carcasses by field personnel. Each trial carcass will be discreetly marked with a small tag so that it can be identified
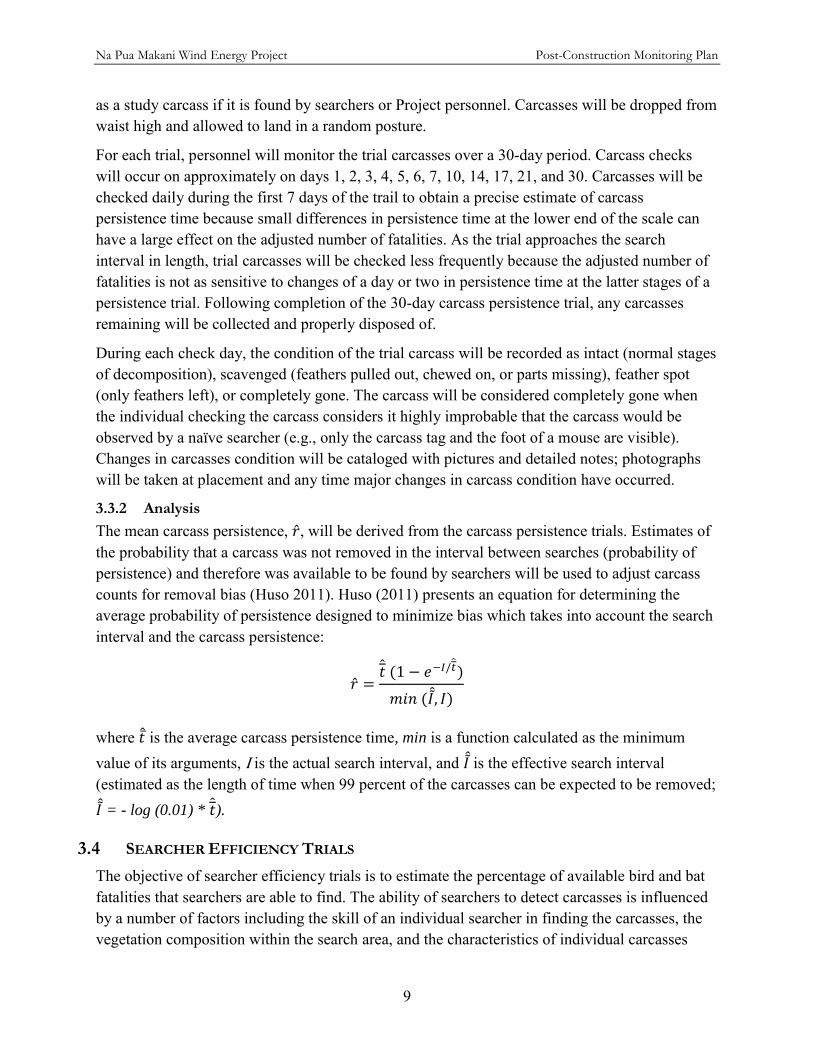
Na Pua Makani Wind Energy Project Post-Construction Monitoring Plan
9
as a study carcass if it is found by searchers or Project personnel. Carcasses will be dropped from waist high and allowed to land in a random posture.
For each trial, personnel will monitor the trial carcasses over a 30-day period. Carcass checks will occur on approximately on days 1, 2, 3, 4, 5, 6, 7, 10, 14, 17, 21, and 30. Carcasses will be checked daily during the first 7 days of the trail to obtain a precise estimate of carcass persistence time because small differences in persistence time at the lower end of the scale can have a large effect on the adjusted number of fatalities. As the trial approaches the search interval in length, trial carcasses will be checked less frequently because the adjusted number of fatalities is not as sensitive to changes of a day or two in persistence time at the latter stages of a persistence trial. Following completion of the 30-day carcass persistence trial, any carcasses remaining will be collected and properly disposed of.
During each check day, the condition of the trial carcass will be recorded as intact (normal stages of decomposition), scavenged (feathers pulled out, chewed on, or parts missing), feather spot (only feathers left), or completely gone. The carcass will be considered completely gone when the individual checking the carcass considers it highly improbable that the carcass would be observed by a naïve searcher (e.g., only the carcass tag and the foot of a mouse are visible). Changes in carcasses condition will be cataloged with pictures and detailed notes; photographs will be taken at placement and any time major changes in carcass condition have occurred.
3.3.2 Analysis
The mean carcass persistence, �̂�, will be derived from the carcass persistence trials. Estimates of the probability that a carcass was not removed in the interval between searches (probability of persistence) and therefore was available to be found by searchers will be used to adjust carcass counts for removal bias (Huso 2011). Huso (2011) presents an equation for determining the average probability of persistence designed to minimize bias which takes into account the search interval and the carcass persistence:
�̂� =�̂� (1 − 𝑒−𝐼/�̂�)
𝑚𝑖𝑛 (𝐼, 𝐼)
where 𝑡̅̂ is the average carcass persistence time, min is a function calculated as the minimum value of its arguments, I is the actual search interval, and 𝐼 is the effective search interval (estimated as the length of time when 99 percent of the carcasses can be expected to be removed; 𝐼 = - log (0.01) * �̂�).
3.4 SEARCHER EFFICIENCY TRIALS
The objective of searcher efficiency trials is to estimate the percentage of available bird and bat fatalities that searchers are able to find. The ability of searchers to detect carcasses is influenced by a number of factors including the skill of an individual searcher in finding the carcasses, the vegetation composition within the search area, and the characteristics of individual carcasses
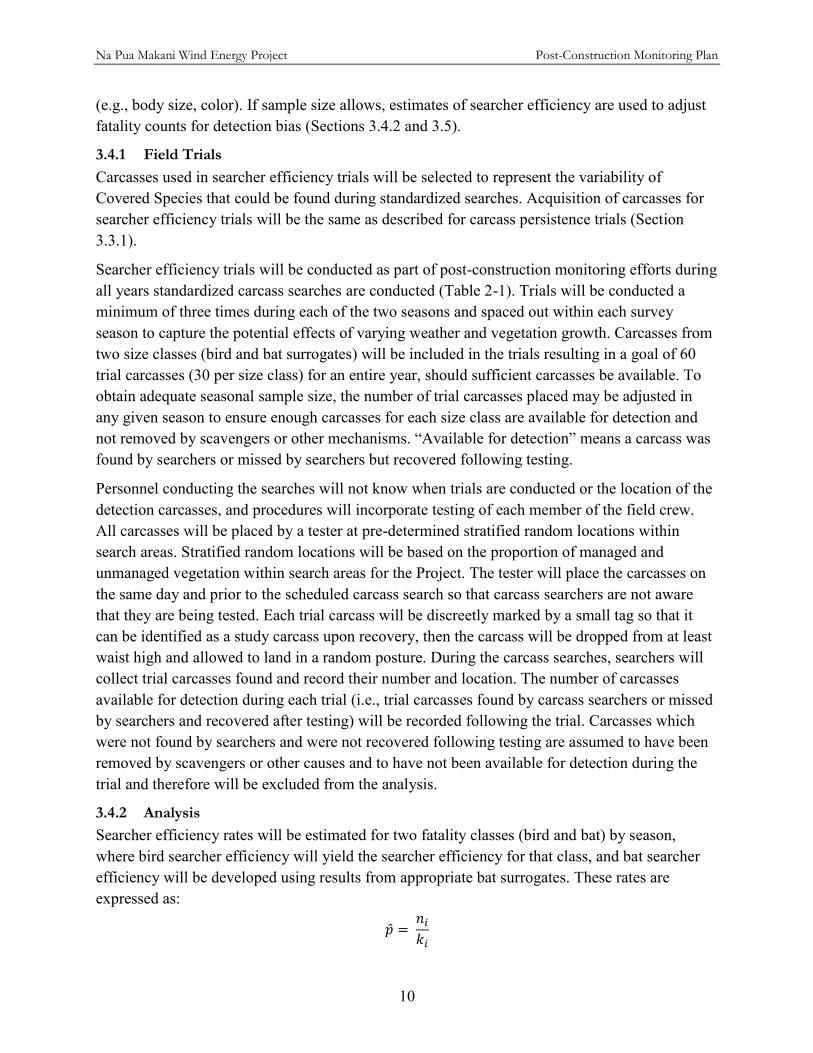
Na Pua Makani Wind Energy Project Post-Construction Monitoring Plan
10
(e.g., body size, color). If sample size allows, estimates of searcher efficiency are used to adjust fatality counts for detection bias (Sections 3.4.2 and 3.5).
3.4.1 Field Trials
Carcasses used in searcher efficiency trials will be selected to represent the variability of Covered Species that could be found during standardized searches. Acquisition of carcasses for searcher efficiency trials will be the same as described for carcass persistence trials (Section 3.3.1).
Searcher efficiency trials will be conducted as part of post-construction monitoring efforts during all years standardized carcass searches are conducted (Table 2-1). Trials will be conducted a minimum of three times during each of the two seasons and spaced out within each survey season to capture the potential effects of varying weather and vegetation growth. Carcasses from two size classes (bird and bat surrogates) will be included in the trials resulting in a goal of 60 trial carcasses (30 per size class) for an entire year, should sufficient carcasses be available. To obtain adequate seasonal sample size, the number of trial carcasses placed may be adjusted in any given season to ensure enough carcasses for each size class are available for detection and not removed by scavengers or other mechanisms. “Available for detection” means a carcass was found by searchers or missed by searchers but recovered following testing.
Personnel conducting the searches will not know when trials are conducted or the location of the detection carcasses, and procedures will incorporate testing of each member of the field crew. All carcasses will be placed by a tester at pre-determined stratified random locations within search areas. Stratified random locations will be based on the proportion of managed and unmanaged vegetation within search areas for the Project. The tester will place the carcasses on the same day and prior to the scheduled carcass search so that carcass searchers are not aware that they are being tested. Each trial carcass will be discreetly marked by a small tag so that it can be identified as a study carcass upon recovery, then the carcass will be dropped from at least waist high and allowed to land in a random posture. During the carcass searches, searchers will collect trial carcasses found and record their number and location. The number of carcasses available for detection during each trial (i.e., trial carcasses found by carcass searchers or missed by searchers and recovered after testing) will be recorded following the trial. Carcasses which were not found by searchers and were not recovered following testing are assumed to have been removed by scavengers or other causes and to have not been available for detection during the trial and therefore will be excluded from the analysis.
3.4.2 Analysis
Searcher efficiency rates will be estimated for two fatality classes (bird and bat) by season, where bird searcher efficiency will yield the searcher efficiency for that class, and bat searcher efficiency will be developed using results from appropriate bat surrogates. These rates are expressed as:
�̂� = 𝑛𝑖
𝑘𝑖
Na Pua Makani Wind Energy Project Post-Construction Monitoring Plan
11
Where ni is the number of trial carcasses found for the ith carcass category, ki is the number of trial carcasses placed for the ith carcass category that are recovered at the end of the trial (i.e. available to be found). The estimated proportion of trial carcasses that are detected by searchers in the searcher efficiency trials, �̂�, will be used to adjust fatality counts for detection bias, if sample size allows.
3.5 ADJUSTED TAKE CALCULATION
Take of Covered Species will be estimated by using statistical models that adjust for detection bias inherent in mortality monitoring. Specifically, the calculation of adjusted take will incorporate observed fatalities of Covered Species documented during standardized carcasses searches. The number of observed fatalities will then be adjusted through fatality modeling to account for searcher efficiency and carcass persistence and results will be interpreted in the context of ITP and ITL compliance as well as the potential for the Project to be approaching a tier of take threshold for Hawaiian hoary bats. Models used will take into account:
Search interval; Proportion of WTGs included in the study; Searchable area around each WTG and its relationship to the expected distribution of
carcasses occurring as a result of collision with the WTG; Observed number of carcasses found during standardized searches during the monitoring
year for which the cause of death is assumed to be attributable to facility operation; Carcass persistence; and Searcher efficiency.
There have been many recent advances in post-construction monitoring techniques and fatality rate estimates, and there are a number of estimators available for calculating fatality rates as well as statistical tools used to measure the probability that rare events do not exceed certain thresholds (evidence of absence models). The estimators use different methods to account for unobserved mortality, with some estimators treating searcher efficiency and carcass persistence as separate factors and others treating them as interrelated (e.g., Shoenfeld 2004; Jain et al. 2007; Good et al. 2011; Huso 2011, Warren-Hicks et al. 2013). Evidence of absence models also vary in their assumptions and data collection protocols (Dalthorp et al. 2014, Péron and Hines 2014).
The estimator developed by Huso (2011) is expected to be used, provided sample size is sufficient. Huso’s 2011 estimator improves on other approaches by reducing inherent biases in the data and allowing the user to account for variable search ability (e.g., based on vegetation types or non-searchable areas) within the search plot, and actual area searched. To provide a robust estimate, the Huso (2011) estimator requires a minimum sample size of 5 fatalities per category for which an estimate will be produced (e.g., 5 Hawaiian hoary bat fatalities observed during a season; M, Huso, USGS, pers. comm. 2013); however, larger sample sizes may be required if searcher efficiency, carcass persistence, or the proportion of the area where carcasses are expected to fall are low.
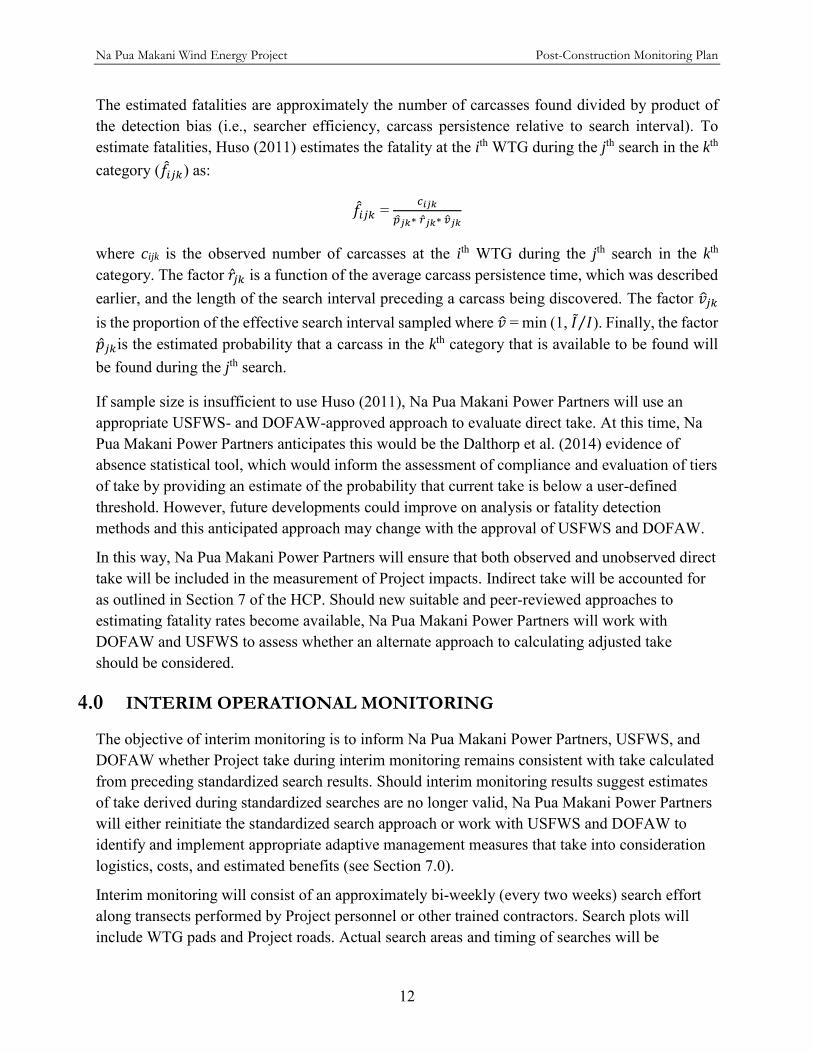
Na Pua Makani Wind Energy Project Post-Construction Monitoring Plan
12
The estimated fatalities are approximately the number of carcasses found divided by product of the detection bias (i.e., searcher efficiency, carcass persistence relative to search interval). To estimate fatalities, Huso (2011) estimates the fatality at the ith WTG during the jth search in the kth category (𝑓𝑖𝑗𝑘) as:
𝑓𝑖𝑗𝑘 = 𝑐𝑖𝑗𝑘
𝑝𝑗𝑘∗ �̂�𝑗𝑘∗ �̂�𝑗𝑘
where cijk is the observed number of carcasses at the ith WTG during the jth search in the kth
category. The factor �̂�𝑗𝑘 is a function of the average carcass persistence time, which was described earlier, and the length of the search interval preceding a carcass being discovered. The factor 𝑣𝑗𝑘 is the proportion of the effective search interval sampled where 𝑣 = min (1, 𝐼 𝐼⁄ ). Finally, the factor �̂�𝑗𝑘is the estimated probability that a carcass in the kth category that is available to be found will be found during the jth search.
If sample size is insufficient to use Huso (2011), Na Pua Makani Power Partners will use an appropriate USFWS- and DOFAW-approved approach to evaluate direct take. At this time, Na Pua Makani Power Partners anticipates this would be the Dalthorp et al. (2014) evidence of absence statistical tool, which would inform the assessment of compliance and evaluation of tiers of take by providing an estimate of the probability that current take is below a user-defined threshold. However, future developments could improve on analysis or fatality detection methods and this anticipated approach may change with the approval of USFWS and DOFAW.
In this way, Na Pua Makani Power Partners will ensure that both observed and unobserved direct take will be included in the measurement of Project impacts. Indirect take will be accounted for as outlined in Section 7 of the HCP. Should new suitable and peer-reviewed approaches to estimating fatality rates become available, Na Pua Makani Power Partners will work with DOFAW and USFWS to assess whether an alternate approach to calculating adjusted take should be considered.
4.0 INTERIM OPERATIONAL MONITORING
The objective of interim monitoring is to inform Na Pua Makani Power Partners, USFWS, and DOFAW whether Project take during interim monitoring remains consistent with take calculated from preceding standardized search results. Should interim monitoring results suggest estimates of take derived during standardized searches are no longer valid, Na Pua Makani Power Partners will either reinitiate the standardized search approach or work with USFWS and DOFAW to identify and implement appropriate adaptive management measures that take into consideration logistics, costs, and estimated benefits (see Section 7.0).
Interim monitoring will consist of an approximately bi-weekly (every two weeks) search effort along transects performed by Project personnel or other trained contractors. Search plots will include WTG pads and Project roads. Actual search areas and timing of searches will be

Na Pua Makani Wind Energy Project Post-Construction Monitoring Plan
13
adaptively managed based on results from standardized search efforts and will be developed in consultation with USFWS and DOFAW. Transects will be walked or driven slowly (< 5 miles [8 kilometers] per hour) on an ATV or similar vehicle, while the observer scans for fatalities.
Fatalities occurring during the interim monitoring period will be estimated based on the fatality rate estimate derived during the standardized monitoring period(s). If estimates during standardized monitoring periods indicate a temporal change, the most recent standardized monitoring results will be used; however, if standardized monitoring results are consistent, an average of results from all previous standardized monitoring periods will be used to derive the fatality estimate during an interim monitoring period.
Any observed fatalities or downed birds or bats would be documented and reported as described in Section 3.1.3 (Reporting Protocol and Collection Procedures). Na Pua Makani Power Partners will consult with USFWS and DOFAW during standardized searches to identify appropriate adaptive management measures and triggers for implementation during subsequent interim operational monitoring efforts.
5.0 OTHER PERMITS
Na Pua Makani Power Partners will determine whether to obtain a USFWS Special Purpose Utility Permit and a DOFAW Protected Wildlife Permit that would allow Project staff to handle and collect species protected by the MBTA. These permits would also allow for the handling of local non-releasable threatened, indigenous wildlife, and introduced wild birds. Such carcasses could be used in carcass persistence or searcher efficiency trials. If these permits are not obtained, non-protected or game species, such as chickens would be used as for carcass persistence and searcher efficiency trials.
6.0 WILDLIFE EDUCATION AND INCIDENTAL REPORTING PROGRAM
Na Pua Makani Power Partners will implement a Wildlife Education and Incidental Reporting Program for contractors and Project staff who will be working at the Project during construction and operations. The Wildlife Education and Incidental Reporting Program will facilitate incidental reporting and documentation of bird or bat fatalities that could occur outside of standardized carcass surveys. This training enables contractors and staff to identify the Covered Species that may occur in the Project site. Staff will be provided with printed reference materials that include photographs of each of the Covered Species, information on their biology and habitat requirements, threats to the species on site, and avoidance and minimization measures being taken under the HCP. Over the term of the HCP, the program will be updated as necessary.
Project staff and contractors will be responsible for awareness of wildlife activity while onsite, and responding to and treating wildlife appropriately. Personnel are prohibited from approaching wildlife, other than downed wildlife. Project personnel and contractors will be responsible for
Na Pua Makani Wind Energy Project Post-Construction Monitoring Plan
14
documenting any Project-related wildlife incidents and reporting any downed wildlife to the on-site manager. USFWS or DOFAW staff designated by the agencies will be notified and a report will be prepared for any incidental observation of a downed Covered Species (Section 3.1.3).
7.0 ADAPTIVE MANAGEMENT OF THE PCMP
The state-of-the-science analysis methods, avoidance and minimization approaches, and post-construction mortality monitoring protocols are evolving as results of post-construction mortality monitoring studies at wind energy facilities are analyzed and become publicly available. New technologies such as bat deterrents and detection devices that reduce the level of effort required to detect Covered Species fatalities may be developed and proven to be effective during the course of the 21-year permit. Post-construction mortality results may provide justification for modifying mortality monitoring protocols including either increasing or decreasing survey intensity, as well as altering the proposed schedule of standardized searches and interim monitoring periods. In order to provide a scientifically reliable and cost-effective study design, the PCMP protocols may be modified by Na Pua Makani Power Partners during the ITP and ITL 21-year permit term in consultation with and upon approval from USFWS and DOFAW.
Should Na Pua Makani Power Partners or USFWS and DOFAW identify proposed modifications to post-construction monitoring protocols, Na Pua Makani Power Partners, USFWS, and DOFAW would consult on the proposed protocol revisions. No substantial changes in the protocols would be implemented without USFWS and DOFAW approval. Modifications to post-construction monitoring protocols could include measures such as, but not limited to, adjustments in the schedule of standardized searches or search interval, adjustments in bias correction trial protocols, use of search dogs during standardized search efforts, incorporation of new state-of-the-science and peer-reviewed fatality estimation modeling, or scavenger trapping to increase carcass persistence time. For example the schedule of standardized searches could be adjusted to schedule a standardized search period to coincide with a predicted tier transition, providing greater clarity for the Na Pua Makani Power Partners, USFWS, and DOFAW on the status of Project take relative to tiers. Changes to the protocols will take into consideration whether the proposed changes are technically effective, logistically feasible, and not cost prohibitive.
The first carcass persistence trial will be initiated within approximately 1 month of the commercial operation date. In consultation with USFWS and DOFAW, Na Pua Makani Power Partners will use the results of this initial trial and subsequent trials to adaptively manage PCMP protocols such as search interval and the potential need for implementation of predator control. Approved adaptive management measures will be initiated assuming the availability of appropriate materials, if required.
Na Pua Makani Power Partners will coordinate with USFWS and DOFAW during standardized searches to identify appropriate data and measures to determine if interim operational monitoring efforts indicate take estimates derived during standardized searches are valid. Should interim
Na Pua Makani Wind Energy Project Post-Construction Monitoring Plan
15
monitoring results suggest estimates of take derived during standardized searches are no longer valid, Na Pua Makani Power Partners will either reinitiate the standardized search approach or work with USFWS and DOFAW to identify and implement appropriate USFWS- and DOFAW-approved adaptive management measures that take into consideration logistics, costs, and estimated benefits. Such adaptive management measures could include a variety of adaptations to the interim monitoring protocol such as adjusting search frequency, altering the search area, or other adaptations developed in consultation with and approved by USFWS and DOFAW.
8.0 ANNUAL REPORT
The results of the Project post-construction monitoring will be included in the HCP annual report submitted to USFWS and DOFAW. The reporting schedule is outlined in Section 7 of the HCP. The HCP annual report will include results from the preceding year of surveys including:
A summary of the results of the post-construction monitoring surveys including: o A list of Covered Species and other fatalities detected and o A map showing the distribution of fatalities;
Results of the carcass persistence trials and searcher efficiency trials; Adjusted take for Covered Species fatalities, if sample size allows, including associated
indirect take; and Recommended changes, if any, to the monitoring protocols.
Na Pua Makani Wind Energy Project Post-Construction Monitoring Plan
16
9.0 REFERENCES
Arnett, E.B. (Ed). 2005. Relationships between bats and wind turbines in Pennsylvania and West Virginia: an assessment of bat fatality search protocols, patterns of fatality, and behavioral interactions with wind turbines. A final report submitted to the Bats and Wind Energy Cooperative. Bat Conservation International. Austin, TX.
Arnett, E.B., M. Schirmacher, M.M.P. Huso and J.P. Hayes. 2009. Effectiveness of Changing Wind Turbine-Cut in Speed to Reduce Bat Fatalities at Wind Facilities. An annual report submitted to the Bats and Wind Energy Cooperative. Bat Conservation International. Austin, Texas, USA.
Erickson, W.P., J. Jeffrey, K. Kronner, and K. Bay. 2004. Stateline Wind Project wildlife monitoring annual report, results for the period July 2001 - December 2003. Technical report prepared by WEST, Inc. and submitted to FPL Energy, the Oregon Office of Energy, and the Stateline Technical Advisory Committee.
Dalthorp, Dan, M. Huso, D. Dail, and J. Kenyon. 2014, Evidence of absence software user guide: U.S. Geological Survey Data Series 881, 34 pp., http://dx.doi.org/10.3133/ds881
Good, R.E., W. Erickson, A. Merrill, S. Simon, K. Murray, K. Bay, and C. Fritchman. 2011. Bat Monitoring Studies at the Fowler Ridge Wind Energy Facility, Benton County, Indiana, April 13 – October 15, 2010. Report prepared for Fowler Ridge Wind Farm by Western EcoSystems Technology, Inc. Cheyenne, WY.
Hale, A. and K.B. Karsten. 2010. Estimating bird and bat mortality at a wind energy facility in North-central Texas. Presented at the Wind Wildlife Research Meeting VII, Lakewood Colorado. October 19 – 21, 2010.
Hull, C.L. and S. Muir. 2010. Search areas for monitoring bird and bat carcasses at wind farms using a Monte-Carlo model. Australasian Journal of Wildlife Management 17: 77 – 87.
Huso, M. 2011. An estimator of wildlife fatality from observed carcasses. Environmetrics 22:318 – 329.
Jain, A., P. Kerlinger, R. Curry, and L. Slobodnik. 2007. Annual report for the Maple Ridge Wind Power Project post-construction bird and bat fatality study—2006. Annual report prepared for PPM Energy and Horizon Energy, Curry and Kerlinger LLC, Cape May Point, NJ.
Johnson, G.D., W.P. Erickson, M.D. Strickland, M.F. Shepherd, D.A. Shepherd, and S.A. Sarappo. 2003. Mortality of bats at a large-scale wind power development at Buffalo Ridge, Minnesota. The American Midland Naturalist 150:332 – 342.
KAH (Kahuku Wind Power). 2013. Kahuku Habitat Conservation Plan Annual Report—Year 1. Prepared for First Wind Energy, LLC. 2013.
KAW (Kawailoa Wind Project). 2013. Kawailoa Habitat Conservation Plan Annual Report – Year 1. Prepared for First Wind Energy, LLC. August, 2013.
KWP II (Kaheawa Pastures Wind Energy Project II). 2010. Habitat Conservation Plan. Kaheawa Wind Power II Wind Energy Generation Facility. Ukumehame, Maui, Hawaii.
Na Pua Makani Wind Energy Project Post-Construction Monitoring Plan
17
Kerns, J., W.P. Erickson, and E.B. Arnett. 2005. Bat and bird fatality at wind energy facilities in Pennsylvania and West Virginia. Pages 24 – 95 in E.B. Arnett, (Ed.), Relationships between bats and wind turbines in Pennsylvania and West Virginia: an assessment of bat fatality search protocols, patterns of fatality, and behavioral interactions with wind turbines. A final report submitted to the Bats and Wind Energy Cooperative. Bat Conservation International. Austin, TX.
NWC (Northwest Wildlife Consultants, Inc.) and WEST, Inc. 2007. Avian and bat monitoring report for the Klondike II Wind Power Project, Sherman County, Oregon. Prepared for PPM Energy, Portland, OR.
Péron, Guillaume, and J.E. Hines. 2014. fatalityCMR—Capture-recapture software to correct raw counts of wildlife fatalities using trial experiments for carcass detection probability and persistence time: U.S. Geological Survey Techniques and Methods 7–C11, 14 p., http://dx.doi.org/10.3133/tm7C11.
Shoenfeld, P. 2004. Suggestions Regarding Avian Mortality Extrapolation. Technical memo provided to FPL Energy. West Virginia Highlands Conservancy, HC70, Box 553, Davis, WV.
Strickland, M.D., E.B. Arnett, W.P. Erickson, D.H. Johnson, G.D. Johnson, M.L., Morrison, J.A. Shaffer, and W. Warren-Hicks. 2011. Comprehensive Guide to Studying Wind Energy/Wildlife Interactions. Prepared for the National Wind Coordinating Collaborative, Washington, D.C., USA.
SWCA (SWCA Environmental Consultants). 2010. Kahuku Wind Power Habitat Conservation Plan. Kahului, Hawaii.
SWCA. 2011. Kawailoa Wind Power Final Habitat Conservation Plan. Prepared for Kawailoa Wind Power, LLC, Honolulu, HI.
Tetra Tech (Tetra Tech EC, Inc.). 2008. Final Habitat Conservation Plan for the Construction and Operation of Lanai Meteorological Towers, Lanai, Hawaii. Prepared for Castle & Cooke Resorts, LLC.
Tetra Tech (Tetra Tech, Inc.). 2012. The Auwahi Wind Farm Project, Final Habitat Conservation Plan. Document prepared for Auwahi Wind Farm LLC.
Tetra Tech. 2014. Na Pua Makani Wind Project, Draft Habitat Conservation Plan. Document prepared for Na Pua Makani Power Partners LLC.
USFWS (United States Fish and Wildlife Service). 2012. U.S. Fish and Wildlife Service Land-Based Wind Energy Guidelines. Available at http://www.fws.gov/windenergy/docs/weg_final.pdf . Accessed 1/15/2014
Warren-Hicks, W., J. Newman, R. Wolpert, B. Karas, and L. Tran. (California Wind Energy Association.) 2013. Improving methods for estimating fatality of birds and bats at wind energy facilities. California Energy Commission. Publication number: CEC-500-2012-086.
Young, D.P. Jr., Johnson, G. D., W. P. Erickson, M. D. Strickland, R. E. Good and P. Becker. 2003. Avian and bat mortality associated with the initial phase of the Foote Creek Rim Wind Power Project, Carbon County, Wyoming: November 1998 – June 2002. Tech.

Na Pua Makani Wind Energy Project Post-Construction Monitoring Plan
18
Report prepared by WEST, Inc. for Pacific Corp, Inc., SeaWest Windpower Inc., and Bureau of Land Management.

Na Pua Makani Wind Energy Project Post-Construction Monitoring Plan
Appendices

Na Pua Makani Wind Energy Project Post-Construction Monitoring Plan
This page intentionally left blank

Na Pua Makani Wind Energy Project Post-Construction Monitoring Plan
Appendix A: Joint Agency Downed Wildlife Protocol

Na Pua Makani Wind Energy Project Post-Construction Monitoring Plan
This page intentionally left blank
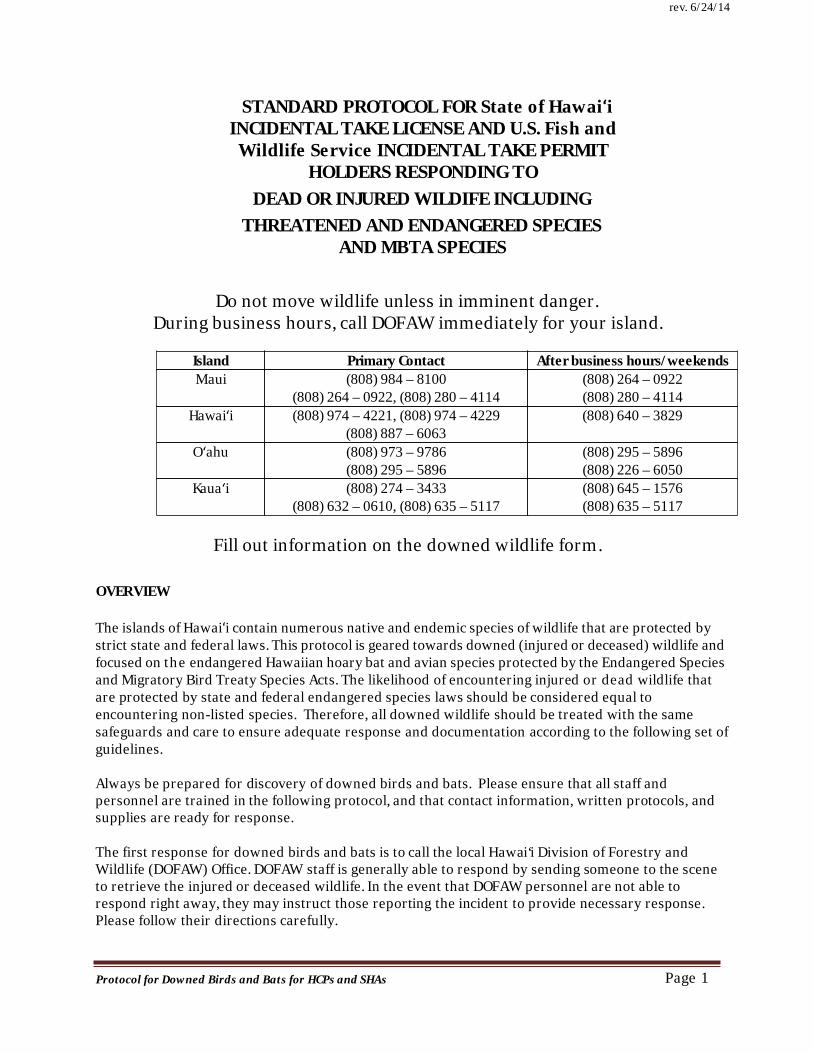
rev. 6/24/14
STANDARD PROTOCOL FOR State of HawaiʻiINCIDENTAL TAKE LICENSE AND U.S. Fish and
Wildlife Service INCIDENTAL TAKE PERMIT HOLDERS RESPONDING TO
DEAD OR INJURED WILDIFE INCLUDING THREATENED AND ENDANGERED SPECIES
AND MBTA SPECIES
Do not move wildlife unless in imminent danger. During business hours, call DOFAW immediately for your island.
Island Primary Contact After business hours/weekends Maui (808) 984 – 8100
(808) 264 – 0922, (808) 280 – 4114 (808) 264 – 0922 (808) 280 – 4114
Hawaiʻi (808) 974 – 4221, (808) 974 – 4229 (808) 887 – 6063
(808) 640 – 3829
Oʻahu (808) 973 – 9786 (808) 295 – 5896
(808) 295 – 5896 (808) 226 – 6050
Kauaʻi (808) 274 – 3433 (808) 632 – 0610, (808) 635 – 5117
(808) 645 – 1576 (808) 635 – 5117
Fill out information on the downed wildlife form.
OVERVIEW
The islands of Hawaiʻi contain numerous native and endemic species of wildlife that are protected by strict state and federal laws. This protocol is geared towards downed (injured or deceased) wildlife and focused on the endangered Hawaiian hoary bat and avian species protected by the Endangered Species and Migratory Bird Treaty Species Acts. The likelihood of encountering injured or dead wildlife that are protected by state and federal endangered species laws should be considered equal to encountering non-listed species. Therefore, all downed wildlife should be treated with the same safeguards and care to ensure adequate response and documentation according to the following set of guidelines.
Always be prepared for discovery of downed birds and bats. Please ensure that all staff and personnel are trained in the following protocol, and that contact information, written protocols, and supplies are ready for response.
The first response for downed birds and bats is to call the local Hawai‘i Division of Forestry and Wildlife (DOFAW) Office. DOFAW staff is generally able to respond by sending someone to the scene to retrieve the injured or deceased wildlife. In the event that DOFAW personnel are not able to respond right away, they may instruct those reporting the incident to provide necessary response. Please follow their directions carefully.
Protocol for Downed Birds and Bats for HCPs and SHAs Page 1
rev. 6/24/14
If DOFAW staff cannot be contacted, or if the downed animal is in imminent danger, you should be prepared to handle the animal yourself, following the protocol below, and transport them to DOFAW or a permitted wildlife rehabilitator. Again, you should only handle injured wildlife if DOFAW staff cannot be contacted or if the animal is in imminent danger.
PREPARING TO RESPOND FOR DOWNED OR INJURED BIRDS AND BATS
In all cases, ensure that all field staff is trained in the response protocol for injured birds and bats. Ensure they have read and understand the protocol, and have the protocol posted (including highlighted contact information) in a prominent location. Make sure that all staff know who to contact, and where supplies for handling injured wildlife are located. Staff should be regularly briefed on protocols, especially at the beginning of each distinct season that might correspond with a heightened likelihood of encountering downed wildlife.
At a minimum, for vehicles or foot patrols where maintaining a wildlife response kit (carrier) may be impractical, keep a copy of the protocol handy and accessible along with a large clean towel, soft cloth such as a t-shirt or flannel, several flags or tent stakes, and a pair of gloves, all of which are to be specifically designated for use in injured wildlife response.
For facilities and dedicated vehicles, please prepare and maintain one or more carriers designated for handling and transporting injured wildlife. This response kit should contain a large clean towel; soft cloth such as a t-shirt or flannel; several flags or tent stakes; several pairs of gloves (plastic/latex disposable gloves and also heavy duty gloves such as leather or heavy rubber that can be sanitized); eye protection; a ventilated cardboard box, pet carrier or other non-airtight container; and a copy of the protocol. For larger facilities (managed areas such as wildlife refuges, preserves, wetlands, or conservation areas), or areas where downed birds and bats are likely, please maintain several containers of various sizes. The container must provide enough room for the animal to comfortably move around, but also be sturdy enough to hold active birds or bats.
For small birds or bats, cardboard pet carriers or ‘living world’ plastic carriers work well as they have many ventilation holes and handles for easy carrying. Waxed pet carriers are preferred because they are sturdier, hold up longer, and can be thoroughly cleaned between uses. Sturdy cardboard boxes with holes punched in them to allow cross ventilation are also good. For birds, holes no wider than one inch in diameter should be punched on all four sides of the box. For bats, holes must be no larger than one-half inch diameter. A minimum of eight holes per side is sufficient. The carrier should be padded inside, well-ventilated and covered (to provide a sense of security).
Plastic dog kennels are recommended for handling larger birds, such as petrels, shearwaters, owls, hawks, ducks, stilts and geese. All cages must have towels or rags placed in the bottom to help prevent slipping and protect bird feet and keels. The towel or other cushioning material should be sufficient to cover the bottom of the container effectively
Cardboard boxes that are used for transporting injured wildlife should only be used once then discarded to avoid cross-contamination and/or disease or pathogen transfer. If plastic kennels or waxed pet carriers are used, be sure that they are adequately cleaned or sterilized between uses. Never put two animals in the same container.
Protocol for Downed Birds and Bats for HCPs and SHAs Page 2
rev. 6/24/14
Always wear personal protective equipment when handling downed wildlife. Disease and contamination exposure can work in both directions (bird or bat to person, and vice versa); always use protection against direct contact. If it becomes necessary to handle a bird, always wear disposable gloves. If multiple animals are being handled ensure that a new pair of gloves is used between each bird.
Protocol for Downed Birds and Bats for HCPs and SHAs Page 3
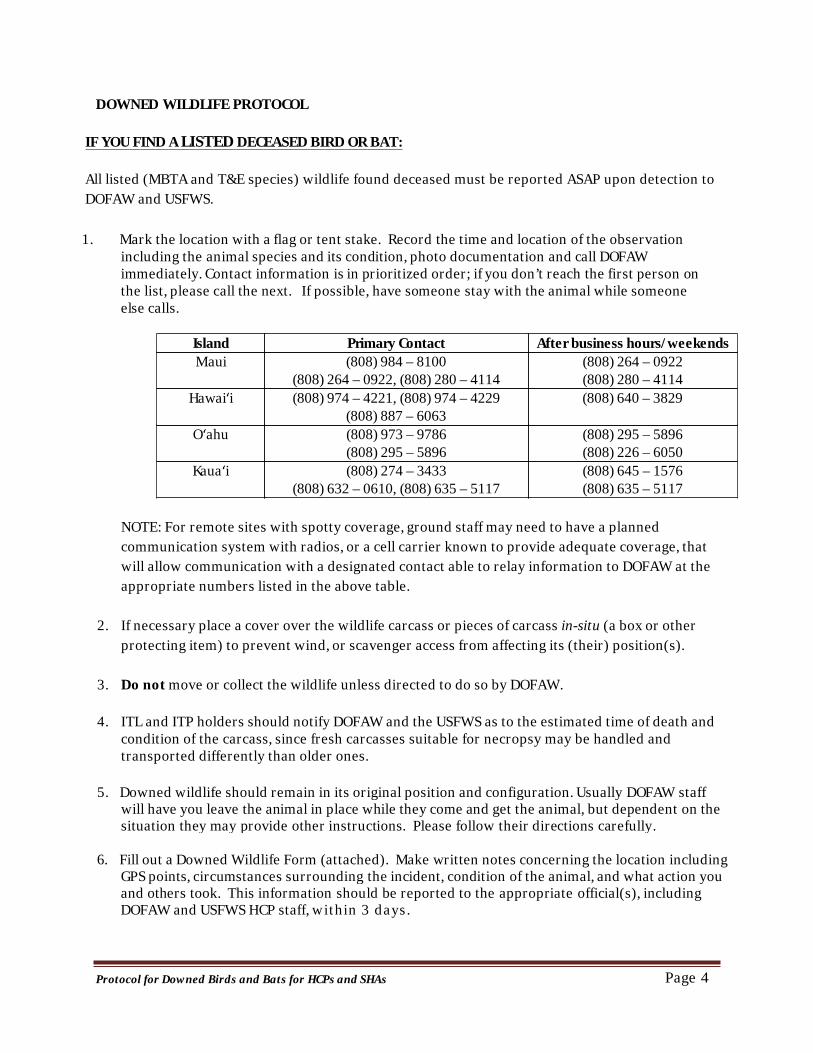
DOWNED WILDLIFE PROTOCOL
IF YOU FIND A LISTED DECEASED BIRD OR BAT:
All listed (MBTA and T&E species) wildlife found deceased must be reported ASAP upon detection to DOFAW and USFWS.
1. Mark the location with a flag or tent stake. Record the time and location of the observation including the animal species and its condition, photo documentation and call DOFAW immediately. Contact information is in prioritized order; if you don’t reach the first person on the list, please call the next. If possible, have someone stay with the animal while someone else calls.
Island Primary Contact After business hours/weekends Maui (808) 984 – 8100
(808) 264 – 0922, (808) 280 – 4114 (808) 264 – 0922 (808) 280 – 4114
Hawaiʻi (808) 974 – 4221, (808) 974 – 4229 (808) 887 – 6063
(808) 640 – 3829
Oʻahu (808) 973 – 9786 (808) 295 – 5896
(808) 295 – 5896 (808) 226 – 6050
Kauaʻi (808) 274 – 3433 (808) 632 – 0610, (808) 635 – 5117
(808) 645 – 1576 (808) 635 – 5117
NOTE: For remote sites with spotty coverage, ground staff may need to have a planned communication system with radios, or a cell carrier known to provide adequate coverage, that will allow communication with a designated contact able to relay information to DOFAW at the appropriate numbers listed in the above table.
2. If necessary place a cover over the wildlife carcass or pieces of carcass in-situ (a box or other protecting item) to prevent wind, or scavenger access from affecting its (their) position(s).
3. Do not move or collect the wildlife unless directed to do so by DOFAW.
4. ITL and ITP holders should notify DOFAW and the USFWS as to the estimated time of death and condition of the carcass, since fresh carcasses suitable for necropsy may be handled and transported differently than older ones.
5. Downed wildlife should remain in its original position and configuration. Usually DOFAW staff will have you leave the animal in place while they come and get the animal, but dependent on the situation they may provide other instructions. Please follow their directions carefully.
6. Fill out a Downed Wildlife Form (attached). Make written notes concerning the location including GPS points, circumstances surrounding the incident, condition of the animal, and what action you and others took. This information should be reported to the appropriate official(s), including DOFAW and USFWS HCP staff, within 3 days.
Protocol for Downed Birds and Bats for HCPs and SHAs Page 4
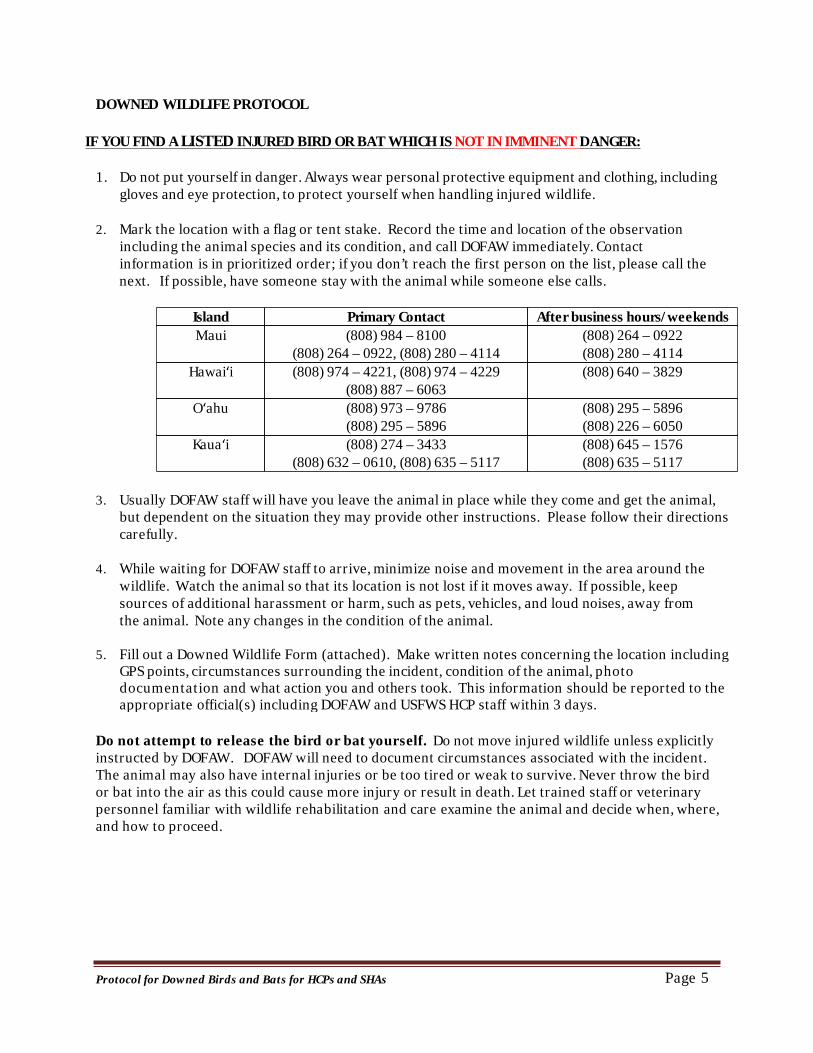
DOWNED WILDLIFE PROTOCOL
IF YOU FIND A LISTED INJURED BIRD OR BAT WHICH IS NOT IN IMMINENT DANGER:
1. Do not put yourself in danger. Always wear personal protective equipment and clothing, including gloves and eye protection, to protect yourself when handling injured wildlife.
2. Mark the location with a flag or tent stake. Record the time and location of the observation including the animal species and its condition, and call DOFAW immediately. Contact information is in prioritized order; if you don’t reach the first person on the list, please call the next. If possible, have someone stay with the animal while someone else calls.
Island Primary Contact After business hours/weekends Maui (808) 984 – 8100
(808) 264 – 0922, (808) 280 – 4114 (808) 264 – 0922 (808) 280 – 4114
Hawaiʻi (808) 974 – 4221, (808) 974 – 4229 (808) 887 – 6063
(808) 640 – 3829
Oʻahu (808) 973 – 9786 (808) 295 – 5896
(808) 295 – 5896 (808) 226 – 6050
Kauaʻi (808) 274 – 3433 (808) 632 – 0610, (808) 635 – 5117
(808) 645 – 1576 (808) 635 – 5117
3. Usually DOFAW staff will have you leave the animal in place while they come and get the animal, but dependent on the situation they may provide other instructions. Please follow their directions carefully.
4. While waiting for DOFAW staff to arrive, minimize noise and movement in the area around the wildlife. Watch the animal so that its location is not lost if it moves away. If possible, keep sources of additional harassment or harm, such as pets, vehicles, and loud noises, away from the animal. Note any changes in the condition of the animal.
5. Fill out a Downed Wildlife Form (attached). Make written notes concerning the location including GPS points, circumstances surrounding the incident, condition of the animal, photo documentation and what action you and others took. This information should be reported to the appropriate official(s) including DOFAW and USFWS HCP staff within 3 days.
Do not attempt to release the bird or bat yourself. Do not move injured wildlife unless explicitly instructed by DOFAW. DOFAW will need to document circumstances associated with the incident. The animal may also have internal injuries or be too tired or weak to survive. Never throw the bird or bat into the air as this could cause more injury or result in death. Let trained staff or veterinary personnel familiar with wildlife rehabilitation and care examine the animal and decide when, where, and how to proceed.
Protocol for Downed Birds and Bats for HCPs and SHAs Page 5
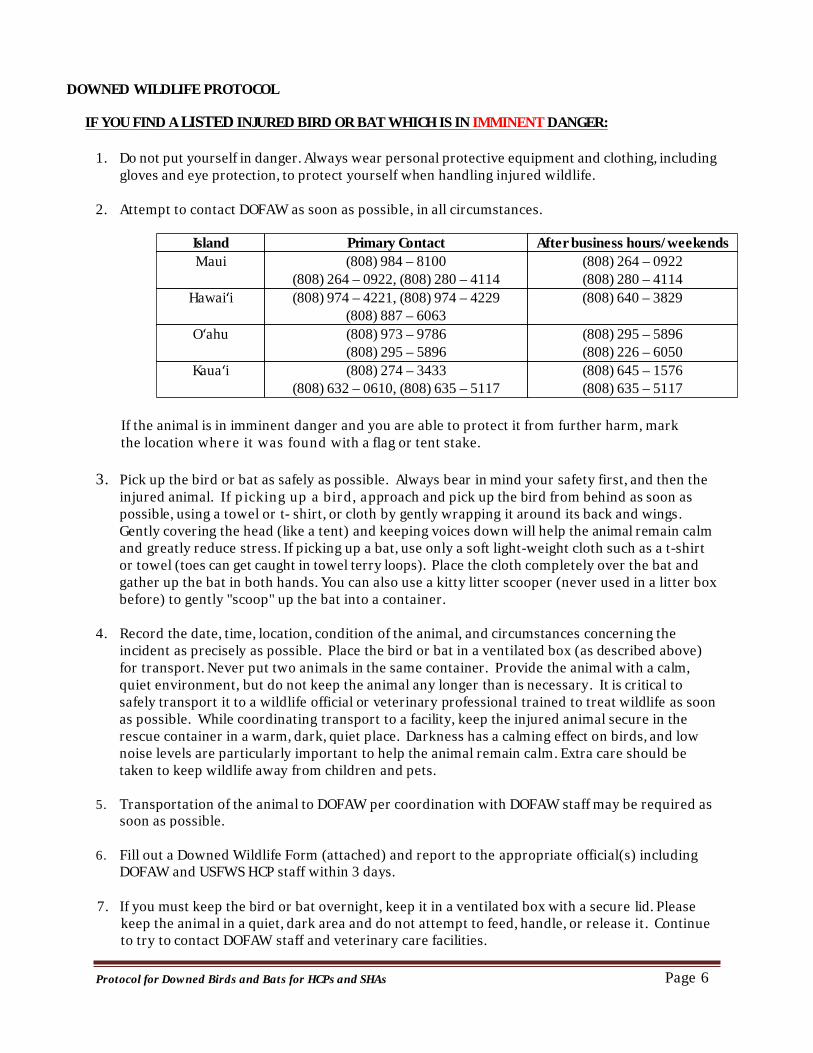
DOWNED WILDLIFE PROTOCOL
IF YOU FIND A LISTED INJURED BIRD OR BAT WHICH IS IN IMMINENT DANGER:
1. Do not put yourself in danger. Always wear personal protective equipment and clothing, including gloves and eye protection, to protect yourself when handling injured wildlife.
2. Attempt to contact DOFAW as soon as possible, in all circumstances.
Island Primary Contact After business hours/weekends Maui (808) 984 – 8100
(808) 264 – 0922, (808) 280 – 4114 (808) 264 – 0922 (808) 280 – 4114
Hawaiʻi (808) 974 – 4221, (808) 974 – 4229 (808) 887 – 6063
(808) 640 – 3829
Oʻahu (808) 973 – 9786 (808) 295 – 5896
(808) 295 – 5896 (808) 226 – 6050
Kauaʻi (808) 274 – 3433 (808) 632 – 0610, (808) 635 – 5117
(808) 645 – 1576 (808) 635 – 5117
If the animal is in imminent danger and you are able to protect it from further harm, mark the location where it was found with a flag or tent stake.
3. Pick up the bird or bat as safely as possible. Always bear in mind your safety first, and then the injured animal. If picking up a bird, approach and pick up the bird from behind as soon as possible, using a towel or t- shirt, or cloth by gently wrapping it around its back and wings. Gently covering the head (like a tent) and keeping voices down will help the animal remain calm and greatly reduce stress. If picking up a bat, use only a soft light-weight cloth such as a t-shirt or towel (toes can get caught in towel terry loops). Place the cloth completely over the bat and gather up the bat in both hands. You can also use a kitty litter scooper (never used in a litter box before) to gently "scoop" up the bat into a container.
4. Record the date, time, location, condition of the animal, and circumstances concerning the incident as precisely as possible. Place the bird or bat in a ventilated box (as described above) for transport. Never put two animals in the same container. Provide the animal with a calm, quiet environment, but do not keep the animal any longer than is necessary. It is critical to safely transport it to a wildlife official or veterinary professional trained to treat wildlife as soon as possible. While coordinating transport to a facility, keep the injured animal secure in the rescue container in a warm, dark, quiet place. Darkness has a calming effect on birds, and low noise levels are particularly important to help the animal remain calm. Extra care should be taken to keep wildlife away from children and pets.
5. Transportation of the animal to DOFAW per coordination with DOFAW staff may be required as soon as possible.
6. Fill out a Downed Wildlife Form (attached) and report to the appropriate official(s) including DOFAW and USFWS HCP staff within 3 days.
7. If you must keep the bird or bat overnight, keep it in a ventilated box with a secure lid. Please keep the animal in a quiet, dark area and do not attempt to feed, handle, or release it. Continue to try to contact DOFAW staff and veterinary care facilities.
Protocol for Downed Birds and Bats for HCPs and SHAs Page 6
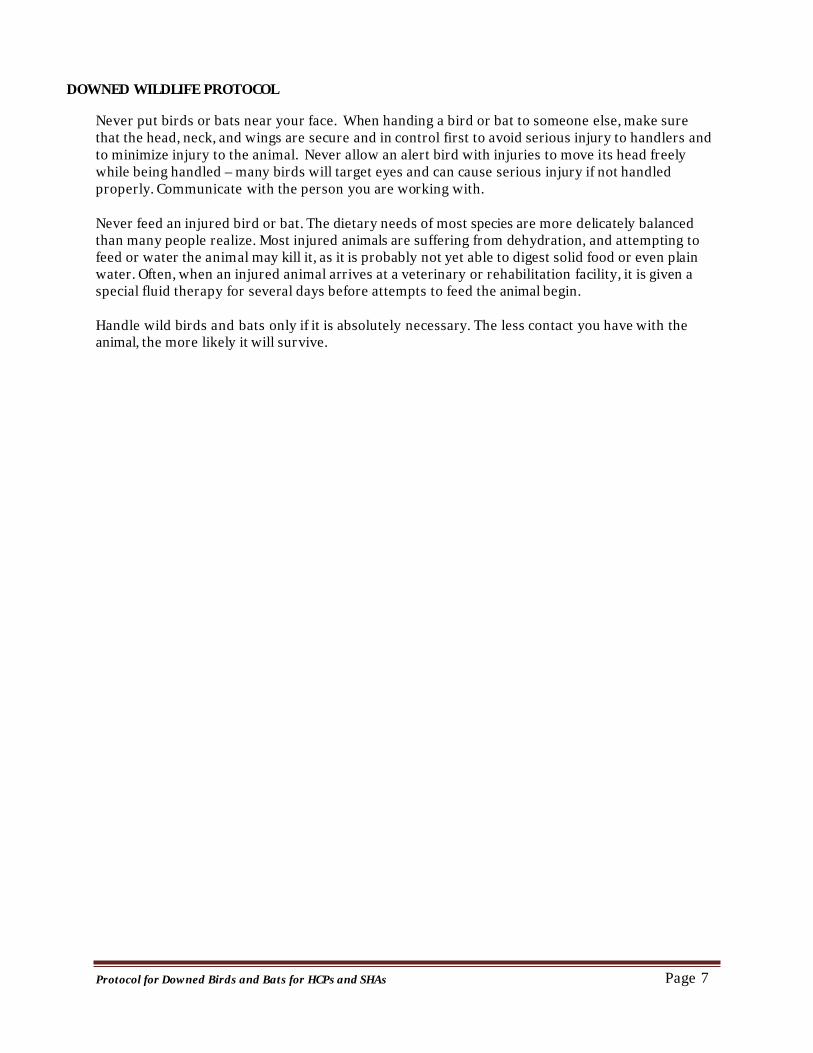
DOWNED WILDLIFE PROTOCOL
Never put birds or bats near your face. When handing a bird or bat to someone else, make sure that the head, neck, and wings are secure and in control first to avoid serious injury to handlers and to minimize injury to the animal. Never allow an alert bird with injuries to move its head freely while being handled – many birds will target eyes and can cause serious injury if not handled properly. Communicate with the person you are working with.
Never feed an injured bird or bat. The dietary needs of most species are more delicately balanced than many people realize. Most injured animals are suffering from dehydration, and attempting to feed or water the animal may kill it, as it is probably not yet able to digest solid food or even plain water. Often, when an injured animal arrives at a veterinary or rehabilitation facility, it is given a special fluid therapy for several days before attempts to feed the animal begin.
Handle wild birds and bats only if it is absolutely necessary. The less contact you have with the animal, the more likely it will survive.
Protocol for Downed Birds and Bats for HCPs and SHAs Page 7
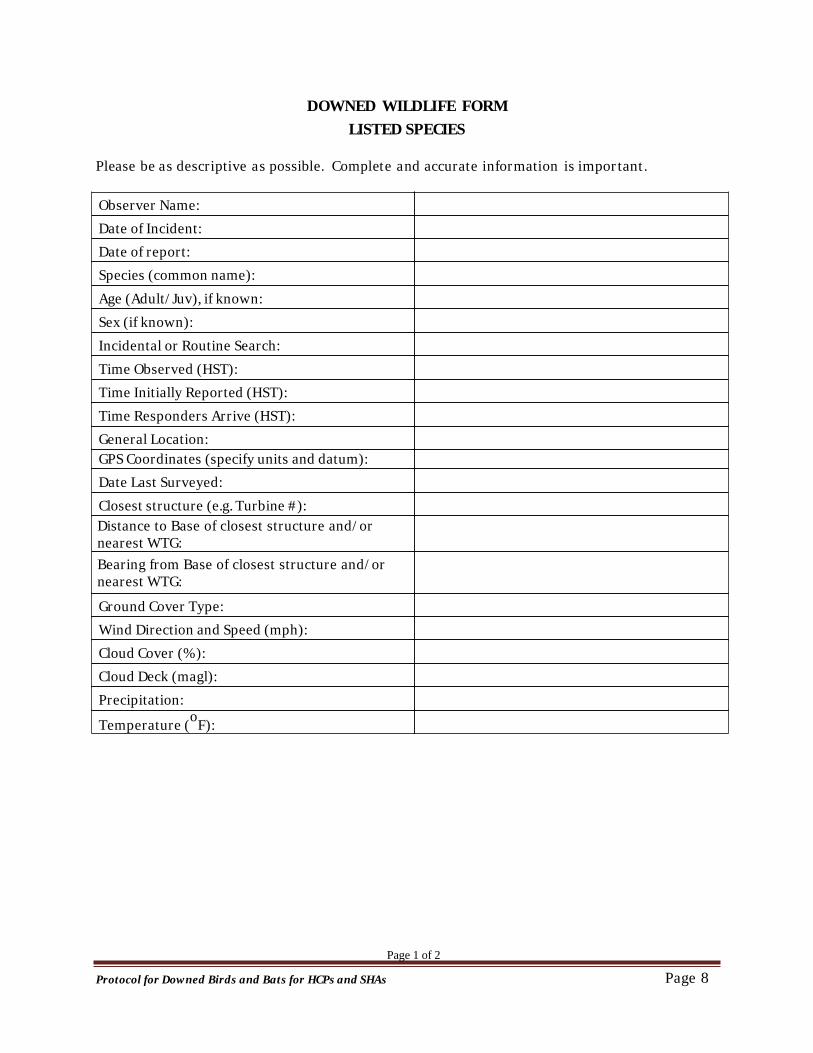
DOWNED WILDLIFE FORM LISTED SPECIES
Please be as descriptive as possible. Complete and accurate information is important.
Observer Name: Date of Incident: Date of report: Species (common name): Age (Adult/Juv), if known: Sex (if known): Incidental or Routine Search: Time Observed (HST): Time Initially Reported (HST): Time Responders Arrive (HST): General Location: GPS Coordinates (specify units and datum): Date Last Surveyed:Closest structure (e.g. Turbine #): Distance to Base of closest structure and/or nearest WTG: Bearing from Base of closest structure and/or nearest WTG:
Ground Cover Type: Wind Direction and Speed (mph): Cloud Cover (%): Cloud Deck (magl): Precipitation:
Temperature (oF):
Page 1 of 2
Protocol for Downed Birds and Bats for HCPs and SHAs Page 8
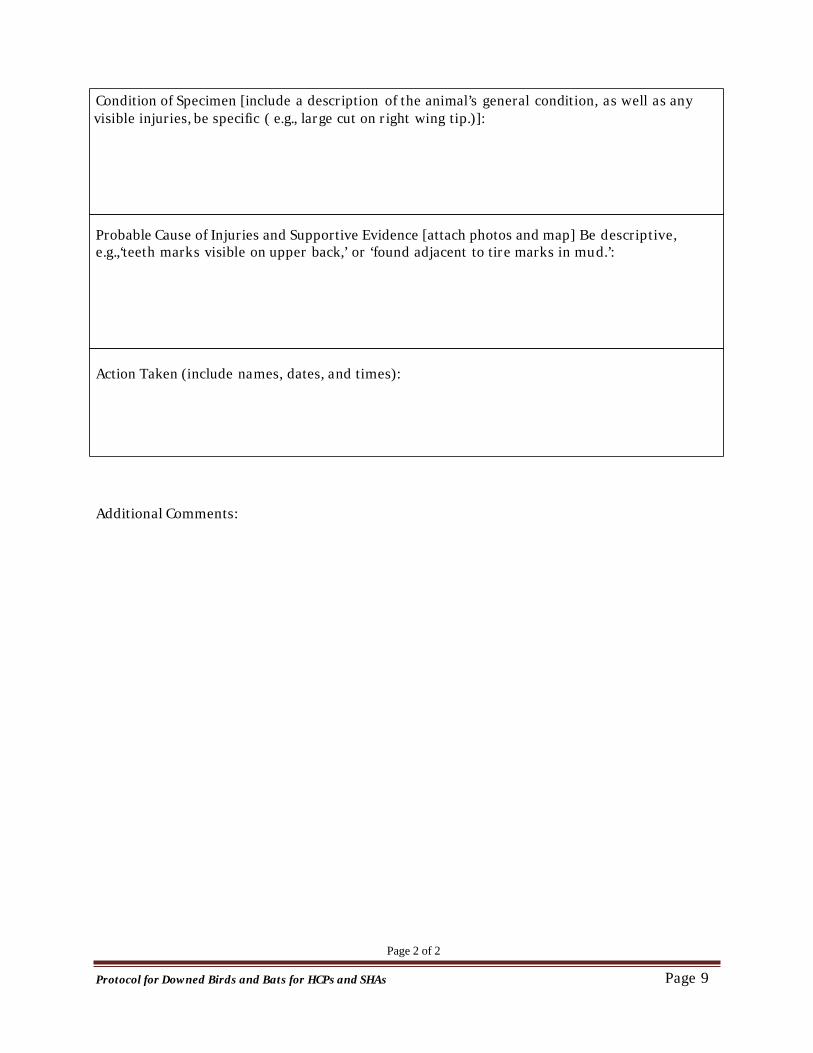
Condition of Specimen [include a description of the animal’s general condition, as well as any visible injuries, be specific ( e.g., large cut on right wing tip.)]:
Probable Cause of Injuries and Supportive Evidence [attach photos and map] Be descriptive, e.g.,‘teeth marks visible on upper back,’ or ‘found adjacent to tire marks in mud.’:
Action Taken (include names, dates, and times):
Additional Comments:
Page 2 of 2
Protocol for Downed Birds and Bats for HCPs and SHAs Page 9
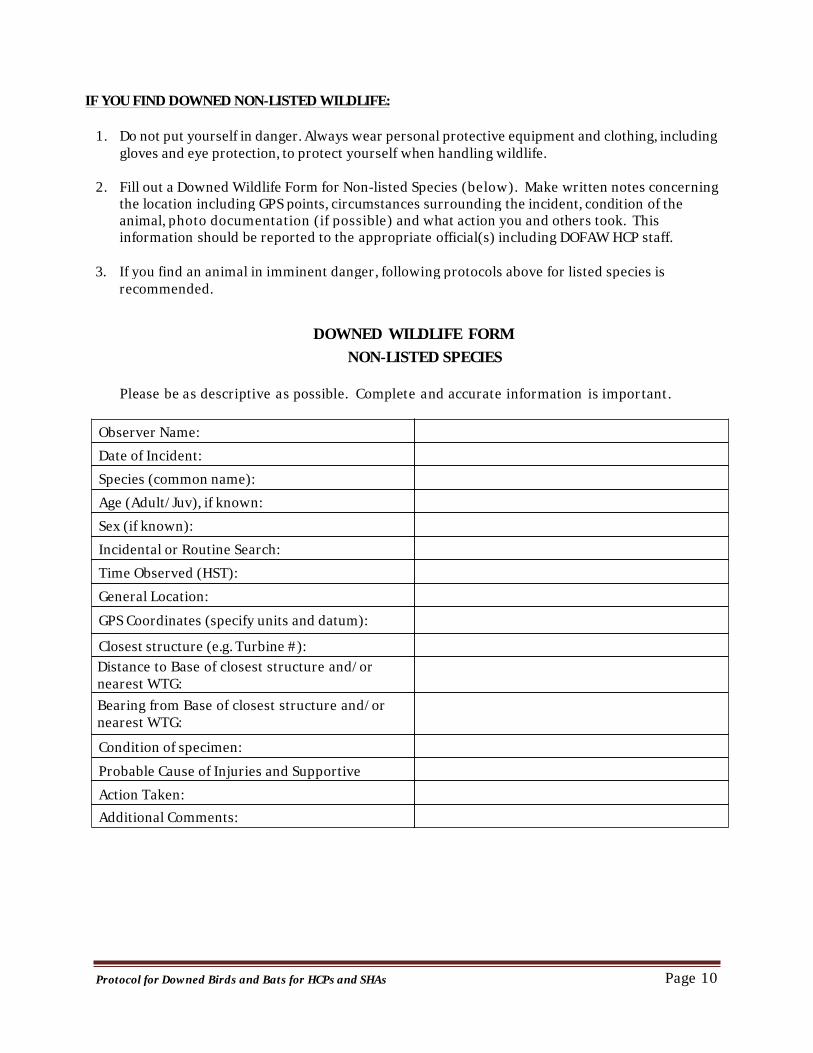
IF YOU FIND DOWNED NON-LISTED WILDLIFE:
1. Do not put yourself in danger. Always wear personal protective equipment and clothing, including gloves and eye protection, to protect yourself when handling wildlife.
2. Fill out a Downed Wildlife Form for Non-listed Species (below). Make written notes concerning the location including GPS points, circumstances surrounding the incident, condition of the animal, photo documentation (if possible) and what action you and others took. This information should be reported to the appropriate official(s) including DOFAW HCP staff.
3. If you find an animal in imminent danger, following protocols above for listed species is recommended.
DOWNED WILDLIFE FORM NON-LISTED SPECIES
Please be as descriptive as possible. Complete and accurate information is important.
Observer Name: Date of Incident: Species (common name): Age (Adult/Juv), if known: Sex (if known): Incidental or Routine Search: Time Observed (HST): General Location: GPS Coordinates (specify units and datum):
Closest structure (e.g. Turbine #): Distance to Base of closest structure and/or nearest WTG: Bearing from Base of closest structure and/or nearest WTG:
Condition of specimen: Probable Cause of Injuries and Supportive Action Tak en: Additional Comments:
Protocol for Downed Birds and Bats for HCPs and SHAs Page 10
FINAL HABITAT CONSERVATION PLAN
Na Pua Makani Wind Energy Project
Appendix B: Radar and Visual Studies of Seabirds and Bats at the Proposed Na Pua Makani Wind Energy Project, Oahu Island, Hawaii, Fall 2012, Spring 2013, and Summer 2013

FINAL HABITAT CONSERVATION PLAN
Na Pua Makani Wind Energy Project
This page intentionally left blank
RADAR AND VISUAL STUDIES OF SEABIRDS AND BATS AT THE
PROPOSED NA PUA MAKANI WIND ENERGY PROJECT, OAHU
ISLAND, HAWAII, FALL 2012, SPRING 2013,
AND SUMMER 2013
PETER M. SANZENBACHER
AND BRIAN A. COOPER
PREPARED FOR
TETRA TECH, INC.
PORTLAND, OR
PREPARED BY
ABR, INC.–ENVIRONMENTAL RESEARCH & SERVICES
FOREST GROVE, OR

This page intentionally left blank
RADAR AND VISUAL STUDIES OF SEABIRDS AND BATS AT THE PROPOSED
NA PUA MAKANI WIND ENERGY PROJECT, OAHU ISLAND, HAWAII,
FALL 2012, SPRING 2013, AND SUMMER 2013
FINAL REPORT
Prepared for
TETRA TECH, INC.1750 SW Harbor Way, Ste. 400
Portland, OR 97201
Prepared by
Peter M. Sanzenbacher and Brian A. CooperABR, Inc.—Environmental Research & Services
P.O. Box 249Forest Grove, OR 97116–0249
November 2013
Printed on recycled paper.

This page intentionally left blank
iii Na Pua Makani Seabird and Bat Study
EXECUTIVE SUMMARY
• Champlin/GEI Wind Holdings, LLC(Champlin) is interested in developing the NaPua Makani Wind Energy Project (hereafterProject) on northern Oahu Island, Hawaii. Thisreport summarizes the results of a radar andaudiovisual study of seabirds and batsconducted at the Project in fall 2012 and springand summer 2013. The objectives of this studywere to: (1) conduct surveys of endangeredseabirds (Hawaiian Petrels [Pterodromasandwichensis] and Newell's Shearwaters[Puffinus auricularis newelli]) and Hawaiianhoary bats (Lasiurus cinereus semotus); (2)assess use of the Project area by these species;and (3) estimate fatality rates of seabirds at theProject’s proposed wind turbines andmeteorological (met) towers.
• Two observers monitored movements ofseabirds and bats at up to three samplingstations for a total of 11 nights in fall (28October–8 November) 2012 and 12 nightseach during spring (20 April–1 May) andsummer (12–23 June) 2013, followingstandard ornithological radar and audiovisualtechniques used during previous studies ofseabirds in the Hawaiian Islands.
• We recorded 10 landward-flying and 6seaward-flying radar targets during fall 2012,10 landward-flying and 10 seaward-flyingradar targets during spring 2013, and 12landward-flying and 2 seaward-flying radartargets during summer 2013 that fit our criteriafor shearwater-like targets.
• We recorded no Hawaiian Petrels, no Newell'sShearwaters, and no Hawaiian hoary batsduring our audiovisual sampling in fall 2012and spring and summer 2013. However, insummer 2013 we did observe a singleunidentified petrel or shearwater that passedover the Project area.
• The mean adjusted nightly passage rates ofshearwater-like targets (i.e., landward andseaward rates combined) averaged across allsampling stations was 0.43 ± 0.09 targets/hour(h) during fall 2012, 0.52 ± 0.09 targets/hduring spring 2013, and 0.34 ± 0.09 targets/hduring summer 2013.
• Radar passage rates during each season at theProject were generally similar to ratesobserved during previous summer (0.20 ± 0.10targets/h) and fall (0.3 ± 0.20 targets/h)preconstruction studies at the adjacent KahukuWind Energy Project. Spring studies were notconducted at the Kahuku Wind Energy Projectand therefore are not available for comparison.
• While available literature on Oahu seabirdssuggests that our shearwater-like radar targetswere likely to be Newell’s Shearwaters ratherthan Hawaiian Petrels, it also is likely that ourradar-derived passage rates were inflatedbecause some non-target species were includedas shearwater-like targets in the radar data forthe Project. For example, during audiovisualobservations we detected Pacific GoldenPlover [Pluvialis fulva] and other species (e.g.,Barn Owl [Tyto alba], Cattle Egret [Bubulcusibis], Great Frigatebird [Fregata minor]) thatunder some circumstances can resembleshearwater-like targets on radar. Thus, ourfindings indicate that passage rates of Newell’sShearwater-like targets through the Projectwere very low during the known peak dailyactivity periods. Furthermore, our data set errson the conservative side because it probablyincludes some non-shearwater targets.
• We detected similar numbers of landward andseaward-flying shearwater-like radar targetsduring fall 2012 and spring 2013. In contrast,we observed higher numbers of landwardversus seaward-flying targets during summer2013.
• During our studies we recorded a total of 23shearwater-like targets on vertical radarincluding 10 targets during fall 2012, 7 targetsduring spring 2013, and 6 targets duringsummer 2013. We also estimated the flightaltitude from a single visual observation ofan unidentified petrel or shearwater duringsummer 2013. Flight altitudes ranged from36–355 meters (m) above ground level (m agl).The mean (± SE) flight altitude was 183 ± 30m agl (median = 175 m agl) in fall, 147 ± 33 magl (median = 107 m agl) in spring, and 131 ±20 m agl (median = 124 m agl) in summer. Theoverall mean flight altitude for data pooledacross all seasons was 157 ± 17 m agl (median
= 145 m agl). The percentage of observationsacross all seasons that occurred at or below theheight of the proposed turbines (130.5 m agl)was 45.8% and the percentage of observationsobserved at or below the height of theproposed met tower (80 m agl) was 16.7%across all seasons.
• To determine the risk of collision-causedmortality, we used the following information togenerate an estimate of exposure risk: meanpassage rates of shearwater-like targetsobserved on radar in fall 2012 and spring andsummer 2013, Newell’s Shearwater flightaltitudes from previous visual studies andshearwater-like vertical radar targets andaudiovisual observations recorded during thecurrent study, and dimensions andcharacteristics of the proposed wind turbinesand single proposed met tower.
• We estimated that an average of <1–7 Newell’sShearwaters/year fly within the space occupiedby each proposed wind turbine and <1Newell’s Shearwaters/year flies within thespace occupied by the single proposed80-m-tall unguyed, lattice met tower.
• Using a conservative range of assumptions foravoidance rates in our fatality models (i.e.,90%, 95%, and 99% avoidance), we estimateda collision-caused fatality rate of 0.004–0.101Newell’s Shearwaters/turbine/year for eachwind turbine and 0.001–0.020 Newell’sShearwaters/tower/year for the 80-m-tallunguyed, lattice met tower. We discuss thegrowing body of evidence suggesting that theaverage avoidance-rate value is substantial andpotentially ≥99%. Thus, we believe thatfatality rates would most likely be near thelower end of the range of estimates we provide.
Na Pua Makani Seabird and Bat Study iv
TABLE OF CONTENTS
EXECUTIVE SUMMARY ..........................................................................................................................iiiLIST OF FIGURES .......................................................................................................................................vLIST OF TABLES........................................................................................................................................viLIST OF APPENDICES..............................................................................................................................viiACKNOWLEDGMENTS ............................................................................................................... ...........viiINTRODUCTION .........................................................................................................................................1
BACKGROUND ........................................................................................................................................1SEABIRDS...................................................................................................................... ........................ 1HAWAIIAN HOARY BATS........................................................................................................... ....... 3
STUDY AREA .................................................................................................................... ......................... 3METHODS....................................................................................................................................................5
DATA ANALYSIS................................................................................................................. ................... 9RADAR AND AUDIOVISUAL DATA SUMMARY ............................................................................9EXPOSURE AND FATALITY RATES ............................................................................................... 10
RESULTS....................................................................................................................... ............................ 13RADAR OBSERVATIONS .....................................................................................................................13
MOVEMENT RATES ................................................................................................................ .......... 13AUDIOVISUAL OBSERVATIONS........................................................................................................13FLIGHT ALTITUDES ............................................................................................................................. 18EXPOSURE RATES ................................................................................................................ ............... 18FATALITY MODELING............................................................................................................. ........... 18
DISCUSSION.................................................................................................................... ......................... 18SPECIES COMPOSITION........................................................................................................... ........... 18PASSAGE RATES AND FLIGHT DIRECTIONS.................................................................................. 23EXPOSURE RATES AND FATALITY ESTIMATES ........................................................................... 25
COLLISION AVOIDANCE RATES .................................................................................................... 25POTENTIAL BIASES ...........................................................................................................................27
HAWAIIAN HOARY BATS ...................................................................................................................28SUMMARY....................................................................................................................... ......................... 28LITERATURE CITED................................................................................................................................29
LIST OF FIGURES
Figure 1. Map of Oahu Island, Hawaii, with location of the proposed Na Pua Makani Wind Energy Project and associated fall 2012, and spring and summer 2013 seabird radar and audiovisual sampling sites ................................................................................................. 2
Figure 2. Locations of fall 2012 and spring and summer 2013 seabird radar and audiovisual sampling sites, proposed wind turbines, and potential locations for a single proposed meteorological tower at the Na Pua Makani Wind Energy Project, Oahu Island, Hawaii....... 4
Figure 3. The surveillance and vertical radars used for studies of Newell’s Shearwater at the proposed Na Pua Makani Wind Energy Project, Oahu Island, Hawaii, fall 2012, and spring and summer 2013...........................................................................................................6
Figure 4. Approximate shearwater-/petrel-sampling airspace for the Furuno FR–1510 marine radar at the 1.5-km range setting, in surveillance and vertical antenna orientations, as determined by field trials with Rock Pigeons........................................................................... 7
v Na Pua Makani Seabird and Bat Study
Figure 5. Major variables used in estimating possible fatalities of Newell’s Shearwaters at wind turbines and met towers at the proposed Na Pua Makani Wind Energy Project, Oahu Island, Hawaii. ........................................................................................................................11
Figure 6. Flight paths of shearwater-like radar targets observed during 11 nights in fall 2012 at the proposed Na Pua Makani Wind Energy Project, Oahu Island, Hawaii ............................ 14
Figure 7. Flight paths of shearwater-like radar targets observed during 12 nights in spring 2013 at the proposed Na Pua Makani Wind Energy Project, Oahu Island, Hawaii ........................15
Figure 8. Flight paths of shearwater-like radar targets observed during 12 nights in summer 2013 at the proposed Na Pua Makani Wind Energy Project, Oahu Island, Hawaii. ....................... 16
LIST OF TABLES
Table 1. Radar and audiovisual sampling location coordinates and elevations at the proposed Na Pua Makani Wind Energy Project, Oahu Island, Hawaii, fall 2012, and spring and summer 2013 ............................................................................................................................5
Table 2. Mean passage rates of shearwater-like radar targets and visual observations at the proposed Na Pua Makani Wind Energy Project, Oahu Island, Hawaii, fall 2012, and spring and summer 2013........................................................................................................17
Table 3. Flight altitudes of shearwater-like targets measured using vertical radar and during visual observations at the proposed Na Pua Makani Wind Energy Project, Oahu Island, Hawaii, fall 2012 and spring and summer 2013 .....................................................................19
Table 4. Estimated average exposure rates and fatality rates of Newell’s Shearwaters for Siemens SWT-3.0-101 turbines at the proposed Na Pua Makani Wind Energy Project, Oahu Island, Hawaii, based on radar data collected in fall 2012 and spring and summer 2013 ..........................................................................................................................20
Table 5. Estimated average exposure rates and fatality rates of Newell’s Shearwaters for guyed 80-m-tall lattice meteorological (met) towers at the proposed Na Pua Makani Wind Energy Project, Oahu Island, Hawaii, based on radar data collected in fall 2012 and spring and summer 2013....................................................................................................................22
Table 6. Summary of estimated annual fatality rates and cumulative fatality rates for Newell’s Shearwaters at proposed wind turbines and a single proposed meteorological (met) tower at the proposed Na Pua Makani Wind Energy Project, Oahu Island, Hawaii ........................24
Na Pua Makani Seabird and Bat Study vi
LIST OF APPENDICES
Appendix 1. Sampling dates and number of shearwater-like radar targets and audio-visual observations of species of interest at the proposed Na Pua Makani Wind Energy Project, Oahu Island, Hawaii, fall 2012.......................................................................... 36
Appendix 2. Sampling dates and number of shearwater-like radar targets and audio-visual observations of species of interest at the proposed Na Pua Makani Wind Energy Project, Oahu Island, Hawaii, spring 2013 .....................................................................37
Appendix 3. Sampling dates and number of shearwater-like radar targets and audio-visual observations of species of interest at the proposed Na Pua Makani Wind Energy Project, Oahu Island, Hawaii, summer 2013 .................................................................. 38
Appendix 4. Summary of passage rates of Hawaiian Petrel-like and/or Newell’s Shearwater-like targets observed during radar studies on Oahu, Molokai, Lanai, Kauai, East Maui, West Maui, and Hawaii Islands ...................................................................................... 39
ACKNOWLEDGMENTS
Funding for this research came from Champlin/GEI Wind Holdings Inc. At Tetra Tech, Inc., wethank Alicia Oller and Rich Young for project management and logistical assistance and Tom Snetsinger for reviewing the report. Keith Avery at West Wind Works, LLC coordinated site access. At ABR, Melinda Malek and Mike Davis provided field assistance; Alex Prichard provided statistical assistance; Tom DeLong provided contract support; Rich Blaha provided GIS support; Susan Cooper and Delee Spiesschaert provided logistical support; and Pam Odom produced the report.
vii Na Pua Makani Seabird and Bat Study

This page intentionally left blank
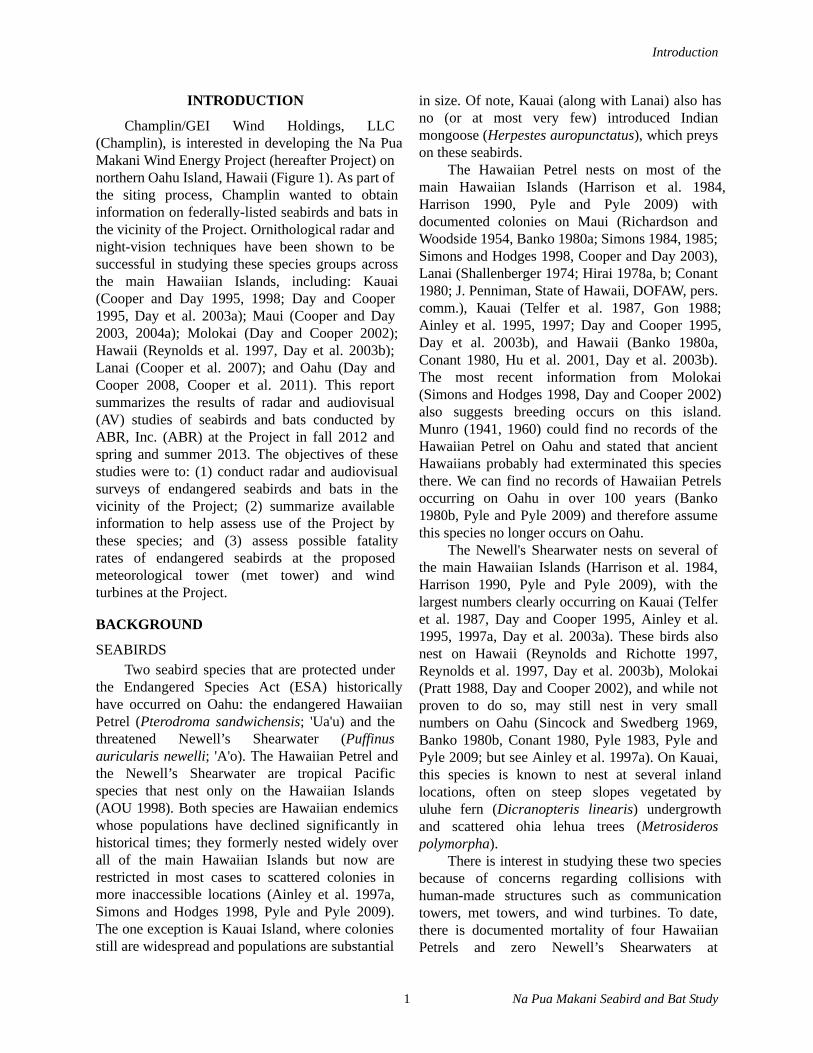
Introduction
INTRODUCTION
Champlin/GEI Wind Holdings, LLC(Champlin), is interested in developing the Na Pua Makani Wind Energy Project (hereafter Project) onnorthern Oahu Island, Hawaii (Figure 1). As part ofthe siting process, Champlin wanted to obtain information on federally-listed seabirds and bats in the vicinity of the Project. Ornithological radar andnight-vision techniques have been shown to besuccessful in studying these species groups across the main Hawaiian Islands, including: Kauai (Cooper and Day 1995, 1998; Day and Cooper 1995, Day et al. 2003a); Maui (Cooper and Day 2003, 2004a); Molokai (Day and Cooper 2002); Hawaii (Reynolds et al. 1997, Day et al. 2003b); Lanai (Cooper et al. 2007); and Oahu (Day and Cooper 2008, Cooper et al. 2011). This report summarizes the results of radar and audiovisual (AV) studies of seabirds and bats conducted by ABR, Inc. (ABR) at the Project in fall 2012 and spring and summer 2013. The objectives of these studies were to: (1) conduct radar and audiovisual surveys of endangered seabirds and bats in the vicinity of the Project; (2) summarize availableinformation to help assess use of the Project bythese species; and (3) assess possible fatality rates of endangered seabirds at the proposed meteorological tower (met tower) and windturbines at the Project.
BACKGROUND
SEABIRDSTwo seabird species that are protected under
the Endangered Species Act (ESA) historically have occurred on Oahu: the endangered Hawaiian Petrel (Pterodroma sandwichensis; 'Ua'u) and thethreatened Newell’s Shearwater (Puffinusauricularis newelli; 'A'o). The Hawaiian Petrel and the Newell’s Shearwater are tropical Pacific species that nest only on the Hawaiian Islands (AOU 1998). Both species are Hawaiian endemics whose populations have declined significantly in historical times; they formerly nested widely over all of the main Hawaiian Islands but now arerestricted in most cases to scattered colonies inmore inaccessible locations (Ainley et al. 1997a, Simons and Hodges 1998, Pyle and Pyle 2009). The one exception is Kauai Island, where colonies still are widespread and populations are substantial
in size. Of note, Kauai (along with Lanai) also has no (or at most very few) introduced Indian mongoose (Herpestes auropunctatus), which preys on these seabirds.
The Hawaiian Petrel nests on most of the main Hawaiian Islands (Harrison et al. 1984, Harrison 1990, Pyle and Pyle 2009) withdocumented colonies on Maui (Richardson andWoodside 1954, Banko 1980a; Simons 1984, 1985; Simons and Hodges 1998, Cooper and Day 2003), Lanai (Shallenberger 1974; Hirai 1978a, b; Conant 1980; J. Penniman, State of Hawaii, DOFAW, pers. comm.), Kauai (Telfer et al. 1987, Gon 1988; Ainley et al. 1995, 1997; Day and Cooper 1995, Day et al. 2003b), and Hawaii (Banko 1980a, Conant 1980, Hu et al. 2001, Day et al. 2003b). The most recent information from Molokai (Simons and Hodges 1998, Day and Cooper 2002) also suggests breeding occurs on this island. Munro (1941, 1960) could find no records of theHawaiian Petrel on Oahu and stated that ancientHawaiians probably had exterminated this species there. We can find no records of Hawaiian Petrels occurring on Oahu in over 100 years (Banko1980b, Pyle and Pyle 2009) and therefore assumethis species no longer occurs on Oahu.
The Newell's Shearwater nests on several ofthe main Hawaiian Islands (Harrison et al. 1984,Harrison 1990, Pyle and Pyle 2009), with the largest numbers clearly occurring on Kauai (Telfer et al. 1987, Day and Cooper 1995, Ainley et al. 1995, 1997a, Day et al. 2003a). These birds also nest on Hawaii (Reynolds and Richotte 1997, Reynolds et al. 1997, Day et al. 2003b), Molokai (Pratt 1988, Day and Cooper 2002), and while not proven to do so, may still nest in very small numbers on Oahu (Sincock and Swedberg 1969, Banko 1980b, Conant 1980, Pyle 1983, Pyle and Pyle 2009; but see Ainley et al. 1997a). On Kauai, this species is known to nest at several inland locations, often on steep slopes vegetated by uluhe fern (Dicranopteris linearis) undergrowth and scattered ohia lehua trees (Metrosideros polymorpha).
There is interest in studying these two species because of concerns regarding collisions with human-made structures such as communication towers, met towers, and wind turbines. To date, there is documented mortality of four HawaiianPetrels and zero Newell’s Shearwaters at
1 Na Pua Makani Seabird and Bat Study
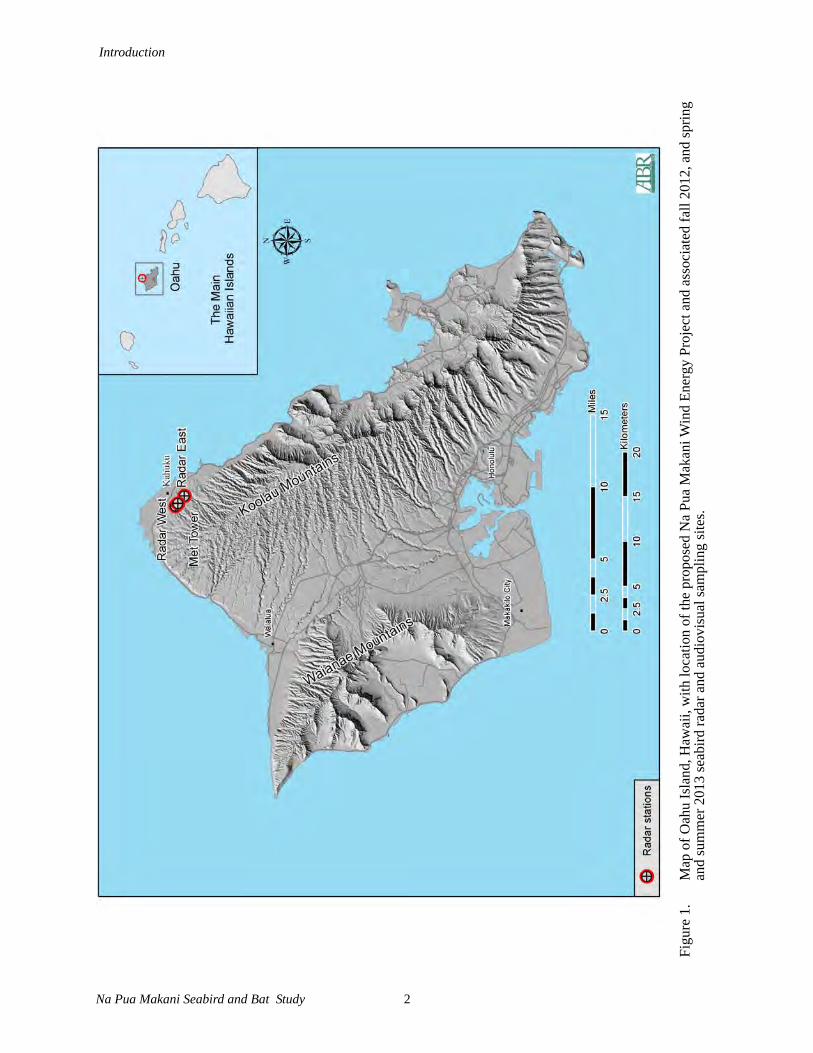
Figu
re 1
.M
ap o
f Oah
u Is
land
, Haw
aii,
with
loca
tion
of th
e pr
opos
ed N
a Pu
a M
akan
i Win
d En
ergy
Pro
ject
and
ass
ocia
ted
fall
2012
, and
sprin
g an
d su
mm
er 2
013
seab
ird ra
dar a
nd a
udio
visu
al sa
mpl
ing
site
s.
Introduction
Na Pua Makani Seabird and Bat Study 2
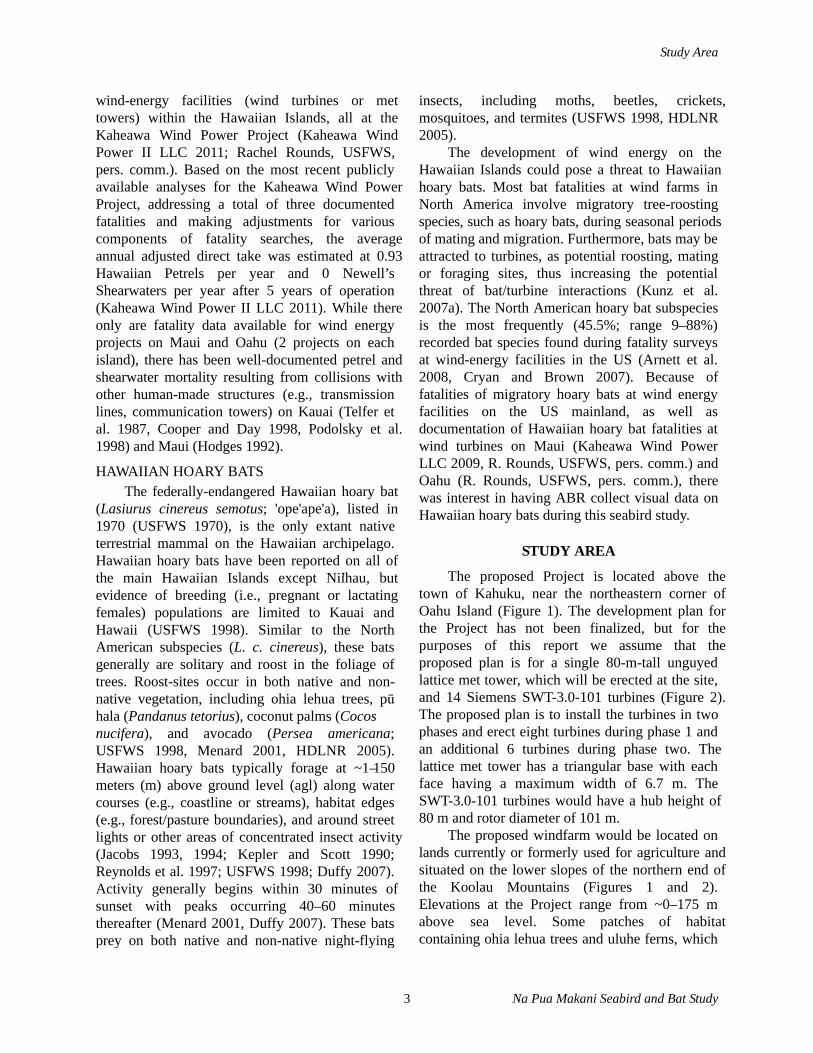
Study Area
wind-energy facilities (wind turbines or met towers) within the Hawaiian Islands, all at the Kaheawa Wind Power Project (Kaheawa Wind Power II LLC 2011; Rachel Rounds, USFWS,pers. comm.). Based on the most recent publiclyavailable analyses for the Kaheawa Wind Power Project, addressing a total of three documentedfatalities and making adjustments for variouscomponents of fatality searches, the average annual adjusted direct take was estimated at 0.93 Hawaiian Petrels per year and 0 Newell’sShearwaters per year after 5 years of operation(Kaheawa Wind Power II LLC 2011). While there only are fatality data available for wind energyprojects on Maui and Oahu (2 projects on eachisland), there has been well-documented petrel and shearwater mortality resulting from collisions with other human-made structures (e.g., transmissionlines, communication towers) on Kauai (Telfer etal. 1987, Cooper and Day 1998, Podolsky et al. 1998) and Maui (Hodges 1992).
HAWAIIAN HOARY BATSThe federally-endangered Hawaiian hoary bat
(Lasiurus cinereus semotus; 'ope'ape'a), listed in 1970 (USFWS 1970), is the only extant native terrestrial mammal on the Hawaiian archipelago. Hawaiian hoary bats have been reported on all of the main Hawaiian Islands except Ni’ihau, but evidence of breeding (i.e., pregnant or lactating females) populations are limited to Kauai andHawaii (USFWS 1998). Similar to the NorthAmerican subspecies (L. c. cinereus), these bats generally are solitary and roost in the foliage of trees. Roost-sites occur in both native and non- native vegetation, including ohia lehua trees, pū hala (Pandanus tetorius), coconut palms (Cocos nucifera), and avocado (Persea americana; USFWS 1998, Menard 2001, HDLNR 2005). Hawaiian hoary bats typically forage at ~1–150 meters (m) above ground level (agl) along water courses (e.g., coastline or streams), habitat edges(e.g., forest/pasture boundaries), and around streetlights or other areas of concentrated insect activity (Jacobs 1993, 1994; Kepler and Scott 1990;Reynolds et al. 1997; USFWS 1998; Duffy 2007).Activity generally begins within 30 minutes of sunset with peaks occurring 40–60 minutes thereafter (Menard 2001, Duffy 2007). These batsprey on both native and non-native night-flying
insects, including moths, beetles, crickets, mosquitoes, and termites (USFWS 1998, HDLNR2005).
The development of wind energy on the Hawaiian Islands could pose a threat to Hawaiian hoary bats. Most bat fatalities at wind farms in North America involve migratory tree-roosting species, such as hoary bats, during seasonal periods of mating and migration. Furthermore, bats may be attracted to turbines, as potential roosting, mating or foraging sites, thus increasing the potential threat of bat/turbine interactions (Kunz et al. 2007a). The North American hoary bat subspecies is the most frequently (45.5%; range 9–88%) recorded bat species found during fatality surveys at wind-energy facilities in the US (Arnett et al. 2008, Cryan and Brown 2007). Because of fatalities of migratory hoary bats at wind energy facilities on the US mainland, as well as documentation of Hawaiian hoary bat fatalities at wind turbines on Maui (Kaheawa Wind Power LLC 2009, R. Rounds, USFWS, pers. comm.) and Oahu (R. Rounds, USFWS, pers. comm.), there was interest in having ABR collect visual data on Hawaiian hoary bats during this seabird study.
STUDY AREA
The proposed Project is located above the town of Kahuku, near the northeastern corner of Oahu Island (Figure 1). The development plan for the Project has not been finalized, but for the purposes of this report we assume that the proposed plan is for a single 80-m-tall unguyedlattice met tower, which will be erected at the site,and 14 Siemens SWT-3.0-101 turbines (Figure 2). The proposed plan is to install the turbines in twophases and erect eight turbines during phase 1 andan additional 6 turbines during phase two. The lattice met tower has a triangular base with each face having a maximum width of 6.7 m. The SWT-3.0-101 turbines would have a hub height of 80 m and rotor diameter of 101 m.
The proposed windfarm would be located onlands currently or formerly used for agriculture and situated on the lower slopes of the northern end of the Koolau Mountains (Figures 1 and 2).Elevations at the Project range from ~0–175 mabove sea level. Some patches of habitat containing ohia lehua trees and uluhe ferns, which
3 Na Pua Makani Seabird and Bat Study
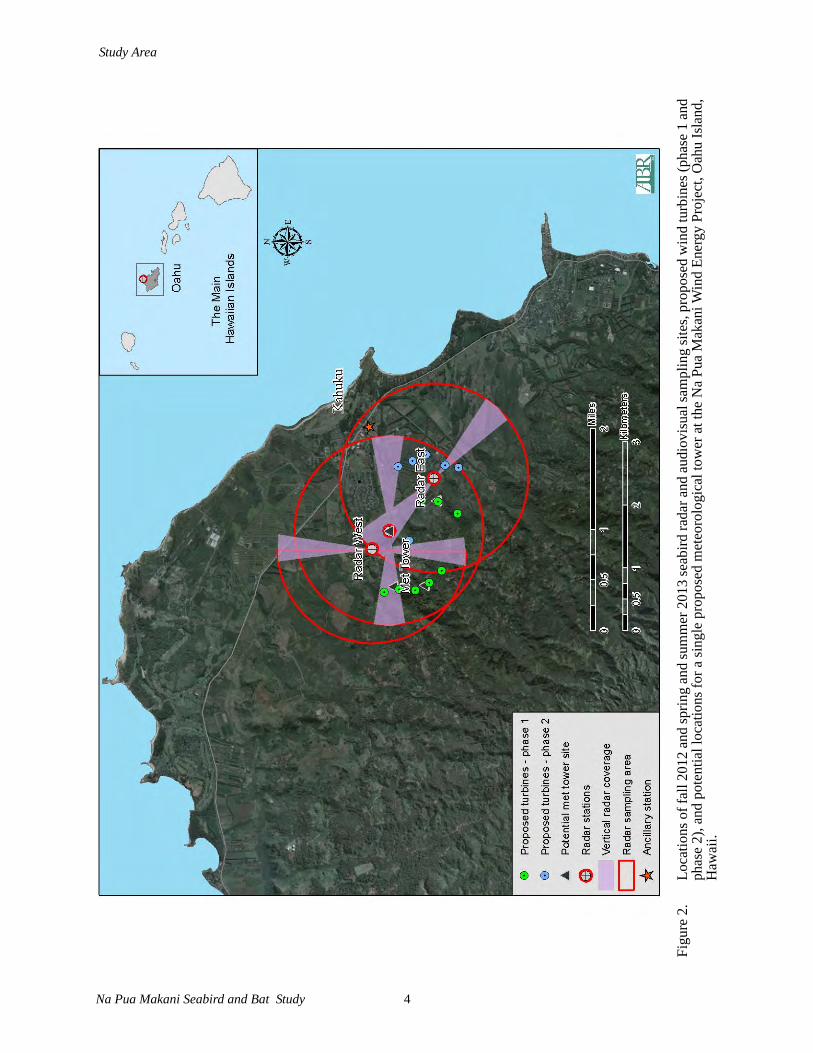
Figu
re 2
.Lo
catio
ns o
f fal
l 201
2 an
d sp
ring
and
sum
mer
201
3 se
abird
rada
r and
aud
iovi
sual
sam
plin
g si
tes,
prop
osed
win
d tu
rbin
es (p
hase
1 a
nd
phas
e 2)
, and
pot
entia
l loc
atio
ns fo
r a si
ngle
pro
pose
d m
eteo
rolo
gica
l tow
er a
t the
Na
Pua
Mak
ani W
ind
Ener
gy P
roje
ct, O
ahu
Isla
nd,
Haw
aii.
Study Area
Na Pua Makani Seabird and Bat Study 4
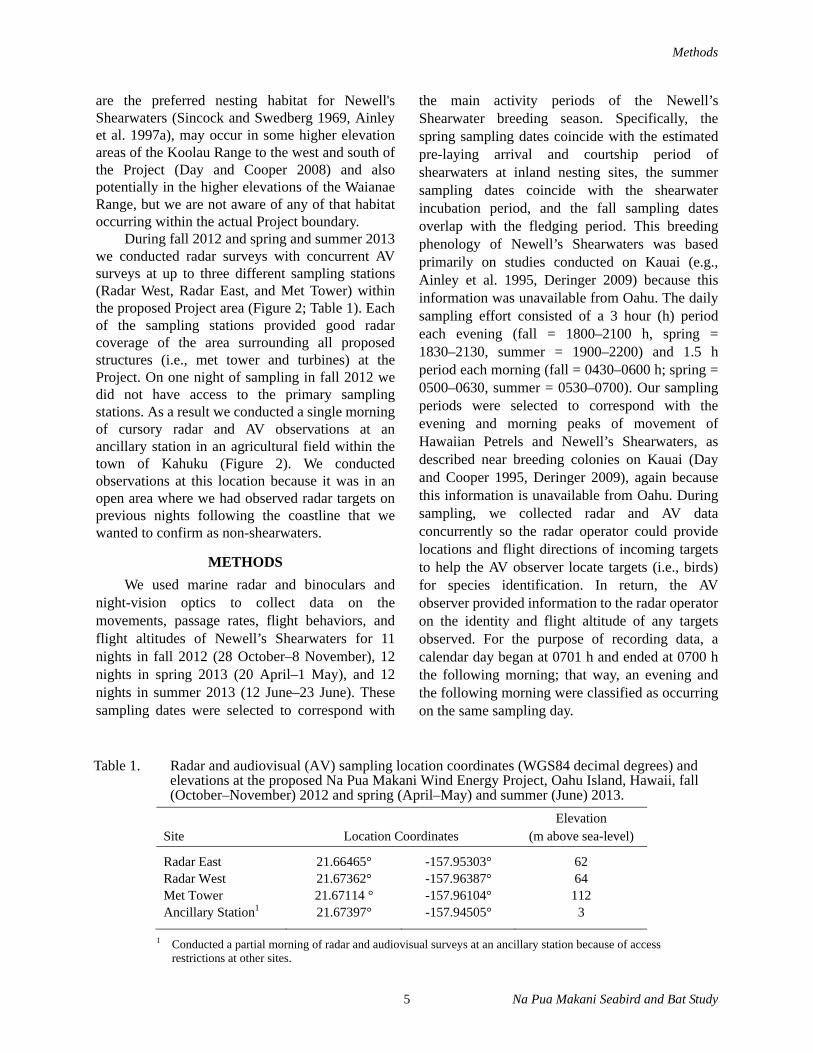
Methods
5 Na Pua Makani Seabird and Bat Study
are the preferred nesting habitat for Newell'sShearwaters (Sincock and Swedberg 1969, Ainleyet al. 1997a), may occur in some higher elevationareas of the Koolau Range to the west and south ofthe Project (Day and Cooper 2008) and alsopotentially in the higher elevations of the WaianaeRange, but we are not aware of any of that habitatoccurring within the actual Project boundary.
During fall 2012 and spring and summer 2013we conducted radar surveys with concurrent AVsurveys at up to three different sampling stations(Radar West, Radar East, and Met Tower) withinthe proposed Project area (Figure 2; Table 1). Eachof the sampling stations provided good radarcoverage of the area surrounding all proposedstructures (i.e., met tower and turbines) at theProject. On one night of sampling in fall 2012 wedid not have access to the primary samplingstations. As a result we conducted a single morningof cursory radar and AV observations at anancillary station in an agricultural field within thetown of Kahuku (Figure 2). We conductedobservations at this location because it was in anopen area where we had observed radar targets onprevious nights following the coastline that wewanted to confirm as non-shearwaters.
METHODSWe used marine radar and binoculars and
night-vision optics to collect data on themovements, passage rates, flight behaviors, andflight altitudes of Newell’s Shearwaters for 11nights in fall 2012 (28 October–8 November), 12nights in spring 2013 (20 April–1 May), and 12nights in summer 2013 (12 June–23 June). Thesesampling dates were selected to correspond with
the main activity periods of the Newell’sShearwater breeding season. Specifically, thespring sampling dates coincide with the estimatedpre-laying arrival and courtship period ofshearwaters at inland nesting sites, the summersampling dates coincide with the shearwaterincubation period, and the fall sampling datesoverlap with the fledging period. This breedingphenology of Newell’s Shearwaters was basedprimarily on studies conducted on Kauai (e.g.,Ainley et al. 1995, Deringer 2009) because thisinformation was unavailable from Oahu. The dailysampling effort consisted of a 3 hour (h) periodeach evening (fall = 1800–2100 h, spring =1830–2130, summer = 1900–2200) and 1.5 hperiod each morning (fall = 0430–0600 h; spring =0500–0630, summer = 0530–0700). Our samplingperiods were selected to correspond with theevening and morning peaks of movement ofHawaiian Petrels and Newell’s Shearwaters, asdescribed near breeding colonies on Kauai (Dayand Cooper 1995, Deringer 2009), again becausethis information is unavailable from Oahu. Duringsampling, we collected radar and AV dataconcurrently so the radar operator could providelocations and flight directions of incoming targetsto help the AV observer locate targets (i.e., birds)for species identification. In return, the AVobserver provided information to the radar operatoron the identity and flight altitude of any targetsobserved. For the purpose of recording data, acalendar day began at 0701 h and ended at 0700 hthe following morning; that way, an evening andthe following morning were classified as occurringon the same sampling day.
Table 1. Radar and audiovisual (AV) sampling location coordinates (WGS84 decimal degrees) and elevations at the proposed Na Pua Makani Wind Energy Project, Oahu Island, Hawaii, fall (October–November) 2012 and spring (April–May) and summer (June) 2013.
Site Location Coordinates Elevation
(m above sea-level)
Radar East 21.66465° -157.95303° 62 Radar West 21.67362° -157.96387° 64 Met Tower 21.67114 ° -157.96104° 112 Ancillary Station1 21.67397° -157.94505° 3
1 Conducted a partial morning of radar and audiovisual surveys at an ancillary station because of access restrictions at other sites.
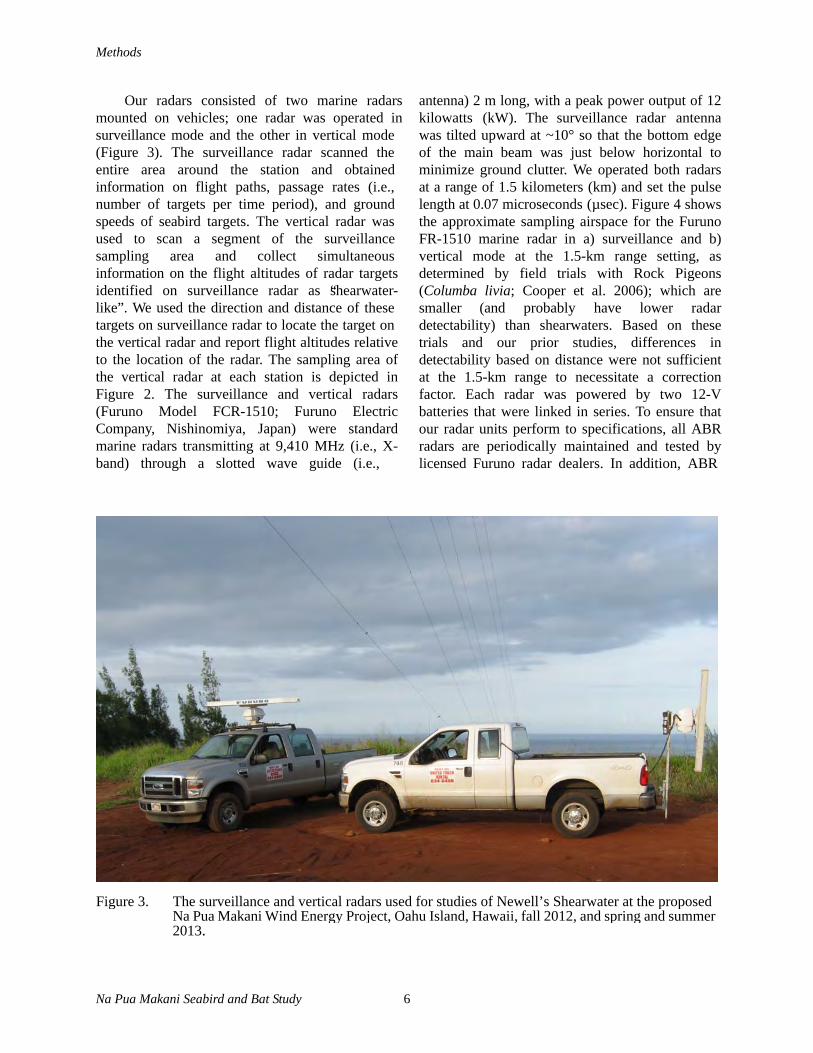
Methods
Our radars consisted of two marine radars mounted on vehicles; one radar was operated in surveillance mode and the other in vertical mode(Figure 3). The surveillance radar scanned theentire area around the station and obtained information on flight paths, passage rates (i.e., number of targets per time period), and ground speeds of seabird targets. The vertical radar was used to scan a segment of the surveillancesampling area and collect simultaneousinformation on the flight altitudes of radar targets identified on surveillance radar as “shearwater- like”. We used the direction and distance of thesetargets on surveillance radar to locate the target onthe vertical radar and report flight altitudes relative to the location of the radar. The sampling area of the vertical radar at each station is depicted in Figure 2. The surveillance and vertical radars (Furuno Model FCR-1510; Furuno Electric Company, Nishinomiya, Japan) were standard marine radars transmitting at 9,410 MHz (i.e., X- band) through a slotted wave guide (i.e.,
antenna) 2 m long, with a peak power output of 12 kilowatts (kW). The surveillance radar antenna was tilted upward at ~10° so that the bottom edge of the main beam was just below horizontal to minimize ground clutter. We operated both radars at a range of 1.5 kilometers (km) and set the pulse length at 0.07 microseconds (µsec). Figure 4 shows the approximate sampling airspace for the Furuno FR-1510 marine radar in a) surveillance and b) vertical mode at the 1.5-km range setting, as determined by field trials with Rock Pigeons (Columba livia; Cooper et al. 2006); which are smaller (and probably have lower radar detectability) than shearwaters. Based on these trials and our prior studies, differences in detectability based on distance were not sufficient at the 1.5-km range to necessitate a correction factor. Each radar was powered by two 12-V batteries that were linked in series. To ensure that our radar units perform to specifications, all ABR radars are periodically maintained and tested by licensed Furuno radar dealers. In addition, ABR
Figure 3. The surveillance and vertical radars used for studies of Newell’s Shearwater at the proposed Na Pua Makani Wind Energy Project, Oahu Island, Hawaii, fall 2012, and spring and summer 2013.
Na Pua Makani Seabird and Bat Study 6
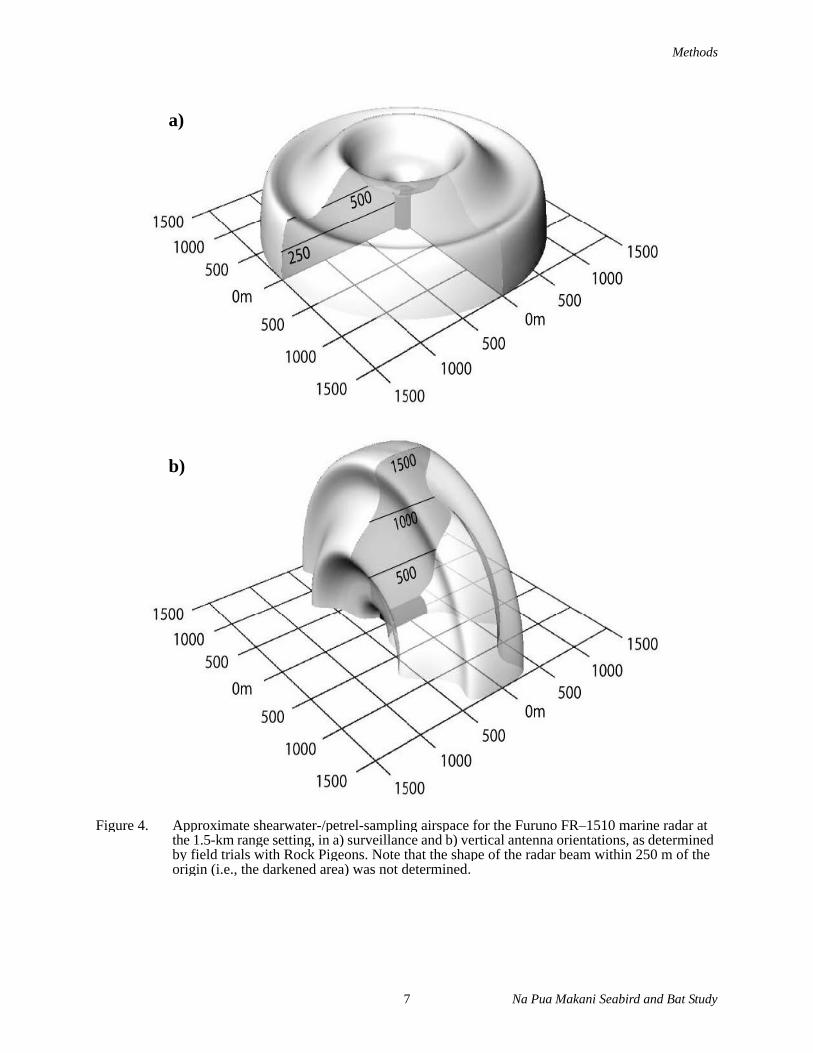
Methods
a)
b)
Figure 4. Approximate shearwater-/petrel-sampling airspace for the Furuno FR–1510 marine radar at the 1.5-km range setting, in a) surveillance and b) vertical antenna orientations, as determined by field trials with Rock Pigeons. Note that the shape of the radar beam within 250 m of the origin (i.e., the darkened area) was not determined.
7 Na Pua Makani Seabird and Bat Study
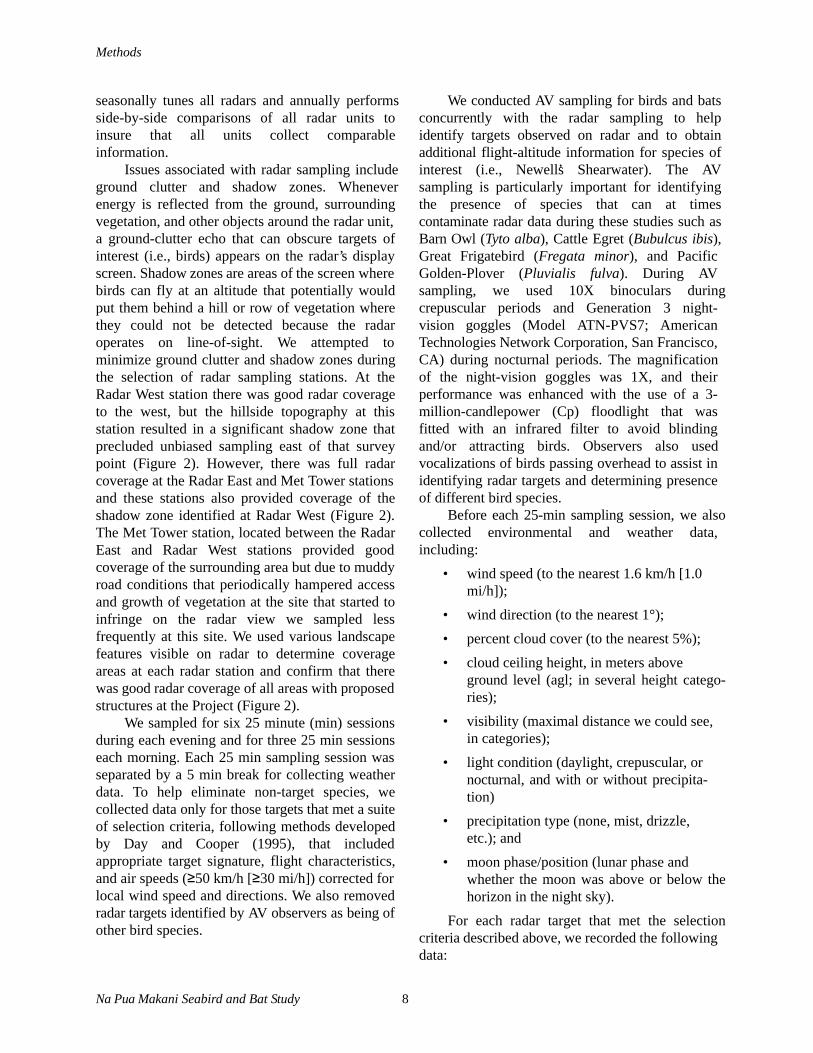
Methods
seasonally tunes all radars and annually performs side-by-side comparisons of all radar units toinsure that all units collect comparableinformation.
Issues associated with radar sampling include ground clutter and shadow zones. Whenever energy is reflected from the ground, surroundingvegetation, and other objects around the radar unit,a ground-clutter echo that can obscure targets of interest (i.e., birds) appears on the radar’s display screen. Shadow zones are areas of the screen where birds can fly at an altitude that potentially would put them behind a hill or row of vegetation where they could not be detected because the radar operates on line-of-sight. We attempted to minimize ground clutter and shadow zones during the selection of radar sampling stations. At the Radar West station there was good radar coverage to the west, but the hillside topography at this station resulted in a significant shadow zone that precluded unbiased sampling east of that survey point (Figure 2). However, there was full radar coverage at the Radar East and Met Tower stations and these stations also provided coverage of the shadow zone identified at Radar West (Figure 2). The Met Tower station, located between the Radar East and Radar West stations provided good coverage of the surrounding area but due to muddy road conditions that periodically hampered access and growth of vegetation at the site that started to infringe on the radar view we sampled less frequently at this site. We used various landscape features visible on radar to determine coverage areas at each radar station and confirm that there was good radar coverage of all areas with proposedstructures at the Project (Figure 2).
We sampled for six 25 minute (min) sessions during each evening and for three 25 min sessions each morning. Each 25 min sampling session was separated by a 5 min break for collecting weather data. To help eliminate non-target species, we collected data only for those targets that met a suite of selection criteria, following methods developed by Day and Cooper (1995), that included appropriate target signature, flight characteristics, and air speeds (≥50 km/h [≥30 mi/h]) corrected for local wind speed and directions. We also removed radar targets identified by AV observers as being of other bird species.
Na Pua Makani Seabird and Bat Study 8
We conducted AV sampling for birds and bats concurrently with the radar sampling to help identify targets observed on radar and to obtain additional flight-altitude information for species of interest (i.e., Newell’s Shearwater). The AV sampling is particularly important for identifying the presence of species that can at times contaminate radar data during these studies such as Barn Owl (Tyto alba), Cattle Egret (Bubulcus ibis), Great Frigatebird (Fregata minor), and PacificGolden-Plover (Pluvialis fulva). During AVsampling, we used 10X binoculars during crepuscular periods and Generation 3 night-vision goggles (Model ATN-PVS7; AmericanTechnologies Network Corporation, San Francisco, CA) during nocturnal periods. The magnification of the night-vision goggles was 1X, and their performance was enhanced with the use of a 3- million-candlepower (Cp) floodlight that was fitted with an infrared filter to avoid blinding and/or attracting birds. Observers also used vocalizations of birds passing overhead to assist inidentifying radar targets and determining presenceof different bird species.
Before each 25-min sampling session, we also collected environmental and weather data,including:
• wind speed (to the nearest 1.6 km/h [1.0 mi/h]);
• wind direction (to the nearest 1°);• percent cloud cover (to the nearest 5%);• cloud ceiling height, in meters above
ground level (agl; in several height catego- ries);
• visibility (maximal distance we could see, in categories);
• light condition (daylight, crepuscular, or nocturnal, and with or without precipita- tion)
• precipitation type (none, mist, drizzle, etc.); and
• moon phase/position (lunar phase and whether the moon was above or below the horizon in the night sky).
For each radar target that met the selection criteria described above, we recorded the followingdata:
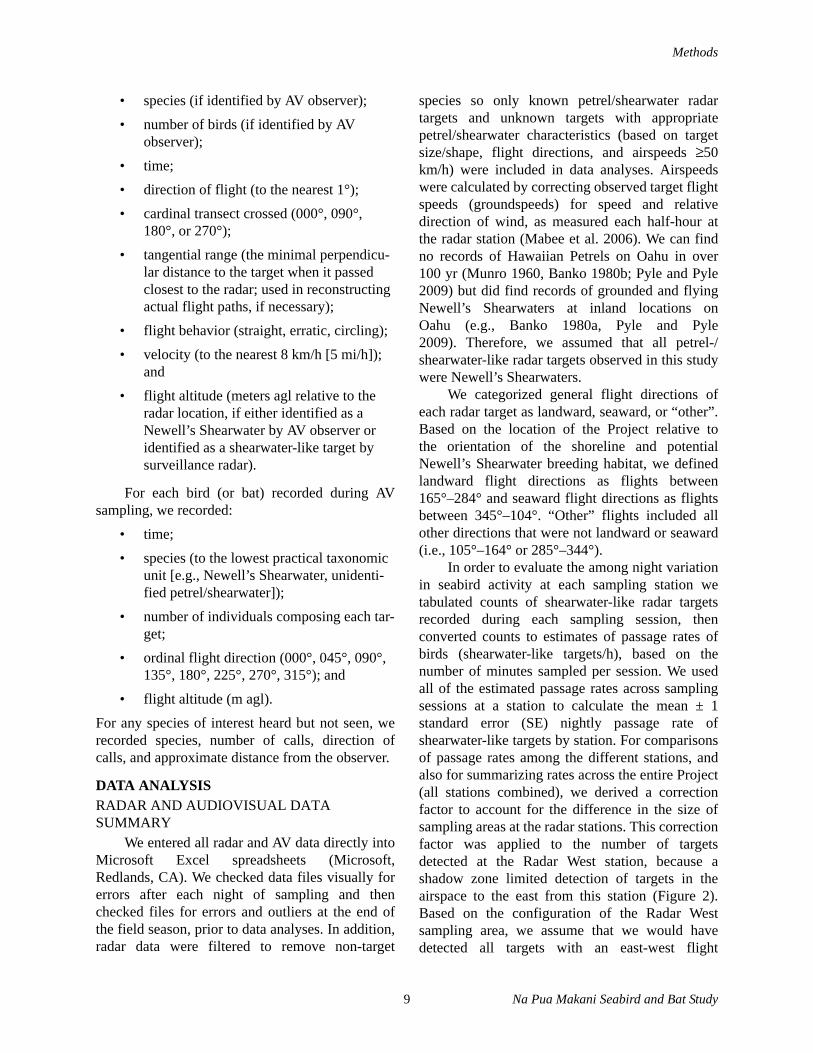
Methods
9 Na Pua Makani Seabird and Bat Study
• species (if identified by AV observer);• number of birds (if identified by AV
observer);• time;• direction of flight (to the nearest 1°);• cardinal transect crossed (000°, 090°,
180°, or 270°);• tangential range (the minimal perpendicu-
lar distance to the target when it passed closest to the radar; used in reconstructing actual flight paths, if necessary);
• flight behavior (straight, erratic, circling);• velocity (to the nearest 8 km/h [5 mi/h]);
and• flight altitude (meters agl relative to the
radar location, if either identified as a Newell’s Shearwater by AV observer or identified as a shearwater-like target by surveillance radar).
For each bird (or bat) recorded during AVsampling, we recorded:
• time;• species (to the lowest practical taxonomic
unit [e.g., Newell’s Shearwater, unidenti-fied petrel/shearwater]);
• number of individuals composing each tar-get;
• ordinal flight direction (000°, 045°, 090°, 135°, 180°, 225°, 270°, 315°); and
• flight altitude (m agl).For any species of interest heard but not seen, werecorded species, number of calls, direction ofcalls, and approximate distance from the observer.
DATA ANALYSISRADAR AND AUDIOVISUAL DATA SUMMARY
We entered all radar and AV data directly intoMicrosoft Excel spreadsheets (Microsoft,Redlands, CA). We checked data files visually forerrors after each night of sampling and thenchecked files for errors and outliers at the end ofthe field season, prior to data analyses. In addition,radar data were filtered to remove non-target
species so only known petrel/shearwater radartargets and unknown targets with appropriatepetrel/shearwater characteristics (based on targetsize/shape, flight directions, and airspeeds ≥50km/h) were included in data analyses. Airspeedswere calculated by correcting observed target flightspeeds (groundspeeds) for speed and relativedirection of wind, as measured each half-hour atthe radar station (Mabee et al. 2006). We can findno records of Hawaiian Petrels on Oahu in over100 yr (Munro 1960, Banko 1980b; Pyle and Pyle2009) but did find records of grounded and flyingNewell’s Shearwaters at inland locations onOahu (e.g., Banko 1980a, Pyle and Pyle2009). Therefore, we assumed that all petrel-/shearwater-like radar targets observed in this studywere Newell’s Shearwaters.
We categorized general flight directions ofeach radar target as landward, seaward, or “other”.Based on the location of the Project relative tothe orientation of the shoreline and potentialNewell’s Shearwater breeding habitat, we definedlandward flight directions as flights between165°–284° and seaward flight directions as flightsbetween 345°–104°. “Other” flights included allother directions that were not landward or seaward(i.e., 105°–164° or 285°–344°).
In order to evaluate the among night variationin seabird activity at each sampling station wetabulated counts of shearwater-like radar targetsrecorded during each sampling session, thenconverted counts to estimates of passage rates ofbirds (shearwater-like targets/h), based on thenumber of minutes sampled per session. We usedall of the estimated passage rates across samplingsessions at a station to calculate the mean ± 1standard error (SE) nightly passage rate ofshearwater-like targets by station. For comparisonsof passage rates among the different stations, andalso for summarizing rates across the entire Project(all stations combined), we derived a correctionfactor to account for the difference in the size ofsampling areas at the radar stations. This correctionfactor was applied to the number of targetsdetected at the Radar West station, because ashadow zone limited detection of targets in theairspace to the east from this station (Figure 2).Based on the configuration of the Radar Westsampling area, we assume that we would havedetected all targets with an east-west flight
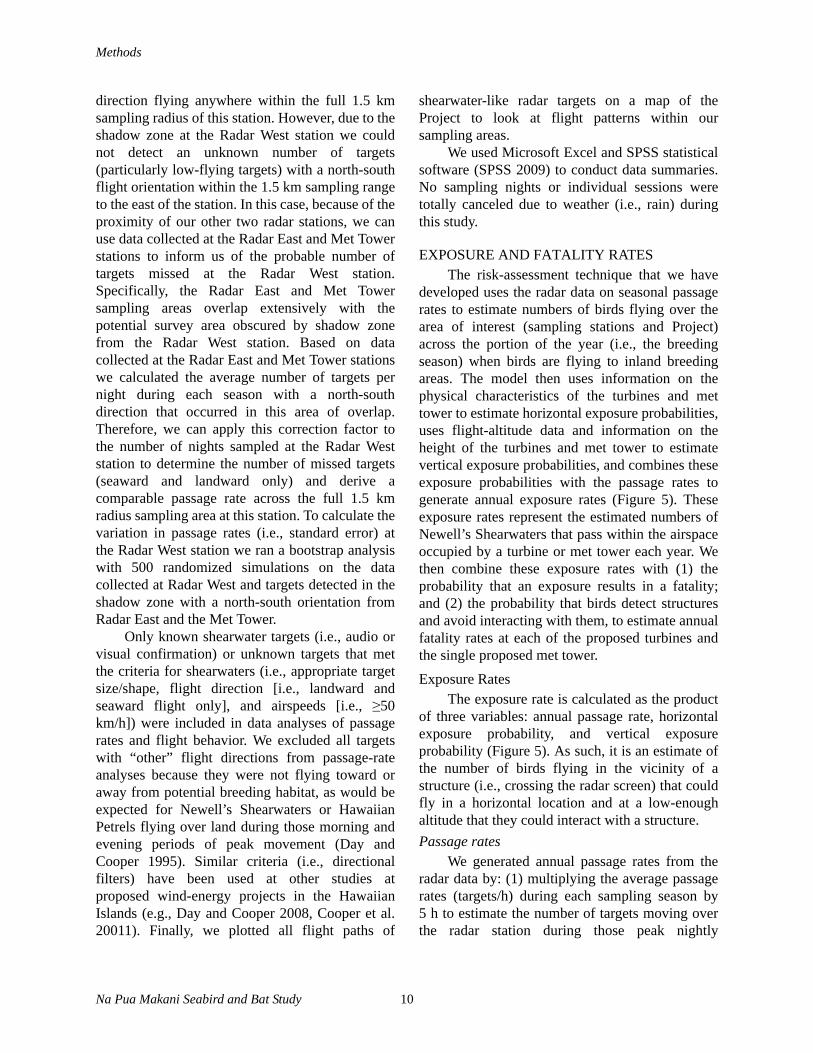
Methods
Na Pua Makani Seabird and Bat Study 10
direction flying anywhere within the full 1.5 kmsampling radius of this station. However, due to theshadow zone at the Radar West station we couldnot detect an unknown number of targets(particularly low-flying targets) with a north-southflight orientation within the 1.5 km sampling rangeto the east of the station. In this case, because of theproximity of our other two radar stations, we canuse data collected at the Radar East and Met Towerstations to inform us of the probable number oftargets missed at the Radar West station.Specifically, the Radar East and Met Towersampling areas overlap extensively with thepotential survey area obscured by shadow zonefrom the Radar West station. Based on datacollected at the Radar East and Met Tower stationswe calculated the average number of targets pernight during each season with a north-southdirection that occurred in this area of overlap.Therefore, we can apply this correction factor tothe number of nights sampled at the Radar Weststation to determine the number of missed targets(seaward and landward only) and derive acomparable passage rate across the full 1.5 kmradius sampling area at this station. To calculate thevariation in passage rates (i.e., standard error) atthe Radar West station we ran a bootstrap analysiswith 500 randomized simulations on the datacollected at Radar West and targets detected in theshadow zone with a north-south orientation fromRadar East and the Met Tower.
Only known shearwater targets (i.e., audio orvisual confirmation) or unknown targets that metthe criteria for shearwaters (i.e., appropriate targetsize/shape, flight direction [i.e., landward andseaward flight only], and airspeeds [i.e., ≥50km/h]) were included in data analyses of passagerates and flight behavior. We excluded all targetswith “other” flight directions from passage-rateanalyses because they were not flying toward oraway from potential breeding habitat, as would beexpected for Newell’s Shearwaters or HawaiianPetrels flying over land during those morning andevening periods of peak movement (Day andCooper 1995). Similar criteria (i.e., directionalfilters) have been used at other studies atproposed wind-energy projects in the HawaiianIslands (e.g., Day and Cooper 2008, Cooper et al.20011). Finally, we plotted all flight paths of
shearwater-like radar targets on a map of theProject to look at flight patterns within oursampling areas.
We used Microsoft Excel and SPSS statisticalsoftware (SPSS 2009) to conduct data summaries.No sampling nights or individual sessions weretotally canceled due to weather (i.e., rain) duringthis study.
EXPOSURE AND FATALITY RATESThe risk-assessment technique that we have
developed uses the radar data on seasonal passagerates to estimate numbers of birds flying over thearea of interest (sampling stations and Project)across the portion of the year (i.e., the breedingseason) when birds are flying to inland breedingareas. The model then uses information on thephysical characteristics of the turbines and mettower to estimate horizontal exposure probabilities,uses flight-altitude data and information on theheight of the turbines and met tower to estimatevertical exposure probabilities, and combines theseexposure probabilities with the passage rates togenerate annual exposure rates (Figure 5). Theseexposure rates represent the estimated numbers ofNewell’s Shearwaters that pass within the airspaceoccupied by a turbine or met tower each year. Wethen combine these exposure rates with (1) theprobability that an exposure results in a fatality;and (2) the probability that birds detect structuresand avoid interacting with them, to estimate annualfatality rates at each of the proposed turbines andthe single proposed met tower. Exposure Rates
The exposure rate is calculated as the productof three variables: annual passage rate, horizontalexposure probability, and vertical exposureprobability (Figure 5). As such, it is an estimate ofthe number of birds flying in the vicinity of astructure (i.e., crossing the radar screen) that couldfly in a horizontal location and at a low-enoughaltitude that they could interact with a structure.Passage rates
We generated annual passage rates from theradar data by: (1) multiplying the average passagerates (targets/h) during each sampling season by5 h to estimate the number of targets moving overthe radar station during those peak nightly
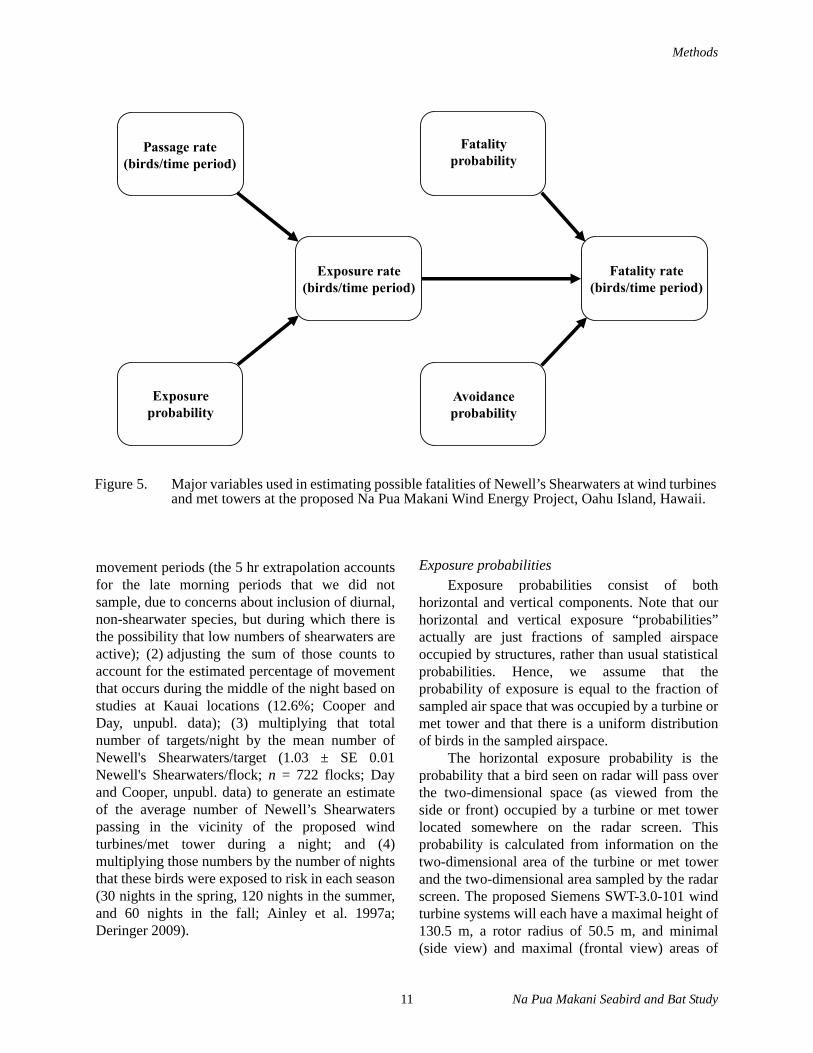
Methods
11 Na Pua Makani Seabird and Bat Study
movement periods (the 5 hr extrapolation accountsfor the late morning periods that we did notsample, due to concerns about inclusion of diurnal,non-shearwater species, but during which there isthe possibility that low numbers of shearwaters areactive); (2) adjusting the sum of those counts toaccount for the estimated percentage of movementthat occurs during the middle of the night based onstudies at Kauai locations (12.6%; Cooper andDay, unpubl. data); (3) multiplying that totalnumber of targets/night by the mean number ofNewell's Shearwaters/target (1.03 ± SE 0.01Newell's Shearwaters/flock; n = 722 flocks; Dayand Cooper, unpubl. data) to generate an estimateof the average number of Newell’s Shearwaterspassing in the vicinity of the proposed windturbines/met tower during a night; and (4)multiplying those numbers by the number of nightsthat these birds were exposed to risk in each season(30 nights in the spring, 120 nights in the summer,and 60 nights in the fall; Ainley et al. 1997a;Deringer 2009).
Exposure probabilitiesExposure probabilities consist of both
horizontal and vertical components. Note that ourhorizontal and vertical exposure “probabilities”actually are just fractions of sampled airspaceoccupied by structures, rather than usual statisticalprobabilities. Hence, we assume that theprobability of exposure is equal to the fraction ofsampled air space that was occupied by a turbine ormet tower and that there is a uniform distributionof birds in the sampled airspace.
The horizontal exposure probability is theprobability that a bird seen on radar will pass overthe two-dimensional space (as viewed from theside or front) occupied by a turbine or met towerlocated somewhere on the radar screen. Thisprobability is calculated from information on thetwo-dimensional area of the turbine or met towerand the two-dimensional area sampled by the radarscreen. The proposed Siemens SWT-3.0-101 windturbine systems will each have a maximal height of130.5 m, a rotor radius of 50.5 m, and minimal(side view) and maximal (frontal view) areas of
Figure 5. Major variables used in estimating possible fatalities of Newell’s Shearwaters at wind turbines and met towers at the proposed Na Pua Makani Wind Energy Project, Oahu Island, Hawaii.
Passage rate (birds/time period)
Exposure rate (birds/time period)
Fatality rate (birds/time period)
Fatality probability
Exposure probability
Avoidance probability
Methods
Na Pua Makani Seabird and Bat Study 12
783 m² and 8,189 m². The proposed met towerconsists of a central lattice tower with a face widthtapering from 6.7 to 0.6 m and a side-view area of235 m². The ensuing ratio of the cross-sectionalarea of the turbines or met tower to the cross-sectional area sampled by the radar (3 km diametertimes the height of the structure) indicates theprobability of interacting with (i.e., flying over theairspace occupied by) the turbines or met tower.
The vertical exposure probability is theprobability that a bird seen on radar will be flyingat an altitude low enough that it actually might passthrough the airspace occupied by a structure (i.e.,wind turbine or met tower) located somewhere onthe radar screen. This probability is calculatedfrom data on flight altitudes and from informationon the height of the structures. In this case weprovide inputs from two different sources ofinformation and therefore two separate calculationsfor the percentage of shearwaters with flightaltitudes ≤130.5 for turbines and ≤80 m agl for themet tower. For one input we used flight altitudedata from visual observations of Newell'sShearwaters from throughout the Hawaiian Islands(n = 714 birds; ABR, unpubl. data) to calculate that66.4% and 42.4% of Newell’s Shearwaters fly at orbelow the maximal height of the proposed turbinesand met tower respectively. The large sample sizeof this data set is compelling but it does notrepresent site-specific data. In contrast, the otherinput used flight altitude data from vertical radarobservations of shearwater-like targets and visualobservations collected during the current study (n =24 targets) to calculate that 45.8% and 16.7% ofNewell’s Shearwaters fly at or below the maximalheight of the proposed turbines and met towerrespectively. Although site-specific data isgenerally preferred it must be recognized that thecurrent sample size of observations from the NaPua Makani Project is relatively small. Therefore,at this time we include altitude inputs from bothoff-site visual data and on-site radar and visual datato provide a range of values. Fatality Rates
As previously stated, the annual estimatedfatality rate is calculated as the product of: (1) theexposure rate; (2) the fatality probability; and (3)the avoidance probability.
Fatality probabilityThe estimate of the fatality-probability portion
of the fatality-rate formula is derived as the productof: (1) the probability of a shearwater collidingwith a wind turbine or met tower if the bird entersthe airspace occupied by either of these structures(i.e., are there gaps big enough for birds to flythrough the structure without hitting any part ofit?); and (2) the probability of dying if it collideswith the wind turbine (including blades) or mettower structure. The former probability is neededbecause the estimates of horizontal-interactionprobability are calculated as if the wind turbinesand lattice met tower are solid structures, whereasthe latter is an estimate of the probability ofcollision-caused fatality after a bird collided with astructure. Because any collision with a met toweror wind turbine falls under the ESA definition of“take,” we used an estimate of 100% for thisfatality-probability parameter; however, note thatthe actual probability of fatality resulting from acollision is less than 100% because a bird can hit awind turbine or met tower frame and not die (e.g., abird could brush a wingtip but avoid injury/death).
The probability of striking a structure needsto be calculated differently for the proposedturbines and met tower. In the met tower design,the tower frame is a lattice structure. Hence, weconservatively assumed that the probability ofhitting the met tower if the bird enters the airspacewas 100%. Similarly, a bird approaching a windturbine from the side has essentially a 100%probability of hitting the monopole tower or aturbine blade. In contrast, a bird approaching fromthe back or front of a turbine may pass through therotor-swept area without colliding with a blade.Therefore we calculated the probability of collisionfor this “frontal” bird approach based upon thelength of a Newell’s Shearwater (33 centimeters[cm]; Pratt et al. 1987); the average groundspeed ofNewell’s Shearwaters on the Hawaiian Islands(mean velocity = 36.4 mi/h [58.6 km/h]; n = 28identified Newell’s Shearwater targets; Day andCooper, unpubl. data) and the time that it wouldtake a 33-cm-long shearwater to travel completelythrough a 2-m-wide turbine blade spinning at itsmaximal rotor speed (16 revolutions/min for theSWT-3.0-101 turbines); also see Tucker (1996).These calculations indicated that up to 15.2% of
Results
13 Na Pua Makani Seabird and Bat Study
the disk of the rotor-swept area would beoccupied by a blade sometime during the lengthof time (0.14 seconds) that it would take a Newell’sShearwater to fly completely past a rotor blade(i.e., to fly 2.33 m).Avoidance probability
The avoidance rate is the probability that abird will see a structure (e.g., turbine or met tower)and change flight direction, flight altitude, orboth, so that it completely avoids flying throughthe space occupied by the structure. Becauseavoidance rates are largely unknown, we presentfatality estimates for a conservative range ofprobabilities of collision avoidance by thesebirds by assuming that 90%, 95%, or 99% ofall Newell’s Shearwaters flying near a windturbine or met tower structure will detect and avoidit. See Discussion for explanation of avoidancerates used.
RESULTS
RADAR OBSERVATIONS
MOVEMENT RATESDuring our 11 survey nights in fall 2012, we
observed 10 landward-flying and 6 seaward-flyingradar targets that fit our criteria for shearwater-liketargets (Appendix 1, Figure 6). We also recorded74 targets headed in “other” directions andtherefore not classified as shearwater-like targets.During our 12 survey nights in spring 2013 weobserved 10 landward-flying and 10 seaward-flying shearwater-like radar targets (Appendix 2,Figure 7) with 42 targets headed in “other”directions. Finally, during our 12 survey nights insummer 2013 we observed 12 landward-flying and2 seaward-flying shearwater-like targets (Appendix3, Figure 8) with 70 targets headed in “other”directions.
The mean corrected nightly passage rates ofshearwater-like targets (i.e., landward and seawardrates combined) during fall 2012 were 0.31 ± 0.12targets/h at the Radar West station (n = 5 nights),0.54 ± 0.17 targets/h at the Radar East station (n =6 nights), and 0.43 ± 0.09 targets/h at both stationscombined (Table 2). The mean corrected nightlypassage rates of shearwater-like targets wereslightly higher during spring 2013 with 0.50 ± 0.11targets/h at the Radar West station (n = 5 nights),
0.59 ± 0.20 targets/h at the Radar East station (n =5nights), 0.40 ± 0.13 targets/h at the Met Towerstation (n =2 nights), and 0.52 ± 0.09 targets/h atall stations combined (Table 2). In contrast, thelowest seasonal mean corrected nightly passagerates of shearwater-like targets was during summer2013 with 0.22 ± 0.11 targets/h at the Radar Weststation (n = 6 nights), 0.48 ± 0.16 targets/h at theRadar East station (n =5 nights), 0.27 targets/h atthe Met Tower station (n =1 nights) and 0.34 ± 0.09targets/h at all stations combined (Table 2). Wefound no consistent differences between eveningand morning periods in mean movement rates.
We observed similar passage rates oflandward-flying and seaward-flying shearwater-like targets during fall 2012 and spring 2013 (Table2, Appendices 1–2). In contrast, during summer2013 we saw higher passage rates of landwardversus seaward targets (Table 2, Appendix 3). Anassessment of landward and seaward flight pathsand trajectories at each station does not indicate adistinct flight corridor or concentration point overany particular portion of the Project (Figures 6–8).
AUDIOVISUAL OBSERVATIONSWe did not hear or observe any Hawaiian
Petrels, Newell's Shearwaters, or Hawaiian hoarybats during our 11 nights of AV sampling in fall2012 and 12 nights of AV sampling in spring 2013(Appendices 1–2). However, during summer 2013we observed a single unidentified shearwater orpetrel that flew over the Radar West station at analtitude of 55 m agl during the early morningsampling period on 14 June (Appendix 3). The birdwas gliding the entire duration of the briefobservation. Thus, we were unable to determinewith certainty that the bird was a Newell’sShearwater or another shearwater/petrel species,but Wedge-tailed Shearwater (Puffinus pacificus)was ruled out based on the silhouette of the bird. Inconclusion, because of the location relative to theranges of other petrel/shearwater species webelieve that the most likely identity of the targetwas a Newell’s Shearwater, but other remotepossibilities include Christmas Shearwater(Puffinus navitatas), Hawiian Petrel, and JuanFernandez Petrel (Pterodroma externa). Dependingon the season, other species of interest that weobserved during AV sampling included BarnOwl, Black-crowned Night Heron (Nycticorax

Results
Na Pua Makani Seabird and Bat Study 14
Figu
re 6
.Fl
ight
pat
hs o
f she
arw
ater
-like
(i.e
., la
ndw
ard
and
seaw
ard)
rada
r tar
gets
obs
erve
d du
ring
11 n
ight
s in
fall
2012
at t
he p
ropo
sed
Na
Pua
Mak
ani W
ind
Ener
gy P
roje
ct, O
ahu
Isla
nd, H
awai
i.
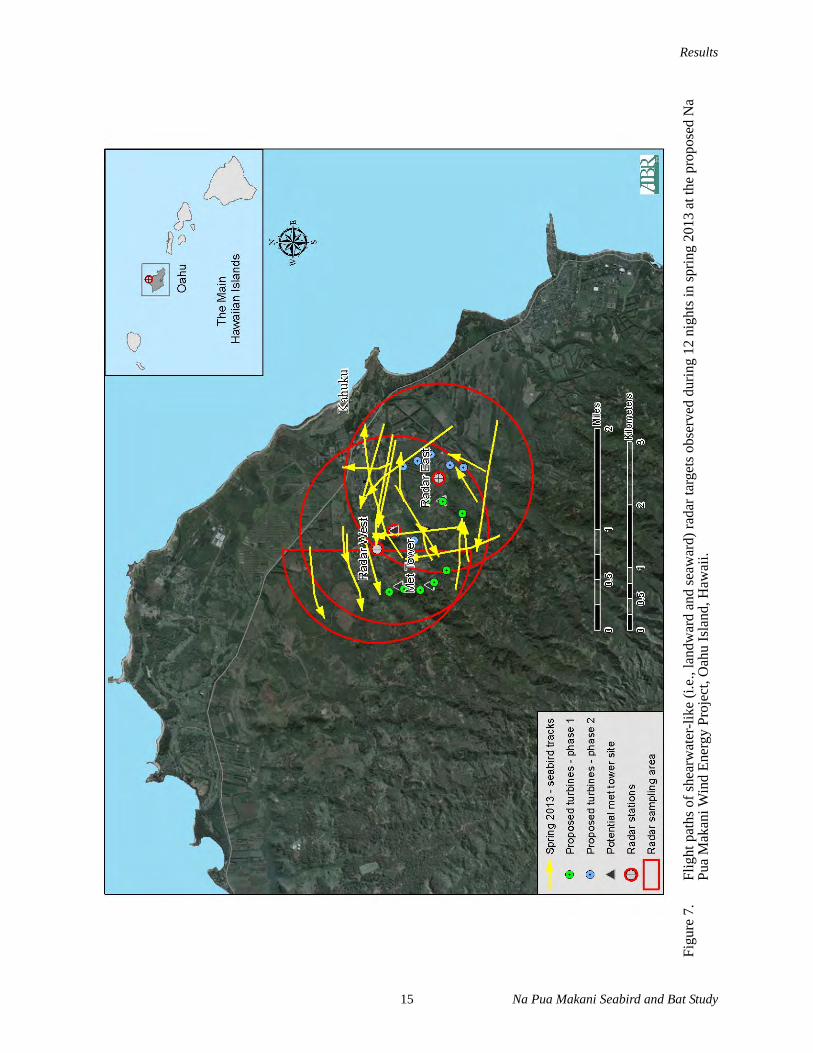
Results
15 Na Pua Makani Seabird and Bat Study
Figu
re 7
.Fl
ight
pat
hs o
f she
arw
ater
-like
(i.e
., la
ndw
ard
and
seaw
ard)
rada
r tar
gets
obs
erve
d du
ring
12 n
ight
s in
sprin
g 20
13 a
t the
pro
pose
d N
a Pu
a M
akan
i Win
d En
ergy
Pro
ject
, Oah
u Is
land
, Haw
aii.
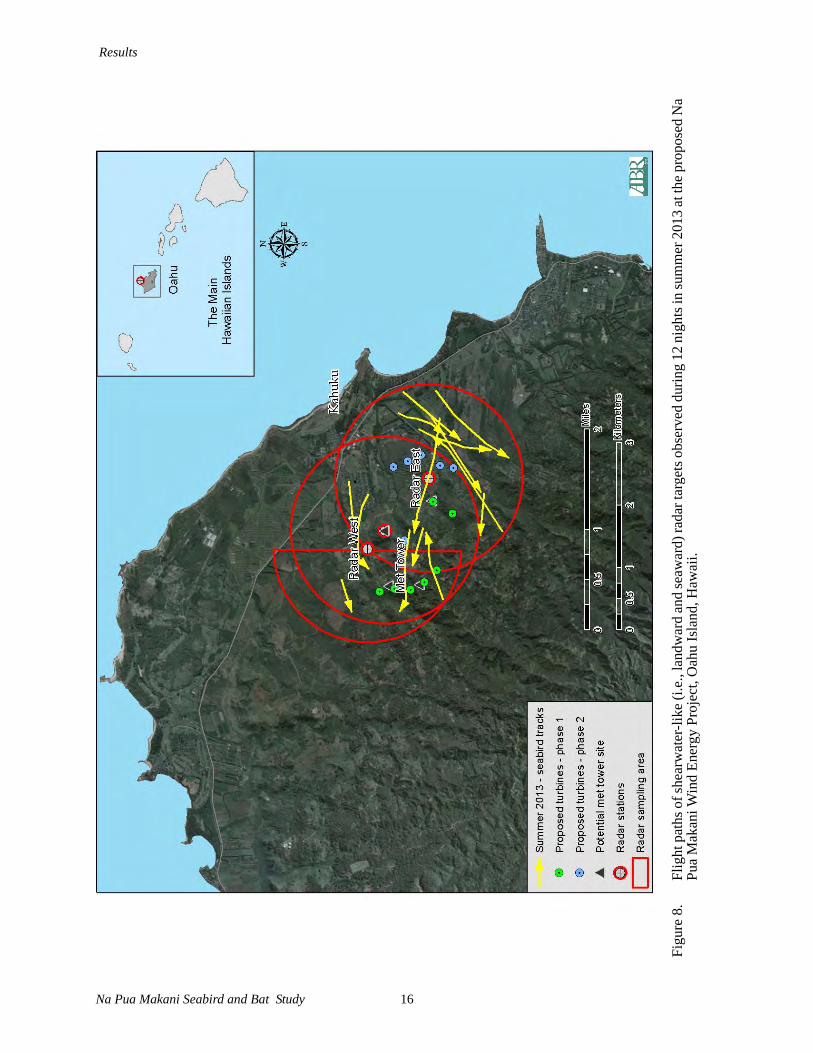
Results
Na Pua Makani Seabird and Bat Study 16
Figu
re 8
.Fl
ight
pat
hs o
f she
arw
ater
-like
(i.e
., la
ndw
ard
and
seaw
ard)
rada
r tar
gets
obs
erve
d du
ring
12 n
ight
s in
sum
mer
201
3 at
the
prop
osed
Na
Pua
Mak
ani W
ind
Ener
gy P
roje
ct, O
ahu
Isla
nd, H
awai
i.
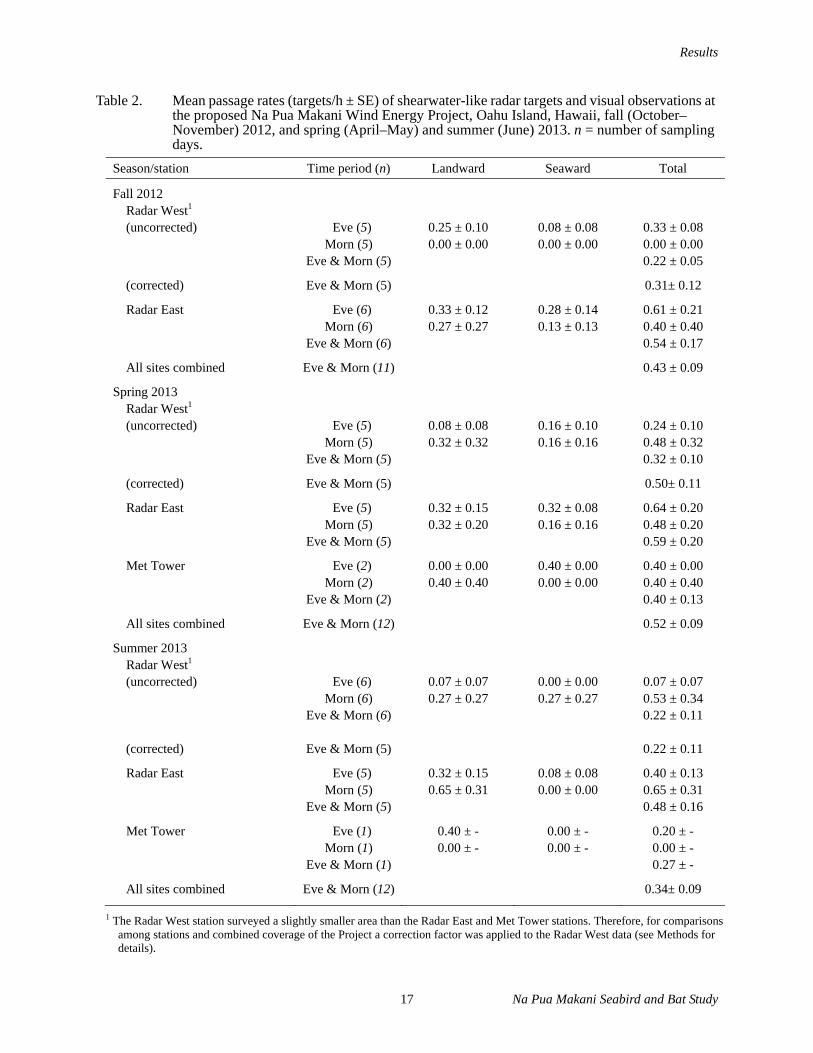
Results
17 Na Pua Makani Seabird and Bat Study
Table 2. Mean passage rates (targets/h ± SE) of shearwater-like radar targets and visual observations at the proposed Na Pua Makani Wind Energy Project, Oahu Island, Hawaii, fall (October– November) 2012, and spring (April–May) and summer (June) 2013. n = number of sampling days.
Season/station Time period (n) Landward Seaward Total
Fall 2012 Radar West1 (uncorrected) Eve (5) 0.25 ± 0.10 0.08 ± 0.08 0.33 ± 0.08 Morn (5) 0.00 ± 0.00 0.00 ± 0.00 0.00 ± 0.00 Eve & Morn (5) 0.22 ± 0.05
(corrected) Eve & Morn (5) 0.31± 0.12
Radar East Eve (6) 0.33 ± 0.12 0.28 ± 0.14 0.61 ± 0.21 Morn (6) 0.27 ± 0.27 0.13 ± 0.13 0.40 ± 0.40 Eve & Morn (6) 0.54 ± 0.17
All sites combined Eve & Morn (11) 0.43 ± 0.09
Spring 2013 Radar West1 (uncorrected) Eve (5) 0.08 ± 0.08 0.16 ± 0.10 0.24 ± 0.10 Morn (5) 0.32 ± 0.32 0.16 ± 0.16 0.48 ± 0.32 Eve & Morn (5) 0.32 ± 0.10
(corrected) Eve & Morn (5) 0.50± 0.11
Radar East Eve (5) 0.32 ± 0.15 0.32 ± 0.08 0.64 ± 0.20 Morn (5) 0.32 ± 0.20 0.16 ± 0.16 0.48 ± 0.20 Eve & Morn (5) 0.59 ± 0.20
Met Tower Eve (2) 0.00 ± 0.00 0.40 ± 0.00 0.40 ± 0.00 Morn (2) 0.40 ± 0.40 0.00 ± 0.00 0.40 ± 0.40 Eve & Morn (2) 0.40 ± 0.13
All sites combined Eve & Morn (12) 0.52 ± 0.09
Summer 2013 Radar West1 (uncorrected) Eve (6) 0.07 ± 0.07 0.00 ± 0.00 0.07 ± 0.07 Morn (6) 0.27 ± 0.27 0.27 ± 0.27 0.53 ± 0.34 Eve & Morn (6) 0.22 ± 0.11 (corrected) Eve & Morn (5) 0.22 ± 0.11
Radar East Eve (5) 0.32 ± 0.15 0.08 ± 0.08 0.40 ± 0.13 Morn (5) 0.65 ± 0.31 0.00 ± 0.00 0.65 ± 0.31 Eve & Morn (5) 0.48 ± 0.16
Met Tower Eve (1) 0.40 ± - 0.00 ± - 0.20 ± - Morn (1) 0.00 ± - 0.00 ± - 0.00 ± - Eve & Morn (1) 0.27 ± -
All sites combined Eve & Morn (12) 0.34± 0.09
1 The Radar West station surveyed a slightly smaller area than the Radar East and Met Tower stations. Therefore, for comparisonsamong stations and combined coverage of the Project a correction factor was applied to the Radar West data (see Methods for details).
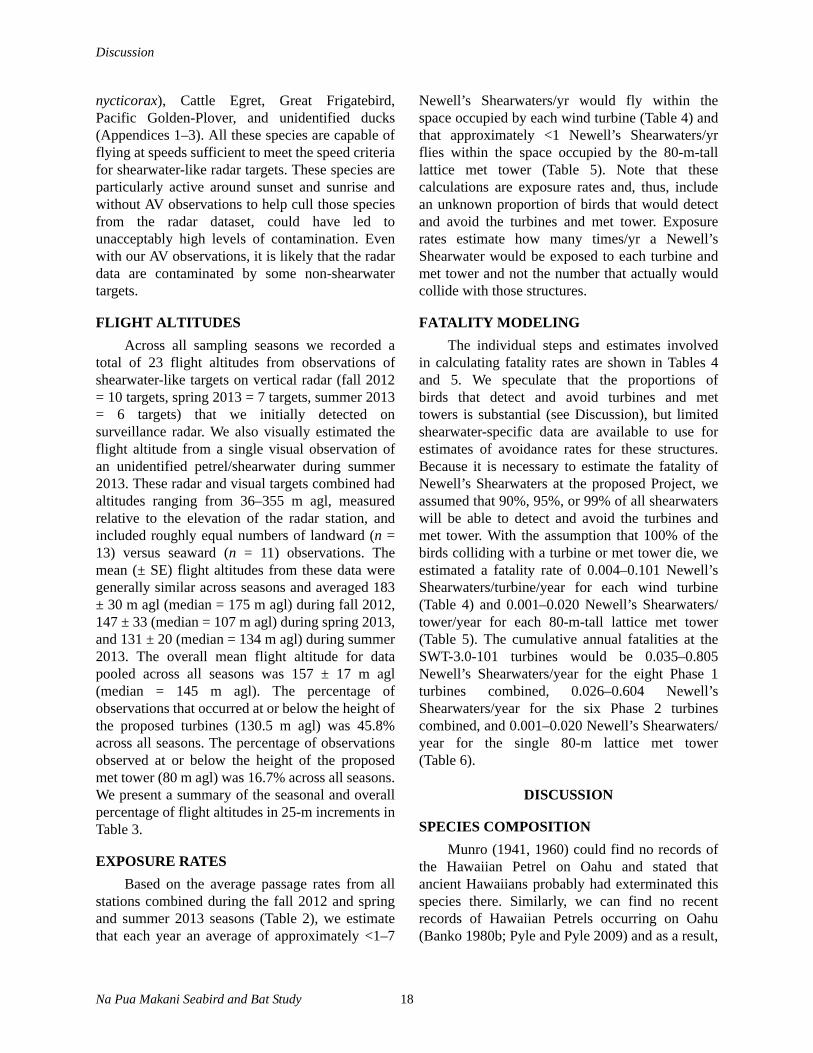
Discussion
Na Pua Makani Seabird and Bat Study 18
nycticorax), Cattle Egret, Great Frigatebird,Pacific Golden-Plover, and unidentified ducks(Appendices 1–3). All these species are capable offlying at speeds sufficient to meet the speed criteriafor shearwater-like radar targets. These species areparticularly active around sunset and sunrise andwithout AV observations to help cull those speciesfrom the radar dataset, could have led tounacceptably high levels of contamination. Evenwith our AV observations, it is likely that the radardata are contaminated by some non-shearwatertargets.
FLIGHT ALTITUDESAcross all sampling seasons we recorded a
total of 23 flight altitudes from observations ofshearwater-like targets on vertical radar (fall 2012= 10 targets, spring 2013 = 7 targets, summer 2013= 6 targets) that we initially detected onsurveillance radar. We also visually estimated theflight altitude from a single visual observation ofan unidentified petrel/shearwater during summer2013. These radar and visual targets combined hadaltitudes ranging from 36–355 m agl, measuredrelative to the elevation of the radar station, andincluded roughly equal numbers of landward (n =13) versus seaward (n = 11) observations. Themean (± SE) flight altitudes from these data weregenerally similar across seasons and averaged 183± 30 m agl (median = 175 m agl) during fall 2012,147 ± 33 (median = 107 m agl) during spring 2013,and 131 ± 20 (median = 134 m agl) during summer2013. The overall mean flight altitude for datapooled across all seasons was 157 ± 17 m agl(median = 145 m agl). The percentage ofobservations that occurred at or below the height ofthe proposed turbines (130.5 m agl) was 45.8%across all seasons. The percentage of observationsobserved at or below the height of the proposedmet tower (80 m agl) was 16.7% across all seasons.We present a summary of the seasonal and overallpercentage of flight altitudes in 25-m increments inTable 3.
EXPOSURE RATESBased on the average passage rates from all
stations combined during the fall 2012 and springand summer 2013 seasons (Table 2), we estimatethat each year an average of approximately <1–7
Newell’s Shearwaters/yr would fly within thespace occupied by each wind turbine (Table 4) andthat approximately <1 Newell’s Shearwaters/yrflies within the space occupied by the 80-m-talllattice met tower (Table 5). Note that thesecalculations are exposure rates and, thus, includean unknown proportion of birds that would detectand avoid the turbines and met tower. Exposurerates estimate how many times/yr a Newell’sShearwater would be exposed to each turbine andmet tower and not the number that actually wouldcollide with those structures.
FATALITY MODELINGThe individual steps and estimates involved
in calculating fatality rates are shown in Tables 4and 5. We speculate that the proportions ofbirds that detect and avoid turbines and mettowers is substantial (see Discussion), but limitedshearwater-specific data are available to use forestimates of avoidance rates for these structures.Because it is necessary to estimate the fatality ofNewell’s Shearwaters at the proposed Project, weassumed that 90%, 95%, or 99% of all shearwaterswill be able to detect and avoid the turbines andmet tower. With the assumption that 100% of thebirds colliding with a turbine or met tower die, weestimated a fatality rate of 0.004–0.101 Newell’sShearwaters/turbine/year for each wind turbine(Table 4) and 0.001–0.020 Newell’s Shearwaters/tower/year for each 80-m-tall lattice met tower(Table 5). The cumulative annual fatalities at theSWT-3.0-101 turbines would be 0.035–0.805Newell’s Shearwaters/year for the eight Phase 1turbines combined, 0.026–0.604 Newell’sShearwaters/year for the six Phase 2 turbinescombined, and 0.001–0.020 Newell’s Shearwaters/year for the single 80-m lattice met tower(Table 6).
DISCUSSION
SPECIES COMPOSITIONMunro (1941, 1960) could find no records of
the Hawaiian Petrel on Oahu and stated thatancient Hawaiians probably had exterminated thisspecies there. Similarly, we can find no recentrecords of Hawaiian Petrels occurring on Oahu(Banko 1980b; Pyle and Pyle 2009) and as a result,
Discussion
19 Na Pua Makani Seabird and Bat Study
as stated previously, we assumed this species nolonger occurs on Oahu.
In contrast, Newell's Shearwaters have beenrecorded on Oahu in the past 60 yr, with multiplerecords that suggest a high probability of nesting(Pyle and Pyle 2009). For instance, there arerecords of Newell's Shearwaters on Oahuincluding: the Aiea area on 27 May, 1954(Richardson 1955) and 26 May and 2 and 5 June,1990 (Pyle 1990); and the Honolulu Airport and inHonolulu itself on 7 August, 1959 (Hatch 1959,cited in Banko 1980a), on 3 July, 1961 (King andGould 1967; Carpenter et al. 1962, cited in Banko1980a), somewhere between 1973 and 1975(Banko 1980a), and on 19 July, 1985 (Pyle 1986).
Importantly, there are a number of historicalrecords dating from the 1960s to 2008 of Newell'sShearwaters at further inland locations (i.e., in theKoolau Range; Pyle and Pyle 2009). For example,Newell's Shearwaters have been found dead at thetunnel on the Pali Highway on 4 August, 9September, and 19, 25, and 27 November 1967(Sincock and Swedberg 1969); on 26 May 1971(Banko 1980a); on 4 September 1972 (Banko1980a); on 18 July 1975 (Conant 1980); and on 9August 2008 (2 birds <100 m from the tunnel
entrance; Yukie and Tim Ohashi, Volcano, HI, inlitt.). Shallenberger (1976, cited in Conant 1980)also reported seeing these birds flying at night overthe Pali Highway in the 1970s, again suggestingnesting somewhere in the Koolau Mountains. Theoccurrence of these inland sightings during boththe summer breeding season and the fall fledgingperiod suggests that Newell’s Shearwaters nestsomewhere in the Koolau Range (Pyle and Pyle2009). We can find no recent records of Newell’sShearwater in the Waianae Range, but cannot ruleout the potential occurrence of nesting habitat atupper elevations in these mountains.
While records of Newell’s Shearwaters onOahu suggest that our radar targets were morelikely to be Newell’s Shearwaters rather thanHawaiian Petrels, it also is likely that somenon-target species were included as shearwater-liketargets in the radar data collected at the Project. Forexample, we observed Barn Owls and other species(i.e., Black-crowned Night Heron, Cattle Egret,Great Frigatebird, and Pacific Golden-Plover) atthe Project. These species are known to sometimesbe active during crepuscular and nocturnal hours(current study; Sanzenbacher and Cooper, unpubldata). Therefore, all of these species can at times be
Table 3. Flight altitudes (m above ground level [agl] relative to radar) of shearwater-like targets measured using vertical radar and during visual observations at the proposed Na Pua Makani Wind Energy Project, Oahu Island, Hawaii, fall (October–November) 2012 and spring (April–May) and summer (June) 2013.
Cumulative percentage of radar and visual targets
Flight altitude (m agl)Fall 2012
(n = 10 targets)1Spring 2013
(n = 7 targets)1Summer 2013 (n = 7 targets)2
Combined (n = 24 targets)
1–25 0.0 0.0 0.0 0.0 1–50 10.0 0.0 0.0 4.2 1–75 10.0 28.6 14.3 16.7
1–100 20.0 42.9 14.3 25.0 1–125 20.0 57.1 57.1 41.7 1–150 30.0 57.1 85.7 54.2 1–175 50.0 71.4 85.7 66.7 1–200 80.0 71.4 85.7 79.2 1–300 80.0 100.0 100.0 91.7 1–400 100.0 100.0 100.0 100.0
1 All altitude data derived solely from vertical radar targets. 2 Altitude data derived from six vertical radar targets and one visual observation of an unidentified petrel/shearwater.
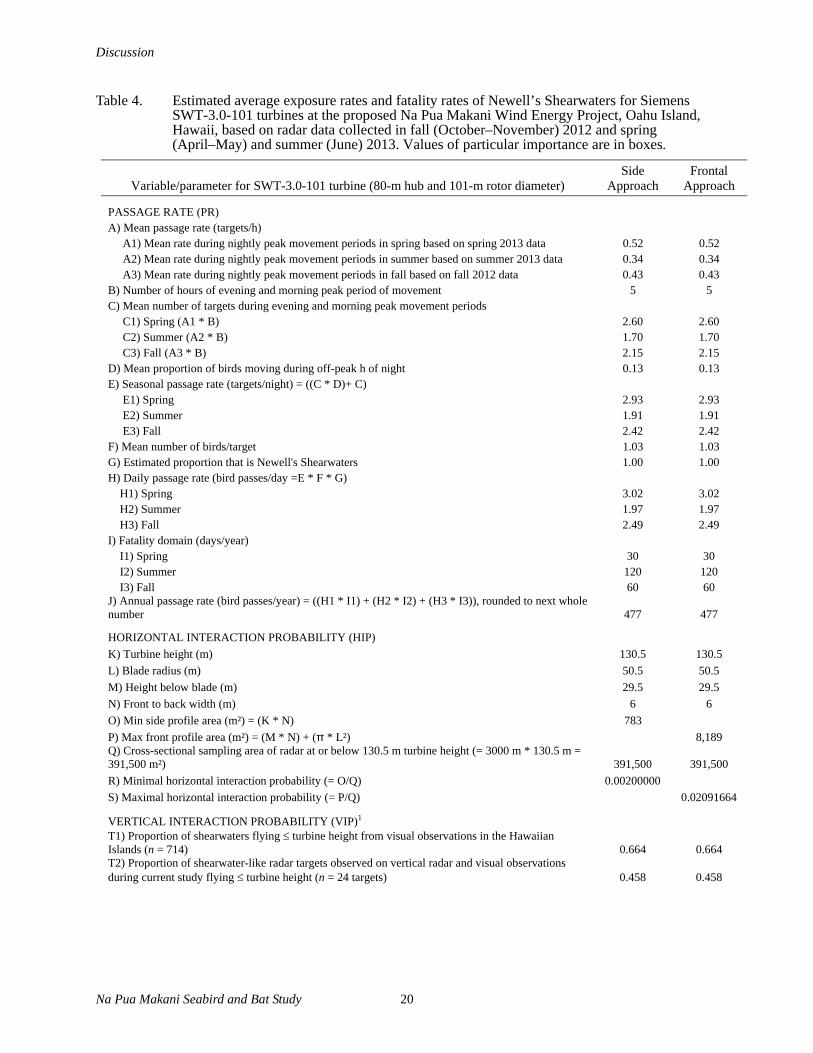
Discussion
Na Pua Makani Seabird and Bat Study 20
Table 4. Estimated average exposure rates and fatality rates of Newell’s Shearwaters for Siemens SWT-3.0-101 turbines at the proposed Na Pua Makani Wind Energy Project, Oahu Island, Hawaii, based on radar data collected in fall (October–November) 2012 and spring (April–May) and summer (June) 2013. Values of particular importance are in boxes.
Variable/parameter for SWT-3.0-101 turbine (80-m hub and 101-m rotor diameter)Side
Approach Frontal
Approach
PASSAGE RATE (PR) A) Mean passage rate (targets/h) A1) Mean rate during nightly peak movement periods in spring based on spring 2013 data 0.52 0.52 A2) Mean rate during nightly peak movement periods in summer based on summer 2013 data 0.34 0.34 A3) Mean rate during nightly peak movement periods in fall based on fall 2012 data 0.43 0.43 B) Number of hours of evening and morning peak period of movement 5 5 C) Mean number of targets during evening and morning peak movement periods C1) Spring (A1 * B) 2.60 2.60 C2) Summer (A2 * B) 1.70 1.70 C3) Fall (A3 * B) 2.15 2.15 D) Mean proportion of birds moving during off-peak h of night 0.13 0.13 E) Seasonal passage rate (targets/night) = ((C * D)+ C) E1) Spring 2.93 2.93 E2) Summer 1.91 1.91 E3) Fall 2.42 2.42 F) Mean number of birds/target 1.03 1.03 G) Estimated proportion that is Newell's Shearwaters 1.00 1.00 H) Daily passage rate (bird passes/day =E * F * G) H1) Spring 3.02 3.02 H2) Summer 1.97 1.97 H3) Fall 2.49 2.49 I) Fatality domain (days/year) I1) Spring 30 30 I2) Summer 120 120 I3) Fall 60 60 J) Annual passage rate (bird passes/year) = ((H1 * I1) + (H2 * I2) + (H3 * I3)), rounded to next whole number 477 477
HORIZONTAL INTERACTION PROBABILITY (HIP) K) Turbine height (m) 130.5 130.5 L) Blade radius (m) 50.5 50.5 M) Height below blade (m) 29.5 29.5 N) Front to back width (m) 6 6 O) Min side profile area (m²) = (K * N) 783 P) Max front profile area (m²) = (M * N) + ( * L²) 8,189 Q) Cross-sectional sampling area of radar at or below 130.5 m turbine height (= 3000 m * 130.5 m = 391,500 m²) 391,500 391,500 R) Minimal horizontal interaction probability (= O/Q) 0.00200000 S) Maximal horizontal interaction probability (= P/Q) 0.02091664
VERTICAL INTERACTION PROBABILITY (VIP)1 T1) Proportion of shearwaters flying turbine height from visual observations in the Hawaiian Islands (n = 714) 0.664 0.664 T2) Proportion of shearwater-like radar targets observed on vertical radar and visual observations during current study flying turbine height (n = 24 targets) 0.458 0.458
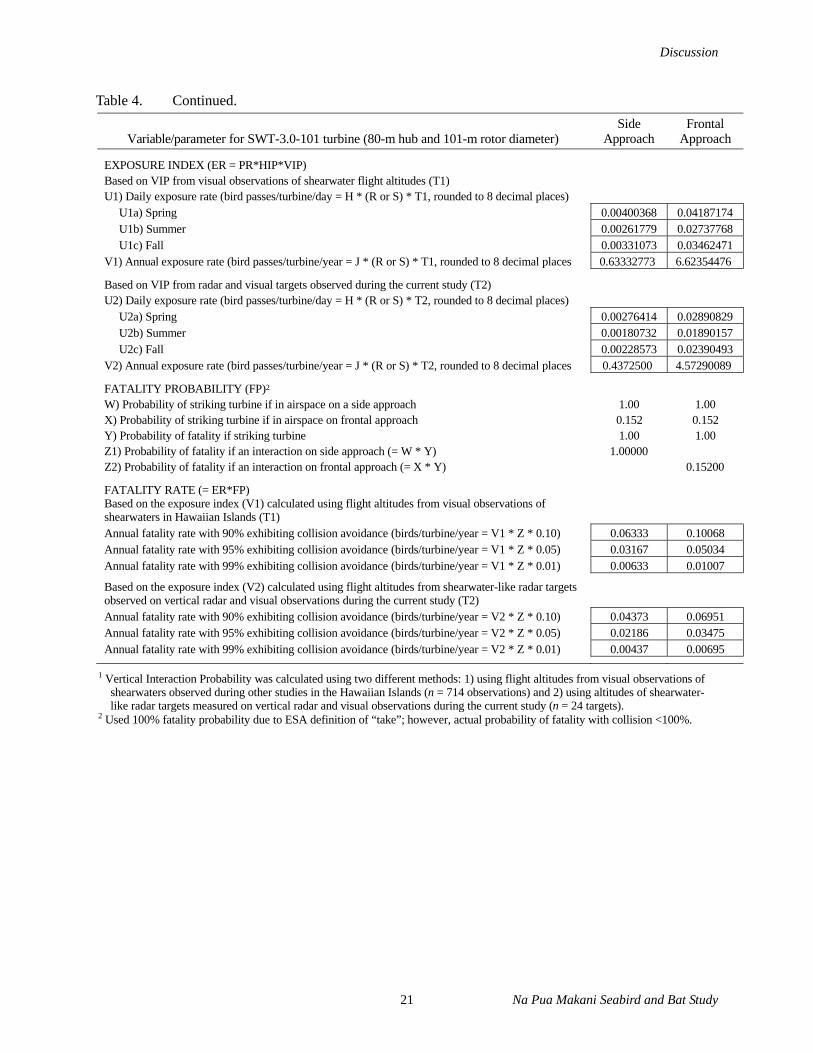
Discussion
Table 4. Continued.
Variable/parameter for SWT-3.0-101 turbine (80-m hub and 101-m rotor diameter)Side
Approach Frontal
Approach
EXPOSURE INDEX (ER = PR*HIP*VIP) Based on VIP from visual observations of shearwater flight altitudes (T1) U1) Daily exposure rate (bird passes/turbine/day = H * (R or S) * T1, rounded to 8 decimal places)
U1a) Spring 0.00400368 0.04187174U1b) Summer 0.00261779 0.02737768U1c) Fall 0.00331073 0.03462471
V1) Annual exposure rate (bird passes/turbine/year = J * (R or S) * T1, rounded to 8 decimal places 0.63332773 6.62354476
Based on VIP from radar and visual targets observed during the current study (T2) U2) Daily exposure rate (bird passes/turbine/day = H * (R or S) * T2, rounded to 8 decimal places)
U2a) Spring 0.00276414 0.02890829U2b) Summer 0.00180732 0.01890157U2c) Fall 0.00228573 0.02390493
V2) Annual exposure rate (bird passes/turbine/year = J * (R or S) * T2, rounded to 8 decimal places 0.4372500 4.57290089
FATALITY PROBABILITY (FP)2 W) Probability of striking turbine if in airspace on a side approach 1.00 1.00 X) Probability of striking turbine if in airspace on frontal approach 0.152 0.152 Y) Probability of fatality if striking turbine 1.00 1.00 Z1) Probability of fatality if an interaction on side approach (= W * Y) 1.00000 Z2) Probability of fatality if an interaction on frontal approach (= X * Y) 0.15200
FATALITY RATE (= ER*FP) Based on the exposure index (V1) calculated using flight altitudes from visual observations of shearwaters in Hawaiian Islands (T1) Annual fatality rate with 90% exhibiting collision avoidance (birds/turbine/year = V1 * Z * 0.10) 0.06333 0.10068 Annual fatality rate with 95% exhibiting collision avoidance (birds/turbine/year = V1 * Z * 0.05) 0.03167 0.05034 Annual fatality rate with 99% exhibiting collision avoidance (birds/turbine/year = V1 * Z * 0.01) 0.00633 0.01007
Based on the exposure index (V2) calculated using flight altitudes from shearwater-like radar targets observed on vertical radar and visual observations during the current study (T2) Annual fatality rate with 90% exhibiting collision avoidance (birds/turbine/year = V2 * Z * 0.10) 0.04373 0.06951 Annual fatality rate with 95% exhibiting collision avoidance (birds/turbine/year = V2 * Z * 0.05) 0.02186 0.03475 Annual fatality rate with 99% exhibiting collision avoidance (birds/turbine/year = V2 * Z * 0.01) 0.00437 0.00695
1 Vertical Interaction Probability was calculated using two different methods: 1) using flight altitudes from visual observations of shearwaters observed during other studies in the Hawaiian Islands (n = 714 observations) and 2) using altitudes of shearwater-like radar targets measured on vertical radar and visual observations during the current study (n = 24 targets).
2 Used 100% fatality probability due to ESA definition of “take”; however, actual probability of fatality with collision <100%.
21 Na Pua Makani Seabird and Bat Study
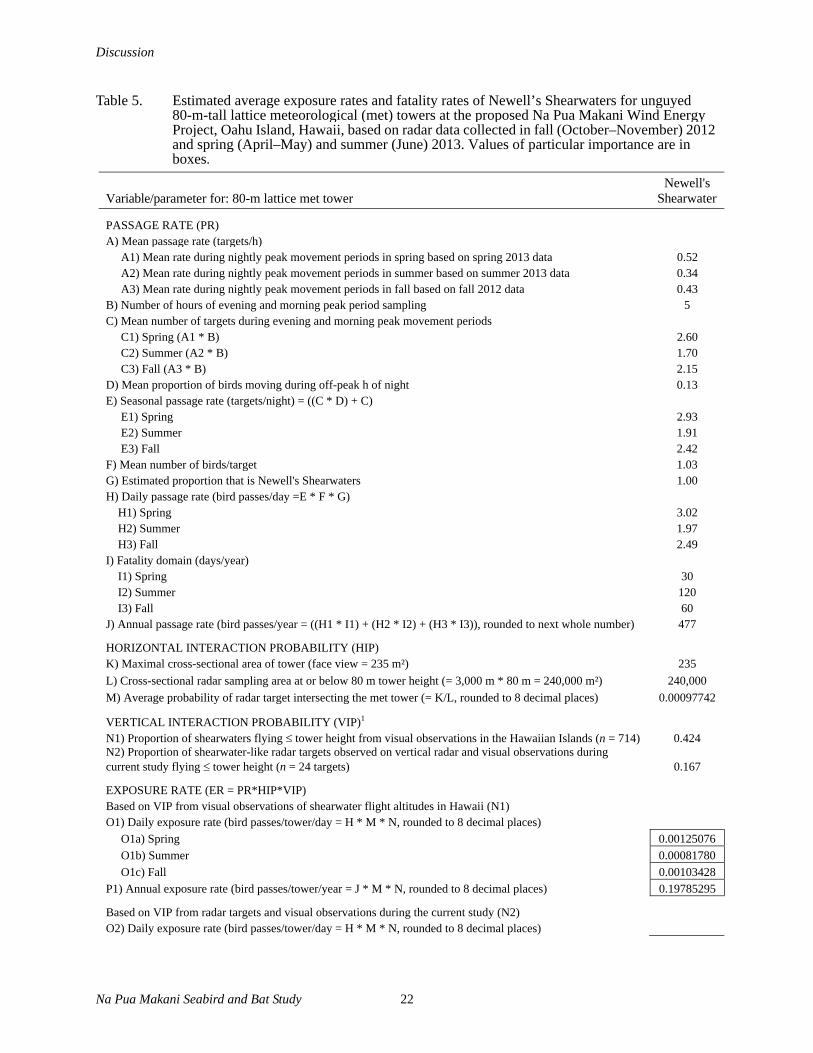
Discussion
Table 5. Estimated average exposure rates and fatality rates of Newell’s Shearwaters for unguyed 80-m-tall lattice meteorological (met) towers at the proposed Na Pua Makani Wind Energy Project, Oahu Island, Hawaii, based on radar data collected in fall (October–November) 2012 and spring (April–May) and summer (June) 2013. Values of particular importance are in boxes.
Variable/parameter for: 80-m lattice met tower
PASSAGE RATE (PR) A) Mean passage rate (targets/h)
Newell's Shearwater
A1) Mean rate during nightly peak movement periods in spring based on spring 2013 data 0.52A2) Mean rate during nightly peak movement periods in summer based on summer 2013 data 0.34A3) Mean rate during nightly peak movement periods in fall based on fall 2012 data 0.43
B) Number of hours of evening and morning peak period sampling 5 C) Mean number of targets during evening and morning peak movement periods
C1) Spring (A1 * B) 2.60C2) Summer (A2 * B) 1.70C3) Fall (A3 * B) 2.15
D) Mean proportion of birds moving during off-peak h of night 0.13 E) Seasonal passage rate (targets/night) = ((C * D) + C)
E1) Spring 2.93E2) Summer 1.91E3) Fall 2.42
F) Mean number of birds/target 1.03 G) Estimated proportion that is Newell's Shearwaters 1.00 H) Daily passage rate (bird passes/day =E * F * G)
H1) Spring 3.02H2) Summer 1.97H3) Fall 2.49
I) Fatality domain (days/year) I1) Spring 30I2) Summer 120I3) Fall 60
J) Annual passage rate (bird passes/year = ((H1 * I1) + (H2 * I2) + (H3 * I3)), rounded to next whole number) 477
HORIZONTAL INTERACTION PROBABILITY (HIP) K) Maximal cross-sectional area of tower (face view = 235 m²) 235 L) Cross-sectional radar sampling area at or below 80 m tower height (= 3,000 m * 80 m = 240,000 m²) 240,000 M) Average probability of radar target intersecting the met tower (= K/L, rounded to 8 decimal places) 0.00097742
VERTICAL INTERACTION PROBABILITY (VIP)1
N1) Proportion of shearwaters flying tower height from visual observations in the Hawaiian Islands (n = 714) 0.424 N2) Proportion of shearwater-like radar targets observed on vertical radar and visual observations during current study flying tower height (n = 24 targets) 0.167
EXPOSURE RATE (ER = PR*HIP*VIP) Based on VIP from visual observations of shearwater flight altitudes in Hawaii (N1) O1) Daily exposure rate (bird passes/tower/day = H * M * N, rounded to 8 decimal places)
O1a) Spring 0.00125076O1b) Summer 0.00081780O1c) Fall 0.00103428
P1) Annual exposure rate (bird passes/tower/year = J * M * N, rounded to 8 decimal places) 0.19785295
Based on VIP from radar targets and visual observations during the current study (N2) O2) Daily exposure rate (bird passes/tower/day = H * M * N, rounded to 8 decimal places)
Na Pua Makani Seabird and Bat Study 22
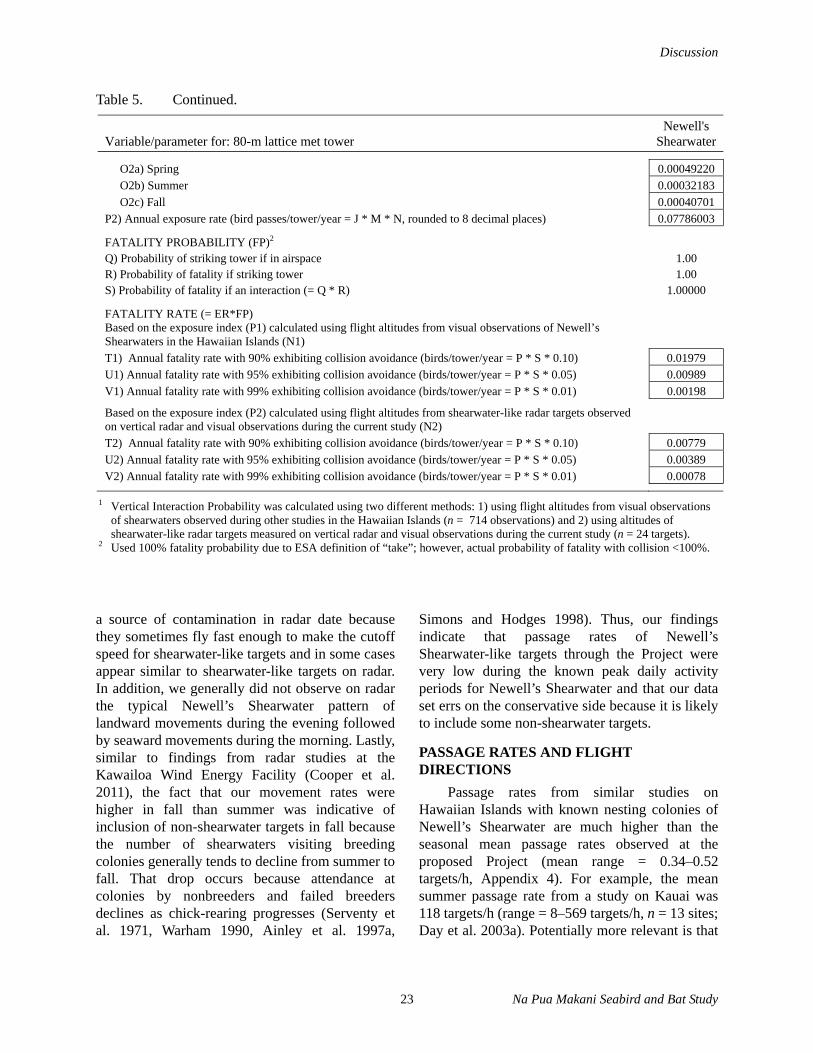
Discussion
23 Na Pua Makani Seabird and Bat Study
a source of contamination in radar date becausethey sometimes fly fast enough to make the cutoffspeed for shearwater-like targets and in some casesappear similar to shearwater-like targets on radar.In addition, we generally did not observe on radarthe typical Newell’s Shearwater pattern oflandward movements during the evening followedby seaward movements during the morning. Lastly,similar to findings from radar studies at theKawailoa Wind Energy Facility (Cooper et al.2011), the fact that our movement rates werehigher in fall than summer was indicative ofinclusion of non-shearwater targets in fall becausethe number of shearwaters visiting breedingcolonies generally tends to decline from summer tofall. That drop occurs because attendance atcolonies by nonbreeders and failed breedersdeclines as chick-rearing progresses (Serventy etal. 1971, Warham 1990, Ainley et al. 1997a,
Simons and Hodges 1998). Thus, our findingsindicate that passage rates of Newell’sShearwater-like targets through the Project werevery low during the known peak daily activityperiods for Newell’s Shearwater and that our dataset errs on the conservative side because it is likelyto include some non-shearwater targets.
PASSAGE RATES AND FLIGHT DIRECTIONS
Passage rates from similar studies onHawaiian Islands with known nesting colonies ofNewell’s Shearwater are much higher than theseasonal mean passage rates observed at theproposed Project (mean range = 0.34–0.52targets/h, Appendix 4). For example, the meansummer passage rate from a study on Kauai was118 targets/h (range = 8–569 targets/h, n = 13 sites;Day et al. 2003a). Potentially more relevant is that
Table 5. Continued.
Variable/parameter for: 80-m lattice met tower Newell's
Shearwater
O2a) Spring 0.00049220 O2b) Summer 0.00032183 O2c) Fall 0.00040701 P2) Annual exposure rate (bird passes/tower/year = J * M * N, rounded to 8 decimal places) 0.07786003
FATALITY PROBABILITY (FP)2
Q) Probability of striking tower if in airspace 1.00 R) Probability of fatality if striking tower 1.00 S) Probability of fatality if an interaction (= Q * R) 1.00000
FATALITY RATE (= ER*FP) Based on the exposure index (P1) calculated using flight altitudes from visual observations of Newell’s Shearwaters in the Hawaiian Islands (N1) T1) Annual fatality rate with 90% exhibiting collision avoidance (birds/tower/year = P * S * 0.10) 0.01979 U1) Annual fatality rate with 95% exhibiting collision avoidance (birds/tower/year = P * S * 0.05) 0.00989 V1) Annual fatality rate with 99% exhibiting collision avoidance (birds/tower/year = P * S * 0.01) 0.00198
Based on the exposure index (P2) calculated using flight altitudes from shearwater-like radar targets observed on vertical radar and visual observations during the current study (N2) T2) Annual fatality rate with 90% exhibiting collision avoidance (birds/tower/year = P * S * 0.10) 0.00779 U2) Annual fatality rate with 95% exhibiting collision avoidance (birds/tower/year = P * S * 0.05) 0.00389 V2) Annual fatality rate with 99% exhibiting collision avoidance (birds/tower/year = P * S * 0.01) 0.00078
1 Vertical Interaction Probability was calculated using two different methods: 1) using flight altitudes from visual observationsof shearwaters observed during other studies in the Hawaiian Islands (n = 714 observations) and 2) using altitudes of shearwater-like radar targets measured on vertical radar and visual observations during the current study (n = 24 targets).
2 Used 100% fatality probability due to ESA definition of “take”; however, actual probability of fatality with collision <100%.
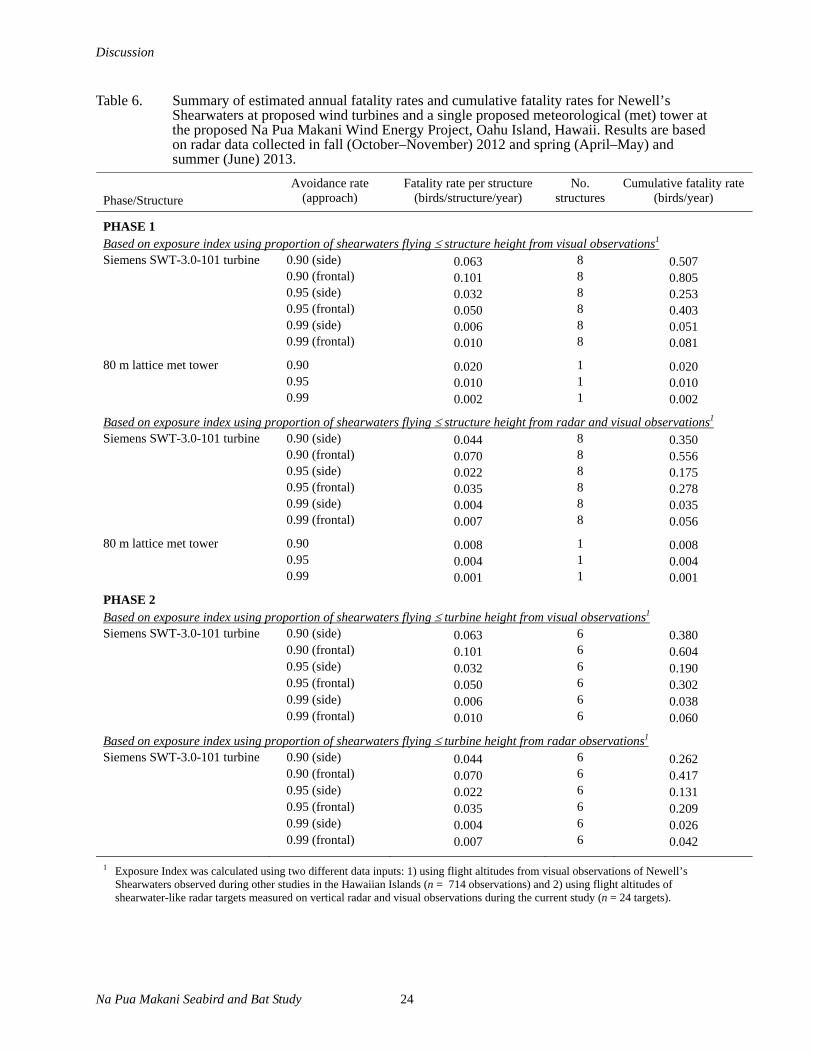
Discussion
Na Pua Makani Seabird and Bat Study 24
Table 6. Summary of estimated annual fatality rates and cumulative fatality rates for Newell’s Shearwaters at proposed wind turbines and a single proposed meteorological (met) tower at the proposed Na Pua Makani Wind Energy Project, Oahu Island, Hawaii. Results are based on radar data collected in fall (October–November) 2012 and spring (April–May) and summer (June) 2013.
Phase/StructureAvoidance rate
(approach) Fatality rate per structure
(birds/structure/year) No.
structures Cumulative fatality rate
(birds/year)
PHASE 1 Based on exposure index using proportion of shearwaters flying structure height from visual observations1
Siemens SWT-3.0-101 turbine 0.90 (side) 0.063 8 0.507 0.90 (frontal) 0.101 8 0.805 0.95 (side) 0.032 8 0.253 0.95 (frontal) 0.050 8 0.403 0.99 (side) 0.006 8 0.051 0.99 (frontal) 0.010 8 0.081
80 m lattice met tower 0.90 0.020 1 0.020 0.95 0.010 1 0.010 0.99 0.002 1 0.002
Based on exposure index using proportion of shearwaters flying structure height from radar and visual observations1
Siemens SWT-3.0-101 turbine 0.90 (side) 0.044 8 0.350 0.90 (frontal) 0.070 8 0.556 0.95 (side) 0.022 8 0.175 0.95 (frontal) 0.035 8 0.278 0.99 (side) 0.004 8 0.035 0.99 (frontal) 0.007 8 0.056
80 m lattice met tower 0.90 0.008 1 0.008 0.95 0.004 1 0.004 0.99 0.001 1 0.001
PHASE 2 Based on exposure index using proportion of shearwaters flying turbine height from visual observations1
Siemens SWT-3.0-101 turbine 0.90 (side) 0.063 6 0.380 0.90 (frontal) 0.101 6 0.604 0.95 (side) 0.032 6 0.190 0.95 (frontal) 0.050 6 0.302 0.99 (side) 0.006 6 0.038 0.99 (frontal) 0.010 6 0.060
Based on exposure index using proportion of shearwaters flying turbine height from radar observations1
Siemens SWT-3.0-101 turbine 0.90 (side) 0.044 6 0.262 0.90 (frontal) 0.070 6 0.417 0.95 (side) 0.022 6 0.131 0.95 (frontal) 0.035 6 0.209 0.99 (side) 0.004 6 0.026 0.99 (frontal) 0.007 6 0.042
1 Exposure Index was calculated using two different data inputs: 1) using flight altitudes from visual observations of Newell’sShearwaters observed during other studies in the Hawaiian Islands (n = 714 observations) and 2) using flight altitudes of shearwater-like radar targets measured on vertical radar and visual observations during the current study (n = 24 targets).
Discussion
25 Na Pua Makani Seabird and Bat Study
preconstruction studies at the constructed KahukuWind Energy Project (Day and Cooper 2008),located directly adjacent to the north of the currentProject, reported similarly low mean passage ratesof 0.2 ± 0.1 targets/h in summer and 0.3 ± 0.2targets/h in fall. Additionally, radar studies at theKawailoa Wind Energy Facility (Cooper et al.2011), currently operational, on the northern end ofOahu reported mean passage rates of 0.60 ± 0.07targets/h in summer and 1.41 ± 0.15 targets/h infall. This latter study cited high levels ofcontamination from non-target species during thefall and thus overestimated passage rates ofshearwater-like targets during this period.Regardless, average fall passage rates at the Projectand at the two existing wind energy projects onOahu (i.e., Kawailoa and Kahuku) all were lowrelative to data from other islands with all Oahuradar studies to date reporting seabird passagesrates <1.5 target/h (Appendix 4).
During fall 2012 and spring 2013 wegenerally observed equal numbers of radar targetsflying landward and seaward. In contrast, duringsummer 2013 there was a much higher proportionof seaward (85.7%) versus landward (14.3%)targets. Regardless, during each season wegenerally did not observe the typical pattern fromlocations with large known colonies of Newell’sShearwaters of an evening pulse of inbound(landward) flights towards the colonies followedby a morning exodus of seaward flights towardsthe ocean (Day and Cooper 1995). It is possiblethat the lack of a typical landward/seaward pattern,particularly during summer 2013, is related tovariation in flight paths of birds traversing the sitewith landward targets accessing nesting areas fromother areas but seaward targets heading over theProject en route to the ocean. For example, themajority of radar targets observed at the adjacentKahuku and Kawailoa wind energy sites innorthern Oahu were headed seaward away fromthose sites (Day and Cooper 2008; Cooper et al.2009, 2011), possibly reflecting site-associateddifferences in flight paths of birds approachingand departing nesting areas. Another possibleexplanation for the lack of a typical inbound/outbound pattern may have been related to thelow number of targets observed and also thecontamination of the radar data by non-seabirdspecies that do not adhere to such a pattern. In
particular, during one morning of general radar andAV observations in fall 2012 in the town ofKahuku (Figure 2) we observed numerousnon-target species (i.e., Pacific Golden Plovers,Great Frigatebirds, unidentified ducks) flyingparallel with the coastline in the direction ofwetland habitats located to the north of Kahukuand the Project area. These observations supportedour use of a directional filter to identify non-targetspecies (i.e., targets with “other” directions) andreduce contamination of the dataset by thesespecies.
EXPOSURE RATES AND FATALITY ESTIMATES
We estimated that an average ofapproximately <1–7 Newell’s Shearwaters/year flywithin the space occupied by each proposed windturbine (Table 4) and that approximately <1Newell’s Shearwaters/year flies within the spaceoccupied by the single proposed 80-m-tall latticemet tower (Table 5). We used these estimatedexposure rates as a starting point for developing acomplete avian risk assessment; however, weemphasize that it currently is unknown whetherbird use (i.e., exposure) and fatality at windfarmstructures are strongly correlated. For example,Cooper and Day (1998) found no relationshipbetween passage rates and fatality rates ofHawaiian Petrels and Newell’s Shearwaters atpowerlines on Kauai, indicating that other factorshad a much greater effect on causing fatality thanpassage rates did. One such factor could beweather conditions; however, we do not know ofany studies to date that have shown correlationsbetween specific weather conditions and fatalitiesof Hawaiian Petrels or Newell’s Shearwaters.Nevertheless, collisions of Laysan Albatross(Phoebastria immutabilis) with a large array ofcommunication-tower antenna wires and guy wiresadjacent to large, high-density albatross breedingcolonies on Midway Atoll occurred at a far higherrate during periods of high winds, rain, and poorvisibility than during periods of less severeweather: 838 (>25%) of the 2,901 birds killedduring the study were killed during two storms(Fisher 1966).
COLLISION AVOIDANCE RATESFew data are available on the proportion of
petrels and shearwaters that do not collide with
Discussion
Na Pua Makani Seabird and Bat Study 26
wind turbines or met towers because ofcollision-avoidance behavior (i.e., birds thatcompletely alter their flight paths horizontallyand/or vertically to avoid flying through the spaceoccupied by a structure). Some collision-avoidanceinformation near transmission lines is available onHawaiian Petrels and Newell’s Shearwaters fromearlier work that we conducted on Kauai (Cooperand Day 1998). In summary, those data suggestthat the behavioral-avoidance rate of HawaiianPetrels and Newell’s Shearwaters neartransmission lines is very high. For example, of the207 Hawaiian Petrels observed flying within 150 mof transmission lines on Kauai, 40 exhibitedbehavioral responses; of those 40 birds thatexhibited collision-avoidance responses, none(0%) collided with a transmission line. Thus, thecollision-avoidance rate for Hawaiian Petrels was100% (i.e., 40 of 40 interactions resulted incollision avoidance). Of the 392 Newell’sShearwaters observed flying within 150 m oftransmission lines, 29 exhibited behavioralresponses; of those 29 birds that exhibitedcollision-avoidance responses, none (0%) collidedwith a transmission line. Thus, the observedcollision-avoidance rate for Newell’s Shearwaterswas 100% (i.e., 29 of 29 interactions resulted insuccessful collision avoidance).
Observations of Hawaiian Petrels at an aerialdisplay location on Hawaii Island indicated thatdisplaying Hawaiian Petrels actively avoidedfences in their path (Swift 2004). Only onecollision out of 1,539 flight passes (i.e., <0.1% ofpasses resulted in a collision) was observed duringtreatment nights, and of the 17 birds that exhibitedclose-in avoidance maneuvers at the fences, onlyone (~6%) collided with them. There is someadditional information available on collision-avoidance of Hawaiian Petrels on Lanai, where thebehavior of petrels was studied as they approachedlarge communication towers near a petrel breedingcolony (Tetra Tech 2008). In that study, all 20(100%) of the Hawaiian Petrels that were on acollision-course toward communication towersexhibited avoidance behavior and avoidedcollision.
Additional data that provide some insightson collision-avoidance behavior of petrels andshearwaters at windfarm structures (e.g., wind
turbines and met towers) are available from otherstudies associated with the operational KWP Iwind facility on Maui and the six meteorologicaltowers on Lanai. Based on fatality searches andobservations during the first five years of operationat the 20-turbines and three met towers at the KWPI facility, the estimated total annual take was 0.93Hawaiian Petrels and 0 Newell’s Shearwaterfatalities per year. (Kaheawa Wind Power II, LLC2011). Cooper and Day (2004b) used similarmethods as the current study to model seabirdfatality for the KWP I wind turbines, based onpassage rates from radar studies at the site (Dayand Cooper 1999; Cooper and Day 2004a, 2004b).They estimated that the combined annual fatality ofHawaiian Petrels and Newell’s Shearwaters at theKWP I turbines would be ~3–18 birds/yr with a50% avoidance rate, ~1–2 birds/yr with a 95%avoidance rate, and <1 bird/yr with a 99%avoidance rate. Their fatality model that used a99% avoidance value was a closer fit with themeasured fatality rates than were the fatalityestimates based on a 50% or 95% avoidance rates.
Similarly, 0 Hawaiian Petrels were found infive years of fatality searches at 1–6 met towers onLanai (A. Oller, Tetra Tech, pers. comm.), which fitthe preconstruction fatality estimates based uponradar data and a >99% avoidance factor (i.e.,<0.07–0.77 petrels/met tower/year with anassumption of 99% avoidance; Cooper et al. 2007).Thus, the two wind energy projects in Hawaii withpreconstruction fatality estimates and post-construction fatality data both suggest that fatalitymodels based on an assumption that 99% of petrelsavoided structures (i.e., wind turbines and mettowers) produced more realistic estimates offatality than did models using lower avoidancevalues.
In summary, currently available data suggestthat the avoidance rate of petrels and shearwaters attransmission lines and communications towers ishigh and approaches 100%. Data from the fatalitysearches at wind turbines and met towers on Mauiand Lanai are more difficult to interpret becausethey are not a direct measure of avoidance, but theyalso suggest high avoidance rates. Thus, the overallbody of evidence, while incomplete, is consistentwith the hypothesis that the average avoidance rateof Hawaiian Petrels and Newell’s Shearwaters at
Discussion
27 Na Pua Makani Seabird and Bat Study
wind turbines and met towers is substantial andpotentially is ≥99%. The ability of HawaiianPetrels and Newell’s Shearwater to detect andavoid objects under low-light conditions makessense from a life-history standpoint, since they areknown to forage extensively at night and to flythrough forests near their nests during low-lightconditions.
In addition to the limited data available forHawaiian Petrels and Newell’s Shearwaters, thereis evidence that many other species of birds detectand avoid structures (e.g., wind turbines, mettowers) during low-light conditions (Winkelman1995, Dirksen et al. 1998, Desholm and Kahlert2005, Desholm et al. 2006). For example, seaducksin Europe have been found to detect and avoidwind turbines ≥95% of the time (Desholm 2006,Plonczkier and Simms 2012). Further, naturalanti-collision behavior (especially alteration offlight directions) is seen in migrating Common andKing eiders (Somateria mollissima and S. fischeri)approaching human-made structures in theBeaufort Sea off of Alaska (Day et al. 2005a) andin diving ducks approaching offshore windfarms inEurope (Dirksen et al. 1998). Collision-avoidancerates around wind turbines are high for CommonEiders in the daytime (Desholm and Kahlert 2005),Common Terns (Sterna hirundo) and SandwichTerns (Sterna sandvicensis) during the daytime(>99%, Everaert and Stienen 2007), gulls (Larusspp.) in the daytime (>99%; Painter et al. 1999,cited in Chamberlain et al. 2006), and passerinesduring both the day and night (>99%; Winkelman1992, cited in Chamberlain et al. 2006).
We agree with others (Chamberlain et al.2006, Fox et al. 2006) that species-specific,weather-specific, and site-specific avoidance dataare needed in models to estimate fatality ratesaccurately. Until further petrel- and shearwater-specific data on the relationship between exposureand fatality rates are available for structures atwindfarms, we continue to provide a conservativerange of assumptions for avoidance rates in ourfatality models (i.e., 90%, 95%, and 99%avoidance). With an assumption of a 99%avoidance rate, the estimated average directannual take at the proposed Project would be0.004–0.010 Newell’s Shearwaters/wind turbine/year (the Project layout includes a total of 14proposed turbines), and 0.001–0.002 Newell’s
Shearwaters/80-m-tall, unguyed lattice mettower/year (the Project layout includes oneproposed met tower).
POTENTIAL BIASESThere are a number of factors that could bias
our exposure model and collision estimates in apositive or a negative direction. One factor thatwas likely to have created a positive bias was theinclusion of targets that were not petrels orshearwaters (see above). The elimination ofshearwater-like radar targets that were confirmedby concurrent AV observations to be non-targetspecies helped to minimize the inclusion ofnon-target species, but given the abundance ofthose non-target species in the Project area, it ishighly likely that some of our radar targets wereother fast-flying species that were active during thesampling period and thus inflated our passage ratecalculations. A second positive bias in our fatalitymodel is our simplistic assumption that passagerates of seabirds do not decrease as individualfatalities occur (i.e., we assumed sampling withreplacement for fatalities). Given the low passagerates observed in this study, it is likely that thefatality of just a single bird would substantiallyreduce the average nightly passage rates.
There are other factors that could create anegative bias in our fatality estimates. Oneexample would be if targets were missed becausethey flew within radar shadows. However, weattempted to correct for the known radar shadowpresent at the Radar West station, and with ouroverall coverage of the proposed structures at theProject do not believe we missed any largeconcentrations of shearwater-like targets.
Interannual variation in the number of birdsvisiting nesting colonies could increase or decreaseour fatality estimates. There are examples of siteswith high interannual variation in Hawaiian Petreland Newell’s Shearwater radar counts, such as thethree sites on Kauai where counts were ~100–300birds/hr lower (approximately four times lower) infall 1992 than in fall 1993; the lower counts in1992 were attributed to the effects of HurricaneIniki (Day and Cooper 1995).
Oceanographic factors (e.g., El Niño–Southern Oscillation [ENSO] events) also varyamong seasons and years and are known to affectthe distribution, abundance, and reproduction of
Summary
Na Pua Makani Seabird and Bat Study 28
seabirds (e.g., Ainley et al. 1994, Oedekoven et al.2001). During fall 2012 there were borderlineENSO-neutral/weak El Niño conditions inOctober 2012 and ENSO-neutral conditions inNovember 2012 (NOAA 2013). There wereENSO-neutral conditions during both the springand summer 2013 months (NOAA 2013). Thus, wespeculate that it is unlikely that El Niño-relatedoceanographic effects would have significantlyaffected seabird passage rates during our seasonalsampling periods in 2012 or 2013. Another factorthat could cause interannual variation in counts ineither direction, especially over a longer timeperiod such as the lifespan of a wind energyfacility, is overall population increases or declines.For example, there was a ~60% decline in radarcounts on Kauai between 1993 and 1999–2001 thatwas attributed to population declines of Newell’sShearwaters (Day et al. 2003a).
HAWAIIAN HOARY BATSRecent data from Appalachian ridge tops in
the eastern US and from prairie locations in boththe US and Canada have indicated that substantialnumbers of bats, including hoary bats, aresometimes killed as a result of collisions with windturbines (Kunz et al. 2007a, Arnett et al. 2008). Incontrast, while some bats also have been killed bycommunication towers (Zinn and Baker 1979,Crawford and Baker 1981, Erickson et al. 2002),transmission lines (Dedon et al. 1989, cited inErickson et al. 2002), and fences (Denys 1972,Wisely 1978), the annual fatality rate at thosestructures has been small (Erickson et al. 2002).We were unable to find any references on bat killsat met towers in the published or unpublishedliterature. Because of fatalities of migratory hoarybats at wind turbines on the US mainland(particularly in the eastern US; Kunz et al. 2007b)and of Hawaiian hoary bats on Maui and Oahu,there was interest in collecting visual data onHawaiian hoary bats during the course of thisseabird study, using binoculars and night-visionequipment.
Given that the sampling was designedprimarily to study seabirds, it is not surprising thatwe did not observe any bats during the currentstudy; however, based upon the observations insimilar habitat elsewhere on Oahu, it is likely that
bats are present in the Project area. For example,Day and Cooper (2008) used similar methods andrecorded low numbers of bats at the adjacentKahuku wind site during summer (i.e., <0.001bats/h). In addition, acoustic monitoring studies inthe Kahuku project area reported an average of0.12 bat passes/detector/night (SWCA 2011) andthree bats were reported to be killed (at windturbines) at the Kahuku site during its first year ofoperation (R. Rounds, USFWS, pers. comm.).Hawaiian hoary bats have been recorded elsewhereon Oahu (Baldwin 1950, Tomich 1986), wheretheir densities are described as "sparse" (van Riperand van Riper 1982), and it is speculated that theyformerly were much more abundant on Oahu thanthey are now (Kepler and Scott 1990). In fact, therewas speculation that the species had disappearedfrom Oahu and Molokai (State of Hawaii 2005),although more recent studies indicate persistenceon both Oahu (Day and Cooper 2008) and Molokai(Day and Cooper (2002). In summary, while wedid not observe any bats during the course of thisstudy, the available literature suggests that bats arepresent in the vicinity of the Project.
SUMMARY
This study focused on the movement patternsand flight behavior of Newell's Shearwaters nearthe proposed Na Pua Makani Wind Energy Projecton northern Oahu Island, Hawaii in fall 2012 andspring and summer 2013. The key results of thestudy were: (1) passage rates of shearwater-liketargets at the Project across all seasons weresimilar to the low rates observed at other locationson Oahu; (2) the absence of recent records ofHawaiian Petrels suggested that the petrel-/sheawater-like radar targets that we observed weremost likely Newell's Shearwaters rather thanHawaiian Petrels; however, note that our AV datasuggested that non-shearwaters, such as CattleEgret and Pacific Golden-Plover, potentially wereincluded in our radar counts of shearwater-liketargets to an unknown degree; (3) no Hawaiianhoary bats were detected during AV observations;(4) an average of approximately <1–7 Newell’sShearwaters/year are estimated to fly within thespace occupied by each proposed wind turbine andthat approximately <1 Newell’s Shearwater/ yearflies within the space occupied by the single
Literature Cited
29 Na Pua Makani Seabird and Bat Study
proposed 80-m-tall unguyed lattice met tower;(5) by using a conservative range of assumptionsfor avoidance rates in our fatality models (i.e.,90%, 95%, and 99% avoidance), we estimated acollision-caused fatality rate of 0.004–0.101Newell’s Shearwaters/turbine/year for each windturbine and 0.001–0.020 Newell’s Shearwaters/tower/year for the 80-m-tall unguyed lattice mettower. We estimated that the cumulative annualfatalities at the eight SWT-3.0-101 turbinescombined during Phase 1 would be 0.035–0.805Newell’s Shearwaters/year, at the six SWT-3.0-101turbines combined during Phase 2 would be0.026–0.604 Newell’s Shearwaters/year, and at thesingle proposed 80-m lattice met tower would be0.001–0.020 Newell’s Shearwaters/year.
In conclusion, current evidence indicates theproportion of seabirds that would detect and avoidwind turbines and met towers at the proposedProject will be high, but until further studies areconducted to quantify avoidance behavior at thesestructures, we provide a conservative range ofassumptions for avoidance rates in our fatalitymodels (i.e., 90%, 95%, and 99% avoidance rates)along with a discussion of the growing body ofevidence that is consistent with the hypothesis thatthe average avoidance-rate value is substantial andpotentially ≥99%. Thus, we believe that fatalityrates would most likely be near the lower end ofthe range of estimates we provide.
LITERATURE CITED
Ainley, D. G., R. Podolsky, L. DeForest, and G.Spencer. 1997b. New insights into the statusof the Hawaiian Petrel on Kauai. ColonialWaterbirds 20: 24–30.
Ainley, D. G., R. Podolsky, L. DeForest, G.Spencer, and N. Nur. 1995. Kauai EndangeredSeabird Study, Vol. 2: The ecology ofDark-rumped Petrels and Newell'sShearwaters on Kauai, Hawaii. Electric PowerResearch Institute, Palo Alto, CA, FinalReport No. TR–105847–V2. 74 pp.
Ainley, D. G., W. J. Sydeman, S. A. Hatch, and U.W. Wilson. 1994. Seabird population trendsalong the west coast of North America: causesand extent of regional concordance. Studies inAvian Biology 15: 119–133.
Ainley, D. G., T. C. Telfer, and M. H. Reynolds.1997a. Townsend's and Newell's Shearwater(Puffinus auricularis). In A. Poole and F. Gill,eds. The birds of North America, No. 297.Academy of Natural Sciences, Philadelphia,PA, and American Ornithologists' Union,Washington, DC. 20 pp.
AOU (American Ornithologists' Union). 1998.Check-list of North American birds. 7th ed.American Ornithologists' Union, Washington,DC. 829 pp.
Arnett, E. B., W. K. Brown, W. P. Erickson, J. K.Fielder, B. L. Hamilton, T. H. Henry, A. Jain,G. D. Johnson, J. Kerns, R. R. Koford, C. P.Nicholson, T. J. O'Connell, M. D. Piorkowski,and R. D. Tankersly. 2008. Patterns of batfatalities at wind energy facilities in NorthAmerica. Journal of Wildlife Management 72:61–78.
Baldwin, P. H. 1950. Occurrence and behavior ofthe Hawaiian Bat. Journal of Mammalogy 31:455–456.
Banko, W. E. 1980a. Part I. Populationhistories—species accounts. Sea birds:Hawaiian Dark-rumped Petrel ('Ua'u).Cooperative National Park Resources StudiesUnit, University of Hawaii at Manoa,Honolulu, HI. CPSU/UH Avian HistoryReport 5B: History of Endemic HawaiianBirds. 42 pp.
Banko, W. E. 1980b. Part I. Populationhistories—species accounts. Sea birds:Newell’s Shearwater ('A'o). CooperativeNational Park Resources Studies Unit,University of Hawaii at Manoa, Honolulu, HI.CPSU/UH Avian History Report 5B: Historyof Endemic Hawaiian Birds. 35 pp.
Carpenter, R. W., F. A. Bianchi, and W. M. Ord.1962. Field Notes. ‘Elepaio 22: 54–55.
Chamberlain, D. E., M. R. Rehfisch, A. D. Fox, M.Desholm, and S. J. Anthony. 2006. The effectof avoidance rates on bird mortalitypredictions made by wind turbine collisionrisk models. Ibis 148: 198–202.
Literature Cited
Na Pua Makani Seabird and Bat Study 30
Conant, S. 1980. Recent records of the 'Ua'u(Dark-rumped Petrel) and the 'A'o (Newell'sShearwater) in Hawaii. 'Elepaio 41: 11–13.
Cooper, B. A., and R. H. Day. 1995. KauaiEndangered Seabird Study, Vol. 1:Interactions of Dark-rumped Petrels andNewell's Shearwaters with utility structureson Kauai, Hawaii. Electric Power ResearchInstitute, Palo Alto, CA, Final Report No.TR–105847–V1. 170 pp.
Cooper, B. A., and R. H. Day. 1998. Summerbehavior and mortality of Dark-rumpedPetrels and Newell's Shearwaters at powerlines on Kauai. Colonial Waterbirds 21:11–19.
Cooper, B. A., and R. H. Day. 2003. Movement ofHawaiian Petrels to inland breeding sites onMaui Island, Hawaii. Waterbirds 26: 62–71.
Cooper, B. A., and R. H. Day. 2004a. Results ofendangered bird and bat surveys at theproposed Kaheawa Pastures Wind EnergyFacility, Maui Island, Hawaii, fall 2004.Unpublished report prepared for KaheawaWindpower LLC, Makawao, HI, and UPCWind Management LLC, Newton, MA, byABR, Inc., Forest Grove, OR, and Fairbanks,AK. 16 pp.
Cooper, B. A., and R. H. Day. 2004b. Modelingannual seabird use and fatality at the proposedKaheawa Pastures Wind Energy Facility,Maui Island, Hawaii, fall 2004. Unpublishedreport prepared for Kaheawa WindpowerLLC, Makawao, HI, and UPC WindManagement LLC, Newton, MA, by ABR,Inc., Forest Grove, OR, and Fairbanks, AK. 7pp.
Cooper, B. A., and R. H. Day. 2009. Radar andvisual studies of seabirds at the proposedKWP II Down-road Alternative Wind EnergyFacility, Maui Island, Hawaii, Summer 2009.Unpublished report prepared for First WindLLC, Newton, MA, by ABR, Inc., ForestGrove, OR, and Fairbanks, AK. 25 pp.Appendix 3 in Kaheawa Wind Power II WindEnergy Generation Facility Habitat
Conservation Plan. October 2011. Prepared bySWCA, Honolulu, HI, for Kaheawa WindPower II, LLC., Kihei, HI. 142 pp.+appendices.
Cooper, B. A., R. H. Day, and J. H. Plissner. 2007.Radar and audio-visual studies of HawaiianPetrels near proposed meteorological towersand wind turbines on northwestern LanaiIsland, May-July 2007. Unpublished reportprepared for KC Environmental, Inc.,Makawao, HI, and TetraTech EC, Portland,OR, by ABR, Inc.—Environmental Research& Services, Forest Grove, OR, and Fairbanks,AK. 44 pp. Appendix 3 in Draft HabitatConservation Plan for the construction andoperation of the Lanai metereological towers,Lanai, Hawaii. Prepared for Castle andCooke, Lanai City, HI, by TetraTech EC,Honolulu, HI. 54 pp. + appendices. http://www.state.hi.us/dlnr/dofaw/pubs/Lana'i_Met_Towers_HCP.pdf. Accessed September2013.
Cooper, B. A., M. G. Raphael, and M. Z. Peery.2006. Trends in radar-based counts ofMarbled Murrelets on the Olympic Peninsula,Washington, 1996–2004. Condor 108:936–947.
Cooper, B. A., P. M. Sanzenbacher, and R. H. Day.2011. Radar and visual studies of seabirds atthe proposed Kawailoa Wind Energy Facility,Oahu Island, Hawaii, 2009. Unpublishedreport prepared for First Wind LLC, Newton,MA by ABR, Inc., Forest Grove, OR, andFairbanks, AK. 32 pp. Appendix 3 inKawailoa Wind Power Draft HabitatConservation Plan. Prepared by SWCA,Honolulu, HI, for Kawailoa Wind PowerLLC, Honolulu, HI. 144 pp + appendices.http://hawaii.gov/dlnr/dofaw/hcp. AccessedSeptember 2011.
Crawford, R. L., and W. W. Baker. 1981. Batskilled at a north Florida television tower: a25-year record. Journal of Mammalogy 62:651–652.
Cryan, P. M., and A. C. Brown. 2007. Migration ofbats past a remote island offers clues towardthe problem of bat fatalities at wind turbines.Biological Conservation 139: 1–11.
Literature Cited
31 Na Pua Makani Seabird and Bat Study
Day, R. H., and B. A. Cooper. 1995. Patterns ofmovement of Dark-rumped Petrels andNewell's Shearwaters on Kauai. Condor 97:1011–1027.
Day, R. H., and B. A. Cooper. 1999. Results ofendangered bird and bat surveys at theproposed Kaheawa Pastures Windfarm onMaui Island, Hawaii, summer 1999.Unpublished report prepared for Zond Pacific,Wailuku, HI, by ABR, Inc., Fairbanks, AK,and Forest Grove, OR. 26 pp.
Day, R. H., and B. A. Cooper. 2001. Results ofpetrel and shearwater surveys on Kauai, June2001. Unpublished report prepared for USFS,Honolulu, HI, by ABR, Inc.—EnvironmentalResearch & Services, Fairbanks, AK, andForest Grove, OR. 21 pp.
Day, R. H., and B. A. Cooper. 2002. Petrel andshearwater surveys near Kalaupapa, MolokaiIsland, June 2002. Unpublished reportprepared for National Park Service, HawaiiNational Park, HI, by ABR, Inc.—Environmental Research & Services,Fairbanks, AK, and Forest Grove, OR. 17 pp.
Day, R. H., and B. A. Cooper. 2003. Petrel andshearwater surveys near County of Hawaiiemergency communications towers, July2003. Unpublished report prepared forScientel America and PBR Hawaii, Hilo, HI,by ABR, Inc.—Environmental Research &Services, Fairbanks, AK, and Forest Grove,OR. 24 pp.
Day, R. H., and B. A. Cooper. 2004. Petrel andshearwater surveys near a USCG tower nearUpolu Point, Hawaii, July 2003. Unpublishedreport prepared for U.S. Coast Guard, CivilEngineering Unit, Honolulu, HI, by ABR,Inc.—Environmental Research & Services,Fairbanks, AK, and Forest Grove, OR. 23 pp.
Day, R. H., and B. A. Cooper. 2005. Petrel andshearwater surveys near a USCG tower atPahoa, Hawaii, June 2003. Unpublishedreport prepared for U.S. Coast Guard,Honolulu, HI, by ABR, Inc.—EnvironmentalResearch & Services, Fairbanks, AK, andForest Grove, OR. 22 pp.
Day, R. H., and B. A. Cooper. 2008. Results ofendangered seabird and Hawaiian Hoary Batsurveys on northern Oahu Island, October2007 and July 2008. Unpublished reportprepared for FirstWind, Newton, MA, byABR, Inc.—Environmental Research &Services, Fairbanks, AK, and Forest Grove,OR. 27 pp. Appendix 3 in Kahuku WindPower Draft Habitat Conservation Plan.August 2009. Prepared by SWCA, Honolulu,HI, for Kahuku Wind Power LLC, Honolulu,HI. 144 pp + appendices.
Day, R. H., B. A. Cooper, and R. J. Blaha. 2003b.Movement patterns of Hawaiian Petrels andNewell's Shearwaters on the island of Hawai'i.Pacific Science 57: 147–159.
Day, R. H., B. A. Cooper, and T. C. Telfer. 2003a.Decline of Newell's Shearwaters on Kauai,Hawaii. Auk 120: 669–679.
Day, R. H., A. Gall, R. M. Burgess, J. P. Parrett,and B. A. Cooper. 2005b. Movements ofHawaiian Petrels near USAF facilities nearthe summit of Haleakala, Maui Island, Fall2004 and Spring 2005. Unpublished reportprepared for USAF Air Force ResearchLaboratory, Kihei, HI, by ABR, Inc.—Environmental Research & Services,Fairbanks, AK, and Forest Grove, OR. 34 pp.
Day, R. H., A. K. Prichard, and J. R. Rose. 2005a.Migration and collision avoidance of eidersand other birds at Northstar Island, Alaska,2001–2004. Unpublished final report preparedfor BP Exploration (Alaska), Inc., Anchorage,AK, by ABR, Inc.—Environmental Researchand Services, Fairbanks, AK. 142 pp.
Day, R. H., T. J. Mabee, and B. A. Cooper. 2003c.Petrel and shearwater surveys near a USCGtower at Pahoa, Hawaii, October 2002.Unpublished report prepared for U.S. CoastGuard, Honolulu, HI, by ABR,Inc.—Environmental Research & Services,Fairbanks, AK, and Forest Grove, OR. 24 pp.
Dedon, M. S., S. Byrne, J. Aycrigg, and P.Hartman. 1989. Bird mortality in relation tothe Mare Island 115-kV transmission line:progress report 1988/1989. Department of the
Literature Cited
Na Pua Makani Seabird and Bat Study 32
Navy, Western Division Naval FacilitiesEngineering Command, Office ofEnvironmental Management, San Bruno, CA.Report 443-89.3 150 pp.
Denys, G. A. 1972. Hoary bat impaled on barbedwire. Jack-Pine Warbler 50: 63.
Deringer, C. V. 2009. Breeding Phenoloy ofHawaiian Petrels (Pterodroma sandwichensis)and Newell's Shearwaters (Puffinusauricularis) on Kauai, Hawaii, usingornithological radar, auditory, and visualsurveys. MS thesis, University of Hawaii atHilo. Hawaii. 77 pp.
Desholm, M. 2006. Wind farm related mortalityamong avian migrants. Ph.D. thesis,University of Copenhagen, Copenhagen,Denmark. 128 pp.
Desholm, M., A. D. Fox, P. D. L. Beasley, and J.Kahlert. 2006. Remote techniques forcounting and estimating the number ofbird-wind turbine collisions at sea: a review.Ibis 148: 76–89.
Desholm, M. and J. Kahlert. 2005. Avian collisionrisk at an offshore windfarm. Biology Letters1: 296–298.
Dirksen, S. E., A. L. Spaans, and J. Winden. 1998.Nocturnal collision risks with wind turbines intidal and semi-offshore areas. Pp. 99–108 InProceedings of International Workshop onWind Energy and Landscape, Genua, 26–27July 1997. Balkema, Rotterdam, TheNetherlands.
Duffy, D. C. 2007. Hawaiian hoary bat inventory innational parks on Hawai’i, Maui, andMolokai’i. Pacific Cooperative Studies Unit.University of Hawai’i at Manoa. TechnicalReport 140. 28 pp.
Erickson, W., D. Johnson, D. P. Young, M. D.Strickland, R. E. Good, M. Bourassa, K. Bay,and K. Sernka. 2002. Synthesis andcomparison of baseline avian and bat use,raptor nesting, and mortality information fromproposed and existing wind developments.Unpublished report for Bonneville PowerAdministration, Portland, OR, by WEST, Inc.,Cheyenne, WY. 124 pp.
Everaert, M. and E. W. M. Stienen. 2007. Impact ofwind turbines on birds in Zeebrugge(Belgium). Biodiversity and Conservation 16:3345–2259.
Fisher, H. I. 1966. Midway’s deadly antennas.Audubon Magazine, July–August 1966. Pp.220–223.
Fox, A. D., M. Desholm, J. Kahlert, T. K.Christensen, and I. K. Petersen. 2006.Information needs to support environmentalimpact assessment of the effects of Europeanmarine offshore wind farms on birds. Ibis 148:129–144.
Gon, S. M., III. 1988. Observations of the 'Ua'u(Hawaiian Petrel) in the Hono O Pali NaturalArea Reserve, Island of Kauai. 'Elepaio 48:113.
Harrison, C. S. 1990. Seabirds of Hawaii: naturalhistory and conservation. Cornell UniversityPress, Ithaca, NY. 249 pp.
Harrison, C. S., M. B. Naughton, and S. I. Fefer.1984. The status and conservation of seabirdsin the Hawaiian Archipelago and JohnstonAtoll. Pages 513–526 in J. P. Croxall, P. G. H.Evans, and R. W. Schreiber, eds. Status andconservation of the world's seabirds. ICBPTechnical Publication No. 2, InternationalCouncil for Bird Preservation, Cambridge,United Kingdom.
Hatch, G. 1959. Newell’s Shearwater, or Ao.‘Elepaio 20: 20–21.
HDLNR (Hawaiian Department of Land andNatural Resources). 2005. ‘Ope’ape’a orHawaiian hoary bat (Lasiurus cinereussemotus). Hawaii’s Comprehensive WildlifeConservation Strategy. 3 pp.
Hirai, L. T. 1978a. Native birds of Lanai, Hawaii.Western Birds 9: 71–77.
Hirai, L. T. 1978b. Possible Dark-rumped Petrelcolony on Lanai, Hawaii. 'Elepaio 38:71–72.
Hodges, C. S. N. 1992. 'Ua'u observation atproposed site for antenna farm. Unpublishedmemorandum by Haleakala National Park,Makawao, HI. 2 pp.
Literature Cited
33 Na Pua Makani Seabird and Bat Study
Hu, D., C. Glidden, J. S. Lippert, L. Schnell, J. S.MacIvor, and J. Meisler. 2001. Habitat useand limiting factors in a population ofHawaiian Dark-rumped Petrels on MaunaLoa, Hawai'i. In J. M. Scott, S. Conant, and C.van Riper III, eds. Evolution, ecology,conservation, and management of Hawaiianbirds: a vanishing avifauna. Studies in AvianBiology 22: 234–242.
Jacobs, D. S. 1993. Foraging behavior of theendangered Hawaiian hoary bat, Lasiuruscinereus semotus. Final report to USFWS(Grant No. 14-48-0001-92570). 6 pp.
Jacobs, D. S. 1994. Distribution and abundance ofthe endangered Hawaiian hoary bat, Lasiuruscinereus semotus. Pacific Science48:193–200.
Kaheawa Wind Power, LLC. 2009. KaheawaPastures Wind Energy Generation Facility,Habitat Conservation Plan: Year 3 AnnualReport. FirstWind Energy, LLC,Environmental Affairs, Newton, MA.
Kaheawa Wind Power II, LLC. 2011. KaheawaWind Power II Wind Energy GenerationFacility: Habitat Conservation Plan. Appendix16: Calculation of direct take at the existingKWP facility. FirstWind Energy, LLC,Environmental Affairs, Newton, MA.http://hawaii.gov/dlnr/dofaw/hcp. AccessedSeptember 2013.
Kepler, C. B., and J. M. Scott. 1990. Notes ondistribution and behavior of the endangeredHawaiian Hoary Bat (Lasiurus cinereussemotus), 1964–1983. 'Elepaio 50: 59–64.
King, W. B., and P. J. Gould. 1967. The status ofNewell's race of the Manx Shearwater. LivingBird 6: 163–186.
Kunz, T. H., E. B. Arnett, B. A. Cooper, W. P.Erickson, R. P. Larkin, T. J. Mabee, M. L.Morrison, M. D. Strickland, and J. M.Szewczak. 2007b. Assessing impacts ofwind-energy development on nocturnallyactive birds and bats: a guidance document.Journal of Wildlife Management 71:2449–2486.
Kunz, T. H., E. B. Arnett, W. P. Erickson, A. R.Hoar, G. D. Johnson, R. P. Larkin, M. D.Strickland, R. W. Thresher, and M. D. Tuttle.2007a. Ecological impacts of wind energydevelopment on bats: questions, researchneeds, and hypotheses. Frontiers in Ecologyand the Environment 5: 315–324.
Mabee, T. J., B. A. Cooper, J. H. Plissner, and D. P.Young. 2006. Nocturnal bird migration overan Appalachian ridge at a proposed windpower project. Wildlife Society Bulletin 34:682–690.
Menard, T. 2001. Activity patterns of the Hawaiianhoary bat (Lasiurus cinereus semotus) inrelation to reproductive time periods. MSThesis. University of Hawaii, Honolulu.
Munro, G. C. 1941. Birds of Hawaii and adventuresin bird study. ‘Elepaio 2: 9–11.
Munro, G. C. 1960. Birds of Hawaii. Charles E.Tuttle Co., Inc. Rutland, VT. 192 pp.
NOAA (National Oceanic and AtmosphericAdministration). 2013. National ClimaticData Center El Niño and La Niña website.http://www.ncdc.noaa.gov/oa/climate/elnino/elnino.html. Accessed September 2013.
Oedekoven, C. S., D. G. Ainley, and L. B. Spear.2001. Variable responses of seabirds tochange in marine climate: California Current,1985–1994. Marine Ecology Progress Series212: 265–281.
Painter, A., B. Little, and S. Lawrence. 1999.Continuation of Bird Studies at Blyth HarbourWind Farm and the Implications for OffshoreWind Farms. Report by Border Wind LimitedDTI. ETSU W/13/00485/00/00.
Plonczkier, P. and I. C. Simms. 2012. Radarmonitoring of migrating Pink-footed Geese:behavioral responses to offshore wind farmdevelopment. Journal of Applied Ecology2012: 1–8.
Podolsky, R., D. G. Ainley, G. Spencer, L.DeForest, and N. Nur. 1998. Mortality ofNewell's Shearwaters caused by collisionswith urban structures on Kauai. ColonialWaterbirds 21: 20–34.
Literature Cited
Na Pua Makani Seabird and Bat Study 34
Pratt, T. K. 1988. Recent observations,March–May 1988. 'Elepaio 48: 65–66.
Pratt, H. D., P. L. Bruner, and D. G. Berrett. 1987.A field guide to the birds of Hawaii and thetropical Pacific. Princeton University Press,Princeton, NJ. 409 pp. + plates.
Pyle, R. L. 1983. Hawaiian Islands Region (1June–31 July 1983). American Birds 37:1028–1029.
Pyle, R. L. 1986. Recent observations, March–June1986. 'Elepaio 46: 156–157.
Pyle, R. L. 1990. Hawaiian Islands Region (1June–31 July 1990). American Birds 44:1189–1190.
Pyle, R.L., and P. Pyle. 2009. The Birds of theHawaiian Islands: Occurrence, History,Distribution, and Status. B.P. BishopMuseum, Honolulu, HI, U.S.A. Version 1.http://hbs.bishopmuseum.org/birds/rlp-monograph/. Accessed September 2013.
Reynolds, M. H., B. A. Cooper, and R. H. Day.1997. Radar study of seabirds and bats onwindward Hawaii. Pacific Science 51:97–106.
Reynolds, M. H., and G. L. Richotte. 1997.Evidence of Newell's Shearwater breeding inPuna District, Hawaii. Journal of FieldOrnithology 68: 26–32.
Richardson, F. 1955. Reappearance of Newell'sShearwater in Hawaii. Auk 72: 412.
Richardson, F., and D. H. Woodside. 1954.Rediscovery of the nesting of theDark-rumped Petrel in the Hawaiian Islands.Condor 56: 323–327.
Kawailoa Wind Power. 2011. Kawailoa WindPower draft Habitat Conservation Plan.Kawailoa Wind Power LLC, Honolulu, HI.
Sanzenbacher, P. M., and B. A. Cooper. 2008.Radar and visual studies of seabirds at theKWP I and KWP II wind energy facilities,Maui Island, Hawaii: use of 2008 data tomodel annual collision fatalities at
meteorological towers. Unpublished reportprepared for FirstWind, Newton, MA, byABR, Inc.—Environmental Research &Services, Forest Grove, OR. 21 pp.
Sanzenbacher, P. M., and B. A. Cooper. 2009.Radar and visual studies of seabirds at theKWP II wind energy facility, Maui Island,Hawaii: use of 2008 data to model annualcollision fatalities at proposed wind turbines.Unpublished report prepared for FirstWind,Newton, MA, by ABR, Inc.—EnvironmentalResearch & Services, Forest Grove, OR. 20pp.
Serventy, D. L., V. Serventy, and J. Warham. 1971.The handbook of Australian seabirds. A. H.and A. W. Reed, Sydney, Australia. 254 pp.
Shallenberger, R. J. 1974. Field notes. 'Elepaio 35:18–20.
Shallenberger, R. J. 1976. Avifauna: Survey ofNorth Halawa Valley. ‘Elepaio 37: 40–41.
Simons, T. R. 1984. A population model of theendangered Hawaiian Dark-rumped Petrel.Journal of Wildlife Management 48:1065–1076.
Simons, T. R. 1985. Biology and behavior of theendangered Hawaiian Dark-rumped Petrel.Condor 87: 229–245.
Simons, T. R., and C. N. Hodges. 1998.Dark-rumped Petrel (Pterodromaphaeopygia). In A. Poole and F. Gill, eds. Thebirds of North America, No. 345. Academy ofNatural Sciences, Philadelphia, PA, andAmerican Ornithologists' Union, Washington,DC. 24 pp.
Sincock, J. L., and G. E. Swedberg. 1969.Rediscovery of the nesting grounds ofNewell's Manx Shearwater (Puffinus puffinusnewelli), with initial observations. Condor 71:69–71.
State of Hawaii. 2005. 'Ope'ape'a or HawaiianHoary Bat. In Hawaii's ComprehensiveWildlife Conservation Strategy. State ofHawaii, Honolulu, HI. 3 pp.
SPSS. 2009. SPSS for Windows, version 18.0.SPSS, Inc., Chicago, IL.
35 Na Pua Makani Seabird and Bat Study
SWCA. 2011. Kawailoa Wind Power wildlifemonitoring report for waterbirds and bats,October 2009–April 2011. Prepared bySWCA, Honolulu, HI, for First Wind,Honolulu, HI. 26 pp. Appendix 4 in KawailoaWind Power Draft Habitat ConservationPlan. Prepared by SWCA, Honolulu, HI,for Kawailoa Wind Power LLC, Honolulu,HI. 144 pp + appendices. http://hawaii.gov/dlnr/dofaw/hcp. Accessed September2013.
Swift, R. 2004. Potential effects of ungulateexclusion fencing on displaying HawaiianPetrels (Pterodroma sandwichensis) atHawai'i Volcanoes National Park. M.S.Thesis, Oregon State University, Corvallis,OR.
Telfer, T. C., J. L. Sincock, G. V. Byrd, and J. R.Reed. 1987. Attraction of Hawaiian seabirdsto lights: conservation efforts and effects ofmoon phase. Wildlife Society Bulletin 15:406–413.
Tetra Tech EC. 2008. Draft Habitat ConservationPlan for the construction and operation ofLanai met towers, Lanai, Hawaii (RevisedFebruary 8, 2008, TTEC-PTLD-2008-080).Unpublished report prepared by Tetratech EC,Honolulu, HI, for Castle and Cooke LLC,Lanai City, HI. 54 pp. + appendices.http://www.state.hi.us/dlnr/dofaw/pubs/Lana'i_Met_Towers_HCP.pdf. Accessed September2013.
Tomich, P. Q. 1986. Mammals in Hawaii: asynopsis and notational bibliography. 2nd ed.Bishop Museum Press, Honolulu. HI. BishopMuseum Special Publication 76. 375 pp.
Tucker, V. A. 1996. A mathematical model of birdcollisions with wind turbine rotors. ASMEJournal of Solar Energy Engineering 118:253–262.
USFWS (US Fish and Wildlife Service). 1970.Apendix D.-U.S. list of endangered nativefish and wildlife. Federal Register 35:16047-16048.
USFWS. 1998. Recovery plan for the Hawaiianhoary bat. U.S. Fish and Wildlife Service,Portland, OR.
van Riper, S. G., and C. van Riper II. 1982. A fieldguide to the mammals in Hawaii. OrientalPublishing Co., Honolulu, HI. 68 pp.
Warham, J. 1990. The petrels: their ecology andbreeding systems. Academic Press. NewYork, NY. 440 pp.
Winkelman, J. E. 1992. The impact of the Sepwind park near Oosterbierum (Fr.), TheNetherlands, on birds, 1: Collision Victims(RIN-rapport 92/2), 2: Nocturnal CollisionRisks (RIN-rapport 92/3). DLO-Instituut voorBos- en Natuuroderzoek. (in Dutch, Englishtranslations of summaries and titles).
Winkelman, J. E. 1995. Bird/wind turbineinvestigations in Europe. Pages 43–47 and110–140 in LGL Ltd., ed. Proceedings ofNational Avian–Wind Power PlanningMeeting I, 20-21 July 1994, Lakewood, CO.https://www.nationalwind.org/assets/research_meetings/Research_Meeting_I_Proceedings.pdf. Accessed September 2013.
Wisely, A. N. 1978. Bat dies on barbed wire fence.Blue Jay 36: 53.
Zinn, T. L., and W. W. Baker. 1979. Seasonalmigration of the Hoary Bat, Lasiuruscinereus, through Florida. Journal ofMammalogy 60: 634–635.
Literature Cited
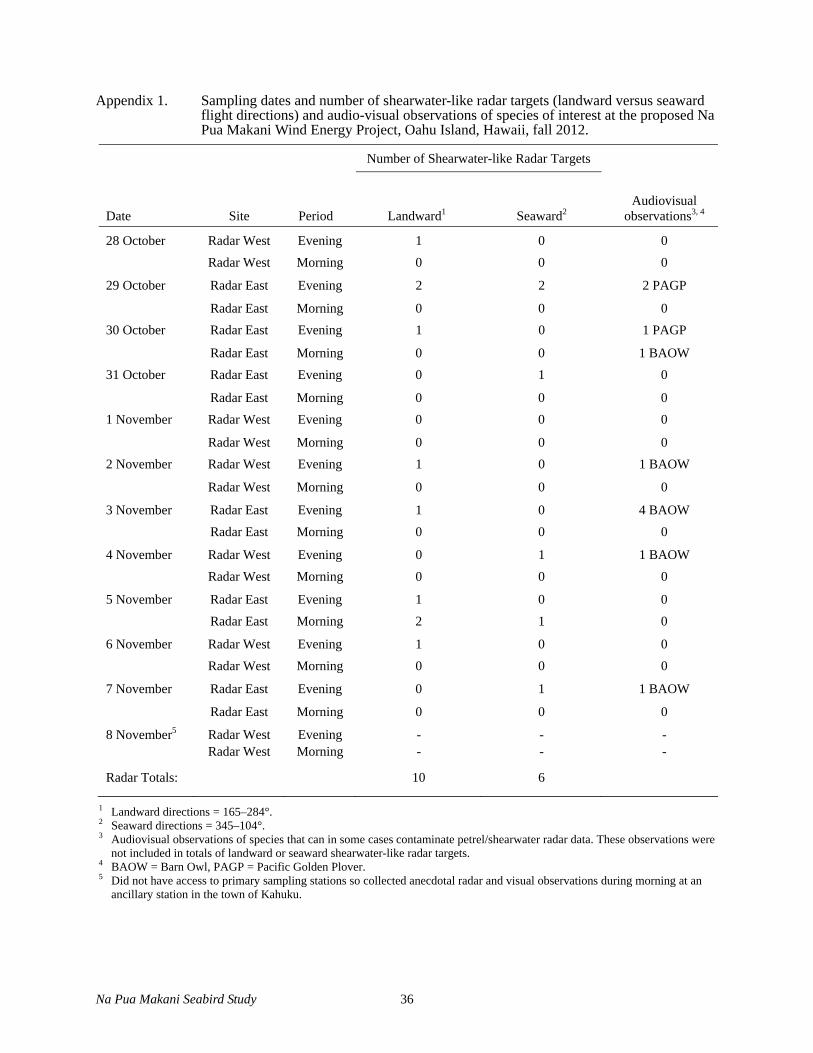
Na Pua Makani Seabird Study 36
Appendix 1. Sampling dates and number of shearwater-like radar targets (landward versus seaward flight directions) and audio-visual observations of species of interest at the proposed Na Pua Makani Wind Energy Project, Oahu Island, Hawaii, fall 2012.
Number of Shearwater-like Radar Targets
Date Site Period Landward1 Seaward2Audiovisual
observations3, 4
28 October Radar West Evening 1 0 0 Radar West Morning 0 0 0
29 October Radar East Evening 2 2 2 PAGP
Radar East Morning 0 0 0 30 October Radar East Evening 1 0 1 PAGP
Radar East Morning 0 0 1 BAOW 31 October Radar East Evening 0 1 0
Radar East Morning 0 0 0 1 November Radar West Evening 0 0 0
Radar West Morning 0 0 0 2 November Radar West Evening 1 0 1 BAOW
Radar West Morning 0 0 0
3 November Radar East Evening 1 0 4 BAOW Radar East Morning 0 0 0
4 November Radar West Evening 0 1 1 BAOW Radar West Morning 0 0 0
5 November Radar East Evening 1 0 0 Radar East Morning 2 1 0
6 November Radar West Evening 1 0 0 Radar West Morning 0 0 0
7 November Radar East Evening 0 1 1 BAOW
Radar East Morning 0 0 0
8 November5 Radar West Evening - - - Radar West Morning - - -
Radar Totals: 10 6
1 Landward directions = 165–284°. 2 Seaward directions = 345–104°. 3 Audiovisual observations of species that can in some cases contaminate petrel/shearwater radar data. These observations were
not included in totals of landward or seaward shearwater-like radar targets. 4 BAOW = Barn Owl, PAGP = Pacific Golden Plover. 5 Did not have access to primary sampling stations so collected anecdotal radar and visual observations during morning at an
ancillary station in the town of Kahuku.
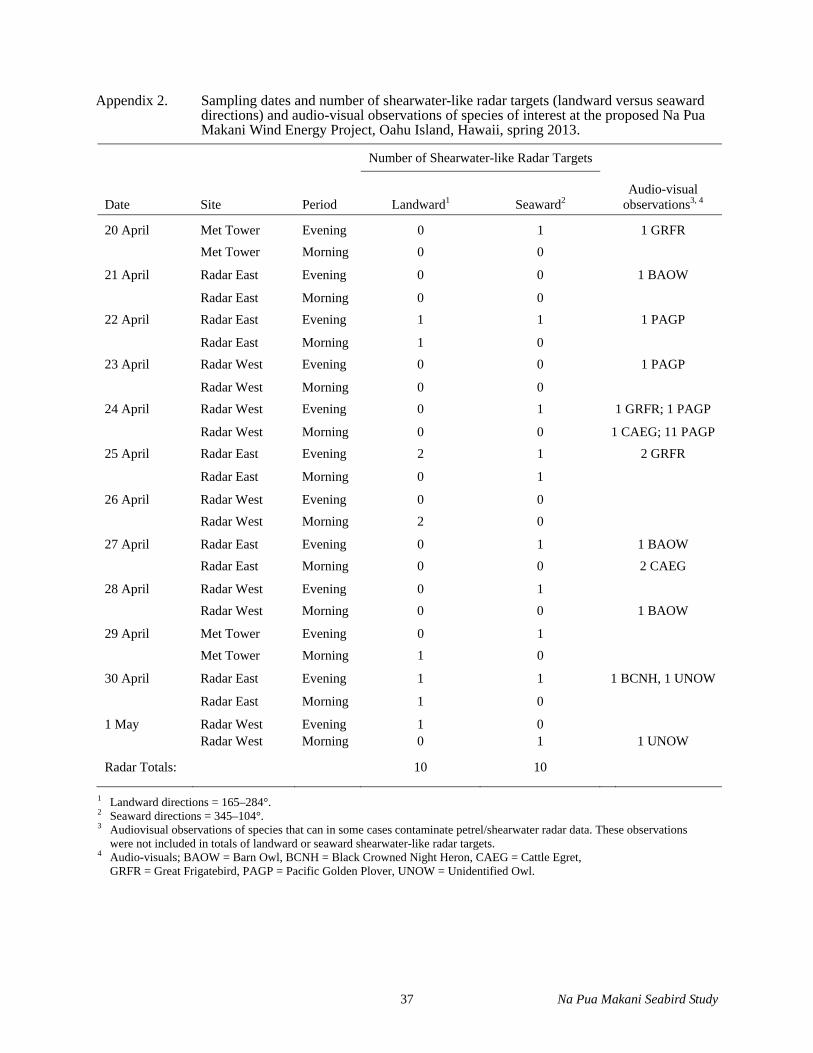
37 Na Pua Makani Seabird Study
Appendix 2. Sampling dates and number of shearwater-like radar targets (landward versus seaward directions) and audio-visual observations of species of interest at the proposed Na Pua Makani Wind Energy Project, Oahu Island, Hawaii, spring 2013.
Number of Shearwater-like Radar Targets
Date Site Period Landward1 Seaward2Audio-visual
observations3, 4
20 April Met Tower Evening 0 1 1 GRFR Met Tower Morning 0 0
21 April Radar East Evening 0 0 1 BAOW
Radar East Morning 0 0 22 April Radar East Evening 1 1 1 PAGP
Radar East Morning 1 0 23 April Radar West Evening 0 0 1 PAGP
Radar West Morning 0 0 24 April Radar West Evening 0 1 1 GRFR; 1 PAGP
Radar West Morning 0 0 1 CAEG; 11 PAGP 25 April Radar East Evening 2 1 2 GRFR
Radar East Morning 0 1
26 April Radar West Evening 0 0 Radar West Morning 2 0
27 April Radar East Evening 0 1 1 BAOW Radar East Morning 0 0 2 CAEG
28 April Radar West Evening 0 1 Radar West Morning 0 0 1 BAOW
29 April Met Tower Evening 0 1 Met Tower Morning 1 0
30 April Radar East Evening 1 1 1 BCNH, 1 UNOW
Radar East Morning 1 0
1 May Radar West Evening 1 0 Radar West Morning 0 1 1 UNOW
Radar Totals: 10 10
1 Landward directions = 165–284°. 2 Seaward directions = 345–104°. 3 Audiovisual observations of species that can in some cases contaminate petrel/shearwater radar data. These observations
were not included in totals of landward or seaward shearwater-like radar targets. 4 Audio-visuals; BAOW = Barn Owl, BCNH = Black Crowned Night Heron, CAEG = Cattle Egret, GRFR = Great Frigatebird, PAGP = Pacific Golden Plover, UNOW = Unidentified Owl.
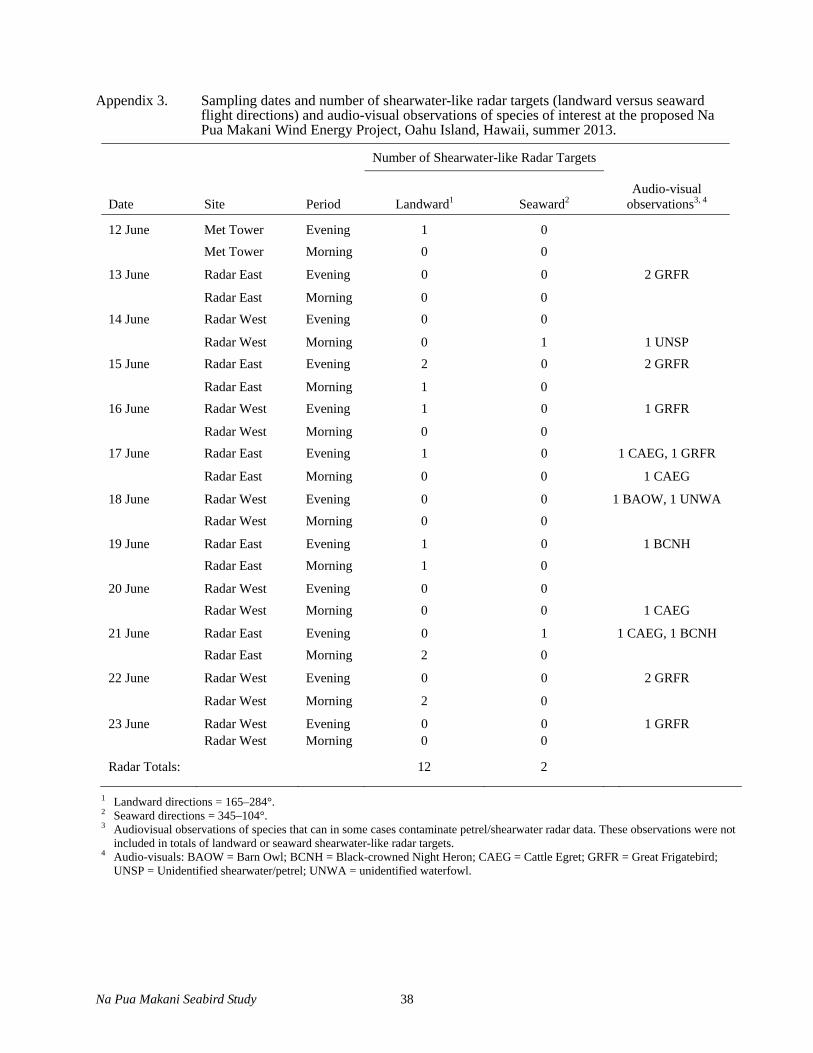
Na Pua Makani Seabird Study 38
Appendix 3. Sampling dates and number of shearwater-like radar targets (landward versus seaward flight directions) and audio-visual observations of species of interest at the proposed Na Pua Makani Wind Energy Project, Oahu Island, Hawaii, summer 2013.
Number of Shearwater-like Radar Targets
Date Site Period Landward1 Seaward2Audio-visual
observations3, 4
12 June Met Tower Evening 1 0 Met Tower Morning 0 0
13 June Radar East Evening 0 0 2 GRFR
Radar East Morning 0 0 14 June Radar West Evening 0 0
Radar West Morning 0 1 1 UNSP 15 June Radar East Evening 2 0 2 GRFR
Radar East Morning 1 0 16 June Radar West Evening 1 0 1 GRFR
Radar West Morning 0 0 17 June Radar East Evening 1 0 1 CAEG, 1 GRFR
Radar East Morning 0 0 1 CAEG
18 June Radar West Evening 0 0 1 BAOW, 1 UNWA Radar West Morning 0 0
19 June Radar East Evening 1 0 1 BCNH Radar East Morning 1 0
20 June Radar West Evening 0 0 Radar West Morning 0 0 1 CAEG
21 June Radar East Evening 0 1 1 CAEG, 1 BCNH Radar East Morning 2 0
22 June Radar West Evening 0 0 2 GRFR
Radar West Morning 2 0
23 June Radar West Evening 0 0 1 GRFR Radar West Morning 0 0
Radar Totals: 12 2
1 Landward directions = 165–284°. 2 Seaward directions = 345–104°. 3 Audiovisual observations of species that can in some cases contaminate petrel/shearwater radar data. These observations were not
included in totals of landward or seaward shearwater-like radar targets. 4 Audio-visuals: BAOW = Barn Owl; BCNH = Black-crowned Night Heron; CAEG = Cattle Egret; GRFR = Great Frigatebird;
UNSP = Unidentified shearwater/petrel; UNWA = unidentified waterfowl.
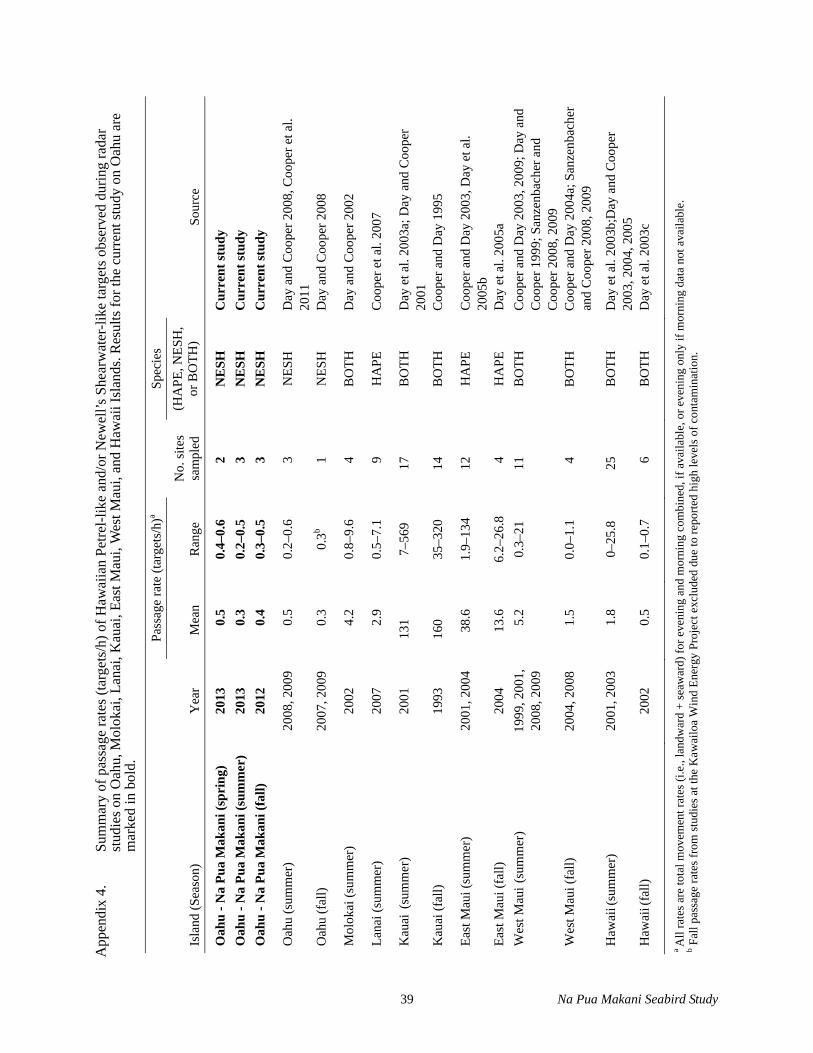
39 Na Pua Makani Seabird Study
App
endi
x 4.
Sum
mar
y of
pas
sage
rate
s (ta
rget
s/h)
of H
awai
ian
Petre
l-lik
e an
d/or
New
ell’s
She
arw
ater
-like
targ
ets o
bser
ved
durin
g ra
dar
stud
ies o
n O
ahu,
Mol
okai
, Lan
ai, K
auai
, Eas
t Mau
i, W
est M
aui,
and
Haw
aii I
slan
ds. R
esul
ts fo
r the
cur
rent
stud
y on
Oah
u ar
e m
arke
d in
bol
d.
Pass
age
rate
(tar
gets
/h)a
Sp
ecie
s
Isla
nd (S
easo
n)
Yea
r M
ean
Ran
ge
No.
site
s sa
mpl
ed
(HA
PE, N
ESH
, or
BO
TH)
Sour
ce
Oah
u - N
a Pu
a M
akan
i (sp
ring
) 20
13
0.5
0.4–
0.6
2 N
ESH
C
urre
nt st
udy
Oah
u - N
a Pu
a M
akan
i (su
mm
er)
2013
0.
3 0.
2–0.
5 3
NES
H
Cur
rent
stud
y O
ahu
- Na
Pua
Mak
ani (
fall)
20
12
0.4
0.3–
0.5
3 N
ESH
C
urre
nt st
udy
Oah
u (s
umm
er)
2008
, 200
9 0.
5 0.
2–0.
6 3
NES
H
Day
and
Coo
per 2
008,
Coo
per e
t al.
2011
O
ahu
(fal
l) 20
07, 2
009
0.3
0.3b
1 N
ESH
D
ay a
nd C
oope
r 200
8
Mol
okai
(sum
mer
) 20
02
4.2
0.8–
9.6
4 B
OTH
D
ay a
nd C
oope
r 200
2
Lana
i (su
mm
er)
2007
2.
9 0.
5–7.
1 9
HA
PE
Coo
per e
t al.
2007
Kau
ai (s
umm
er)
2001
13
1 7–
569
17
BO
TH
Day
et a
l. 20
03a;
Day
and
Coo
per
2001
K
auai
(fal
l) 19
93
160
35–3
20
14
BO
TH
Coo
per a
nd D
ay 1
995
East
Mau
i (su
mm
er)
2001
, 200
4 38
.6
1.9–
134
12
HA
PE
Coo
per a
nd D
ay 2
003,
Day
et a
l. 20
05b
East
Mau
i (fa
ll)
2004
13
.6
6.2–
26.8
4
HA
PE
Day
et a
l. 20
05a
Wes
t Mau
i(su
mm
er)
1999
, 200
1,
2008
, 200
9 5.
2 0.
3–21
11
B
OTH
C
oope
r and
Day
200
3, 2
009;
Day
and
C
oope
r 199
9; S
anze
nbac
her a
nd
Coo
per 2
008,
200
9 W
est M
aui (
fall)
20
04, 2
008
1.5
0.0–
1.1
4 B
OTH
C
oope
r and
Day
200
4a; S
anze
nbac
her
and
Coo
per 2
008,
200
9
Haw
aii(
sum
mer
) 20
01, 2
003
1.8
0–25
.8
25
BO
TH
Day
et a
l. 20
03b;
Day
and
Coo
per
2003
, 200
4, 2
005
Haw
aii(
fall)
20
02
0.5
0.1–
0.7
6 B
OTH
D
ay e
t al.
2003
c
aA
ll ra
tes a
re to
tal m
ovem
ent r
ates
(i.e
., la
ndw
ard
+ se
awar
d) fo
r eve
ning
and
mor
ning
com
bine
d, if
ava
ilabl
e, o
r eve
ning
onl
y if
mor
ning
dat
a no
t ava
ilabl
e.
b Fal
l pas
sage
rate
s fro
m st
udie
s at t
he K
awai
loa
Win
d En
ergy
Pro
ject
exc
lude
d du
e to
repo
rted
high
leve
ls o
f con
tam
inat
ion.

This page intentionally left blank
FINAL HABITAT CONSERVATION PLAN
Na Pua Makani Wind Energy Project
Appendix C: Species Detected during Biological Surveys at the Na Pua Makani Wind Energy Project

FINAL HABITAT CONSERVATION PLAN
Na Pua Makani Wind Energy Project
This page intentionally left blank
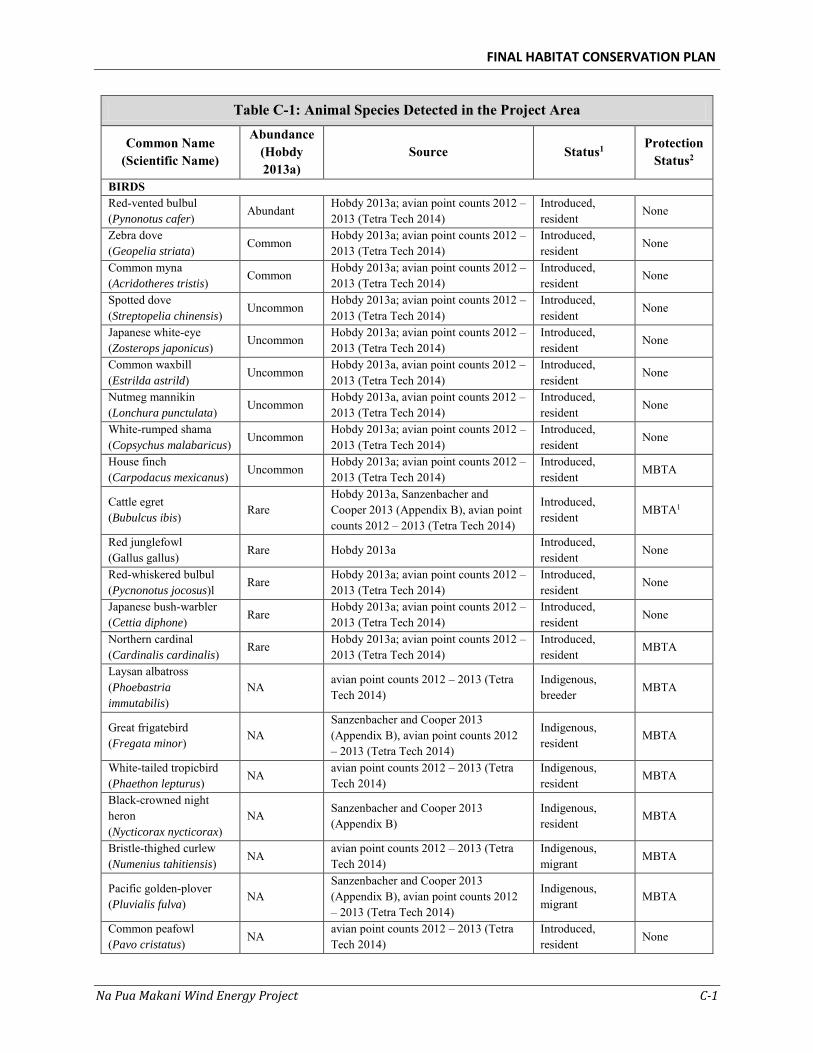
FINAL HABITAT CONSERVATION PLAN
Na Pua Makani Wind Energy Project C-1
Table C-1: Animal Species Detected in the Project Area
Common Name (Scientific Name)
Abundance (Hobdy 2013a)
Source Status1 Protection
Status2
BIRDS Red-vented bulbul (Pynonotus cafer)
Abundant Hobdy 2013a; avian point counts 2012 – 2013 (Tetra Tech 2014)
Introduced, resident
None
Zebra dove (Geopelia striata) Common
Hobdy 2013a; avian point counts 2012 – 2013 (Tetra Tech 2014)
Introduced, resident None
Common myna (Acridotheres tristis)
Common Hobdy 2013a; avian point counts 2012 – 2013 (Tetra Tech 2014)
Introduced, resident
None
Spotted dove (Streptopelia chinensis)
Uncommon Hobdy 2013a; avian point counts 2012 – 2013 (Tetra Tech 2014)
Introduced, resident
None
Japanese white-eye (Zosterops japonicus)
Uncommon Hobdy 2013a; avian point counts 2012 – 2013 (Tetra Tech 2014)
Introduced, resident
None
Common waxbill (Estrilda astrild)
Uncommon Hobdy 2013a, avian point counts 2012 – 2013 (Tetra Tech 2014)
Introduced, resident
None
Nutmeg mannikin (Lonchura punctulata) Uncommon
Hobdy 2013a, avian point counts 2012 – 2013 (Tetra Tech 2014)
Introduced, resident None
White-rumped shama (Copsychus malabaricus)
Uncommon Hobdy 2013a; avian point counts 2012 – 2013 (Tetra Tech 2014)
Introduced, resident
None
House finch (Carpodacus mexicanus) Uncommon
Hobdy 2013a; avian point counts 2012 – 2013 (Tetra Tech 2014)
Introduced, resident MBTA
Cattle egret (Bubulcus ibis) Rare
Hobdy 2013a, Sanzenbacher and Cooper 2013 (Appendix B), avian point counts 2012 – 2013 (Tetra Tech 2014)
Introduced, resident MBTA1
Red junglefowl (Gallus gallus) Rare Hobdy 2013a
Introduced, resident None
Red-whiskered bulbul (Pycnonotus jocosus)l
Rare Hobdy 2013a; avian point counts 2012 – 2013 (Tetra Tech 2014)
Introduced, resident
None
Japanese bush-warbler (Cettia diphone) Rare
Hobdy 2013a; avian point counts 2012 – 2013 (Tetra Tech 2014)
Introduced, resident None
Northern cardinal (Cardinalis cardinalis)
Rare Hobdy 2013a; avian point counts 2012 – 2013 (Tetra Tech 2014)
Introduced, resident
MBTA
Laysan albatross (Phoebastria
immutabilis) NA
avian point counts 2012 – 2013 (Tetra Tech 2014)
Indigenous, breeder MBTA
Great frigatebird (Fregata minor)
NA Sanzenbacher and Cooper 2013 (Appendix B), avian point counts 2012 – 2013 (Tetra Tech 2014)
Indigenous, resident
MBTA
White-tailed tropicbird (Phaethon lepturus)
NA avian point counts 2012 – 2013 (Tetra Tech 2014)
Indigenous, resident
MBTA
Black-crowned night heron (Nycticorax nycticorax)
NA Sanzenbacher and Cooper 2013 (Appendix B)
Indigenous, resident
MBTA
Bristle-thighed curlew (Numenius tahitiensis) NA
avian point counts 2012 – 2013 (Tetra Tech 2014)
Indigenous, migrant MBTA
Pacific golden-plover (Pluvialis fulva) NA
Sanzenbacher and Cooper 2013 (Appendix B), avian point counts 2012 – 2013 (Tetra Tech 2014)
Indigenous, migrant MBTA
Common peafowl (Pavo cristatus) NA
avian point counts 2012 – 2013 (Tetra Tech 2014)
Introduced, resident None
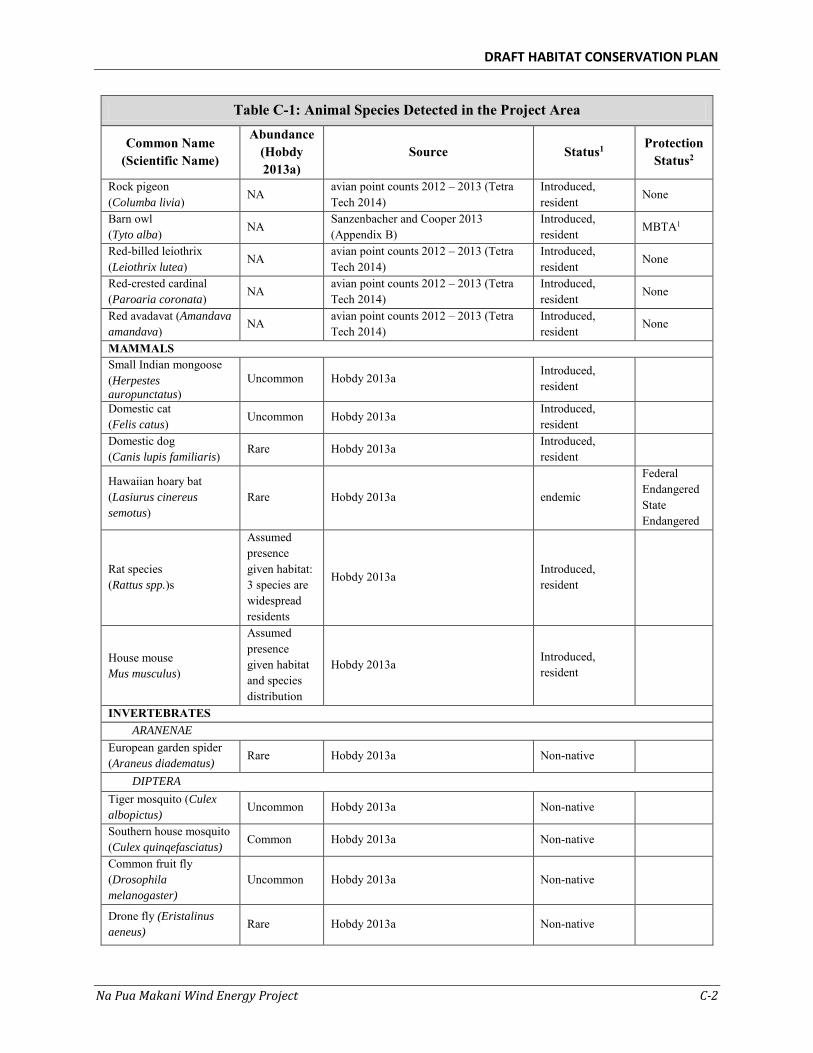
DRAFT HABITAT CONSERVATION PLAN
Na Pua Makani Wind Energy Project C-2
Table C-1: Animal Species Detected in the Project Area
Common Name (Scientific Name)
Abundance (Hobdy 2013a)
Source Status1 Protection
Status2
Rock pigeon (Columba livia)
NA avian point counts 2012 – 2013 (Tetra Tech 2014)
Introduced, resident
None
Barn owl (Tyto alba) NA
Sanzenbacher and Cooper 2013 (Appendix B)
Introduced, resident MBTA1
Red-billed leiothrix (Leiothrix lutea)
NA avian point counts 2012 – 2013 (Tetra Tech 2014)
Introduced, resident
None
Red-crested cardinal (Paroaria coronata) NA
avian point counts 2012 – 2013 (Tetra Tech 2014)
Introduced, resident None
Red avadavat (Amandava
amandava) NA avian point counts 2012 – 2013 (Tetra
Tech 2014) Introduced, resident
None
MAMMALS Small Indian mongoose (Herpestes
auropunctatus) Uncommon Hobdy 2013a
Introduced, resident
Domestic cat (Felis catus) Uncommon Hobdy 2013a
Introduced, resident
Domestic dog (Canis lupis familiaris)
Rare Hobdy 2013a Introduced, resident
Hawaiian hoary bat (Lasiurus cinereus
semotus) Rare Hobdy 2013a endemic
Federal Endangered State Endangered
Rat species (Rattus spp.)s
Assumed presence given habitat: 3 species are widespread residents
Hobdy 2013a Introduced, resident
House mouse Mus musculus)
Assumed presence given habitat and species distribution
Hobdy 2013a Introduced, resident
INVERTEBRATES ARANENAE
European garden spider (Araneus diadematus) Rare Hobdy 2013a Non-native
DIPTERA
Tiger mosquito (Culex
albopictus) Uncommon Hobdy 2013a Non-native
Southern house mosquito (Culex quinqefasciatus) Common Hobdy 2013a Non-native
Common fruit fly (Drosophila
melanogaster) Uncommon Hobdy 2013a Non-native
Drone fly (Eristalinus
aeneus) Rare Hobdy 2013a Non-native
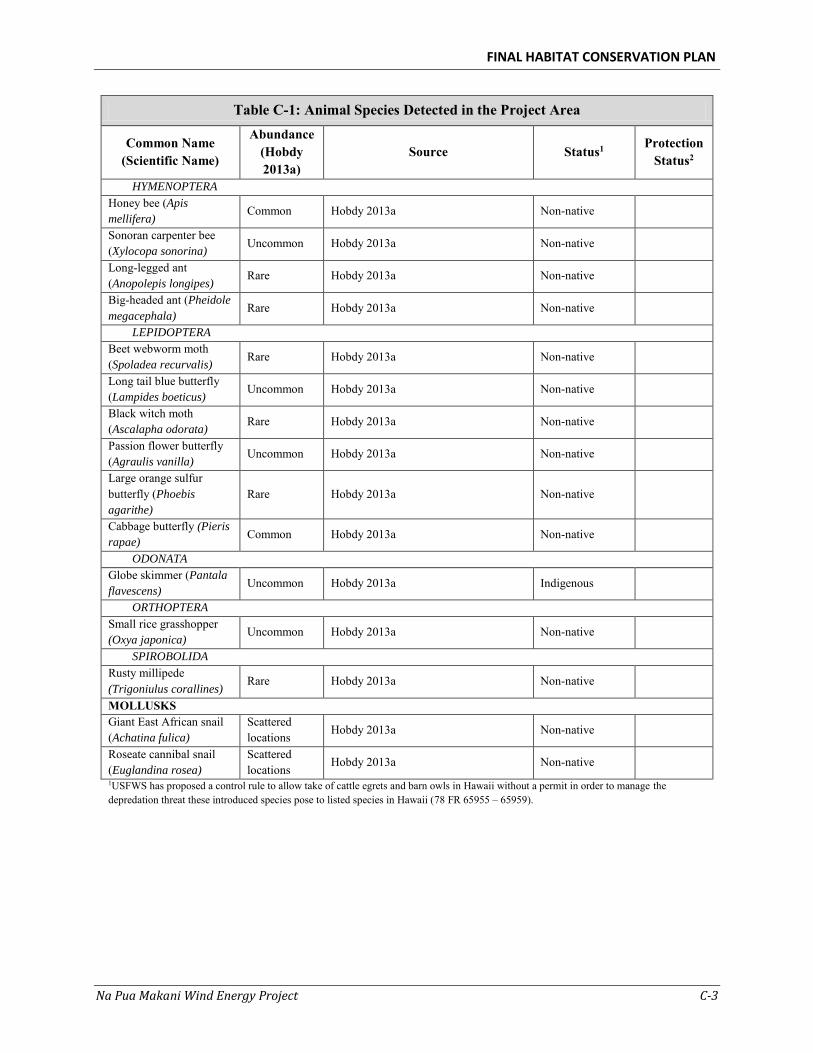
FINAL HABITAT CONSERVATION PLAN
Na Pua Makani Wind Energy Project C-3
Table C-1: Animal Species Detected in the Project Area
Common Name (Scientific Name)
Abundance (Hobdy 2013a)
Source Status1 Protection
Status2
HYMENOPTERA
Honey bee (Apis
mellifera) Common Hobdy 2013a Non-native
Sonoran carpenter bee (Xylocopa sonorina) Uncommon Hobdy 2013a Non-native
Long-legged ant (Anopolepis longipes)
Rare Hobdy 2013a Non-native
Big-headed ant (Pheidole
megacephala) Rare Hobdy 2013a Non-native
LEPIDOPTERA
Beet webworm moth (Spoladea recurvalis) Rare Hobdy 2013a Non-native
Long tail blue butterfly (Lampides boeticus)
Uncommon Hobdy 2013a Non-native
Black witch moth (Ascalapha odorata) Rare Hobdy 2013a Non-native
Passion flower butterfly (Agraulis vanilla)
Uncommon Hobdy 2013a Non-native
Large orange sulfur butterfly (Phoebis
agarithe) Rare Hobdy 2013a Non-native
Cabbage butterfly (Pieris
rapae) Common Hobdy 2013a Non-native
ODONATA
Globe skimmer (Pantala
flavescens) Uncommon Hobdy 2013a Indigenous
ORTHOPTERA
Small rice grasshopper (Oxya japonica)
Uncommon Hobdy 2013a Non-native
SPIROBOLIDA
Rusty millipede (Trigoniulus corallines)
Rare Hobdy 2013a Non-native
MOLLUSKS Giant East African snail (Achatina fulica)
Scattered locations Hobdy 2013a Non-native
Roseate cannibal snail (Euglandina rosea)
Scattered locations
Hobdy 2013a Non-native 1USFWS has proposed a control rule to allow take of cattle egrets and barn owls in Hawaii without a permit in order to manage the depredation threat these introduced species pose to listed species in Hawaii (78 FR 65955 – 65959).
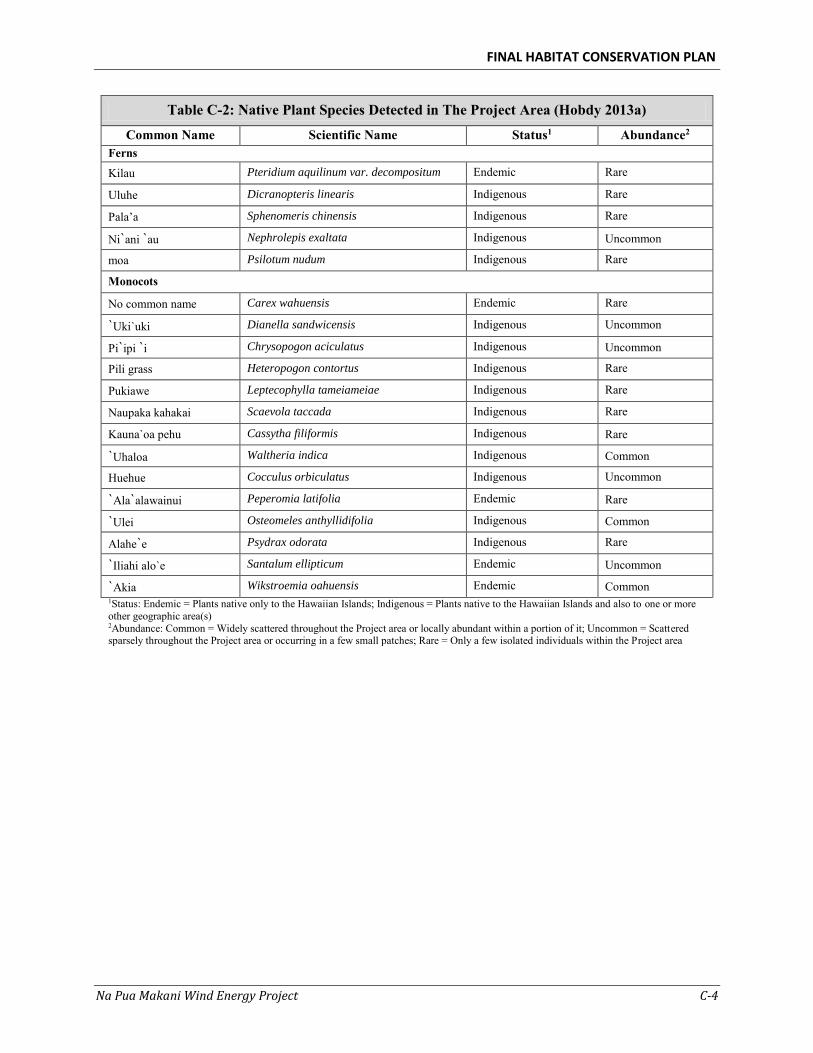
FINAL HABITAT CONSERVATION PLAN
Na Pua Makani Wind Energy Project C-4
Table C-2: Native Plant Species Detected in The Project Area (Hobdy 2013a)
Common Name Scientific Name Status1 Abundance2 Ferns
Kilau Pteridium aquilinum var. decompositum Endemic Rare
Uluhe Dicranopteris linearis Indigenous Rare
Pala’a Sphenomeris chinensis Indigenous Rare
Ni`ani `au Nephrolepis exaltata Indigenous Uncommon
moa Psilotum nudum Indigenous Rare
Monocots
No common name Carex wahuensis Endemic Rare
`Uki`uki Dianella sandwicensis Indigenous Uncommon
Pi`ipi `i Chrysopogon aciculatus Indigenous Uncommon
Pili grass Heteropogon contortus Indigenous Rare
Pukiawe Leptecophylla tameiameiae Indigenous Rare
Naupaka kahakai Scaevola taccada Indigenous Rare
Kauna`oa pehu Cassytha filiformis Indigenous Rare
`Uhaloa Waltheria indica Indigenous Common
Huehue Cocculus orbiculatus Indigenous Uncommon
`Ala`alawainui Peperomia latifolia Endemic Rare
`Ulei Osteomeles anthyllidifolia Indigenous Common
Alahe`e Psydrax odorata Indigenous Rare
`Iliahi alo`e Santalum ellipticum Endemic Uncommon
`Akia Wikstroemia oahuensis Endemic Common 1Status: Endemic = Plants native only to the Hawaiian Islands; Indigenous = Plants native to the Hawaiian Islands and also to one or more other geographic area(s) 2Abundance: Common = Widely scattered throughout the Project area or locally abundant within a portion of it; Uncommon = Scattered sparsely throughout the Project area or occurring in a few small patches; Rare = Only a few isolated individuals within the Project area
FINAL HABITAT CONSERVATION PLAN
Na Pua Makani Wind Energy Project
Appendix D: Records of Newell’s Shearwater Recovery Locations

FINAL HABITAT CONSERVATION PLAN
Na Pua Makani Wind Energy Project
This page intentionally left blank
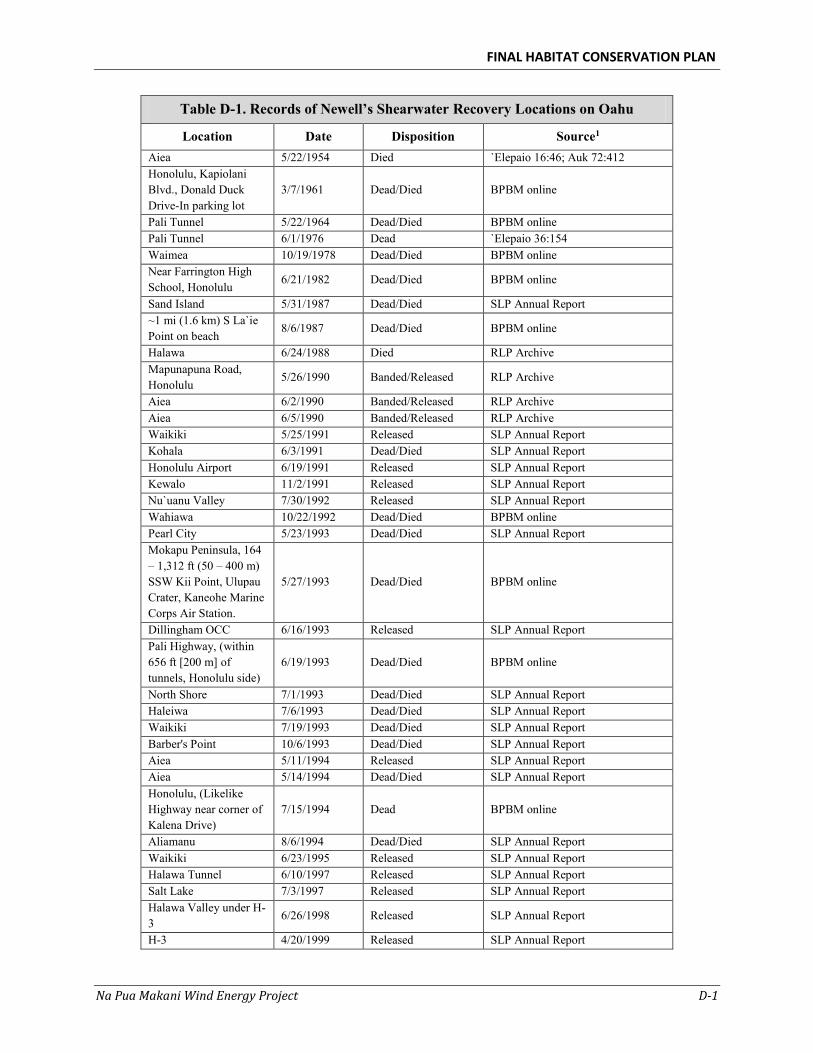
FINAL HABITAT CONSERVATION PLAN
Na Pua Makani Wind Energy Project D-1
Table D-1. Records of Newell’s Shearwater Recovery Locations on Oahu
Location Date Disposition Source1 Aiea 5/22/1954 Died `Elepaio 16:46; Auk 72:412 Honolulu, Kapiolani Blvd., Donald Duck Drive-In parking lot
3/7/1961 Dead/Died BPBM online
Pali Tunnel 5/22/1964 Dead/Died BPBM online Pali Tunnel 6/1/1976 Dead `Elepaio 36:154 Waimea 10/19/1978 Dead/Died BPBM online Near Farrington High School, Honolulu 6/21/1982 Dead/Died BPBM online
Sand Island 5/31/1987 Dead/Died SLP Annual Report ~1 mi (1.6 km) S La`ie Point on beach
8/6/1987 Dead/Died BPBM online
Halawa 6/24/1988 Died RLP Archive Mapunapuna Road, Honolulu
5/26/1990 Banded/Released RLP Archive
Aiea 6/2/1990 Banded/Released RLP Archive Aiea 6/5/1990 Banded/Released RLP Archive Waikiki 5/25/1991 Released SLP Annual Report Kohala 6/3/1991 Dead/Died SLP Annual Report Honolulu Airport 6/19/1991 Released SLP Annual Report Kewalo 11/2/1991 Released SLP Annual Report Nu`uanu Valley 7/30/1992 Released SLP Annual Report Wahiawa 10/22/1992 Dead/Died BPBM online Pearl City 5/23/1993 Dead/Died SLP Annual Report Mokapu Peninsula, 164 – 1,312 ft (50 – 400 m) SSW Kii Point, Ulupau Crater, Kaneohe Marine Corps Air Station.
5/27/1993 Dead/Died BPBM online
Dillingham OCC 6/16/1993 Released SLP Annual Report Pali Highway, (within 656 ft [200 m] of tunnels, Honolulu side)
6/19/1993 Dead/Died BPBM online
North Shore 7/1/1993 Dead/Died SLP Annual Report Haleiwa 7/6/1993 Dead/Died SLP Annual Report Waikiki 7/19/1993 Dead/Died SLP Annual Report Barber's Point 10/6/1993 Dead/Died SLP Annual Report Aiea 5/11/1994 Released SLP Annual Report Aiea 5/14/1994 Dead/Died SLP Annual Report Honolulu, (Likelike Highway near corner of Kalena Drive)
7/15/1994 Dead BPBM online
Aliamanu 8/6/1994 Dead/Died SLP Annual Report Waikiki 6/23/1995 Released SLP Annual Report Halawa Tunnel 6/10/1997 Released SLP Annual Report Salt Lake 7/3/1997 Released SLP Annual Report Halawa Valley under H-3
6/26/1998 Released SLP Annual Report
H-3 4/20/1999 Released SLP Annual Report
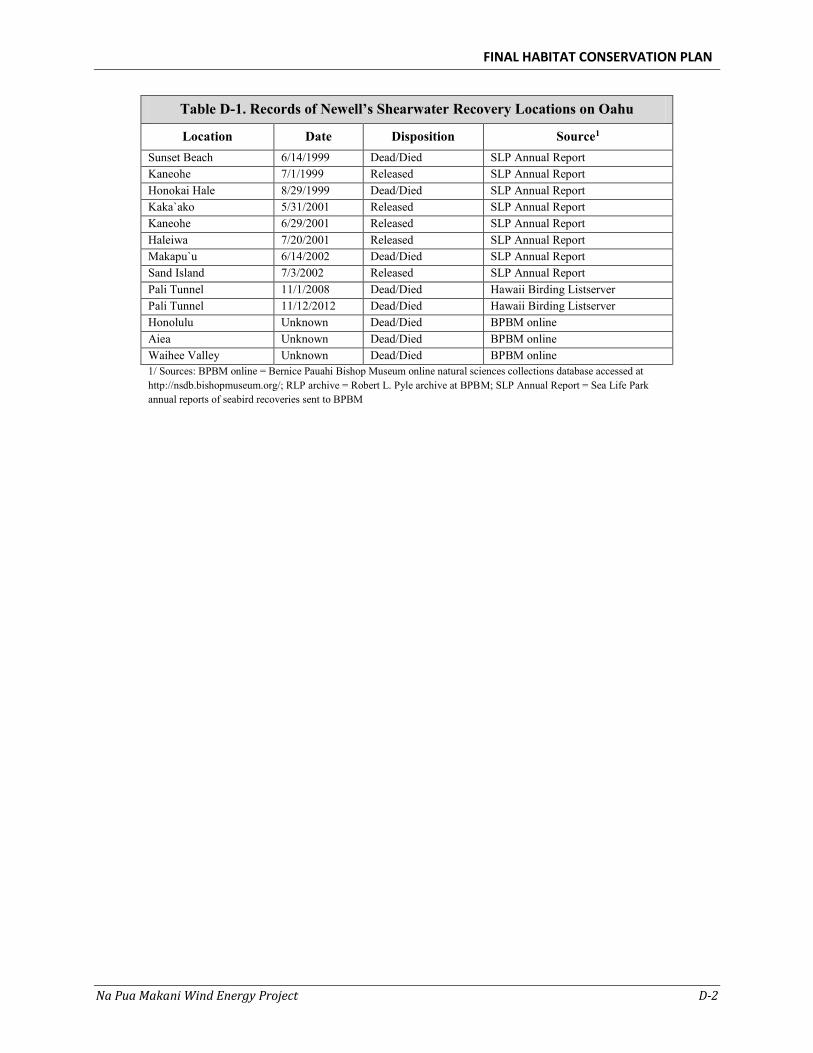
FINAL HABITAT CONSERVATION PLAN
Na Pua Makani Wind Energy Project D-2
Table D-1. Records of Newell’s Shearwater Recovery Locations on Oahu
Location Date Disposition Source1 Sunset Beach 6/14/1999 Dead/Died SLP Annual Report Kaneohe 7/1/1999 Released SLP Annual Report Honokai Hale 8/29/1999 Dead/Died SLP Annual Report Kaka`ako 5/31/2001 Released SLP Annual Report Kaneohe 6/29/2001 Released SLP Annual Report Haleiwa 7/20/2001 Released SLP Annual Report Makapu`u 6/14/2002 Dead/Died SLP Annual Report Sand Island 7/3/2002 Released SLP Annual Report Pali Tunnel 11/1/2008 Dead/Died Hawaii Birding Listserver Pali Tunnel 11/12/2012 Dead/Died Hawaii Birding Listserver Honolulu Unknown Dead/Died BPBM online Aiea Unknown Dead/Died BPBM online Waihee Valley Unknown Dead/Died BPBM online 1/ Sources: BPBM online = Bernice Pauahi Bishop Museum online natural sciences collections database accessed at http://nsdb.bishopmuseum.org/; RLP archive = Robert L. Pyle archive at BPBM; SLP Annual Report = Sea Life Park annual reports of seabird recoveries sent to BPBM
FINAL HABITAT CONSERVATION PLAN
Na Pua Makani Wind Energy Project
Appendix E: Management Plan Outline for Poamoho Bat Mitigation Area

FINAL HABITAT CONSERVATION PLAN
Na Pua Makani Wind Energy Project
This page intentionally left blank
FINAL HABITAT CONSERVATION PLAN
Na Pua Makani Wind Energy Project E-1
Draft Management Plan Annotated Outline for
Poamoho Natural Area Reserve
I. Introduction In 2013, the Natural Area Reserve System Commission recommended that a portion of the state-owned Poamoho Section of the Ewa Forest Reserve become established as the Poamoho Natural Area Reserve (Poamoho NAR; Figure 1). The 1,309 acre (530-hectare) area contains a variety of rare plants and animals that are threatened by damage from feral pigs (Sus scrofa) and invasive weeds. Inclusion of the area into the NAR system would improve the connectivity of areas managed for the protection and restoration of native ecosystems in the Ko`olau Mountains including areas managed by the U.S. Fish and Wildlife Service (USFWS), Hawaii Department of Land and Natural Resources (DLNR), and U.S. Army (Figure 1). The Poamoho NAR proposal includes a collaborative partnership between DLNR, Ko`olau Mountains Watershed Partnership (KMWP), and Oahu Army Natural Resources Program (OANRP) to construct feral pig fence exclosures, remove pigs from the fenced units, and conduct habitat restoration by implementing an invasive weed management program to reduce damage to native species and ecosystems within the Poamoho NAR. Kamehameha Schools is also a partner in protecting the area with a portion of one of the proposed exclosures located on Kamehameha Schools’ land. While funding for the construction of the fence is secure, and the fence is under construction, funding for pig removal, restoration efforts, and fence maintenance is not assured.
As part of a mitigation plan for the proposed Na Pua Makani Wind Farm, Na Pua Makani Power Partners has committed to fund long-term restoration and management at the Poamoho NAR that would include 1) fence maintenance, 2) feral pig removal, and 3) invasive weed control (Table 1). Na Pua Makani Power Partners would provide funding for 10 years, and successional funding may be implemented if additional mitigation is required under the terms and conditions of the U.S. Fish and Wildlife Service (USFWS) and DLNR incidental take permit/license. Annual reports will be submitted to the cooperating agencies and stakeholders that summarize the results of restoration activities and adaptive management approaches to habitat management and restoration.
The NAR designation has not been finalized for the Poamoho NAR nor has a management plan been developed as of May 2014. This document is intended to serve as a foundation for the initial restoration activities at the Poamoho NAR. The management plan will be a living document that may be modified over time to include other restoration and management goals. The initial restoration and management activities outlined in this document are broad to ensure they complement existing conservation goals and were formed in coordination with DLNR and KMWP.
II. Description of Poamoho NAR
A. Physical and natural characteristics.
B. List of common plant and animal species known to occur at the Poamoho NAR.
C. List of state species of greatest conservation need and federal threatened and
endangered species thought to occur or known to occur at the Poamoho NAR.
D. Current threats to the Poamoho NAR.
FINAL HABITAT CONSERVATION PLAN
Na Pua Makani Wind Energy Project E-2
III. Restoration and Management Plan
A. Fence maintenance
Following the construction of the fenced units by KMWP, OANRP, and DLNR, the integrity of the exclosure would be checked and repaired during approximately quarterly inspections to ensure feral pigs cannot pass through the fence. Efforts would include visual inspections conducted by walking the perimeter of the fence, and personnel would repair holes and fasteners, replace panels, and reset or replace posts as needed to maintain fence integrity.
B. Feral pig removal
Removing feral pigs from the pig exclosure within the Poamoho NAR may begin once the fenced units are constructed. The most cost-effective pig control measures for remote areas in Hawaii will be used and may include snaring or traditional hunting. Feral pig activity will be monitored within the fenced units to provide long term data to document any pig use and habitat recovery. This information may also be used to target management activities. Monitoring techniques may include game cameras, surveying with trained dogs, transect surveys, or other techniques. The amount of effort required to remove pigs from the fenced units, maintain these as pig-free environments, and monitor results is likely to vary over time. Approximate effort levels are described in Table 1.
C. Invasive weed control
Invasive weeds would be managed using an approach designed to prevent the establishment of high risk invasive species, eliminate isolated populations of established invasive species, and control well-established and widespread weed species. Baseline weed mapping of prioritized target species and large non-native patches of vegetation will be performed using a combination of techniques that may include approaches such as aerial imagery interpretation, gigapan photography, and walking survey. For ongoing management, the fenced area will be divided up into smaller weed management units based on topography and species to be controlled. This will allow the crew to pack for specific actions and to complete a regular schedule of monitoring and control in a discrete area. Weed species will be managed using a variety of mechanical and chemical techniques. Weed distribution and abundance will be tracked to document changes over time and measure habitat recovery. Efforts required to manage invasive weed species within the fenced units and monitor results is likely to vary over time. Approximate effort levels are described in Table 1.
IV. Adaptive Management
Alternative measures that improve the effectiveness of the restoration and management activities may be considered. The process of identifying alternative measures would occur in coordination with managing entities and other stakeholders in response to monitoring results or new science on restoration and management approaches. Approaches could include the use of biological control agents to help manage invasive plant species or the outplanting of native species to accelerate recovery, prevent erosion, or prevent the recolonization of weed species in treated areas.
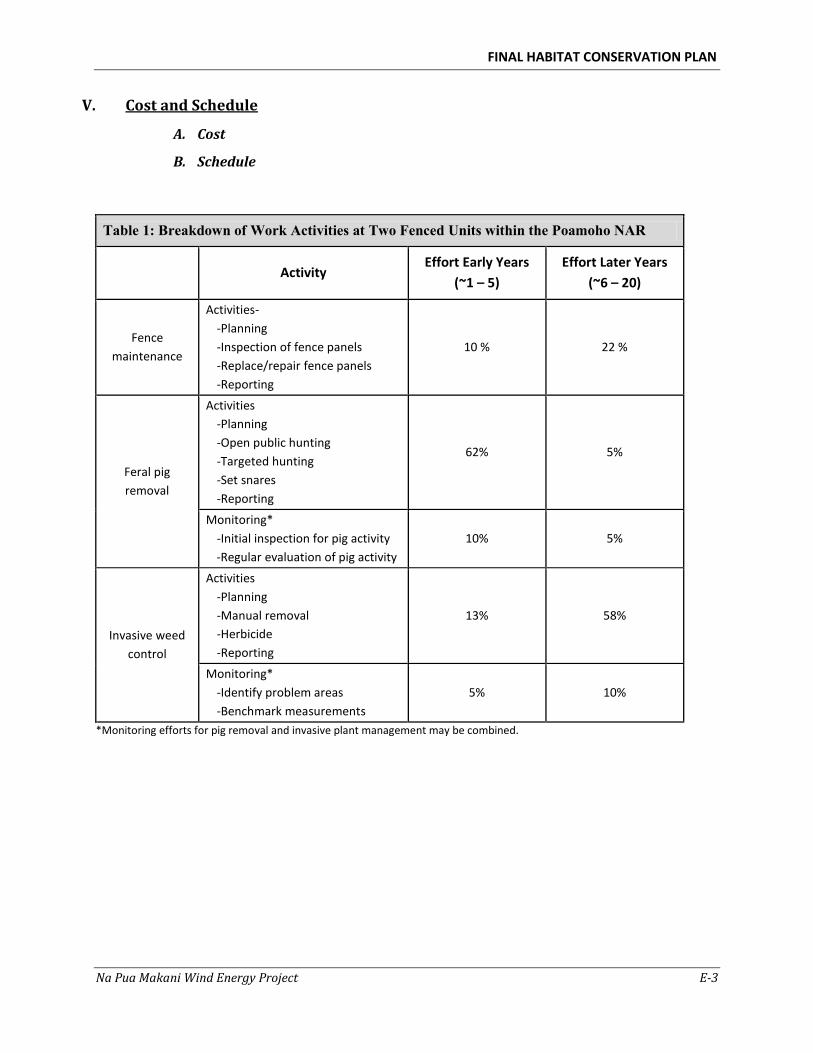
FINAL HABITAT CONSERVATION PLAN
Na Pua Makani Wind Energy Project E-3
V. Cost and Schedule
A. Cost
B. Schedule
Table 1: Breakdown of Work Activities at Two Fenced Units within the Poamoho NAR
Activity Effort Early Years
(~1 – 5)
Effort Later Years
(~6 – 20)
Fence
maintenance
Activities-
-Planning
-Inspection of fence panels
-Replace/repair fence panels
-Reporting
10 % 22 %
Feral pig
removal
Activities
-Planning
-Open public hunting
-Targeted hunting
-Set snares
-Reporting
62% 5%
Monitoring*
-Initial inspection for pig activity
-Regular evaluation of pig activity
10% 5%
Invasive weed
control
Activities
-Planning
-Manual removal
-Herbicide
-Reporting
13% 58%
Monitoring*
-Identify problem areas
-Benchmark measurements
5% 10%
*Monitoring efforts for pig removal and invasive plant management may be combined.
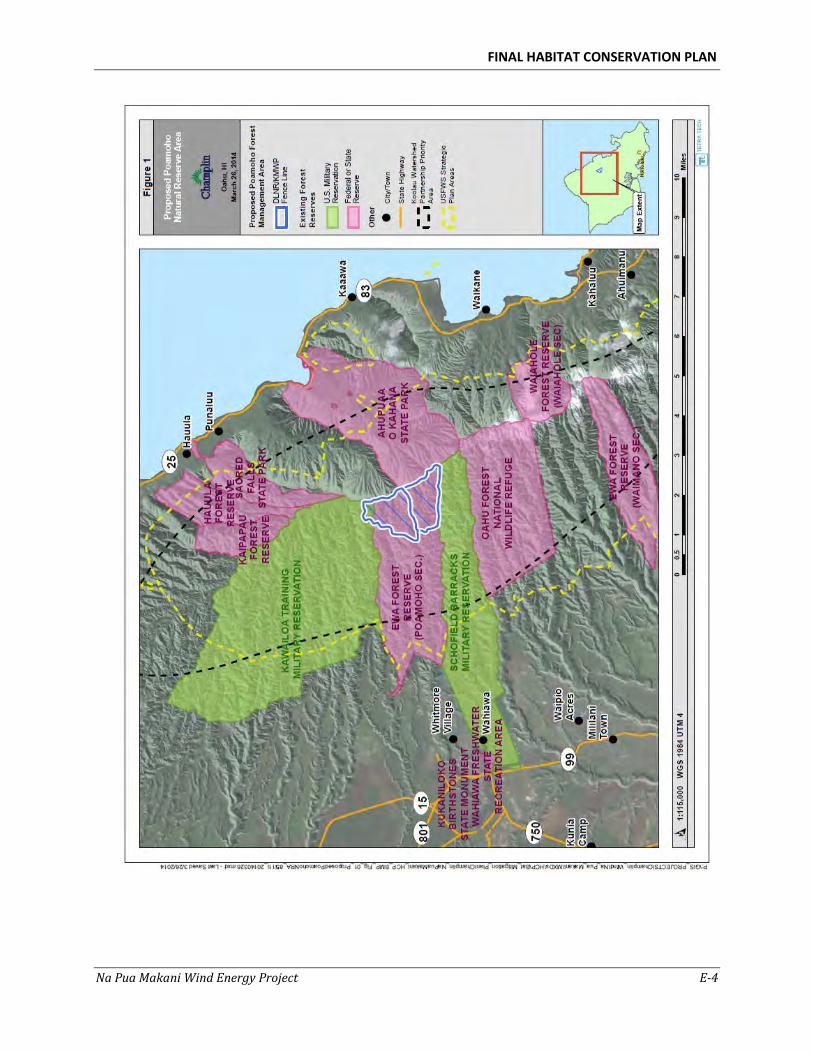
FINAL HABITAT CONSERVATION PLAN
Na Pua Makani Wind Energy Project E-4
FINAL HABITAT CONSERVATION PLAN
Na Pua Makani Wind Energy Project
Appendix F: Estimated Mitigation Funding Matrix

FINAL HABITAT CONSERVATION PLAN
Na Pua Makani Wind Energy Project
This page intentionally left blank
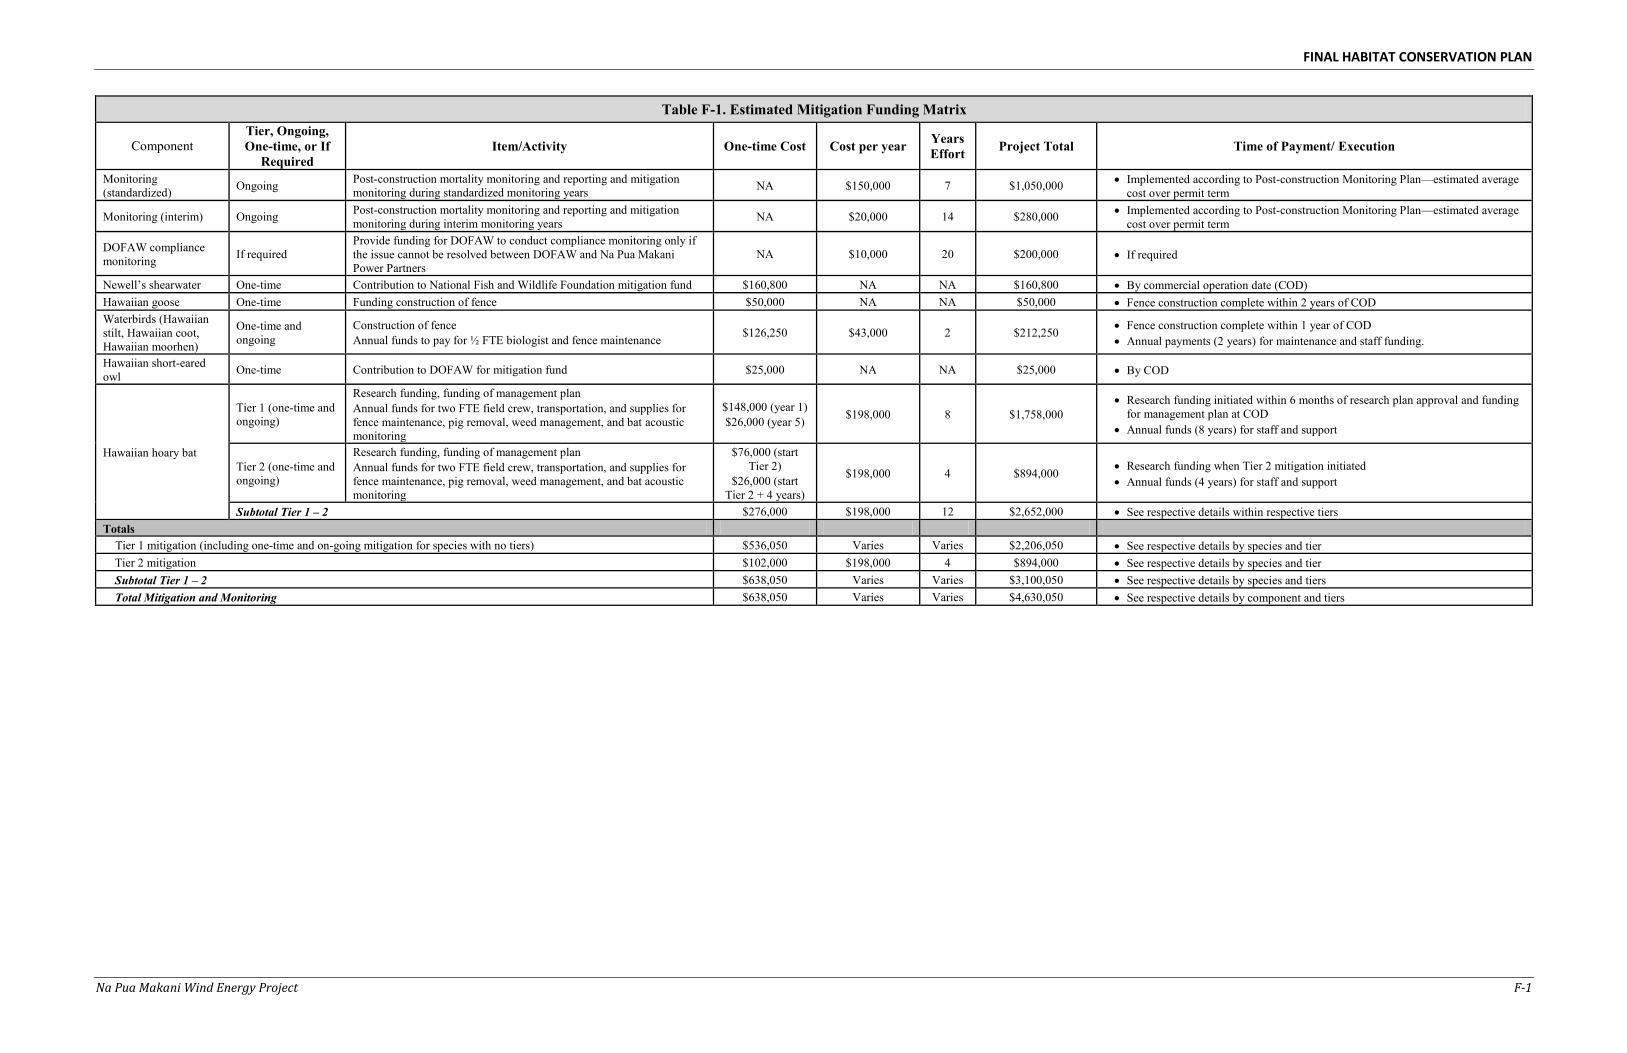
FINAL HABITAT CONSERVATION PLAN
Na Pua Makani Wind Energy Project F-1
Table F-1. Estimated Mitigation Funding Matrix
Component Tier, Ongoing, One-time, or If
Required Item/Activity One-time Cost Cost per year Years
Effort Project Total Time of Payment/ Execution
Monitoring (standardized) Ongoing Post-construction mortality monitoring and reporting and mitigation
monitoring during standardized monitoring years NA $150,000 7 $1,050,000 Implemented according to Post-construction Monitoring Plan—estimated average cost over permit term
Monitoring (interim) Ongoing Post-construction mortality monitoring and reporting and mitigation monitoring during interim monitoring years NA $20,000 14 $280,000 Implemented according to Post-construction Monitoring Plan—estimated average
cost over permit term
DOFAW compliance monitoring If required
Provide funding for DOFAW to conduct compliance monitoring only if the issue cannot be resolved between DOFAW and Na Pua Makani Power Partners
NA $10,000 20 $200,000 If required
Newell’s shearwater One-time Contribution to National Fish and Wildlife Foundation mitigation fund $160,800 NA NA $160,800 By commercial operation date (COD) Hawaiian goose One-time Funding construction of fence $50,000 NA NA $50,000 Fence construction complete within 2 years of COD Waterbirds (Hawaiian stilt, Hawaiian coot, Hawaiian moorhen)
One-time and ongoing
Construction of fence Annual funds to pay for ½ FTE biologist and fence maintenance $126,250 $43,000 2 $212,250 Fence construction complete within 1 year of COD
Annual payments (2 years) for maintenance and staff funding.
Hawaiian short-eared owl One-time Contribution to DOFAW for mitigation fund $25,000 NA NA $25,000 By COD
Hawaiian hoary bat
Tier 1 (one-time and ongoing)
Research funding, funding of management plan Annual funds for two FTE field crew, transportation, and supplies for fence maintenance, pig removal, weed management, and bat acoustic monitoring
$148,000 (year 1) $26,000 (year 5) $198,000 8 $1,758,000
Research funding initiated within 6 months of research plan approval and funding for management plan at COD
Annual funds (8 years) for staff and support
Tier 2 (one-time and ongoing)
Research funding, funding of management plan Annual funds for two FTE field crew, transportation, and supplies for fence maintenance, pig removal, weed management, and bat acoustic monitoring
$76,000 (start Tier 2)
$26,000 (start Tier 2 + 4 years)
$198,000 4 $894,000 Research funding when Tier 2 mitigation initiated Annual funds (4 years) for staff and support
Subtotal Tier 1 – 2 $276,000 $198,000 12 $2,652,000 See respective details within respective tiers Totals
Tier 1 mitigation (including one-time and on-going mitigation for species with no tiers) $536,050 Varies Varies $2,206,050 See respective details by species and tier Tier 2 mitigation $102,000 $198,000 4 $894,000 See respective details by species and tier Subtotal Tier 1 – 2 $638,050 Varies Varies $3,100,050 See respective details by species and tiers Total Mitigation and Monitoring $638,050 Varies Varies $4,630,050 See respective details by component and tiers
FINAL HABITAT CONSERVATION PLAN
Na Pua Makani Wind Energy Project F-2
This page intentionally left blank