Na ara Te nologies Limited - corp.nazara.com
53
Na ara Te nologies Limited (Formerly known as Nazara Technologies Private Limited) Naza ra™ May 29, 2021 BSE Limited Phiroze Jeejeebhoy Towers, Dalal Street, National Stock Exchange of India Limited Exchange Plaza , C- 1, Block G, Mumbai - 400001 Security Code: 543280 Bandra Kurla Complex, Bandra {E) , Mumbai - 400 051 Scrip Symbol: NAZARA Sub: Intimation of Investor Presentation for Financial Year 2021 Dear Sir/ Madam, In pursuance to Regulation 30 of the SEBI (Listing Obligations and Disclosure Requirements), Regulations 2015, please find enclosed herewith the Investor Presentation for Financial Year ended 31 ' 1 March 2021. This is for your informat ion and records. Tha ri ki ng you. Yours Faithfully, For Nazara Technologies Limited Pratibha Mishra Company Secretary & Compliance officer En cl: As above India I Middle East I Africa I Europe Regd.Office: 51-57, Maker Chamber 111, Nariman Point Mumbai - 400021.Tel.: +91-22-40330800 / 22810303 / 22813030 Fax: +91 -22-22810606 E-mail: [email protected]:www.nazara.com CIN : U72900MH1999PLC122970
Transcript of Na ara Te nologies Limited - corp.nazara.com

Na ara Te nologies Limited (Formerly known as Nazara Technologies Private Limited)
Nazara™
May 29, 2021
BSE Limited Phiroze Jeejeebhoy Towers, Dalal Street,
National Stock Exchange of India Limited Exchange Plaza, C-1, Block G,
Mumbai- 400001 Security Code: 543280
Bandra Kurla Complex, Bandra {E), Mumbai - 400 051 Scrip Symbol: NAZARA
Sub: Intimation of Investor Presentation for Financial Year 2021
Dear Sir/ Madam,
In pursuance to Regulation 30 of the SEBI (Listing Obligations and Disclosure Requirements), Regulations
2015, please find enclosed herewith the Investor Presentation for Financial Year ended 31'1 March 2021.
This is for your information and records.
Tha ri king you.
Yours Faithfully, For Nazara Technologies Limited
~ Pratibha Mishra Company Secretary & Compliance officer
Encl: As above
India I Middle East I Africa I Europe
Regd.Office: 51-57, Maker Chamber 111, Nariman Point Mumbai - 400021.Tel.: +91-22-40330800 / 22810303 / 22813030 Fax: +91 -22-22810606 E-mail: [email protected]:www.nazara.com CIN : U72900MH1999PLC122970

Nazara Technologies Limited
FY21
Investor PresentationMay 2021

2
Safe Harbour
This presentation and the accompanying slides (the “Presentation”), which have been prepared by Nazara Technologies Ltd. (the“Company”), have been prepared solely for information purposes and do not constitute any offer, recommendation or invitation topurchase or subscribe for any securities, and shall not form the basis or be relied on in connection with any contract or bindingcommitment whatsoever. No offering of securities of the Company will be made except by means of a statutory offering documentcontaining detailed information about the Company.
This Presentation has been prepared by the Company based on information and data which the Company considers reliable, but theCompany makes no representation or warranty, express or implied, whatsoever, and no reliance shall be placed on, the truth,accuracy, completeness, fairness and reasonableness of the contents of this Presentation. This Presentation may not be all inclusiveand may not contain all of the information that you may consider material. Any liability in respect of the contents of, or any omissionfrom, this Presentation is expressly excluded.
This presentation contains certain forward-looking statements concerning the Company’s future business prospects and businessprofitability, which are subject to a number of risks and uncertainties and the actual results could materially differ from those in suchforward looking statements. The risks and uncertainties relating to these statements include, but are not limited to, risks anduncertainties regarding fluctuations in earnings, our ability to manage growth, competition (both domestic and international),economic growth in India and abroad, ability to attract and retain highly skilled professionals, time and cost over runs on contracts,our ability to manage our international operations, government policies and actions regulations, interest and other fiscal costsgenerally prevailing in the economy. The Company does not undertake to make any announcement in case any of these forward-looking statements become materially incorrect in future or update any forward-looking statements made from time to time by or onbehalf of the Company.

3
Company Overview
Kiddopia (Gamified e-learning)
• A leading India-based diversified gaming and sports media platform
Diverse business segments including eSports, gamified early learning, freemium, skill-based, fantasy and trivia real money gaming, and telco subscription
Owns and has exclusive access to iconic IPs such as World Cricket Championship (WCC), Kiddopia, Halaplay, Qunami etc.
Highly attractive and large user base with 62.59mn Average Monthly Active Users (MAUs) for FY21, a growth of 56% YoY
Visionary management team with a deep talent pool (343 employees) – management team has been instrumental in achieving market leading positions across segments
eSports Freemium
12.73m1 (Sports)Avg. MAUs
Paid Subscribers340,282
72% growth from FY20
Trial to Activation Rate 71.4%1
eSports eSports Media
Average MAUs: 42.36m
138% growth from FY20
Organised 82% of all unique eSports events
in India
Source: Company information, Frost & Sullivan; 1. FY21 Average: Mar’20 to Mar’21
Revenue from Operations (in Mn Rs.)
2,475
4,542
FY20 FY21
84%
98
596
FY20 FY21
508%
EBITDA (in Mn Rs.)
3.7% 12.7%
EBITDA %
Key Business Metrics
Market-first position in India across esports and sports simulation
4
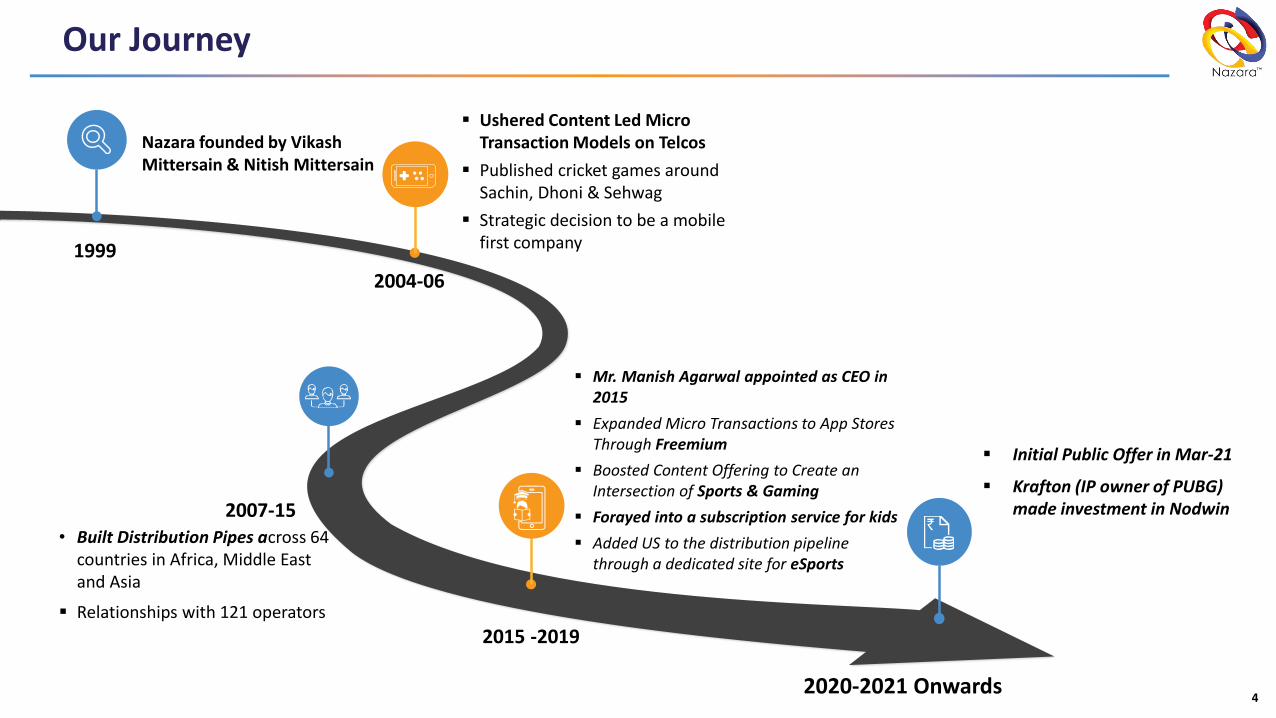
Our Journey
2020-2021 Onwards
2015 -2019
2004-06
1999
2007-15
Nazara founded by Vikash Mittersain & Nitish Mittersain
▪ Ushered Content Led Micro Transaction Models on Telcos
▪ Published cricket games around Sachin, Dhoni & Sehwag
▪ Strategic decision to be a mobile first company
• Built Distribution Pipes across 64 countries in Africa, Middle East and Asia
▪ Relationships with 121 operators
▪ Mr. Manish Agarwal appointed as CEO in 2015
▪ Expanded Micro Transactions to App Stores Through Freemium
▪ Boosted Content Offering to Create an Intersection of Sports & Gaming
▪ Forayed into a subscription service for kids
▪ Added US to the distribution pipeline through a dedicated site for eSports
▪ Krafton (IP owner of PUBG) made investment in Nodwin
▪ Initial Public Offer in Mar-21

5
Our Unique Story
Only Diversified Player in India
▪ Across Geography: Developed and Emerging Markets
▪ Business Model: Advertising, Subscription, Media Rights, In-App purchases, Brand Sponsorships
▪ Across Business Segments: eSports, Sports Simulation, Early Learners and Skill based Fantasy among others
IP Owned Assets
▪ Only player in India with owned IP across categories
▪ 100% inhouse content creation
▪ Makes its own Software / Game engines
Global Distribution Network
▪ Distribution pipelines / network with 52 telcos in 58 countries including Africa, Middle East, South Asia
▪ App store relationships with Apple and Google
Capital Efficient & Sustainable Growth
▪ Debt Free, has a track record of Positive EBITDA, Net Profit generation and Positive Cash Flows over 10+ years
▪ Since inception right up to December 2020, primary funding raised only to the tune of INR 126.30 million (in two tranches in 2005 and 2007) and INR 765.31 million in 2018. As a result, we have historically been EBITDA positive

Business Overview Snapshot
Nazara is the leading India-based diversified gaming and sports media platform
Gamified Early Learning(39% of revenue)
Freemium(4% of revenue)
Target demographicsSelect offerings Revenue Model
Telco subscription(17% of revenue)
Children aged 2-6 years
Players aged 15-35 years
First-time mobile gamers
Mass mobile internet usersGames Hub
Games Club
Games Lounge
▪ Subscription based
▪ In-app purchases &
Advertisements
▪ Partnerships with telecom operators
eSports(37% of revenue)
eSports and sports fans
Sports spectators
▪ Media rights & Brand Sponsorships
▪ Advertisements through ad-networks
and programmatic-demand-channels
Youngsters
Sports Fans
▪ Platform fee collected from skill
games played on the platform
Skill-based, fantasy and trivia real money gaming(3% of revenue)
Overview
Immersive, self-directed learning experience with content designed and developed in-house
Casual to mid-core, free-to-play sports simulation and children’s games
Bouquet of mobile games offered as value-added services to telco subscribers
#1 player in the fast-growing
Indian eSports segment and leading sports news destination
Strategic presence in real-money gaming and sports fantasy gaming
6Revenue as of FY21

GAMING INDUSTRY

8
Gaming - New Leader in M&E Sector
116.0125.4
140.5
157.5
41.0 42.0 42.2 39.8
17.0 19.5 20.2
57.0
2017 2018 2019 2020
Gaming Movie Music
Global Gaming Industry Compared with Movies & Music2017-2020 (in USD Billions)
Indian Gaming Industry Compared with Bollywood 2016-2023 (in USD Billions)
0.50.7
0.9
1.2
1.5
2.0
2.7
3.5
2.0 2.12.3
2.6
0.9
2.6 2.7 2.7
2022E2021E2019 20202016 2017 2023E2018
Gaming Bolywoood
10.7% CAGR
28.9% CAGR
32.6% CAGR
Driven by the proclivity of the Indian population to adopt gaming as their primary
source of entertainment
Gaming Industry 25% of Bollywood
Industry
Global Gaming Industry larger than Music & Movies
Source: Frost & Sullivan Analysis

9
Global Trends Affecting Gaming Eco-system
Per Capita Income Growth
15,60017,820
2015 2020
+3.5%
80.2
135.1
2015 2020
+11%
Global (in USD) India (in Rs.)
✓ India is one of the fastest growing economies globally✓ Rising income levels and disposable income are directly
correlated with increase in gaming spends
81%
Global
72%78%
US
90%
China
67%
85%
India
51%
88%77% 80% 85%
52%
2016 2020 2023E
Smartphone User Penetration
✓ The increase in the smartphone penetration is directly correlated with the increase in the number of mobile gamers
✓ As smartphones become cheaper and cost of mobile data decreases, the mobile penetration increases and consequentially more people have access to mobile games
Global
China
India
US
65%
36%
63%
51%
Gen Z and Millennial Population
✓ The digitally mature Gen Z population engages in gaming more than the millennial generation or generation X
✓ India provides a fertile ground for growth – fast growing gaming market and large Gen-Z and millennial population
Source: Frost & Sullivan
Source: IMF, World Bank
Source: Datareportal

10
The Indian Gaming Industry – Mobile gaming expected to increase
Indian Gaming Market (in USD Billion)
15% 35%
17%
9%
50%
77%
88%
2016
1.56%
2023E
2020
3%
0.5
3.5
Mobile
Others
Console
China Gaming Market (in USD Billion)
52%
38%
34%
47%
59%
62%2023E
1%2016
4%
2020 3%
27.0
42.7
53.1
US Gaming Market (in USD Billion)
24%
18%
14%
50%
54%
57%
26%
28%
27%
2016
39.22020
25.0
2023E 53.6
Indian mobile gaming market will replicate China’s historical growth and follow an equivalent trajectory
176286
385467
2011 2012 2013 2014
201269
326 368
2016 2018 2020 2022E
India
China 0.91.3
2.1
2011 2012 2013
0.81.2
1.7
2019 2020 2021E
2.2
25.2
2013 2020
1.2
3.1
2020 2023E
Number of mobile gamers Mobile gaming revenue Mobile gaming growth rate
Indian mobile gaming market is currently where the market in China was 8 to 10 years ago
CAGR: 38%
CAGR: 41%
Source: Company information, Frost & Sullivan; Exchange rate: 1 US$ = 75 INR

GAMIFIED EARLY LEARNING

12
Gamified Early Learning
Tillywig Toy Award
Parents’ Choice Foundation
Mom’s Choice Awards
Trusted and well recognized brand
▪ Flagship App – Kiddopia (COPPA certified by KidSAFE)
▪ Self-directed learning experience through gamification
▪ Children Aged 2-7 Years
▪ Present in 4 geographies
▪ 90% Revenue from North America
▪ Subscription based (Per Month - US$6.99; Per Year - US$59.99)
▪ Content created in India but sold to consumers abroad which leads to lower costs
▪ Roll out operations into Spanish, French, German speaking geographies
▪ Marketed through Google, Facebook and app stores
Overview
Target Demographics
Geography
Monetization
High content arbitrage
Expansion plans
Click HereVideo Link

13
Kiddopia – Key Metrics
Kiddopia Unit Economics
52,785
1,97,552
3,40,282
Mar-20Mar-19 Mar-21
+274%
+72%
Kiddopia Paid Subscriber base
Particulars in USD
Lifetime Value (24 months) 61
(less) App Store Commissions 28%
Net LTV (24 months) 44
(less) Cost of Subscription 30
Gross Profit 14
Gross Margin 32%
Content Cost 8-10%
EBITDA Margin 22-24%
191.3
1,758.4
FY20* FY21 -34.6
125.7
FY21FY20*
7.1%
EBITDA %
Revenue (in Mn Rs.) EBITDA (in Mn Rs.)
Activation ratio from free trial to subscription has also remained around 70%
*included from date of acquisition in the consolidated financial statement for FY 2019-20
581.6
1,758.4
FY20 FY21 -32.6
125.7
FY20 FY21
7.1%
Revenue (in Mn Rs.) EBITDA (in Mn Rs.)
Financials from the date of Acquisition Financials for the full year

14
US Market – An Opportunity
US Early Child Care & Education
(in bn USD)
US alone huge enough to absorb Nazara’s marketing spend and gain market share
42
34
Private Public
76
Source : Company, CNBC
United States leads the global early childhood education market▪ Americans fork out $ 76bn for early child-care and education, such as preschool programs
▪ Game-based learning is a key growth driver
▪ Majority of teachers support gamification initiatives to develop skills
1.0
4.0
12.6
2016
2020
2023E
US Gamified Early Learning Market
(in bn USD)
2.4
9.8
27.82023E
2016
2020
Global Gamified Early Learning Market
(in bn USD)
Source: eSchoolNews, Frost & Sullivan
727
381
10480 44
7
Asia Africa
LATAM+Caribbean Europe
North America Oceania
Global Addressable Population1 (2009)
(mn)
1,342
Note 1 : UN

eSPORTS

A. Nodwin Gaming

17
What is eSports?
Packed with thrill seeking Gen Z & Millennials,
watching professional athletes
compete in PUBG’s World Championships
Indira Gandhi Stadium
(New Delhi)
Streamed Live Worldwide
Packed with fans who are there not for a real cricket match,
but to watch gaming professionals
compete in a virtual ICC Final
Wankhede Stadium
(Mumbai)
https://bit.ly/3aDrntT
Intro to
eSports (Video)
2019
2025
Fast Forward
6 years
Streamed Live Worldwide

Video Link Click Here 18
eSports Overview
▪ Nodwin Gaming offers premium eSports content (live and on demand) to TV broadcasters and OTT platforms▪ Nodwin Gaming in partnership with game publishers and brands is engaged in providing e-sports gaming consultancy related to
organizing gaming events, sponsorships and related consultancy services▪ Only company in India to have rights over professional eSports tournament IP’s & content IP’s and assets across grassroot, regional,
national and international eSports
Overview
Intellectual Property Rights
▪ Owns and has sustained access to premium IP and popular local brands across eSports in India
▪ Media rights, sponsorships, white label, data services & ad networks▪ Media rights licensing contributed 55% of Nodwin revenue in FY21
Monetization
▪ Growth of in-app (IAP) led mobile gaming revenues in India leading to more global gaming publisher seeing India as an attractive market▪ Growth of Mid-core and Hard-core community base in India
Growth Drivers
775
1,357
FY20 FY21
71.7
137.3
FY21FY20
10.1%
Revenue (in Mn Rs.) EBITDA (in Mn Rs.)
9.3%
Format IPs Media RelationshipsContent IPs

Mobile Gamers
Publishers
Revenues
Multiple Leagues
Live Streaming
Market
19
eSports Growth Drivers
Increase in Mobile Gamers
Stimulates IAP
Behavior
Increases Revenue
Drives participatio
n from publishers
Publishers spend on building eSports
IAP Driven Revenues Live Stream Viewers
eSports
disrupting
sports ecosystem
eSports
Symbiotic with Publishers
Virtuous Cycles drive eSports

20
eSports Ecosystem
eSports
Ecosystem
▪ Manage and host IP-based gaming events
Arrangements with game publishers and internet service providers
▪ Promote and host online events and tournaments in India
Arrangements with tournament operators
▪ Exclusive channel management arrangement for telecasting events
Arrangements for broadcasting of eSports events▪ Done via television advertisements, social media,
influencer marketing and event marketing on platforms
Marketing
▪ Partner with eSports events to leverage Gen Z audiences to enhance brand value and create monetization avenues for all
stakeholders
Brands
▪ Exclusive license partnership with ESL for management and hosting Ip based gaming events
▪ Utilise publicly available technology platforms for hosting tournaments
Technology & infrastructure

21
Why Will We Continue to Dominate?
Deep Moat : Well entrenched community connect. Create & Celebrate Heroes
✓ Only company in India to have rights over IP and assetsacross grassroot, regional, national and international eSports
✓ This structure enables a Grassroot player to break into theInternational circuit
International
IPs
National
IPs
Grassroots/Regional
IPs
Zero to HeroGrassroot to International
We Create Heroes

22
Why Will We Continue to Dominate?
Publishers want to engage gamers Brands want to reach consumers
Nazara builds and owns tech infrastructure on which global games run locally
Tech Infrastructure
Gaming Activation/ Agency
eSports Properties
eSports Media Rights
Servers, Data Pipes, Optimized Routes, CDN, Game Servers, ISP Peering, Data Centers
White label agency work for Publishers, Game Developers and Brands
Leagues, Tournaments, Cups, International licensed properties, Self owned properties
Media rights and production for owned and licensed properties
Cre
ate
Bu
ildR
esu
lt

B. Sportskeeda

▪ A leading sport and eSports news destination website with content across WWE, eSports, cricket, soccer and basketball
▪ Largest eSports news destination in India
▪ According to Comscore report, Sportskeeda is the 2nd largest sports website in India
24
eSports Media
▪ Programmatic Ad inventory monetisation through automated demand channels
▪ Partnership with game publishers and brands offering audience engagement consultancy and highquality sports content in addition to the reach on the platform
Overview
Target demography
▪ eSports fans & sports spectators
Monthly Active users
▪ Average for FY21: 42.36 million MAUs and 87.97 million visits per month
Monetization
Click HereVideo Link

25
Key Metrics
-
2,00,00,000
4,00,00,000
6,00,00,000
8,00,00,000
Ap
r-2
0
May
-20
Jun
-20
Jul-
20
Au
g-2
0
Sep
-20
Oct
-20
No
v-2
0
Dec
-20
Jan
-21
Feb
-21
Mar
-21
MAU Sportskeeda
29 3447
59
129143
228
199
0
50
100
150
200
250
FY18 FY21FY20FY19
Average Session Duration (Sec) Visits/month (in million)
The increase in visits per month has resulted in a corresponding increase in ad revenue
66.7
343.2
FY20* FY21
3.1
167.4
FY21FY20*
Revenue (in Mn Rs.) EBITDA (in Mn Rs.)
48.8%4.6%
142.2
343.2
FY21FY20
13.5
167.4
FY21FY20
EBITDA %
Revenue (in Mn Rs.) EBITDA (in Mn Rs.)
48.8%9.5%
Financials from the date of Acquisition
Financials for the full year
*included from date of acquisition in the consolidated financial statement for FY 2019-20

FREEMIUM

27
Freemium
Overview▪ Freemium is Free to download games from Google play and App store
▪ Casual to mid-core, free-to-play sports simulation and children’s games
Established Presence
▪ World Cricket Championship (WCC) is the largest mobile-based cricket simulation game
▪ Players aged 15-35 years and Children
▪ Ads and In-app Purchases
Target Demographics
Monetization
Award-winning gaming titles
Recognitions
Google Play UsersChoice Game of 2020 – WCC3
AatmaNirbhar Bharat App Innovation Challenge – WCC2
Video Link Click Here

28
Key Metrics
12.73 mnMAUs
100,000+Organic Install / day
46 1 (WCC)
Time spent (min./day/user)
MAUs – Monthly Active Users 1. For FY21
0.50
1.00
1.50
2.00
2.50
3.00
Ap
r-2
0
May
-20
Jun
-20
Jul-
20
Au
g-2
0
Sep
-20
Oct
-20
No
v-20
Dec
-20
Jan
-21
Feb
-21
Mar
-21
DAU (in million)
DAU ( in Mn) WCC
0.030%
0.080%
0.130%
0.180%
Ap
r-2
0
May
-20
Jun
-20
Jul-
20
Au
g-2
0
Sep
-20
Oct
-20
No
v-2
0
Dec
-20
Jan
-21
Feb
-21
Mar
-21
% IAP conversion
% IAP Conversion WCC
197.8 195.2
FY20 FY21
66.1
41.3
FY20 FY21
21.2%
Revenue (in Mn Rs.) EBITDA (in Mn Rs.)
33.4%
EBITDA %

29
IAP Drivers
Hard Core Gamers
Mid Core Gamers
Casual Gamers
Non Gamers
Surge in IAP will be Driven by Growth of Mid & Hard Core Gamers & Higher ARPPU
2018 2025
5mn 30mn
2020
10mn
15mn 100mn 35mn
100mn 500mn+250mn+
Underlying Consumer Behavior – Catalyst in Growth of Mid & Hard core Gamers & ARPPU
Hard Core Gamers
Mid Core Gamers
Casual Gamers
▪ Games are new social community for Millennials & Gen Z
▪ Shorter Matches - Quick results - Instant Fun & Fame
▪ Fewer games - longer shelf life - more time spent per day
▪ Play - Compete - Watch fuelling “cult status”
▪ Competitive spirit key driver of IAP and inherent part of Sports
Simulation/ Mobile Battle Arena Shooting ( MOBA)
Revenue Pyramid 2025

30
Dominance in Cricket Gaming – A Massive Opportunity
Huge opportunity in cricket crazy India▪ In 2018, out of a TV viewing audience of 766mn, 93% watched cricket
▪ Nextwave’s cricket IP is similar to what FIFA (owned by EA) is to football
Market leader with a cult like following (mn)▪ 110 mn+ installs across Cricket (WCC1, WCC2, WCC3, Big Bash League, Rivals,
Battle of Chepauk), Carrom and TT
▪ Disrupting larger cricket market through virtual cricket as eSports (365 days
v/s IPL, only 6 weeks)
▪ Building own leagues/ cups and media business
High Organic Downloads for Cricket (WCC3)▪ Beta version of new cricket title (WCC3) launched in May 2020
▪ Commentary from Mathew Hayden and Akash Chopra
▪ Inspirations from FIFA, Fortnite, PES and PUBG Mobile
(features/monetization)
93.0%
Cricket draws 93% of sports viewers in India
2.3
25.0
110.0
DAUs MAUs Installs
40,000
3,40,000
Daily Installs WCC3 DAUs
WCC is the most Downloaded Cricket Game

31
Well poised to benefit from IAP led growth
IAP conversion is up (% DAUs)▪ DAU’s making IAPs is up 10.0x on WCC3, compared to WCC2 (previous title)
▪ We expect this number to reach 1.0% by FY 2025
Daily engagement is getting deeper (mins)▪ For the new cricket title ( WCC3), daily user engagement is already up
to 55 mins from 45 mins
▪ Game economy still being developed/ fine tuned based on market
feedback/ trends, with the full version to be launched in Q4
IAP Revenue/ Day is up 4.1x ($)▪ Multi player, game progression and enhanced game economy along with other
features are already moving IAP in the right direction
▪ Nazara is on a winning course here
WCC 2 WCC 3
WCC 2 WCC 3
400
1,643
Pre WCC3 Post WCC3
45
55
0.01%
0.1%
Well poised to benefit from IAP led growth

SKILL-BASED, FANTASY & REAL MONEY GAMES

33
Skill-based, fantasy and Trivia Real Money Gaming
Overview
▪ Entered skill-based gaming in India and have strategically created presence in the real moneygaming segment
▪ With the acquisition of Halaplay Technologies, and investments in Sports Unity, the Companyis participating in sports fantasy gaming and trivia games
Content ▪ Sports feed, including audio, visual, data and textual feed provided by official feed providers
▪ Agreements with technology and marketing service providers to manage large user trafficDistribution
Regulation▪ Strategically cautious entry into real money gaming in light of regulatory uncertainty in India
▪ Less than 5% of FY21 revenue from such offerings
Target Demographics
▪ Youngsters and Sports Fans
▪ Platform Fee (Specified percentage of total gaming transaction)Monetization
Key Offerings

34
Large Opportunity playing with binary risks of statutory issues
232
2018 2020
CEA ($ mn)
35
329
2018 2020
OFS Revenue ($ mn)
2018 2021
Market ($ mn)
Jun-16 Mar-20
Users (mn)
347
947
2
100 2,196
▪ Between 2018 and 2020, Online Fantasy Sports (OFS) revenue registered a 9.4x
growth
▪ While COVID-19 is likely to slow down the rapid growth in user base and
engagement (due to lack of live sports)
▪ Fundamentals of the business remain robust
▪ Growth of sports, coupled with digitization, is gradually making India a prime
market
▪ While cricket remains the favorite sport, Indians have started following
football, kabaddi, basketball, hockey etc
▪ 50% traffic is from Tier 2 and Tier 3 cities
Drivers
▪ Legal : Gambling is a state subject in India:
▪ If a chance-based game is played with stakes, it is gambling
▪ If a skill-based game is played with stakes, it is not gambling but real-
money gaming (aka skill-based gaming)
▪ More skill, less chance is legal. Less skill, more chance is illegal (exceptions
Sikkim, Goa and Nagaland)
▪ GST : Tax officials are yet to determine if GST is applicable on the total
transaction value or the net commissions (revenues) that accrue to gaming
companies
Regulation
Sources : EY, FIFS/KPMG, Newsrun

TELCO SUBSCRIPTION

36
Telco Subscription
Overview
▪ Catalogue of Android and HTML5 games offered as value-add services to telco subscribers
▪ Recently acquired non-exclusive global distribution rights for games developed by Disney
Target Demographics
▪ Late adopters of Internet, First-Time gamers
Monetization ▪ Subscription based (Daily / Weekly / Monthly) through carrier billing
Distribution▪ Strategic partnerships with multiple telecom operators
▪ Acquisition also driven through global & local ad networks
Technology▪ Asset light model using Nazara Content Management Platform (NCMP)
▪ NCMP links content providers with subscribers via telcos
Geographic Footprint
▪ 1,000+ games offerings to mobile usersin 58 countries through 52 telecomoperators

37
Free Cash Accretive
Stable revenues with strong EBITDA generation
818.0749.4
FY21FY20
205.8
137.3
FY20 FY21
Revenue (in Mn Rs.) EBITDA* (in Mn Rs.)
18.3%25.2%
Tech Platform
*All Corporate overheads is accounted in Telco Subscription business segment only, Operational EBITDA much higher
Highly scalable and cost-efficient model
▪ One common gaming/subscription platform implemented
across 52 telcos
▪ Revenues being generated in Middle East, Africa and S-Asia
Curated content catalogue, but common for the entire world
▪ Very low content cost (only 7% of overall business)
▪ Curated with the mindset of leveraging across the world
High RoI on Marketing Spend
▪ On every $ spent, Nazara makes $3
▪ Paid user acquisition done by the affiliate
▪ Risks passed on to them as well

RAPIDLY SCALING GROWTH THROUGH STRATEGIC ACQUISITONS

39
Strategic Acquisitions
3
2017 – Next WaveCommands the greatest mind
share in mobile cricket segment
2018 – Nodwin GamingDominates eSports with over
80% market share
2019 – HalaplayProvided entry into skill-based, fantasy and real-money gaming
2019 – SportskeedaLargest eSports news destination
website in India
2020 – Paper BoatProvided entry into gamified early
learning
▪ Nazara has expanded its portfolio of business by consistent strategic acquisitions since 2017
✓ Three companies (Paper boat, Nodwin Gaming and Absolute Sports) have scaled exponentially post acquisition
✓ World Cricket Championship: Iconic IP and Market leader in sports simulating genre; On track to scale revenues
✓ Halaplay – Skill based real money gaming: Binary risk in skill based and fantasy real money gaming and hence the shift in strategy, leading to contraction in investments

40
Our Future Approach to M&A
Pursue strategic investment and acquisition opportunities in underserved markets and geographies
Increase stake in existing investments
Grow user base, deepen market penetration, expand into complementary products and new markets
Focus on large total addressable market, strong local moat, clear use cases for growth capital

41
Unique combination of high growth annuity and great value creation
Gamified Early Learning: Continually develop new content for children aged 2-6 years to further tap into the large US marketeSports: Exclusive rights and ownership of live stream and on-demand premium eSports content for streaming on YouTube, Facebook, Hotstar etc.Freemium: Monetization via in-app purchases of virtual goods
Gamified Early Learning: Robust retention rates withstrong unit economicseSports: Increasing contribution of media rights toeSports revenues, amplified by growing number ofglobal and local OTT platformsFreemium: Increasing revenues from sale of virtualitems within the game
✓ Build on Nazara’s leading market position and growthopportunity in India
✓ Enhance existing offerings and increase monetizationopportunities
✓ Pursue strategic investment and acquisition opportunities✓ Further build the existing technology stack to enhance
existing platform
Diversified portfolio in high growth segments and at different stage of evolution offers optionality value for the Investors over the next decade
Key Growth Drivers
Operating Leverage Drivers
Way Forward…

PIONEERS OF INDIAN ONLINE GAMING INDUSTRY

43
Management Team
Nitish MittersainJoint MD, Nazara◼ Founded Nazara in 1999
◼ Other Experience: Trustee of Dr. B. K. Goyal Heart Foundation
Manish AgarwalGroup CEO, Nazara◼ Joined Nazara in 2015
◼ Other Experience: Reliance Games, Zapak, UTV, Rediff.com, HUL
Akshat RatheeCo-founder & ED, Nodwin Gaming◼ Co-founded Nodwin Gaming
in 2014
◼ Other Experience: PGM Entertainment, Ernst & Young
Porush JainFounder and CEO, Absolute Sports◼ Founded Absolute Sports in 2010
◼ Has experience in various fields including content strategy, coding, marketing and sales
Anshu DhanukaCo-founder & CPO, Paper Boat◼ Co-founded Paper Boat in 2013
◼ Other Experience: Walnut Labs
Anupam DhanukaCo-founder and CEO, Paper Boat◼ Co-founded Paper Boat in 2013
◼ Other Experience: Walnut Labs
Rajendran Poochi RamasamyCo-founder & CEO, Next Wave◼ Co-founded Next Wave in 1995
◼ Created c.200 games for brands, OEM app stores
Savio SaldanhaCEO, Nazara Digital (Telco Subscription)◼ Joined Nazara 10 years ago
◼ Other Experience: Arvato Mobile Middle, Channel V, City 7 TV
Jayashree Poochi RamaswamyCo-founder and COO, Next Wave◼ 25+ years of experience in
various fields including digital media and gaming
Rakesh ShahGroup CFO◼ Joined Nazara in 2010
◼ 24+ years of work experience
◼ Other Experiences: Yahoo India, ANZ Int., Electronic Systems, Vinmar Int., Mazda Colors

44
Board of Directors
Vikash MittersainChairman & MD◼ Founded Nazara in 1999
◼ Other Experience: Founder and President of India Business Group (Chamber of Commerce)
Nitish MittersainJoint MD◼ Founded Nazara in 1999
◼ Other Experience: Trustee of Dr. B. K. Goyal Heart Foundation
Sasha MirchandaniNon-Executive, Independent Director◼ Managing Director and Founder of Kae
Capital and Co-founder Mumbai Angels
◼ Was Managing Director, Blue Run Ventures (India operations)
Shobha JagtianiNon-Executive, Independent Director◼ Partner at D.M. Harish Co Advocates
◼ Among the first women advocates to specialize in Income Tax litigation
Probir RoyNon-Executive, Independent Director◼ Promoter and Co-founder of Paymate India
◼ Held senior positions at Star TV, Euro RSCG Advertising Pvt. Ltd. and the Nuclear Power Corp.
Kuldeep JainNon-Executive, Independent Director◼ Founder of Clean Max Enviro Energy
Solutions
◼ Was consulting partner at McKinsey and an IIM-A aluminous
Rajeev AgarwalNominee Director of Rare Enterprises◼ Board member at Hungama Digital,
Rare Enterprises, Concord Biotech, Aptech & Care Hospital
◼ Rich experience with Accenture and engineering graduate from IIT BHU

FINANCIALS

46
Consolidated P&L
(All figures in INRm) FY21 FY20
Revenue from operations 4,542.1 2,475.1
Other income 143.3 154.6
Total income 4,685.3 2,629.7
Content, event and web server 524.4 506.9
Advertising and promotion 2,264.6 1,329.3
Commission 501.1 71.3
Employee benefits 486.9 318.8
Others 312.6 305.4
Total expenses 4,089.7 2,531.7
EBITDA 595.7 97.9
EBITDA% 12.7% 3.7%
Impairment Loss 41.0 0.0
Finance costs 9.0 12.4
Depreciation and amortization 354.8 263.2
PBT before share of profit / (loss) from associate 190.9 (177.7)
Tax expenses 30.7 72.0
PAT before share of profit / (loss) from associate 160.2 (249.6)
Share of profit / (loss) from associates (23.8) (18.1)
Final PAT 136.4 (267.8)
PAT% 2.9% -

47
Key Metrics - Revenue
(All figures in INRm) FY21 FY20
Revenue by business segments
i. eSports 1,700.6 841.6
ii. Gamified early learning 1,758.4 191.3
iii. Freemium 195.2 197.8
iv. Real money gaming 138.5 426.4
v. Telco subscription 749.4 818.0
Total revenue from operations 4,542.1 2,475.1
Other income 143.3 154.6
Total income 4,685.3 2,629.7
Geography Mix
41%
6%8%
42%
3%
59%
7%
8%
13%
12%
FY21 FY20
Revenue Mix
37%
39%
16%
4% 3%34%
8%8%
17%
33%
FY21 FY20
eSports Gamified early Learning
Freemium Real Money Gaming
Telco Subscription
India Middle East1 Africa
APAC / ROW North America

48
Key Metrics - EBITDA
(All figures in INRm) FY21 FY20
EBITDA by business segments
i. eSports 304.8 74.8
ii. Gamified early learning 125.7 (34.6)
iii. Freemium 41.3 66.1
iv. Real money gaming (57.5) (347.2)
v. Telco subscription 137.3 205.8
vi. Unallocated 44.0 133.1
EBITDA 595.7 97.9
EBITDA margin (%) 12.7% 3.7%
305
126
41
-57
137
75
-35
66
-347
206
Segmental EBITDA (in INR million)
FY 21 FY 20
(All figures in INRm) FY21 FY20
EBITDA % by business segments
i. eSports 17.9% 8.9%
ii. Gamified early learning 7.1% -18.1%
iii. Freemium 21.2% 33.4%
iv. Real money gaming -41.5% -81.4%
v. Telco subscription 18.3% 25.2%
Gamified Early Learning
eSports Freemium Real Money Gaming
Telco Subscription

49
Consolidated Balance Sheet
(All figures in INRm)As at
March 31, 2021
As at March 31, 2020
(Restated)
Assets
Non-current assets
Property and equipment 17.2 22.7
Right-of-use assets 21.4 86.1
Goodwill 1,684.5 1,687.7
Other intangible assets 1,239.4 1,471.2
Intangible assets under development 23.5 63.2
Investment accounted using the equity method 41.5 80.5
Financial assets
Investments 80.3 136.0
Loans 0.0 14.0
Other financial assets 45.6 68.4
Income tax asset 211.6 86.6
Deferred tax assets (net) 46.4 27.6
Other non-current assets 3.2 3.1
Total non-current assets 3,414.6 3,747.0
Current assets
Financial assets
Investments 1,060.4 366.5
Trade receivables 685.6 681.1
Cash and cash equivalents 1,399.7 720.9
Other bank balances 2,323.9 1,146.2
Loans 29.0 21.6
Other financial assets 1,006.7 635.8
Other current assets 307.3 224.8
Total current assets 6,812.4 3,796.9
Total Assets 10,227.0 7,543.9
(All figures in INRm)As at
March 31, 2021
As at March 31, 2020
(Restated)
Equity and liabilities
Equity
Share capital 121.8 112.0
Other equity 6,460.0 4,898.7
Equity attributable to equity holder of the company 6,581.8 5,010.7
Non-controlling interest 1,208.0 689.6
Total equity 7,789.8 5,700.2
Liabilities
Non-current liabilities
Financial liabilities
Lease liabilities 2.5 20.1
Other financial liabilities 4.2 0.0
Deferred tax liabilities (net) 259.9 311.7
Provisions 35.1 27.3
Total non-current liabilities 301.6 359.1
Current liabilities
Financial liabilities
Trade payables due to
(a) Micro enterprises and small enterprises 2.3 1.0
(b) Other than micro enterprises and small enterprises 637.9 691.7
Lease liabilities 10.6 60.3
Other financial liabilities 1,086.6 393.9
Other current liabilities 297.2 306.9
Provisions 13.5 10.5
Income taxes liabilities (net) 87.8 20.2
Total current liabilities 2,135.7 1,484.5
Total equity and liabilities 10,227.0 7,543.9
50
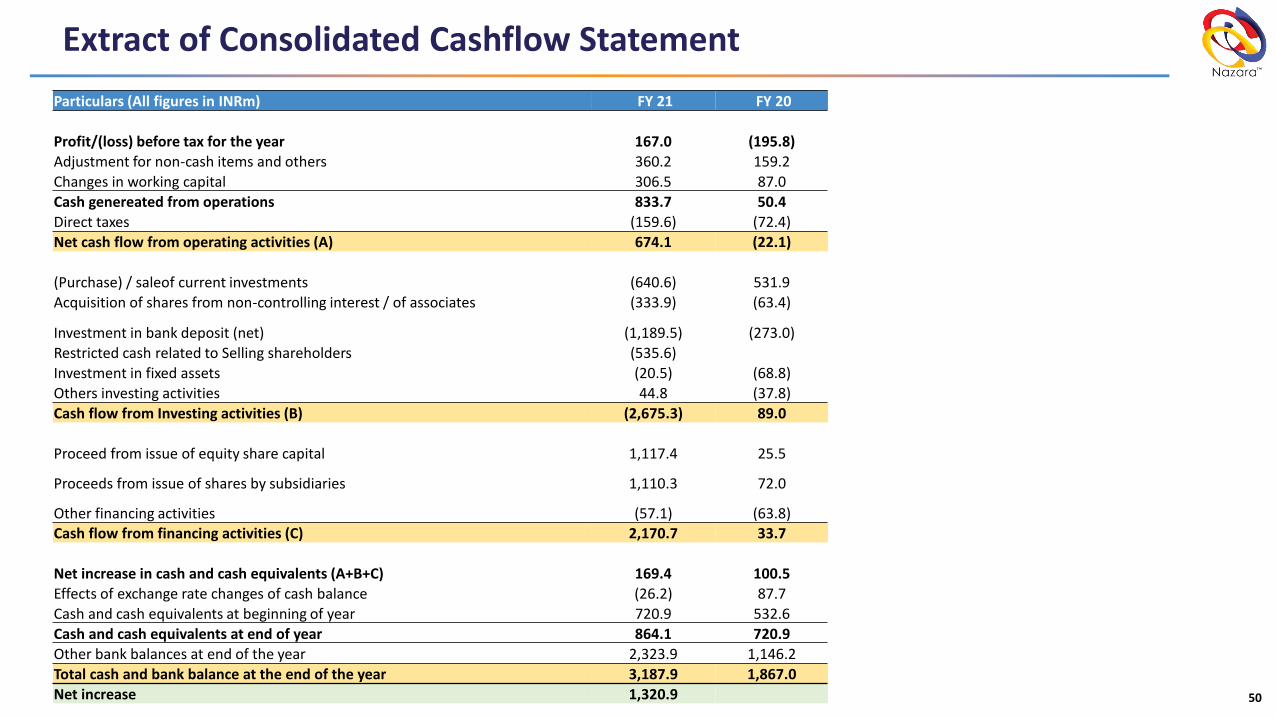
Extract of Consolidated Cashflow Statement
Particulars (All figures in INRm) FY 21 FY 20
Profit/(loss) before tax for the year 167.0 (195.8)
Adjustment for non-cash items and others 360.2 159.2
Changes in working capital 306.5 87.0
Cash genereated from operations 833.7 50.4
Direct taxes (159.6) (72.4)
Net cash flow from operating activities (A) 674.1 (22.1)
(Purchase) / saleof current investments (640.6) 531.9
Acquisition of shares from non-controlling interest / of associates (333.9) (63.4)
Investment in bank deposit (net) (1,189.5) (273.0)
Restricted cash related to Selling shareholders (535.6)
Investment in fixed assets (20.5) (68.8)
Others investing activities 44.8 (37.8)
Cash flow from Investing activities (B) (2,675.3) 89.0
Proceed from issue of equity share capital 1,117.4 25.5
Proceeds from issue of shares by subsidiaries 1,110.3 72.0
Other financing activities (57.1) (63.8)Cash flow from financing activities (C) 2,170.7 33.7
Net increase in cash and cash equivalents (A+B+C) 169.4 100.5
Effects of exchange rate changes of cash balance (26.2) 87.7
Cash and cash equivalents at beginning of year 720.9 532.6
Cash and cash equivalents at end of year 864.1 720.9
Other bank balances at end of the year 2,323.9 1,146.2
Total cash and bank balance at the end of the year 3,187.9 1,867.0
Net increase 1,320.9

51
Glossary
Term Description
APAC Asia Pacific
CAC Consumer Acquisition Cost
CAGRCompounded Annual Growth Rate = (End Value/StartValue)^(1/Periods) -1
COPPA Children’s Online Privacy Protection Rule
CPT Cost Per Trial
e-Learning Early Learning
ESL Electronic Sports League
ESWC Electronic Sports World Cup
HR Human Resources
IAP In-App Purchases
IP Intellectual Property
ISP Internet Service Provider
KPI Key Performance Indicator
LTV Life-Time Value
Term Description
M&A Mergers and Acquisitions
MAU Monthly Active Users
M&E Media and Entertainment
MS Market Share
ROW Rest of the World
TAM Total Addressable Market
WCC World Cricket Championship
WCC2 World Cricket Championship 2
WCC3 World Cricket Championship 3
WWE Word Wrestling Entertainment
YoY Year on Year

52
Contact Us
Company : Investor Relations Advisors :
Nazara Technologies Ltd.
CIN: U72900MH1999PLC122970Ms. Pratibha [email protected]
www.nazara.com
Strategic Growth Advisors Private Limited
CIN: U74140MH2010PTC204285
Rahul Agarwal / Ami [email protected] / [email protected]+91 982143 8864 / +91 80824 66052
www.sgapl.net