N952-00-007 13 July 1998 Copyright © 1998 Oliver, Wyman & Company London New York Paris Frankfurt...
31
N952-00-007 13 July 1998 Copyright © 1998 Oliver, Wyman & Company London New York Paris Frankfurt Madrid Toronto Singapore Confidential & Proprietary DYNAMIC FINANCIAL ANALYSIS SEMINAR
-
Upload
cornelius-carson -
Category
Documents
-
view
214 -
download
0
Transcript of N952-00-007 13 July 1998 Copyright © 1998 Oliver, Wyman & Company London New York Paris Frankfurt...
N952-00-007
13 July 1998
Copyright © 1998 Oliver, Wyman & CompanyLondon New York Paris Frankfurt Madrid Toronto Singapore
Confidential & Proprietary
DYNAMIC FINANCIAL ANALYSIS SEMINAR
N952-00-007
CONFIDENTIALITY
The financial services industry is extremely competitive. The confidentiality of companies’ plans and data is obviously critical. Oliver, Wyman & Company will protect the confidentiality of all such client information.
Similarly, management consulting is a competitive business. We view our approaches and insights as proprietary and therefore look to our clients to protect Oliver, Wyman & Company’s interests in our presentations, methodologies and analytical techniques. Under no circumstances should this material be shared with any third party without the written consent of Oliver, Wyman & Company.
Copyright © 1998 Oliver, Wyman & Company
N952-00-007
I.DFA DRIVES CAPITAL MANAGEMENT
II.DFA UNCOVERS SKEWS IN RISK-ADJUSTED PROFITABILITY
III. DFA SUPPORTS BUSINESS MODEL EVOLUTION
IV. DFA CAN INTEGRATE MODELS DEVELOPED FOR BANKING
INTRODUCTION

Oliver, Wyman & CompanyN952-00-007
– 4 –
INTRODUCTION
Oliver, Wyman & CompanyN952-00-007
– 5 –
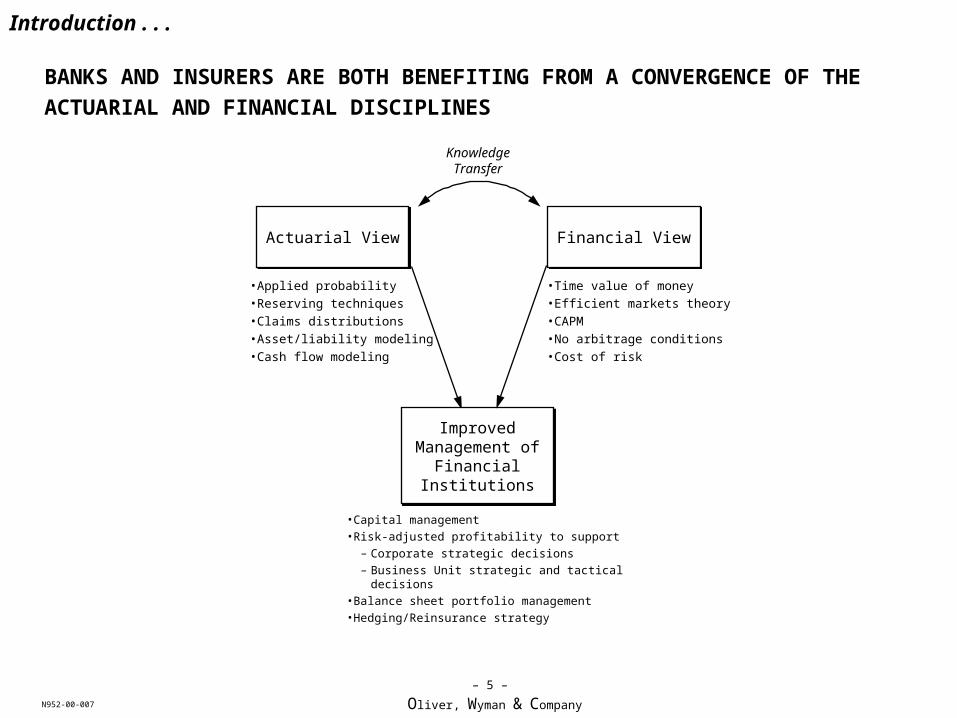
BANKS AND INSURERS ARE BOTH BENEFITING FROM A CONVERGENCE OF THE
ACTUARIAL AND FINANCIAL DISCIPLINES
KnowledgeTransfer
Introduction . . .
Actuarial ViewActuarial View Financial ViewFinancial View
Improved Management of
Financial Institutions
Improved Management of
Financial Institutions
• Applied probability• Reserving techniques• Claims distributions• Asset/liability modeling• Cash flow modeling
• Time value of money• Efficient markets theory• CAPM• No arbitrage conditions• Cost of risk
• Capital management• Risk-adjusted profitability to support
– Corporate strategic decisions– Business Unit strategic and tactical decisions
• Balance sheet portfolio management• Hedging/Reinsurance strategy

Oliver, Wyman & CompanyN952-00-007
– 6 –
TODAY WE DISCUSS HOW DFA HAS SUPPORTED DECISIONS IN BOTH BANKING
AND LIFE INSURANCE, AND DISCUSS ITS APPLICABILITY TO P&C INSURANCE
Introduction . . .
Applications (Decisions)
Applications (Decisions)
ReportsReports
MethodologiesMethodologies SystemsSystemsDataData
Oliver, Wyman & CompanyN952-00-007
– 7 –
I. DFA DRIVES CAPITAL MANAGEMENT
Oliver, Wyman & CompanyN952-00-007
– 8 –
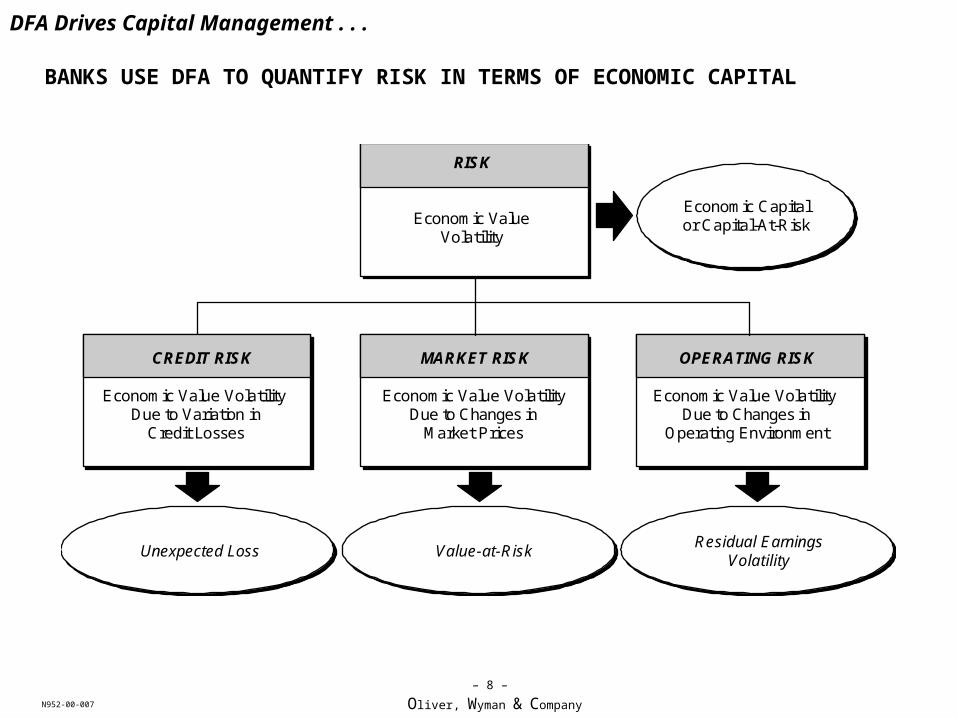
BANKS USE DFA TO QUANTIFY RISK IN TERMS OF ECONOMIC CAPITAL
DFA Drives Capital Management . . .
Economic Capitalor Capital-At-Risk
RISK
Economic ValueVolatility
CREDIT RISK
Unexpected Loss
MARKET RISK
Value-at-Risk
OPERATING RISK
Residual EarningsVolatility
Economic Value Volatility Due to Variation in
Credit Losses
Economic Value VolatilityDue to Changes in
Market Prices
Economic Value Volatility Due to Changes in
Operating Environment
Oliver, Wyman & CompanyN952-00-007
– 9 –
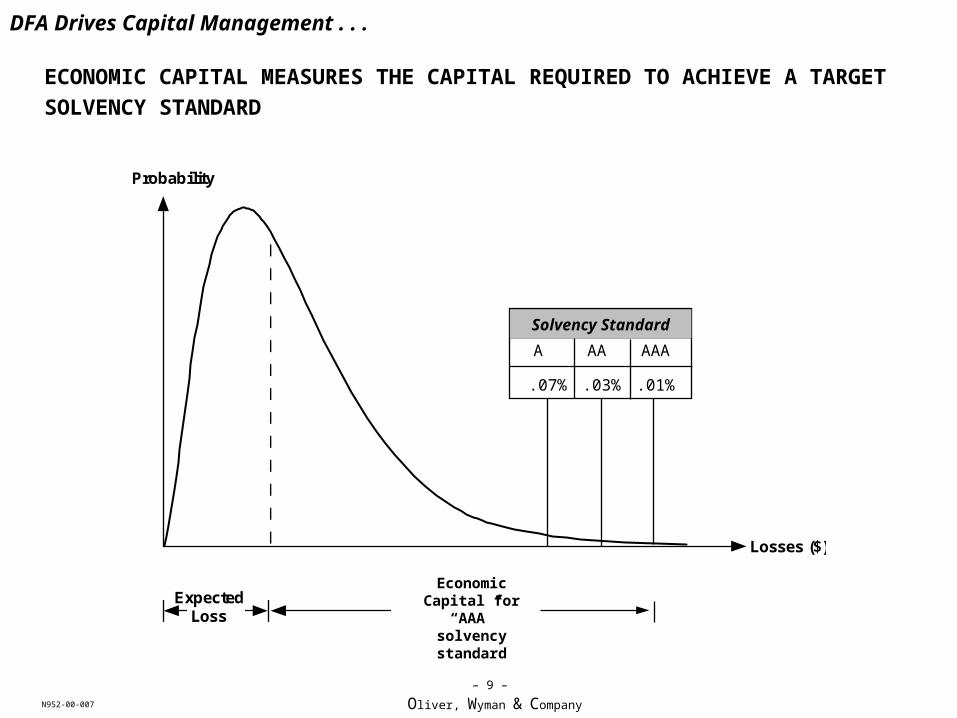
ECONOMIC CAPITAL MEASURES THE CAPITAL REQUIRED TO ACHIEVE A TARGET
SOLVENCY STANDARD
DFA Drives Capital Management . . .
ExpectedLoss
Probability
Losses ($)
Economic Capital for
“AAA” solvency standard
Solvency Standard
A AA AAA
.07% .03% .01%

Oliver, Wyman & CompanyN952-00-007
– 10 –
Capital You Have
COMPARING ECONOMIC CAPITAL TO AVAILABLE CAPITAL PROVIDES A VIEW OF
CAPITAL ADEQUACY
A AA AAA Available Capital
$ BN
Solvency Standard 7 bp 3 bp 1 bp
Corresponding S&P Rating A AA AAA
Capital You Need
DFA Drives Capital Management . . .
ExcessCapital
Oliver, Wyman & CompanyN952-00-007
– 11 –
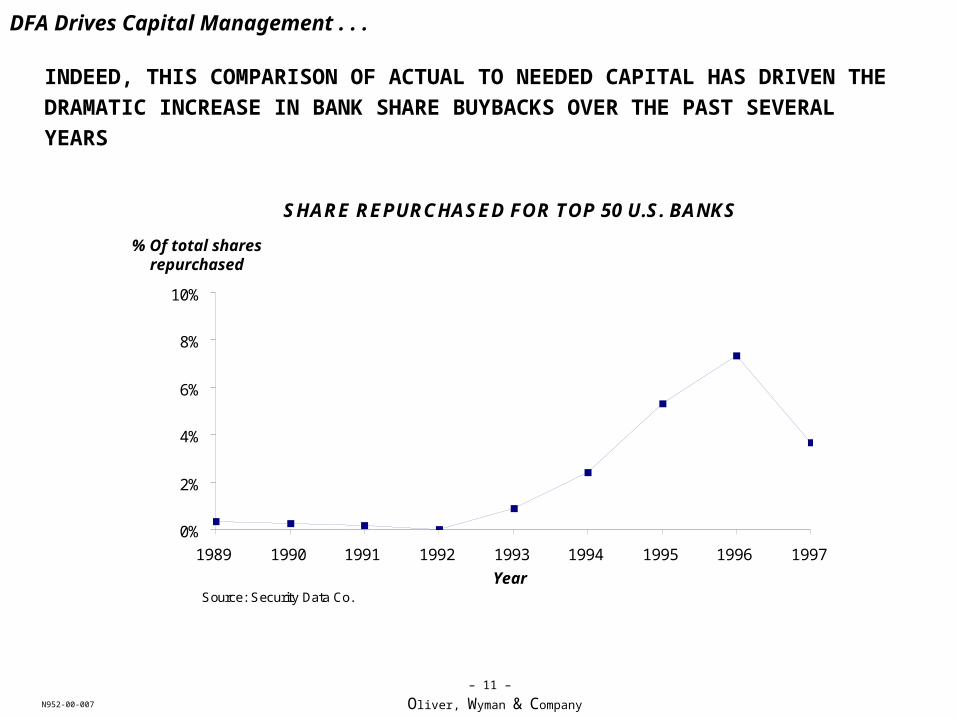
INDEED, THIS COMPARISON OF ACTUAL TO NEEDED CAPITAL HAS DRIVEN THE
DRAMATIC INCREASE IN BANK SHARE BUYBACKS OVER THE PAST SEVERAL
YEARS
DFA Drives Capital Management . . .
SHARE REPURCHASED FOR TOP 50 U.S. BANKS
0%
2%
4%
6%
8%
10%
1989 1990 1991 1992 1993 1994 1995 1996 1997
YearSource: Security Data Co.
% Of total shares repurchased
Year

Oliver, Wyman & CompanyN952-00-007
– 12 –
THIS SERVES AS AN INPUT TO A DISCIPLINED CAPITAL MANAGEMENT PROCESS
DFA Drives Capital Management . . .
1. Formulate capital investment plan to determine a business mix that maximizes the Bank’s long-term value to its shareholders based upon evaluation of the risk, return and growth characteristics of available opportunities
2. Determine target solvency standard given the mix of business activities implicit in the investment plan
3. Align capital structure to be consistent with #1 and #2 by taking appropriate actions (capital issuance, buyback, etc.)
4. Set risk limits and targets that reflect the investment plan and ensure compliance with the target rating
5. Set business unit RAROC and growth targets and the investment consequences of achieving (or not achieving) them
6. Measure performance by monitoring actual RAROC, capital usage, and growth against targets and limits
Oliver, Wyman & CompanyN952-00-007
– 13 –
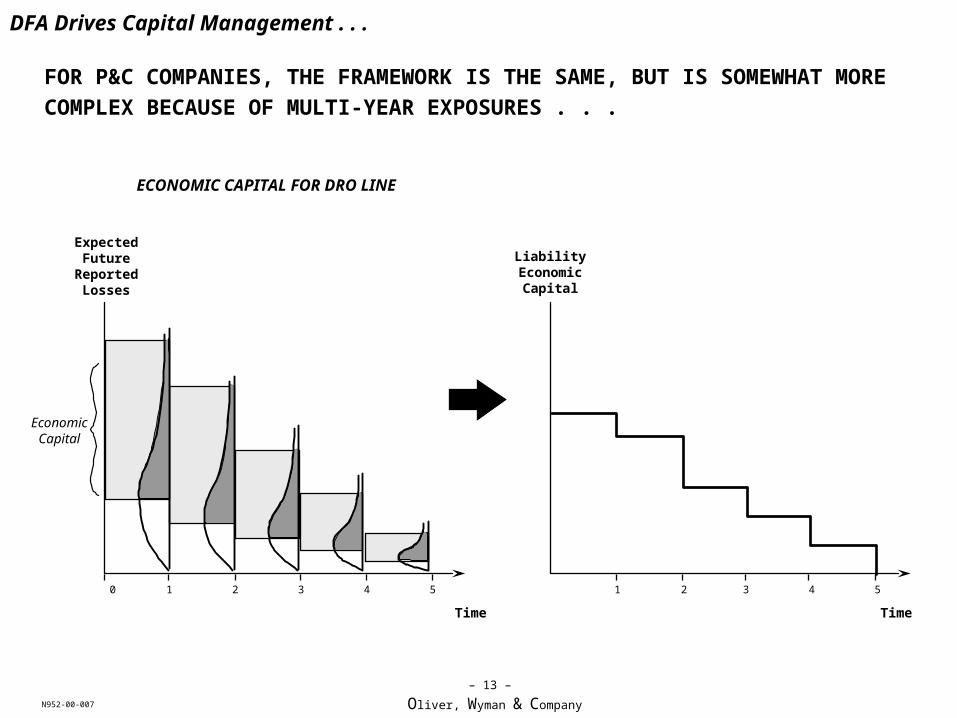
FOR P&C COMPANIES, THE FRAMEWORK IS THE SAME, BUT IS SOMEWHAT MORE
COMPLEX BECAUSE OF MULTI-YEAR EXPOSURES . . .
Economic Capital
Time
0 1 2 3 4 5
Expected Future
ReportedLosses
Liability Economic
Capital
Time
1 2 3 4 5
ECONOMIC CAPITAL FOR DRO LINE
DFA Drives Capital Management . . .
Oliver, Wyman & CompanyN952-00-007
– 14 –
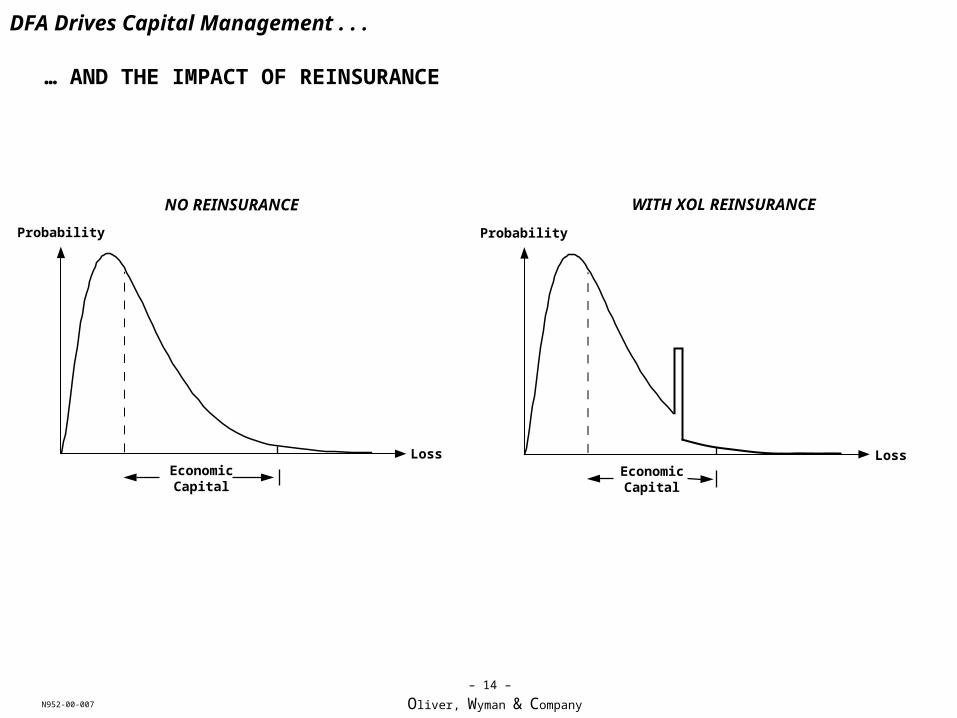
… AND THE IMPACT OF REINSURANCE
WITH XOL REINSURANCE
DFA Drives Capital Management . . .
Economic Capital
NO REINSURANCE
Probability
Loss
Probability
Economic Capital
Loss

Oliver, Wyman & CompanyN952-00-007
– 15 –
II. DFA UNCOVERS SKEWS IN RISK-ADJUSTED PROFITABILITY
Oliver, Wyman & CompanyN952-00-007
– 16 –
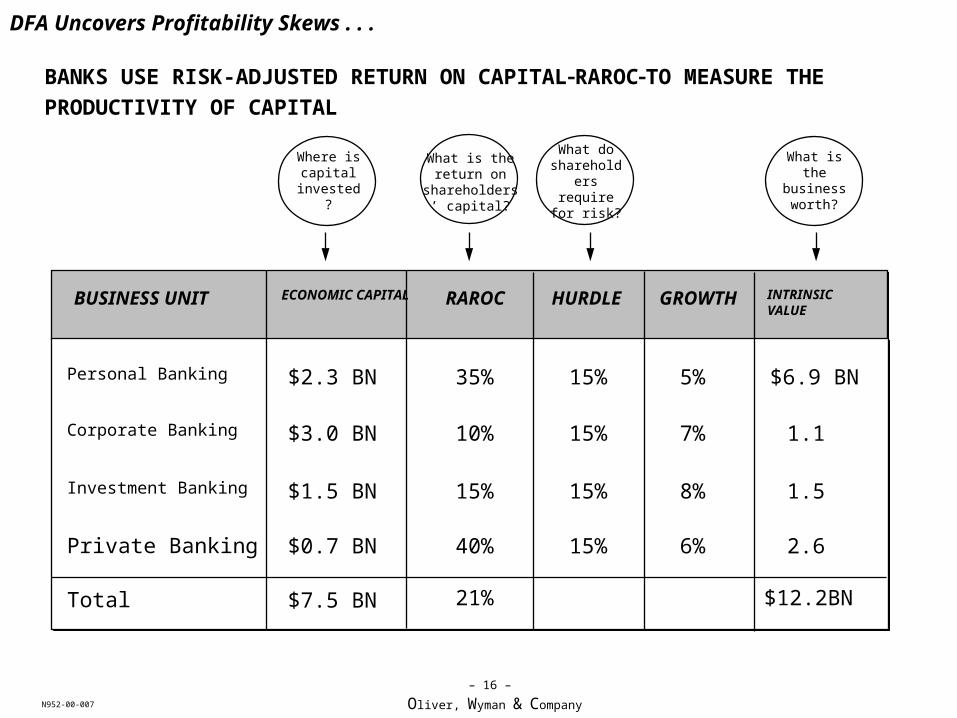
BUSINESS UNIT ECONOMIC CAPITAL
RAROC HURDLE GROWTH INTRINSIC VALUE
DFA Uncovers Profitability Skews . . .
BANKS USE RISK-ADJUSTED RETURN ON CAPITALRAROCTO MEASURE THE
PRODUCTIVITY OF CAPITAL
Personal Banking
Corporate Banking
What is the return on
shareholders’ capital?
What do shareholders
require for risk?
What is the business worth?
Where is capital
invested?
Investment Banking
Private Banking
Total
$2.3 BN
$3.0 BN
$1.5 BN
$0.7 BN
$7.5 BN
15%
15%
15%
15%
35%
10%
15%
40%
21%
5%
7%
8%
6%
$6.9 BN
1.1
1.5
2.6
$12.2BN
Oliver, Wyman & CompanyN952-00-007
– 17 –
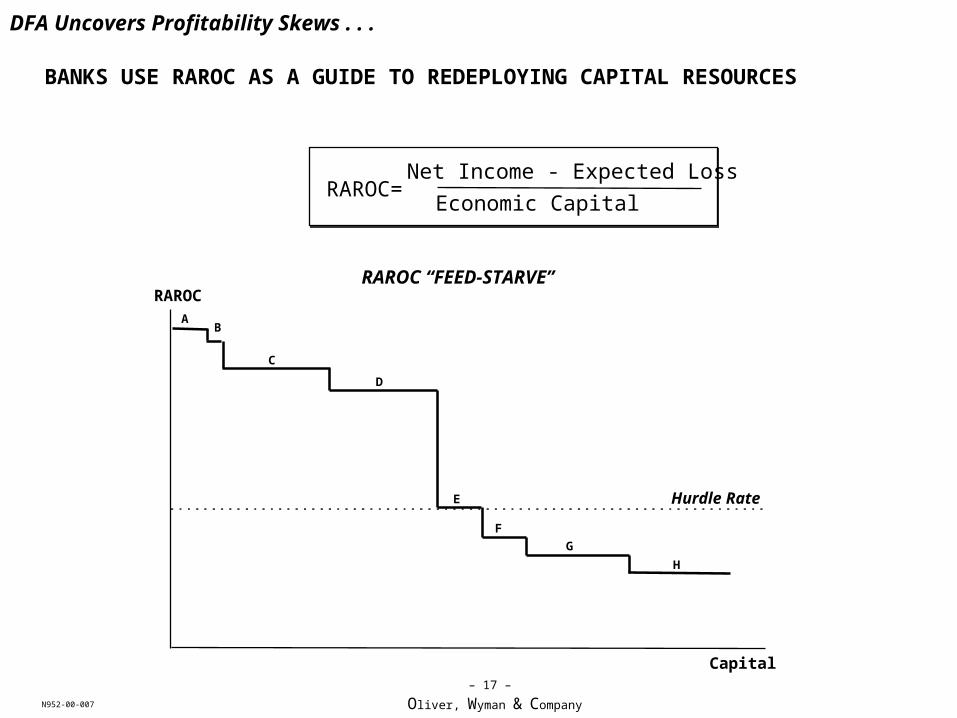
RAROC= Net Income - Expected Loss
Economic Capital
RAROC “FEED-STARVE”RAROC
Capital
AB
C
D
E
F
G
H
Hurdle Rate
DFA Uncovers Profitability Skews . . .
BANKS USE RAROC AS A GUIDE TO REDEPLOYING CAPITAL RESOURCES

Oliver, Wyman & CompanyN952-00-007
– 18 –
DFA Uncovers Profitability Skews . . .
LEADING FINANCIAL INSTITUTIONS ARE USING RAROC TO DRIVE KEY DECISIONS
• CEO Martin Taylor stated in Barclays’ annual report: “. . . we continue to refine our risk management techniques and focus on the return on economic capital, shifting capital away from areas of low or particularly unpredictable return and taking into account the contribution of each business to the Group’s overall volatility of earnings”
• Most commentators have stated that relatively poor risk-adjusted returns is the main rationale for Barclays selling BZW’s investment banking business
• Still more banks could learn from Barclays’ example– “The sorry fact is that those European banks that have chosen to stay in the game (of
investment banking) are, almost without exception, either more tolerant of low returns than Barclays, or less sophisticated at measuring how low those returns are” (Financial Times, October 6, 1997)
Oliver, Wyman & CompanyN952-00-007
– 19 –
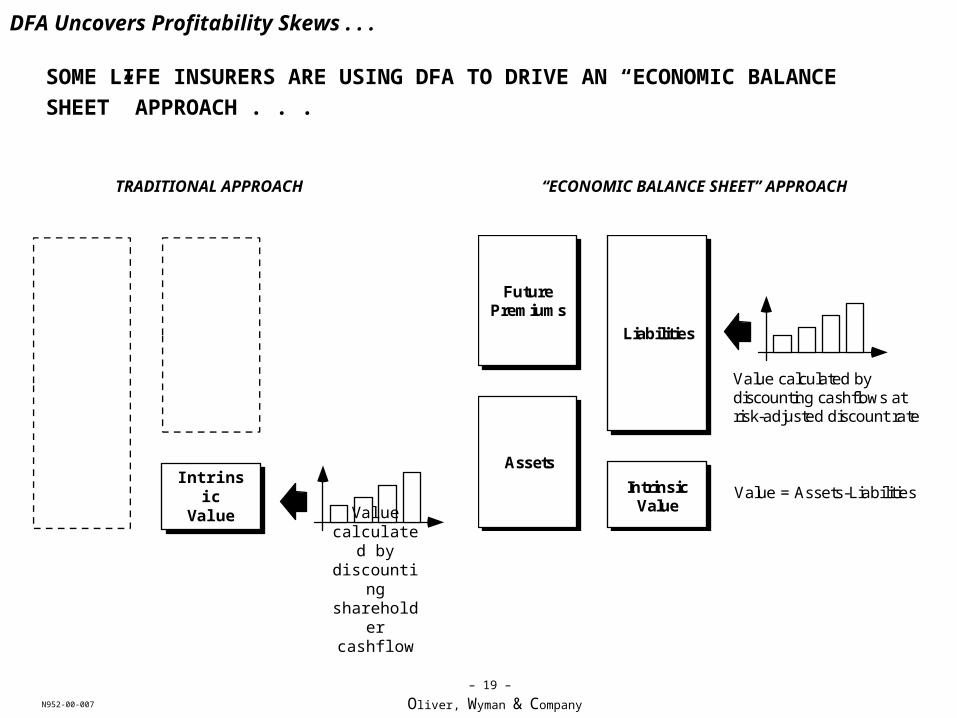
SOME LIFE INSURERS ARE USING DFA TO DRIVE AN “ECONOMIC BALANCE
SHEET” APPROACH . . .
TRADITIONAL APPROACH “ECONOMIC BALANCE SHEET” APPROACH
DFA Uncovers Profitability Skews . . .
Value = Assets-LiabilitiesIntrinsicValue
FuturePremiums
Assets
Liabilities
Value calculated bydiscounting cashflows atrisk-adjusted discount rate
Intrinsic Value
Value calculated by discounting shareholder
cashflow
Oliver, Wyman & CompanyN952-00-007
– 20 –
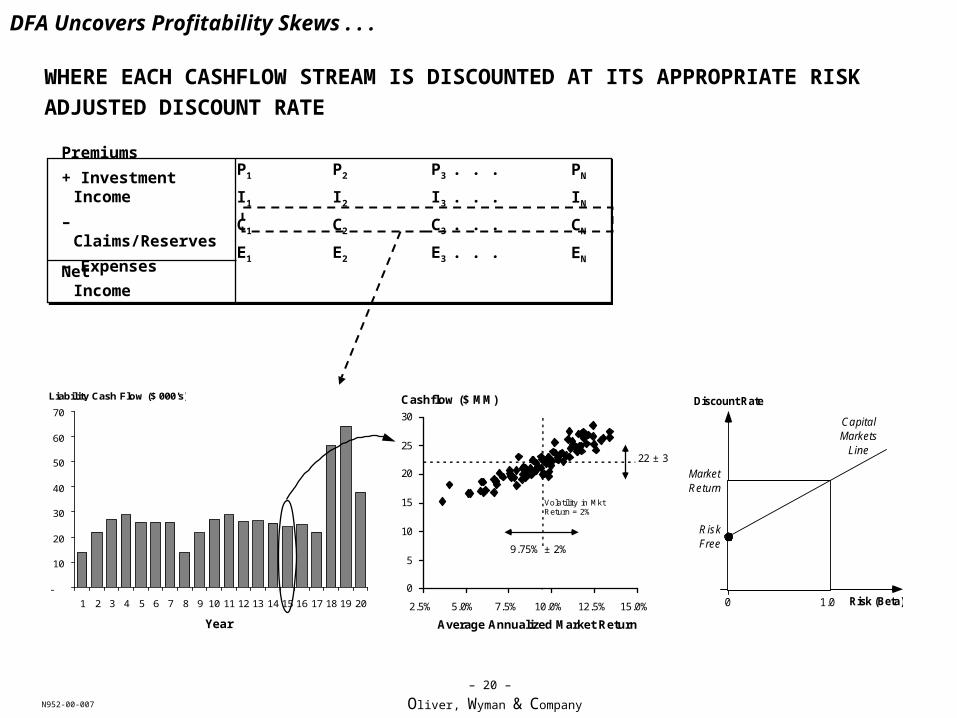
WHERE EACH CASHFLOW STREAM IS DISCOUNTED AT ITS APPROPRIATE RISK
ADJUSTED DISCOUNT RATE
Discount Rate
Risk (Beta)0 1.0
RiskFree
MarketReturn
CapitalMarkets
Line
-
10
20
30
40
50
60
70
1 2 3 4 5 6 7 8 9 10 11 12 13 14 15 16 17 18 19 20
Liability Cash Flow ($ 000's)
0
5
10
15
20
25
30
2.5% 5.0% 7.5% 10.0% 12.5% 15.0%
Average Annualized Market Return
Cashflow ($ MM)
Volatility in MktReturn = 2%
22 ± 3
9.75% ± 2%
Premiums
+ Investment Income
– Claims/Reserves
– Expenses
Net Income
P1 P2 P3 . . .
I1 I2 I3 . . .
C1 C2 C3 . . .
E1 E2 E3 . . .
DFA Uncovers Profitability Skews . . .
Year
PN
IN
CN
EN

Oliver, Wyman & CompanyN952-00-007
– 21 –
THIS RISK-ADJUSTED VIEW REVEALED DRAMATIC VALUE CREATIONS SKEWS
ACROSS PRODUCTS
BEFORE RISK-ADJUSTMENT AFTER RISK-ADJUSTMENT
50
0
-50
-100
-150
-200
-250
100
A B C D E F TOTAL
Value of New Business
B D E C A F TOTAL
Value of New Business
Long-termSavings Products
50
0
-50
-100
-150
-200
-250
100
PRODUCT VALUE MEASUREMENT
DFA Uncovers Profitability Skews . . .

Oliver, Wyman & CompanyN952-00-007
– 22 –
A TOP-DOWN ANALYSIS OF FOURTEEN TOP PROPERTY AND CASUALTY
INSURERS REVEALS THAT ECONOMIC CAPITAL CAN DIFFER SUBSTANTIALLY
FROM TRADITIONAL MEASURES OF CAPITAL ADEQUACY
DFA Uncovers Profitability Skews . . .
ECONOMIC VS. STATUTORY VIEWS OF CAPITAL ADEQUACY
0.00
0.50
1.00
1.50
2.00
2.50
3.00
0.00 0.50 1.00 1.50 2.00 2.50
Premium-to-Economic Capital
Premium-to-Surplus
Economic Capital= Surplus
Oliver, Wyman & CompanyN952-00-007
– 23 –
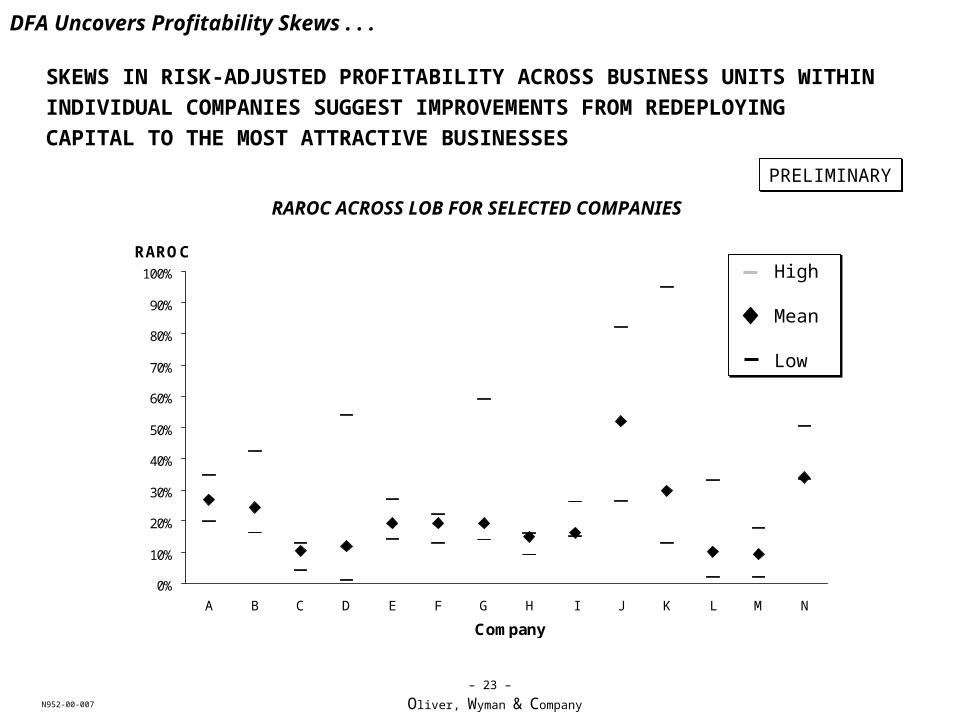
SKEWS IN RISK-ADJUSTED PROFITABILITY ACROSS BUSINESS UNITS WITHIN
INDIVIDUAL COMPANIES SUGGEST IMPROVEMENTS FROM REDEPLOYING
CAPITAL TO THE MOST ATTRACTIVE BUSINESSES
DFA Uncovers Profitability Skews . . .
RAROC ACROSS LOB FOR SELECTED COMPANIES
0%
10%
20%
30%
40%
50%
60%
70%
80%
90%
100%
A B C D E F G H I J K L M N
RAROC
Company
PRELIMINARYPRELIMINARY
High
Mean
Low
High
Mean
Low
Oliver, Wyman & CompanyN952-00-007
– 24 –
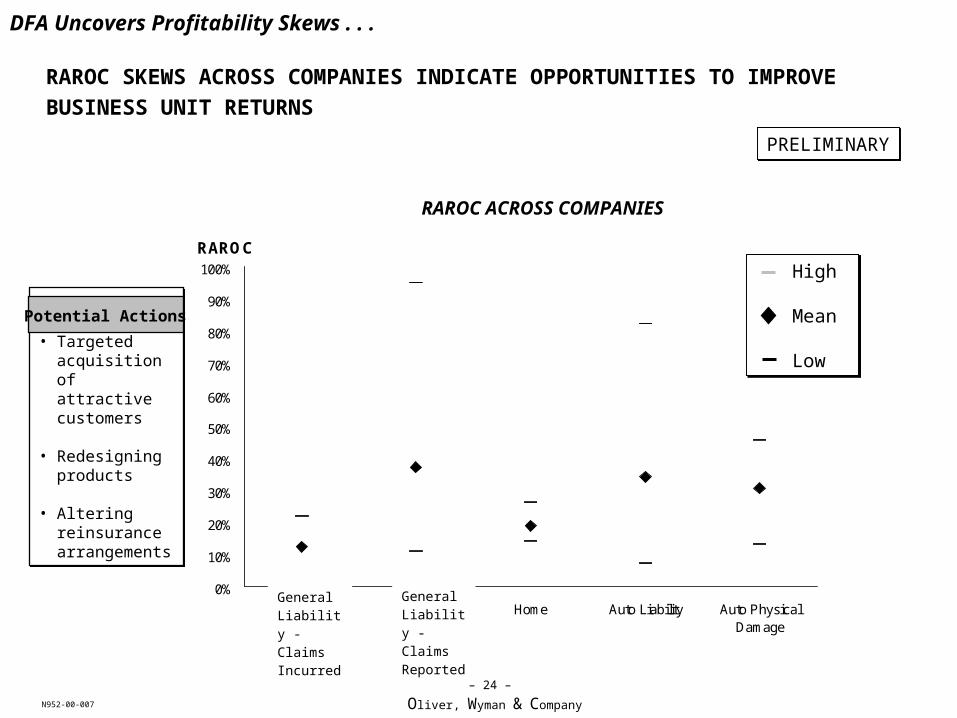
RAROC SKEWS ACROSS COMPANIES INDICATE OPPORTUNITIES TO IMPROVE
BUSINESS UNIT RETURNS
DFA Uncovers Profitability Skews . . .
PRELIMINARYPRELIMINARY
• Targeted acquisition of attractive customers
• Redesigning products
• Altering reinsurance arrangements
• Targeted acquisition of attractive customers
• Redesigning products
• Altering reinsurance arrangements
Potential Actions
RAROC ACROSS COMPANIES
0%
10%
20%
30%
40%
50%
60%
70%
80%
90%
100%
XSU D&O Home Auto Liability Auto PhysicalDamage
RAROC
High
Mean
Low
High
Mean
Low
General Liability - Claims Incurred
General Liability - Claims Reported

Oliver, Wyman & CompanyN952-00-007
– 25 –
III. DFA SUPPORTS BUSINESS MODEL EVOLUTION
Oliver, Wyman & CompanyN952-00-007
– 26 –
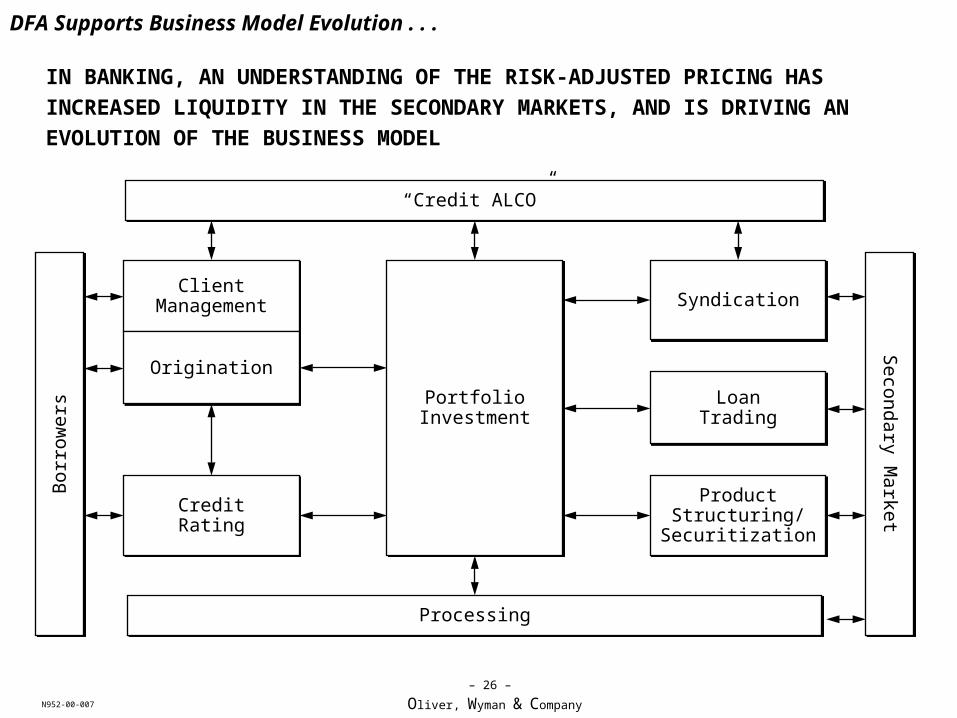
IN BANKING, AN UNDERSTANDING OF THE RISK-ADJUSTED PRICING HAS
INCREASED LIQUIDITY IN THE SECONDARY MARKETS, AND IS DRIVING AN
EVOLUTION OF THE BUSINESS MODEL
DFA Supports Business Model Evolution . . .
ProcessingProcessing
“Credit ALCO”“Credit ALCO”
PortfolioInvestmentPortfolio
Investment
ClientManagement
ClientManagement SyndicationSyndication
OriginationOrigination
CreditRatingCreditRating
LoanTradingLoan
Trading
ProductStructuring/
Securitization
ProductStructuring/
Securitization
Bor
row
ers
Bor
row
ers
Second
ary Market
Second
ary Market

Oliver, Wyman & CompanyN952-00-007
– 27 –
THIS MODEL IS LIKELY TO EVOLVE IN THE INSURANCE MARKET AS WELL, AS
PRICING STANDARDS DEVELOP AND CAPITAL MARKETS BECOME MORE LIQUID
Servicing & ProcessingServicing & Processing
ClientManagement
ClientManagement
OriginationOrigination
UnderwritingUnderwriting
Ins
ure
ds
Ins
ure
ds
Ca
pita
l Ma
rke
tsC
ap
ital M
ark
ets
Packaging &Distribution
Reinsurance
RetainedPortfolio
WarehousePortfolio
Sales &Trading
DFA Supports Business Model Evolution . . .

Oliver, Wyman & CompanyN952-00-007
– 28 –
IV. DFA CAN INTEGRATE MODELS DEVELOPED FOR BANKING

Oliver, Wyman & CompanyN952-00-007
– 29 –
IN BANKING, CREDIT RISK IS MOST OFTEN CALCULATED ANALYTICALLY . . .
DFA Can Integrate Banking Models . . .
Solvency Standard
ExpectedLoss
EconomicCapital
Probability
CreditLoss ($)Unexpected
Loss
• Default Probability• Loan Characteristics
DefaultCorrelations
Calculate ExpectedLoss (µ) by Loan
Calculate UnexpectedLoss () assumingcorrelated Bernoulli
variables
Fit (µ) and ( ) toemprically determined
distribution
Calculate tailpercentile asmultiple of

Oliver, Wyman & CompanyN952-00-007
– 30 –
… AND MARKET RISK IS MOST OFTEN MEASURED USING PARAMETRIC
VALUE-AT-RISK (VaR)
DFA Can Integrate Banking Models . . .
CorrelationsBetween
Market Risks
$/Peso
Exposure
3 MoLIBOR
Exposure
SpotOil
Exposure
X =
X =
X =
MARKET INDEXDISTRIBUTIONS
VALUEDISTRIBUTION
EXPOSURETO INDICES
OVERALLVALUE
DISTRIBUTION
ILLUSTRATIVE
THESE RISKS ARE THEN AGGREGATED USING INTER-RISK CORRELATION ESTIMATES
Oliver, Wyman & CompanyN952-00-007
– 31 –
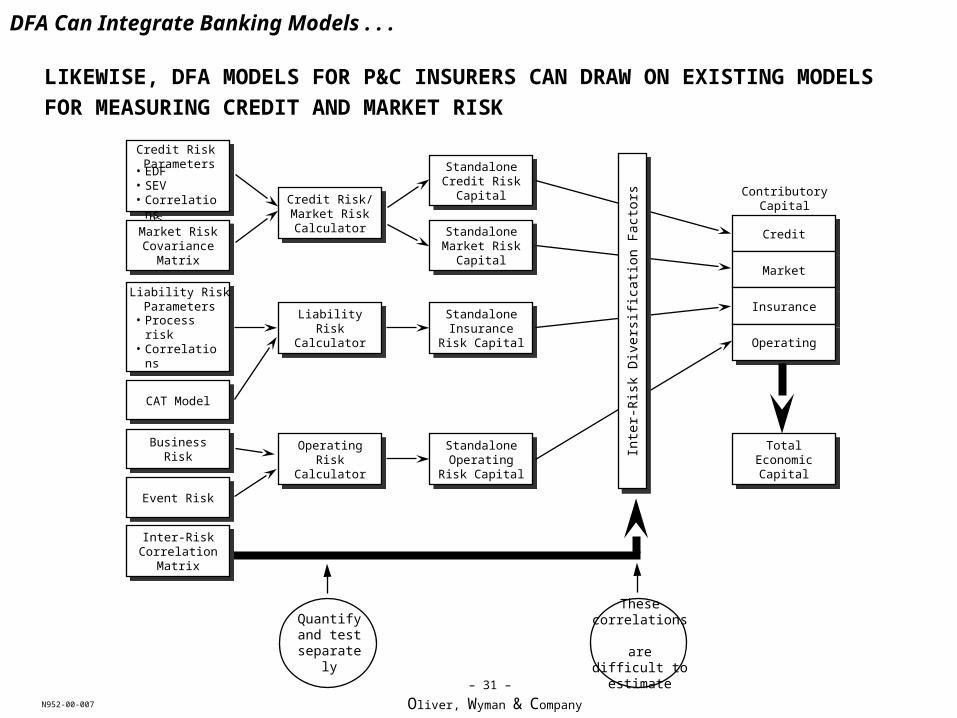
LIKEWISE, DFA MODELS FOR P&C INSURERS CAN DRAW ON EXISTING MODELS
FOR MEASURING CREDIT AND MARKET RISK
• EDF• SEV• Correlations
• EDF• SEV• Correlations
Market Risk Covariance
Matrix
Market Risk Covariance
Matrix
• Process risk• Correlations
• Process risk• Correlations
CAT ModelCAT Model
Event RiskEvent Risk
Inter-Risk Correlation
Matrix
Inter-Risk Correlation
Matrix
Credit Risk/Market Risk Calculator
Credit Risk/Market Risk Calculator
Liability Risk Calculator
Liability Risk Calculator
Operating Risk Calculator
Operating Risk Calculator
Standalone Credit Risk
Capital
Standalone Credit Risk
Capital
Standalone Insurance Risk
Capital
Standalone Insurance Risk
Capital
Standalone Operating Risk
Capital
Standalone Operating Risk
Capital
Standalone Market Risk
Capital
Standalone Market Risk
Capital
CreditCredit
MarketMarket
InsuranceInsurance
OperatingOperating
TotalEconomic
Capital
TotalEconomic
Capital
ContributoryCapital
Inte
r-R
isk
Div
ersi
ficat
ion
Fac
tors
Inte
r-R
isk
Div
ersi
ficat
ion
Fac
tors
Credit Risk Parameters
Liability RiskParameters
Business RiskBusiness Risk
DFA Can Integrate Banking Models . . .
These correlations are difficult to
estimate
Quantify and test
separately