:N1LiEu UiiU.iCJ'5 JOURNAL - Ohio EPAchagrin.epa.ohio.gov/edoc/images/638300/6383000001.pdf · OHIO...
67
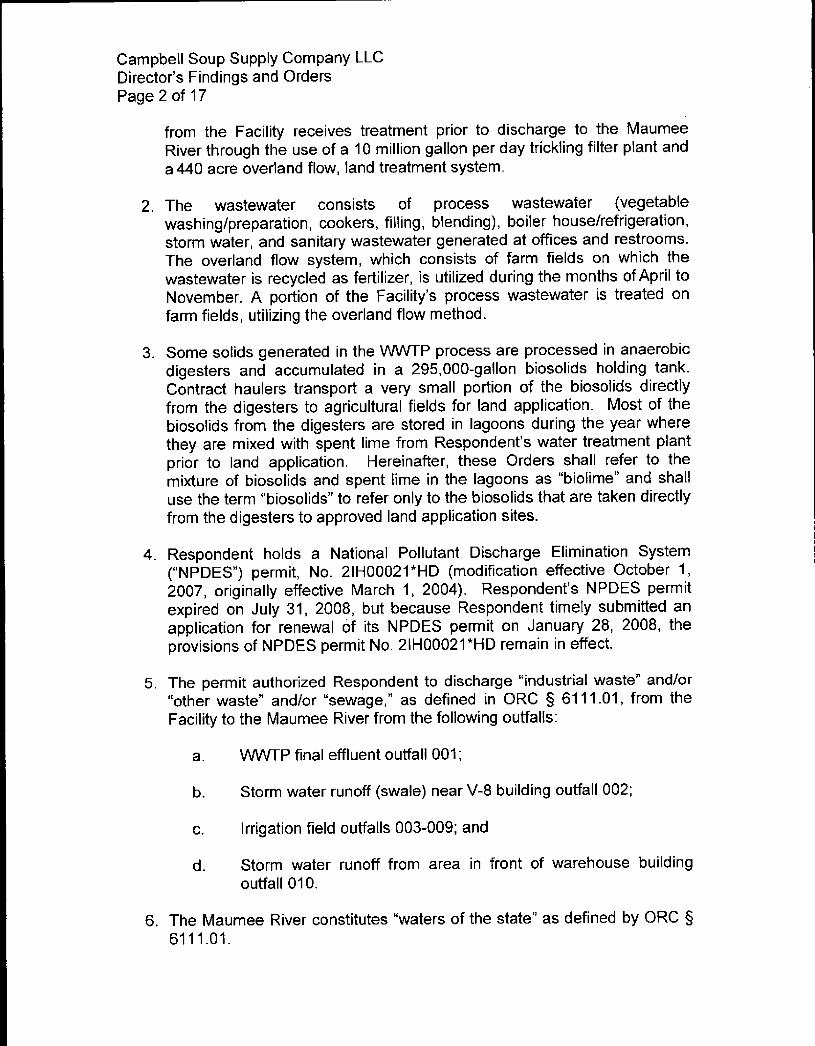
OHIO E.RA. BEFORE THE OHIO ENVIRONMENTAL PROTECTION AGEtW2 2011 :N1LiEu UiiU.iCJ'5 JOURNAL In the matter of: Campbell Soup Supply Company LLC 12-773 State Route 110 Napoleon, Ohio 43545 Respondent Director's Final Findings and Orders PREAMBLE It is agreed by the parties hereto as follows: I. JURISDICTION These Directors Final Findings and Orders ("Orders") are issued to the Campbell Soup Supply Company LLC ("Respondent") pursuant to the authority vested in the Director of the Ohio Environmental Protection Agency ("Ohio EPA") (collectively, the "parties") under Ohio Revised Code ("ORC") § 6111.03, 6109, and 3745.01. II. PARTIES BOUND These Orders shall apply to and be binding upon Respondent and its successors in interest liable under Ohio law. No change in ownership of Respondent or the Facility (as hereinafter defined) shall in any way alter Respondent's obligations under these Orders. III. DEFINITIONS Unless otherwise stated, all terms used in these Orders shall have the same meaning as defined in ORC Chapter 6111, and the rules promulgated thereunder. IV. FINDINGS The Director of the Ohio EPA has made the following findings: I. Respondent is the owner and operator of a heat process canned food facility, which produces canned soups, sauces, and juices located at 12- 773 State Route 110, Napoleon, Henry County, Ohio. Campbell Soup Supply Company LLC and its associated wastewater treatment plant ("WWTP") are hereinafter collectively referred to as "Facility". Wastewater
Transcript of :N1LiEu UiiU.iCJ'5 JOURNAL - Ohio EPAchagrin.epa.ohio.gov/edoc/images/638300/6383000001.pdf · OHIO...
OHIO E.RA.BEFORE THE
OHIO ENVIRONMENTAL PROTECTION AGEtW2 2011
:N1LiEu UiiU.iCJ'5 JOURNAL
In the matter of:
Campbell Soup Supply Company LLC12-773 State Route 110Napoleon, Ohio 43545
Respondent
Director's FinalFindings and Orders
PREAMBLE
It is agreed by the parties hereto as follows:
I. JURISDICTION
These Directors Final Findings and Orders ("Orders") are issued to the CampbellSoup Supply Company LLC ("Respondent") pursuant to the authority vested inthe Director of the Ohio Environmental Protection Agency ("Ohio EPA")(collectively, the "parties") under Ohio Revised Code ("ORC") § 6111.03, 6109,and 3745.01.
II. PARTIES BOUND
These Orders shall apply to and be binding upon Respondent and its successorsin interest liable under Ohio law. No change in ownership of Respondent or theFacility (as hereinafter defined) shall in any way alter Respondent's obligationsunder these Orders.
III. DEFINITIONS
Unless otherwise stated, all terms used in these Orders shall have the samemeaning as defined in ORC Chapter 6111, and the rules promulgatedthereunder.
IV. FINDINGS
The Director of the Ohio EPA has made the following findings:
I. Respondent is the owner and operator of a heat process canned foodfacility, which produces canned soups, sauces, and juices located at 12-773 State Route 110, Napoleon, Henry County, Ohio. Campbell SoupSupply Company LLC and its associated wastewater treatment plant("WWTP") are hereinafter collectively referred to as "Facility". Wastewater
Campbell Soup Supply Company LLCDirector's Findings and OrdersPage 2 of 17
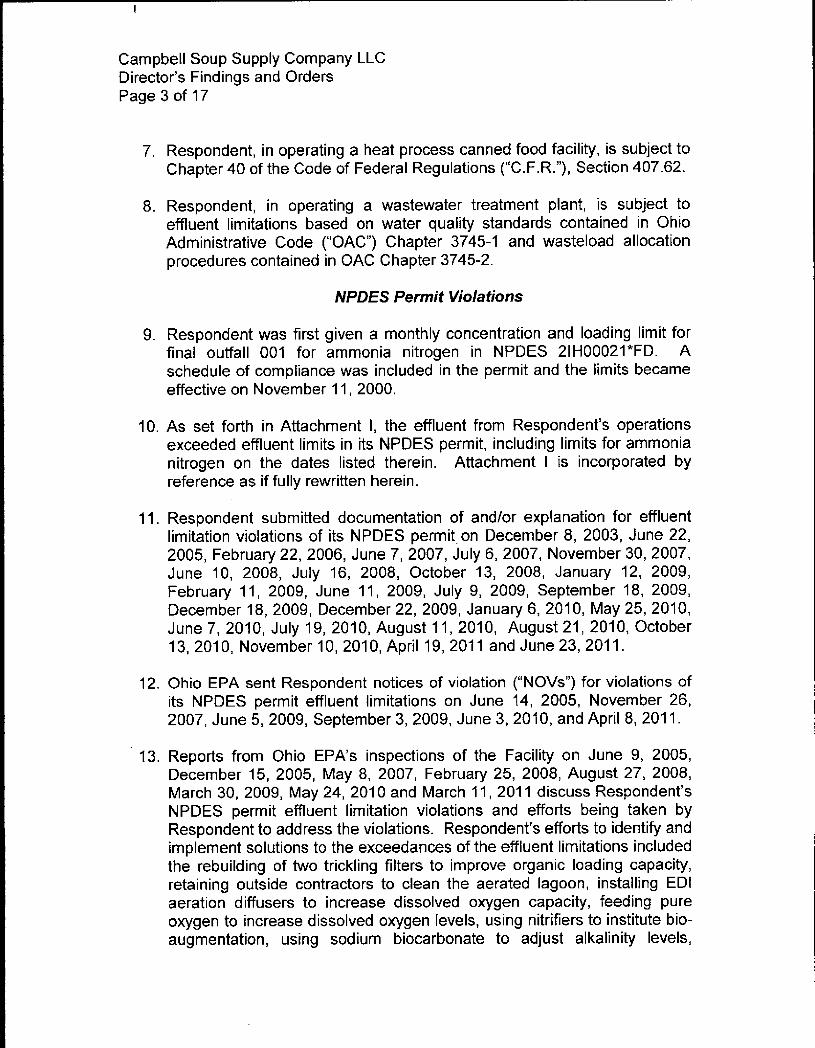
from the Facility receives treatment prior to discharge to the MaumeeRiver through the use of a 10 million gallon per day trickling filter plant anda 440 acre overland flow, land treatment system.
2. The wastewater consists of process wastewater (vegetablewashing/preparation, cookers, filling, blending), boiler house/refrigeration,storm water, and sanitary wastewater generated at offices and restrooms.The overland flow system, which consists of farm fields on which thewastewater is recycled as fertilizer, is utilized during the months of April toNovember. A portion of the Facility's process wastewater is treated onfarm fields, utilizing the overland flow method.
3. Some solids generated in the WJVTP process are processed in anaerobicdigesters and accumulated in a 295,000-gallon biosolids holding tank.Contract haulers transport a very small portion of the biosolids directlyfrom the digesters to agricultural fields for land application. Most of thebiosolids from the digesters are stored in lagoons during the year wherethey are mixed with spent lime from Respondent's water treatment plantprior to land application. Hereinafter, these Orders shall refer to themixture of biosolids and spent time in the lagoons as "biolime" and shalluse the term 'biosolids" to refer only to the biosolids that are taken directlyfrom the digesters to approved land application sites.
4. Respondent holds a National Pollutant Discharge Elimination System("NPDES") permit, No. 21H00021*HD (modification effective October 1,2007, originally effective March 1, 2004). Respondent's NPDES permitexpired on July 31, 2008, but because Respondent timely submitted anapplication for renewal of its NPDES permit on January 28, 2008, theprovisions of NPDES permit No. 21H00021*HD remain in effect.
5. The permit authorized Respondent to discharge "industrial waste" and/or"other waste" and/or "sewage," as defined in ORC § 6111.01, from theFacility to the Maumee River from the following outfalls:
a. WVVTP final effluent outfall 001;
b. Storm water runoff (swale) near V-8 building outfall 002;
C. irrigation field outfalls 003-009; and
d. Storm water runoff from area in front of warehouse buildingoutfall 010.
6. The Maumee River constitutes "waters of the state" as defined by ORC §6111.01.
Campbell Soup Supply Company LLCDirector's Findings and OrdersPage 3 of 17
7. Respondent, in operating a heat process canned food facility, is subject toChapter 40 of the Code of Federal Regulations ("C.F.R."), Section 407.62.
8. Respondent, in operating a wastewater treatment plant, is subject toeffluent limitations based on water quality standards contained in OhioAdministrative Code ('OAC") Chapter 3745-1 and wasteload allocationprocedures contained in OAC Chapter 3745-2.
NPDES Permit Violations
9. Respondent was first given a monthly concentration and loading limit forfinal ouffall 001 for ammonia nitrogen in NPDES 21H00021*FD . Aschedule of compliance was included in the permit and the limits becameeffective on November 11, 2000.
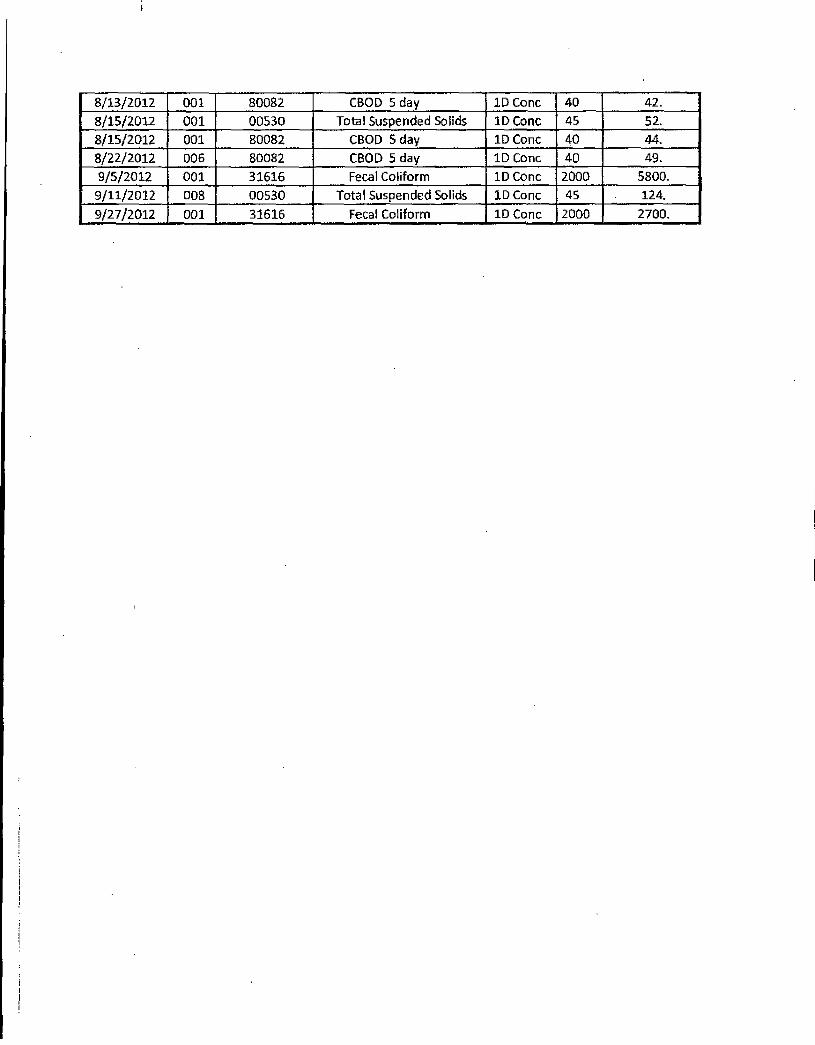
10. As set forth in Attachment I, the effluent from Respondent's operationsexceeded effluent limits in its NPDES permit, including limits for ammonianitrogen on the dates listed therein. Attachment I is incorporated byreference as if fully rewritten herein.
11. Respondent submitted documentation of and/or explanation for effluentlimitation violations of its NPDES permit . on December 8, 2003, June 22,2005, February 22, 2006, June 7, 2007, July 6, 2007, November 30, 2007,June 10, 2008, July 16, 2008, October 13, 2008, January 12, 2009,February 11, 2009, June 11, 2009, July 9, 2009, September 18, 2009,December 18, 2009, December 22, 2009, January 6, 2010, May 25, 2010,June 7, 2010, July 19, 2010, August 11, 2010, August 21, 2010, October13, 2010, November 10, 2010, April 19, 2011 and June 23, 2011.
12. Ohio EPA sent Respondent notices of violation ("NOVs") for violations ofits NPDES permit effluent limitations on June 14, 2005, November 26,2007, June 5, 2009, September 3, 2009, June 3, 2010, and April 8, 2011.
13. Reports from Ohio EPA's inspections of the Facility on June 9, 2005,December 15, 2005, May 8, 2007, February 25, 2008, August 27, 2008,March 30, 2009, May 24, 2010 and March 11, 2011 discuss Respondent'sNPDES permit effluent limitation violations and efforts being taken byRespondent to address the violations. Respondent's efforts to identify andimplement solutions to the exceedances of the effluent limitations includedthe rebuilding of two trickling filters to improve organic loading capacity,retaining outside contractors to clean the aerated lagoon, installing EDIaeration diffusers to increase dissolved oxygen capacity, feeding pureoxygen to increase dissolved oxygen levels, using nitrifiers to institute bio-augmentation, using sodium biocarbonate to adjust alkalinity levels,
Campbell Soup Supply Company LLCDirectors Findings and OrdersPage 4 of 17
increasing chlorine feed to form chloramines, adding aeration to thechlorine contact chamber, and blending trickling filter effluent with aeratedlagoon effluent.
14. Respondent believes that the generation of additional solids in the tricklingfilters in the wastewater treatment plant, the die off of the filters microbeson the weekends, and the die-off and decay of biological material in theaeration lagoon caused the ammonia exceedances at the plant.
15. Respondent started influent monitoring at the WWTP on August 24, 2011and has collected influent data since that time.
16. On October 6, 2009, Respondent submitted Permit to Install ("PTI")application No. 728325 to upgrade the Facility's WVVTP. Ohio EPA issuedthis PTI on December 22, 2009. The upgrades proposed in Respondent'sapplication included the installation of two settling tanks, alum feed tank,and a waste sludge pump station, and the conversion of two DAF unitsinto post-aeration basins.
17. On April 12, 2010, Respondent commenced construction in accordancewith PTI No. 728325 for upgrade of its VWITP necessary to achievecompliance with NPDES permit No. 21H00021. Respondent completedconstruction of the WWTP upgrades in November 2010. The wastewatertreatment upgrades and improvements have included the addition ofsupplemental carbon on the weekends to sustain the microbes in thefilters, the installation of clarifiers after the filters to settle and removesolids to decrease ammonia generation, and the replacement of theaeration lagoon with large tanks. The Facility's effluent has complied withthe permit's effluent limitations for ammonia nitrogen since the completionof the WWTP upgrades.
18. Part II, A of Respondent's current NPDES permit requires the wastewatertreatment works to be under the supervision of an operator possessing anOhio EPA certificate with a classification of Class Ill or higher. Revisionsto OAC rule 3745-7-02 will be incorporated into Respondent's NPDESpermit renewal, which will include the reclassification of the WWTP torequire a Class IV operator at the plant for 8 hours per day, 5 days perweek. In 2006, Respondent's Class IV operator, Mike Maringer retired.Mr. Maringer oversaw operation of the Facility's WWTP, drinking watertreatment plant, wastewater spray irrigation, sludge handling andmanagement of maintenance staff. Mr. Maringer was retained asRespondent's Class IV operator through yearly contracts after hisretirement for the following hours per week for both the WWTP anddrinking water treatment plant:

Campbell Soup Supply Company LLCDirector's Findings and OrdersPage 5 of 17
August 2006- August 2007-15 hours per weekAugust 2007 - August 2008 - 20 hours per weekAugust 2008 - August 2009 - 20 hours per weekAugust 2009 - August 2010 —40 hours per weekAugust 2010 - June 2012 - 40 hours per week
Respondent did not have a Class IV operator for the drinking watertreatment plant from July to mid-August 2012. Mr. Maringer and otherClass IV operators have served as Respondent's Class IV operators forthe drinking water treatment plant for 40 hours per week since mid-August2012. Respondent has had a Class Ill wastewater operator on staff butthis operator was not actually designated by Respondent nor identified toOhio EPA as the operator of record for the wastewater treatment works.
19. On March 11, 2010, Ohio EPA sent an NOV to Respondent for failure toprovide the minimum staffing hours as required for Respondent's drinkingwater treatment plant. Respondent is required by OAC 3745-7-03(C)(1) tohave a Class IV operator overseeing the drinking water treatment plant fora minimum of 40 hours per week. To be in compliance, Ohio EPAinformed Respondent that the \MNTP and WTP must each be staffed byan appropriately certified operator for 40 hours per week. Respondentdisputed Ohio EPA's conclusion, stating that Mr. Maringer has beensupervising both the public water system and the wastewater treatmentworks for 40 hours per week.
20. Pursuant to ORC § 6111.04(C), no person to whom a permit has beenissued shall place or discharge, or cause to be placed or discharged, inany waters of the state any sewage, sludge, sludge materials, industrialwaste, or other wastes in excess of the permissive discharges specifiedunder an existing permit.
21. Pursuant to ORC § 6111.07(A), no person shall violate or fail to performany duty imposed by ORC § 6111.01 to 6111.08 or violate any order,rule, or term or condition of a permit issued or adopted by the Director ofOhio EPA pursuant to those sections. Each day of violation is a separateoffense.
Biosolids Management Violations
'22. Respondent holds a PTI (No. 03-15889) issued on October 7, 2003 thatauthorizes, among other things, the land application of biosolids from theFacility's WWTP holding tank to agricultural fields including thoseidentified as Site ID# T1229 (57.0 acres) and T1014 (50.0 acres). Theapproved plan contains the following application and record keepingrequirements.
Campbell Soup Supply Company LLCDirector's Findings and OrdersPage 6 of 17
a. The plan states that biosolids will be applied at an agronomicrate for the reasonably expected yield of the intended crop andwill at no time exceed the nitrogen requirements for the crop.The plan estimates an application rate of 19,500 gallons peracre per crop season to meet nitrogen needs of a corn,soybean, or grass hay crop. However, the appropriateapplication rates will vary from time-to-time and from field-to-field, depending on the amount of nitrogen in the latest biosolidssample and the expected yield of the intended crop.
b. The plan states that Respondent shall post signs at sites wherebiosolids are land applied-
c_ The plan states that biosolids will be surface applied andincorporated preferably within 6 hours but no later than 24 hoursafter application.
d. The plan states that soil samples shall be collected andanalyzed from each application site so that the most recentresults are not more than two years old at the time of biosolidsland application. Representative soil samples shall be collectedthat represent twenty to twenty-five acres or less of the sitebeing sampled.
e. The plan requires a monthly self-monitoring report that includesdates of biosolids application, the site(s) used, the number ofacres applied per site(s), the total gallons applied per site(s), thegallons applied per acre, the application method and equipmentused, and a biosolids analysis that reflects current status.
f. The plan requires the submittal of an annual report to Ohio EPAby January 31 of each year for the previous years biosolidsapplication.
g The plan requires Respondent to provide a nutrient value reportto the recipient and applicator of biosolids.
23. On August 21, 2009, Ohio EPA inspected Respondent's land applicationfield T1014. This inspection is documented in a follow up letter toRespondent dated September 3, 2009. As a part of its investigation, OhioEPA interviewed Respondent's contract hauler who informed Ohio EPAthat it currently and historically only used the west 20 acres of the site forbiosolids application due to typically wet conditions on the lower easternside and the proximity to a residence. Ohio EPA noted in the follow up

Campbell Soup Supply Company LLCDirector's Findings and OrdersPage 7 of 17
letter that it appeared biosolids were being applied in excess of theamount authorized in Respondent's approved PTI and prohibitedadditional land application of biosolids to site T1014. The letter requestedrecords regarding biosolids land application to be submitted to the Agencywithin three weeks.
24. On August 25, 2009, Respondent emailed Ohio EPA a number ofbiosolids land application records from April 2008 to July 2009 andweather records from February 2009 to July 2009.
25. On September 2, 2009, Respondent emailed Ohio EPA additionalbiosolids land application records from April 2004 to December 2008. Therecords indicate that site T1229 had not been used for land applicationsince November 2006. Between November 2006 and September 2009,only site Ti 014 had been used for application.
26. On September 3, 2009, Ohio EPA requested all land application recordsdocumenting the monthly land application annual applicable loading ratecalculations for biosolids (e.g. nitrogen and phosphorus) and cumulativeloading rates for T1014 and all other sites associated with land applicationof biosolids.
27. Upon review of records Respondent submitted, Ohio EPA has determinedthe following:
a. That the biosolids application records for April 2004 throughJanuary 2005 and April 2005 through December 2005 do notidentify the days of application in violation of the land applicationplan approved pursuant to PTI No. 03-15889.
Respondent's land application records indicate biosolids wereapplied on field T1 014 during the entire growing season for theyears of 2004, 2006, 2007, 2008 and through July 2009. Thistotaled 4,807,950 gallons of biosolids applied to Field TI 014.Respondent's records do not indicate whether crops were grown onfield TI 014 for the years 2004 through 2009.
b. Respondent's land application records do not contain a basis forloading rate calculations for biosolids (e.g. nitrogen andphosphorus) and cumulative loading rates.
c. To the extent that there were no crops grown on this field during theyears 2004-2009, land application of material would not provide any
Campbell Soup Supply Company LLCDirector's Findings and OrdersPage 8 of 17
agronomic benefit and therefore was a violation of Respondent'sPTI.
28. A letter dated February 4, 2010 from Respondents consultant Kevin Otteindicates soil sampling of land application site T1014 in 2008 consisted ofonly one sample per 50 acres. In accordance with the land applicationplan approved pursuant to PTI, No. 03-15889, a minimum of two soilsamples should have been collected from the field.
29. Respondent's PTI states that "the entity shall perform the proposed landapplication operation in strict accordance with the conditions given in thisapproval and with the method of operation outlined in the applicationsubmitted for this approval." The over application/misapplication ofbiosolids to the approved field is a violation of the PTI.
30. On September 23, 2009, Ohio EPA received a letter from Respondentindicating that it had discontinued the land application of biosolids byHelberg Hauling LLC on Robert Schwab's permitted ground (Sites T1229and T1014) and applications for additional land application sites would besubmitted.
31. On October 5, 2009, Respondent submitted a site authorization requestfor biosolids application on two fields.
32. On April 19, 2010, Ohio EPA met with Respondent and Respondent'sconsultant to discuss future land application site approvals andenhancements to the procedures and record keeping for the landapplication of biosolids that Respondent planned to implement. Sincethat time, Respondent maintains that it has implemented theseenhancements.
33. On May 5, 2010, Ohio EPA approved four sites for land application ofdigested biosolids from Respondent's Facility. The approval containsconditions outlined in some of the Orders below that incorporateenhancements to the procedures and record keeping for the landapplication of biosolids that Respondent proposed in April 2010.
34. The following Orders do not constitute authorization or approval of theconstruction of any physical structure or facilities, or the modification ofany existing treatment works or sewer system. Any such construction ormodification is subject to the Permit to Install requirements of ORC §6111.44 and 6111.45 and OAC Chapter 3745-42.

Campbell Soup Supply Company LLCDirector's Findings and OrdersPage 9 of 17
35. This document does not modify NPDES Permit No. 21H00021*HD. Thepurpose of this document is to address non compliance with NPDESPermit No. 21H00021 *HD and not to alter said permit.
36. Compliance with ORC Chapter 6111 is not contingent upon the availabilityor receipt of financial assistance.
37. The Director has given consideration to and based his determination on,evidence relating to the technical feasibility and economic reasonablenessof complying with these Orders and to evidence relating to conditionscalculated to result from compliance with these Orders, and its relation tothe benefits to the people of the State to be derived from such compliancein accomplishing the purposes of ORC Chapter 6111.
V. ORDERS
The Director hereby issues the following Orders:
To obtain a year of influent monitoring data, Respondent collected andanalyzed samples of the Facility's influent wastewater to the WWTPbetween August 23, 2011 and August 23, 2012 for the followingparameters at the specified sampling frequency using the analysismethods set forth below:
a. pH in S.U. - daily, using Standard Method (SM) 4500-H+ B.;
b. Nitrogen, Ammonia in mg/I - 2/week, using Hach Method 10205;
C. Phosphorus, Total in mg/I - 2lweek, using SM 4500-P E.;
d. Chemical Oxygen Demand in mg/I - 2/week, using Hach Method10236;
e. Total Suspended Solids in mg/I - 2/week, using SM 2540 D;
1. Oil and grease in mgll - monthly, using EPA 1664A; and
g. Dissolved Oxygen in mg/I - daily, Hach Method 10360.
Within 30 days after the effective date of these Orders, Respondent shallsend the data described in this Order to Ohio EPA.
2. Respondent shall, upon the effective date of these Orders, attain anoperational level at the WWTP and meet the final effluent limitations inNPDES permit No. 21H00021. For three (3) years after the effective date
Campbell Soup Supply Company LLCDirector's Findings and OrdersPage 10 of 17
of these Orders, Respondent shall, within 30 days after Ohio EPAnotification, submit a compliance plan that includes a compliance schedulefor returning to compliance if any of the following occurs:
a. A 40% exceedance of specific pollutant limits listed in the attachedAttachment II, Exhibit A, or a 20% exceedance of a specificpollutant limit from Attachment Ii, Exhibit B, at a given dischargepoint for any two or more months of two consecutive quarters; or
b. Violation of any monthly effluent limit at a given pipe by any amountfor any four or more months of two consecutive quarters.
Upon Ohio EPA's approval of the compliance plan, Respondent shallimplement the compliance plan in accordance with the approvedschedule.
3. As soon as possible but not later than eight (8) months from the effectivedate of these Findings and Orders, Respondent shall submit to Ohio EPA,in accordance with Section X, for review and approval an operational planaddressing the critical operation controls that will be put in place to ensurethat all biosolids, biolime, and digested biomass generated or received byRespondent's Facility receives adequate storage and treatment. This planshall be designed to provide Respondent enough data, process controlgoals and target permitting dates for land application approvals tosuccessfully manage biosolids, biolime and digested biomass as well asimpacts on biosolids, biolime, and digested biomass from operationalchanges. The plan shall include the following information to the degreenecessary to achieve the objectives of this Order No. 3:
a. An engineering estimate of the current volume capacity of eachstorage lagoon;
b. The installation of gauges in the lagoons that can be used tocalculate the amount of freeboard (and thus, the remaining storagecapacity) left in the lagoons;
c. An inspection log for Facility operators to use to document and logthe amount of biosolids, biolime and digested biomass pumped toand removed from the lagoons;
d. Data collection necessary to enable management to recognizeincreases in biosolids, biolime and digested biomass generationrates and corresponding estimates for the increase in landapplication acreage needed during the summer months; and
Campbell Soup Supply Company LLCDirector's Findings and OrdersPage 11 of 17
e. Timelines necessary to ensure timely permitting for increasing anynecessary acreage for land application.
4. Respondent shall apply digested biosolids and digested biomass inaccordance with the best management practices from the United StatesDepartment of Agriculture, Natural Resources Conservation Service("USDA-N RCS") Conservation Practice Standard for NutrientManagement (Code 590) included in Attachment Ill of these Orders(except for the redacted provisions in the attachment) in addition torequirements of Respondents biosolids and digested biomassmanagement plan approved pursuant to PTI No. 03-15889 and anymodifications thereof. Respondent may follow recommendations labeled"Considerations" on pages 11 through 14 but they shall not be consideredenforceable requirements under these Orders. In addition, wheneverCode 590 identifies concentrations of phosphorus based on Bray P1 orBray-Kurtz P1 testing, those concentrations may be multiplied by 1.1333where Mehlich 3 testing is conducted. These requirements shall apply forthe land application of biosolids and digested biomass generated by theFacility on current and future approved application sites, whether theFacility or a contractor conducts the application. In cases where theapproved PTI requirement conflicts with Attachment Ill, the more stringentrequirement shall be implemented. A suggested biosolids and digestedbiomass daily land application record keeping form is included inAttachment IV. A suggested biosolids site nutrient budget record keepingform is included in Attachment V. At a minimum, the informationcontained in Attachments Ill, IV, and V must be incorporated intoRespondent's revised biosolids and digested biomass managementsystems. Respondent shall incorporate the practices in Attachment Ill intoits land application procedures.
5. By January 31 of 2013 and each subsequent year, Respondent shallsubmit to Ohio EPA, in accordance with Section X, updated maps in a GISshape file, detailing the fields that Respondent used for application ofbiosolids, biolime, and digested biomass (on its own or through contract)for the previous calendar year. Two GIS, as described herein, shape fileswill be maintained and submitted in electronic format annually.
The first GIS shape file will contain georeferenced polygons demarking thearea within a field which has the same total land application volume ofbiosolids, biolime, and digested biomass applied prior to subsequentcrop(s). Each polygon in the shape file shall not be added to the shapefile until the subsequent crop is planted and land application for theseason is complete. Each polygon shall contain the anticipated crop,actual crop planted, date planting began, calculated application rate(based on anticipated crop), basis for application rate determination (i.e.,

Campbell Soup Supply Company LLCDirector's Findings and OrdersPage 12 of 17
list limiting factor), application season start and end dates, actual volumeof biosolids, biolime, and digested biomass applied, and if the phosphateapplication rate exceeded 250 pounds per acre.
The second GIS shape file will contain georeferericed polygons,corresponding to those submitted in the first GIS shape file requiredabove, demarking the areas in the field where the crop(s) were grown.Each polygon in the shape file shall not be added to the shape file untilcrop harvest is complete.
Each polygon shall contain crop growing season start and end dates,anticipated crop, actual crop planted, actual crop yield, actual cropnutrients removed (N, P, K), next anticipated crop and next plannedbiosolids, biolime, and digested biomass application date.
6. Within six months from the effective date of these Orders, Respondent'senhanced oversight program detailed in its March 31, 2010 letter will bemodified to incorporate any of the program enhancements thatRespondent is required to meet under Order Nos. 4, 5 and 6. Theenhanced oversight program shall include the following elements:
a. Field verifications will be scheduled at least once per quarter forfields receiving digested biosolids and digested biomass during thatquarter and at least once per year for a minimum of 10% of thefields receiving biolime during that year. Verifications will includedocumentation that the crops being grown are consistent with theagronomic rate of land application of material applied on the field inquestion. Copies of field verifications will be submitted to Ohio EPAin accordance with Order No. 8 below.
b. Findings from the field verifications that are not in compliance withthe management plan approved under PTI No. 03-15889, theseOrders, or future site approvals shall result in the appropriatecorrections in land application practices or enhancements toRespondent's land application program necessary to comply withthese requirements. These - corrections or enhancements shall takeplace prior to further land application practices.
C. Respondent will include metrics to measure the success of its landapplication program. Failure to meet metric goals during fieldverifications shall trigger Respondent to increase the frequency offuture field verifications.
7. Field TI 014 shall not be used by Respondent without future approval fromOhio EPA.

Campbell Soup Supply Company LLCDirectors Findings and OrdersPage 13 of 17
8. By January 31 of each year, Respondent shall submit to Ohio EPA, inaccordance with Section X, the documentation and records kept incompliance with Order No. 4 and the enhanced oversight reports requiredby Order No. 6 for the previous year's application. The records shall becorrelated with the maps required in Order No. 5, above.
9. At least once every two years, starting in 2012, Respondent shall hold atraining session on biosolids, biomass, and biolirne land applicationrequirements, record keeping, and reporting requirements for allemployees and contractors involved in the handling and management ofthese materials. Written documentation of each such training sessionshall be submitted to Ohio EPA in the annual report that includes a list ofattendees, topics covered and outline of staff/contractor responsibilities(including a flow chart of individual party responsibilities and reportinghierarchy) in regards to biosolids, biomass, and biolime management.Respondent shall provide a copy of its training program, including anyannual updates, to contractors that land apply biosolids, biomass, orbiolime received from Respondent.
10. Upon the effective date of these Orders, Respondent shall continue tohave the capacity in its storage lagoons to hold the quantity of biosolidsthat the plant produces over a period of at least five years.
11. Within 30 days after the effective date of these Orders, Respondent shallfill out a form provided by Ohio EPA designating one or more operatorswith an Ohio EPA classification of at least Class Ill to be the operator(s) incharge of the wastewater treatment works and sewerage system. Thisoperator shall spend a minimum of 40 hours per week supervising only thewastewater treatment works and sewerage system.
12. Upon renewal of Respondent's NPDES permit, the Director shall reclassifyRespondent's WWTP as a Class IV facility but shall include a schedule forsaid designation to become effective at least two years after the effectivedate of these Orders. After such a reclassification, Respondent shallemploy or contract with a licensed Class IV wastewater operator oroperators to supervise the wastewater treatment works and seweragesystem in accordance with any deadline provided for that action in thepermit. The operator(s) shall spend a minimum of 40 hours per weeksupervising only the wastewater treatment works and sewerage system,unless Ohio EPA's rules no longer contain this requirement or unless OhioEPA has authorized Respondent to reduce this requirement pursuant toOAC Rule 3745-7-04 or some other authority.

Campbell Soup Supply Company [[CDirector's Findings and OrdersPage 14 of 17
13. Starting on the effective date of these Orders, Respondent shall employ orcontract with a licensed Class IV operator or operators to supervise thepublic water system pursuant to, and so long as required by, OAC Rule3745-7-03. The operator(s) shall spend a minimum of 40 hours per weeksupervising only the public water system unless Ohio EPA's rules nolonger contain this requirement or unless Ohio EPA has authorizedRespondent to reduce this requirement pursuant to OAC Rule 3745-7-03or some other authority.
14. Respondent shall report any noncompliance with these Orders inaccordance with Part Ill, Paragraph 12 of NPDES permit No. 211-100021.
15. Respondent shall pay the amount of $80,000.00 in settlement of OhioEPA's claims for civil penalties, which may be assessed pursuant to ORCChapter 6111. Within thirty (30) days after the effective date of theseOrders, payment to Ohio EPA shall be made by an official check madepayable to "Treasurer, State of Ohio" for $64,000.00 of the total amount.The official check shall be submitted to Akia Smith, or her successor,together with a letter identifying the Respondent, to:
Office of Fiscal AdministrationOhio Environmental Protection AgencyP.O. Box 1049Columbus, Ohio 43216-1049
A photocopy of the check shall be sent to Ohio EPA's Northwest DistrictOffice in accordance with Section X of these Orders.
16. in lieu of paying $16,000.00 of the civil penalty, Respondent shall, withinthirty (30) days of the effective date of these Orders, fund a supplementalenvironmental project (SEP) by making a contribution in the amount of$16,000.00 to the Conservation Action Project for said amount.
A copy of the check shall be sent to Mark Mann, Enforcement Manager,Storm Water and Enforcement Section, or his successor, at the followingaddress:
Ohio EPADivision of Surface WaterP.O. Box 1049Columbus, Ohio 43216-1049
17. Should Respondent fail to fund the SEP within the required time frame setforth in Order No. 16, Respondent shall immediately pay to Ohio EPA theremaining $16000.00 of the civil penalty in accordance with theprocedures in Order No. 15.

Campbell Soup Supply Company LLCDirector's Findings and OrdersPage 15 of 17
VI. TERMINATION
Respondent's obligations under these Orders shall terminate when Respondentcertifies in writing and demonstrates to the satisfaction of Ohio EPA thatRespondent has performed all obligations set forth in these Orders (except forobligations that otherwise would be required later than three years after theeffective date of these Orders) and the Chief of Ohio EPA's Division of SurfaceWater acknowledges, in writing, the termination of these Orders. Ohio EPA shallnot unreasonably withhold its consent to termination. If Ohio EPA does notagree that all obligations have been performed or incorporated into an applicablepermit, then Ohio EPA will notify Respondent of the deficiency in which caseRespondent shall have an opportunity to address any such deficiencies and seektermination as described above.
The certification shall contain the following attestation: "1 certify that theinformation contained in or accompanying this certification is true, accurate andcomplete."
This certification shall be submitted by Respondent to Ohio EPA and shall besigned by a responsible official of the Respondent. For purposes of theseOrders, a responsible official is defined in OAC Rule 3745-33-03(F).
VII. OTHER CLAIMS
Nothing in these Orders shall constitute or be construed as a release from anyclaim, cause of action or demand in law or equity against any person, firm,partnership or corporation, not a party to these Orders, for any liability arisingfrom, or related to activities occurring on or at the site.
VIII. OTHER APPLICABLE LAWS
All actions required to be taken pursuant to these Orders shall be undertaken inaccordance with the requirements of all applicable local, state and federal lawsand regulations. These Orders do not waive or compromise the applicability andenforcement of any other statutes or regulations applicable to Respondent.
IX. MODIFICATIONS
These Orders may be modified by agreement of the parties hereto. Modificationsshall be in writing and shall be effective on the date entered in the journal of theDirector of Ohio EPA.

Campbell Soup Supply Company LLCDirector's Findings and OrdersPage 16 of 17
X. NOTICE
All documents required to be submitted by Respondent shall be addressed to:
Ohio Environmental Protection AgencyNorthwest District Office/Division of Surface WaterAttention: Enforcement Supervisor347 North Dunbridge RoadP.O. Box 466Bowling Green, Ohio 43402
XI. RESERVATION OF RIGHTS
Ohio EPA and Respondent each reserve all other rights, privileges and causes ofaction, except as specifically waived in Section Xli of these Orders.
XII. WAIVER
In order to resolve disputed claims, without admission of fact, violation or liability,and in lieu of further enforcement action by Ohio EPA for only the violationsspecifically cited in these Orders, Respondent consents to the issuance of theseOrders and agrees to comply with these Orders. Compliance with these Ordersshall be a full accord and satisfaction for Respondent's liability for the violationsspecifically cited herein and any other violations of the effluent limitations andmonitoring requirements of NPDES permit No. 21H00021 that are revealed byRespondent's monthly operating reports submitted to Ohio EPA since January 1,2001.
Respondent hereby waives the right to appeal the issuance, terms andconditions, and service of these Orders and Respondent hereby waives any andall rights Respondent may have to seek administrative or judicial review of theseOrders either in law or equity.
Notwithstanding the preceding, Ohio EPA and Respondent agree that if theseOrders are appealed by any other party to the Environmental Review AppealsCommission, or any court, Respondent retains the right to intervene andparticipate in such appeal. In such an event, Respondent shall continue tocomply with these Orders notwithstanding such appeal and intervention unlessthese Orders are stayed, vacated or modified.

Campbell Soup Supply Company LLCDirector's Findings and OrdersPage 17 of 17
XIII. EFFECTIVE DATE
The effective date of these Orders is the date these Orders are entered into theOhio EPA Director's journal.
XIV. SIGNATORY AUTHORITY
Each undersigned representative of a party to these Orders certifies that he orshe is fully authorized to enter into these Orders and to legally bind such party tothese Orders.
IT IS SO ORDERED AND AGREED:
Ohio Environmental Protection Agency
S3/'
DateDirector
ITISSO GREED:
Campbell
10 kolzSignature Date
R J\rPrinted or Typed Name
S4z \4 6t,6 aL c4-L4-4Title

Attachment I
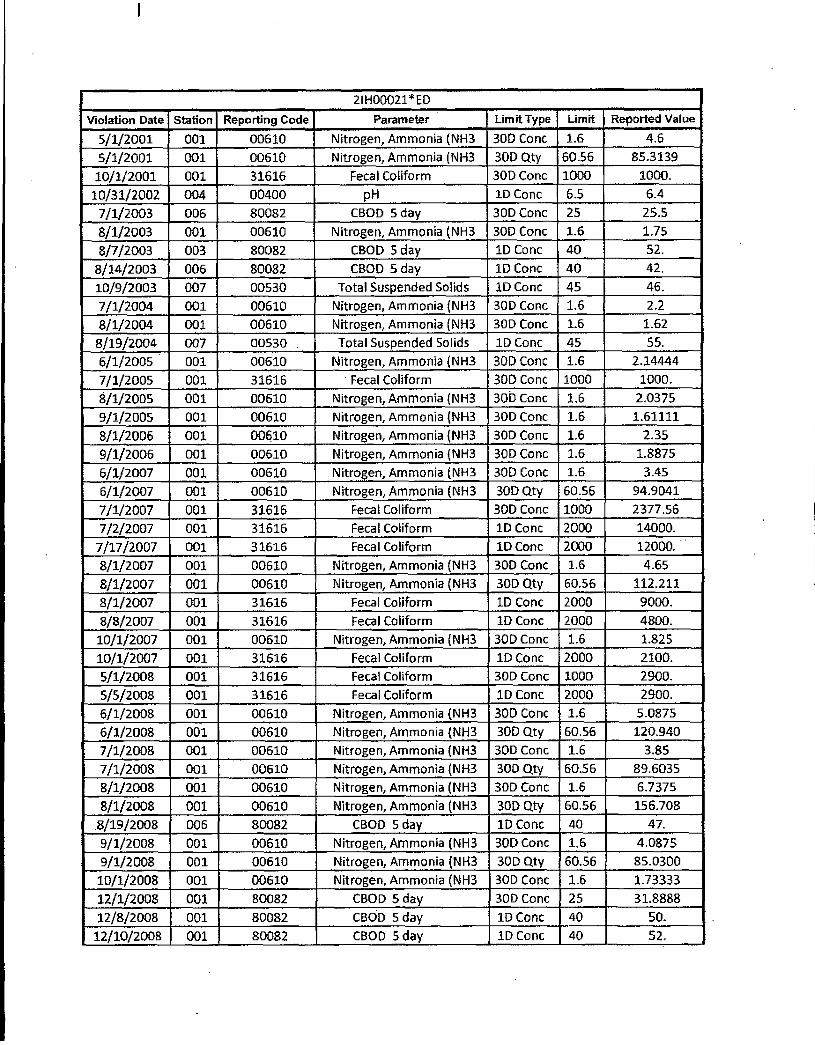
21H00021*E[)Violation Date Station Reporting Code - Parameter Limit Type Umit Reported Value
5/1/2001 001 00610 Nitrogen, Ammonia (NH3 300 Conc 1.6 4.6
5/1/2001 001 00610 Nitrogen, Ammonia (NH3 30D Qty 6056 85.3139
10/1/2001 001 31616 Fecal Coliform 30D Cone 1000 1000.10/31/2002 004 1 00400 - pH ID Cone 6.5 6.4
- 7/1/2003 006 80082 CBOD 5 day 30D Conc 25 25.5
8/1/2003 001 00610 Nitrogen, Ammonia (NH3 300 Conc 1.6 1.75
8/7/2003 003 80082 C0D 5 day 10 Conc 40 52.
8/14/2003 006 80082 CBOD 5 day 10 Cone 40 42.
10/9/2003 007 00530 Total Suspended Solids 1D Conc 45 46.
7/1/2004 001 00610 Nitrogen, Ammonia (NH3 300 Cone 1.6 2.2
8/1/2004 001 00610 Nitrogen, Ammonia (NH3 300 Cone 1.6 1.62
8/19/2004 007 00530 Total Suspended Solids 10 Conc 45 55.
6/1/2005 001 00510 Nitrogen, Ammonia (NH3 300 Cone 1.6 2.14444
7/1/2005 001 31616 Fecal Coliform 300 Conc 1000 1000.
8/1/2005 001 00610 Nitrogen, Ammonia (NH3 300 Cone 1.6 2.0375
9/112005 001 00610 Nitrogen, Ammonia (NH3 300 Cone 1 1.6 1.61111
8/1/2006 001 00610 Nitrogen, Ammonia {NH3 300 Cone 1.6 2.35 -
9/1/2006 001 00610 Nitrogen, Ammonia {NH3 300 Cone 1.6 1.8875
6/1/2007 001 00610 - Nitrogen, Ammonia (NH3 300 Cone 1.6 3.45
6/1/2007 001 00610 Nitrogen, Ammonia (NH3 I 300 Qty 60.56 94.9041
7/1/2007 001 31615 Fecal Coliform 30D Conc 1 1000 2377.56
7/2/2007 001 31616 - Fecal Coliform 10 Cone 12000 14000.
7/17/2007 001 31616 Fecal Coliform 10 Cone 12000 12000.
8/1/2007 001 00610 Nitrogen, Ammonia (NH3 - 30D Coric 1.6 4.65
8/1/2007 001 00610 - Nitrogen, Ammonia (NH3 30D Qty 5036 112.211
8/1/2007 001 31616 Fecal Coliform ID Conc 2000 9000.
- 8/8/2007 001 1 31616 Fecal Coliform 1D Cone 2000 4800.
10/1/2007 001 00610 Nitrogen, Ammonia (NH3 300 Conc 1.6 1.825
3.0/1/2007 001 31616 Fecal Co!iIorm 10 Cone 12000 2100.
5/1/2008 001 31616 Fecal Coliform 30D Cone 1000 2900,
5/5/2008 001 31616 Fecal Coliform 10 Cone 2000 2900.
6/1/2008 001 00510 Nitrogen, Ammonia (NH3 30D Colic 1.6 5.0875
6/1/2008 001 00610 Nitrogen, Ammonia (NH3 300 Qty 60.56 120.940
7/1/2008 001 00610 Nitrogen, Ammonia (NH3 300 Cone 1 1.6 3.85
7/1/2008 001 00610 Nitrogen, Ammonia (NH3 300 Qty 60.56 89.6035
8/1/2008 001 00610 Nitrogen, Ammonia (NH3 300 Conc 1.6 6.7375
8/1/2008 001 00610 Nitrogen, Ammonia (NH3 300 Qty 60.56 156.708
8/19/2008 006 80082 CBOD 5 day 11) Cone 40 47.
9/1/2008 001 00610 Nitrogen, Ammonia (NH3 300 Cone 1.6 4.0875
9/1/2008 001 00610 Nitrogen, Ammonia (NH3 300 Qty 60.56 85.0300
10/1/2008 001 0063.0 Nitrogen, Ammonia (NH3 300 Cone 1.6 1.73333
12/1/2008 001 80082 CBOD 5 day 300 Cone 25 31.8888
12/8/2008 001 80082 CBOD Sday 10 Cone 40 - 50.12/10/2008 001 80082 CBOD 5 day 10 Cone 40 52.

5/11/2009 001 31616 Fecal Coliform lDConc 2000 10075.
6/22/2009 001 80082 CBOD 5 day 1D Conc 40 41.
6/24/2009 001 00530 Total Suspended Solids ID Conc 45 56.
6/24/2009 001 80082 - CBOD Sday lDConc 40 53.
7/1/2009 001 00610 Nitrogen, Ammonia (NH3 30D Conc 1.6 3.07143
8/1/2009 001 1 00610 Nitrogen, Ammonia (NH3 300 Conc 1.6 3.125
8/1/2009 001 00510 Nitrogen, Ammonia (NH3 300 Qty 6056 64.2456
8/1/2009 008 80082 CBOD 5 day 300 Conc 25 32.6
8/3/2009 001 80082 CBOD S day 10 Ccrnc 40 42.
8/1312009 008 00530 Total Suspended Solids ID Conc 45 52.
8/13/2009 008 80082 CBOD Sday lDConc 40 73.
8/25/2009 008 80082 CBOD S day 10 Conc 40 76.
9/1/2009 001 00610 Nitrogen, Ammonia (NH3 300 Conc 1.6 4,475
9/1/2009 001 00610 Nitrogen, Ammonia (NI-B 30D Qty 60.56 - - 85.0442
10/6/2009 008 80082 CBOD 5 day 10 Conc 4057,
12/1/2009 001 80082 CBOD 5 day 300 Conc 25 36.8888
12/7/2009 001 80082 CBOD S day 10 Conc 40 62.
12/9/2009 001 80082 CBOD 5 day 1D Conc 40 47.
12/14/2009 001 80082 CBOD Sday lDConc 40 54.
7/1/2010 001 00510 Nitrogen, Ammonia (NH3 - 300 Conc 1.6 11
7/1/2010 001 00610 Nitrogen, Ammonia (NH3 300 Qty 60.55 66.2469
7/1/2010 001 80082 CBOD 5 day 300 Conc 25 30.25
8/1/2010 001 00610 Nitrogen, Ammonia (NH3 30D Conc 1.6 4.3
8/1/2010 001 00610 Nitrogen, Ammonia (NH3 300 Qty 50.56 82.2943
9/1/2010 001 00610 Nitrogen, Ammonia (NH3 300 Conc 1.6 1.6625
10/26/2010 009 00530 Total Suspended Solids 10 Conc 45 58,
10/26/2010 009 80082 CBOD 5däy lDConc 40 78.
5/2/2011 001 34044 Oxidants, Total Residu ID Conc 0.01 .08
5/2/2011 001 34044 Oxidants, Total Residu 1D Qty 0.379 1.24148
5/4/2011 001 34044 Oxidants, Total Residu 10 Conc 0.01 .06
5/4/2011 001 34044 Oxidants, Total Residu 10 city 0.379 .93111
6/22/2011 001 00530 Total Suspended Solids lDConc 45 50.
6/22/2011 001 80082 CBOD 5 day 1D Conc 40 60.
7/1/2011 001 80082 CBOD Sday 300 Conc 25 27.625
7/13/2011 001 80082 CBOD 5 day 10 Conc 40 55.
11/1/2011 005 80082 CBOD Sday 300Conc 25 37.
11/8/2011 007 80082 CBOD 5day lDConc 40 58,
11/15/2011 005 80082 CBOD Sday lDConc 40 58.
12/14/2011 001 80082 CBOD S day 10 Conc 40 50.
2/8/2012 001 80082 CBOD 5 day 1D Conc 40 44,
5/16/2012 001 34044 Oxidants, Total Residu 1D Conc 0.01 .2
5/16/2012 001 34044 Oxidants, Total Residu 1D Qty 0.379 3.3308
8/112012 001 00530 Total Suspended Solids 1D Conc 45 - 66.
8/1/2012 001 1 00530 Total Suspended Solids 300 Conc 1 30 37.6666
8/1/2012 001 80082 CBOD 5 day 1D Conc 40 49.
8/1/2012 001 80082 CBOD 5 day 300 Conc 25 29.5555
8/13/2012 001 00530 Total Suspended Solids 10 Conc 45 48.
8/13/2012 001 80082 CBOD 5 day ID Conc 40 42.8/15/2012 001 00530 Total Suspended Solids lDConc 45 52,8/15/2012 001 80082 CBOIJ 5 day 10 Conc 40 44.8/22/2012 006 80082 CBOD 5 day - 10 Conc 40 49.9/5/2012 001 31616 Fecal Coliform 1D Conc 2000 5800.9/11/2012 008 00530 - Total Suspended Solids 10 Conc 45 124.9/27/2012 001 31616 - Fecal Coliform 1D Conc 2000 2700.

21H00021'EDViolation Date Station Reporting Code Parameter Sample Frequency Expected Reported
05101/2001001 00610 Nitrogen, Ammonia (NH3 2/Week 2 105108/2001 001 00510 Nitrogen, Ammonia NH3 2/Week 2 005/15/2001 001 00610 Nitrogen. Ammonia (NH3 2/Week 2 005/22/2001 001 1 00610 Nitrogen. Ammonia (NH3 2/Week 2 007/01/2003 008 00530 Total Suspended Solids 2/Week 2 007/01/2003 008 00610 Nitrogen, Ammonia (NH3 2/Week 2 007/01/2003 008 80082 C800 5 day 2/Week 2 007/01/2003 008 00400 pH - 1/Week - 1 008/01/2002 008 00530 - Total Suspended Solids - 2/Week 2 108/01/2002 008 00610 Nitrogen, Ammonia (NH3 2/Week 2 108/01/2002 008 80082 CBOD 5 day 2/Week - 2 110/01/2003 001 00530 Total Suspended Solids - 2/Week 2 110/01/2003. 001 .00610 Nitrogen, Ammonia (NH3 - 2/Week 10/01/2003 001 80082 CBOD 5 dày 2/Week 2 10/01/2003 001 50060 Chlorine, Total Residu 2/Week 2 107/01/2003 009 - 00530 Total Suspended Solids 2/Week 2 007/01/2003 009 00610 Nitrogen, Ammonia (N H3 '2/Week 2 007/0112003 009 80082 CBOD 5day 2/Week 2 007/01/2003 009 00400 pH 1/Week 1 008/01/2002 009 00530 Total Suspended Solids 2/Week 2 108/01/2002 009 - 00610 Nitrogen, Ammonia (NH3 2/Week - 2 108/01/2002 009 80082 CBOD 5 day 2/Week 2 107/01/2003 007 00530 Total Suspended Solids 2/Week 2 007101/2003 007 00610 Nitrogen, Ammonia (NH3 2/Week 2 007/01/2003 007 80082 CBOD 5 day - 2/Week 2 007/01/2003 007 00400 - pH - 1/Week - 1 - 008/01/2002 007 00530 Total Suspended Solids 2/Week 2 108/01/2002 007 00610 Nitrogen, Ammonia {NH3 2/Week 2 108/01/2002 007 80082 CBOO S day 2/Week 2 107/01/2003 006 00530 Total Suspended Solids 2/Week 2 007/01/2003 006 00610 Nitrogen, Ammonia (NH3 2/Week 2 007/01/2003 006 80082 C800 5 day 2/Week 2 007/01/2003 006 00400 pH 1/Week 1 008/01/2002 006 00530 Total Suspended Solids 2/Week 2 108/01/2002 006 00610 Nitrogen, Ammonia (NH3 2/Week 2 108/01/2002 006 80082 - CSOD 5 day 2/Week 2 108/01/2002 005 00530 Total Suspended Solids 2/Week 2 108/01/2002 005 00610 Nitrogen Ammonia (NH3 2/Week 2 108/01/2002 005 80082 CBOD 5 day 2/Week 2 108/01/2002 004 00530 Total Suspended Solids 2/Week 2 108/01/2002 004 00610 Nitrogen, Ammonia (NH3 2/Week 2 108/01/2002 004 - 80082 CBOD 5 day 2/Week 2 108/22/2003 003 00530 Total Suspended Solids 2/Week 2 108/01/2002 003 00530 Total Suspended Solids 2/Week - 2 1 -08/01/2002 003 00610 Nitrogen, Ammonia (NH3 2/Week - 2 1

08/01/2002 003 80082 CBOD 5 day 2/Week 2 108/01/2005 008 00610 Nitrogen, Ammonia (NH3 1/Quarter 1 008/01/2005 008 00665 Phosphorus, Total (P) 1/Quarter 1 008/01/2005 005 00610 Nitrogen, Ammonia (NH3 1/Quarter 1 008/01/2005 005 00665 Phosphorus, Total (P) 1/Quarter 1 009/08/2005 005 00530 Total Suspended Solids 2/Week 2 109/08/2005 005 80082 CBOD S day 2/Week 2 106101/2004 003 00530 Total Suspended Solids 2/Week 2 006/08/2004 003 00530 Total Suspended Solids 2/Week 2 005/15/2004 003 00530 Total Suspended Solids 2/Week 2 005/22/2004 003 00530 Total Suspended Solids 2/Week 2 106/01/2004 003 50050 Flow Rate 1/Day I C06/02/2004 003 50050 Flow Rate 1/Day 1 006/03/2004 -003 50050 Flow Rate 1/Day 1 006/04/2004 003 50050 Flow Rate 1/Day 1 0
• 06/05/2004 003 50050 Flow Rate •:. 1/Day 1 006/06/2004 003 50050 Flow Rate 1/Day 1 006/07/2004 003 50050 Flow Rate 1/Day 1 006/08/2004 003 50050 - Flow Rate 1/Day 1 006/09/2004 003 50050 Flow Rate 1/Day 1 006/10/2004 003 50050 Flow Rate 1/Day 1 006/11/2004 003 50050 Flow Rate 1/Day 1 006/12/2004 003 50050 How Rate 1/Day 1 006113/2004 003 50050 Flow Rate 1/Day 1 006/14/2004 003 50050 Flow Rate 1/Day 1 006/15/2004 003 50050 Flow Rate 1/Day 1 006116/2004 003 50050 Flow Rate 1/Day 1 006/1712004 003 50050 Flow Rate 1/Day 1 006/18/2004 003 50050 Flow Rate 1/Day 1 006119/2004 003 1 50050 Flow Rate 1/Day 1 006/20/2004 003 50050 Flow Rate 1/Day 1 005/21/2004 003 50050 Flow Rate 1/Day 1 006/22/2004 003 50050 Flow Rate 1/Day 1 006/23/2004 003 50050 Flow Rate 1/Day 1 006/24/2004 003 50050 Flow Rate 1/Day 1 006/25/ 2004 003 50050 Flow Rate 1/Day 1 006/25/2004 003 50050 Flow Rate 1/Day 1 006/27/2004 003 50050 FlowRate 1/Day 1 006/01/2004 003 80082 CBOD S day 2/Week 2 006/08/2004 003 80082 CBOD S day 2/Week 2 006/15/2004 003 80082 CBOD 5 day 2/Week 2 006/22/2004 003 80082 CBOD S day 2/Week 2 106/01/2004 003 00400 pH 1/ Week 1 006/08/2004 003 00400 pH 1/Week 1 006/15/2004 003 00400 pH 1/ Week 1 008/01/2005 003 00610 Nitrogen, Ammonia (NH3 1/Quarter 1 008/01/2005 003 00665 Phosphorus, Total (P) 1/Quarter 1 0

09/08/2005 003 00530 Total Suspended Solids 2/Week 2 109/08/2005 003 80082 CBOD S day 2/Week 2 110/08/2004 004 00530 Total Suspended Solids 21 Week 2 110/0812004004 80082 CBDD Sday 2/Week 2 108/01/2005 004 00510 Nitrogen, Ammonia (NH3 1/Quarter 1 008/01/2005 004 1 00665 Phosphorus, Total (P) 1/Quarter 1 009/08/2005 004 00530 Total Suspended Solids 2/Week 2 109/08/2005 004 80082 CBOD 5 day 2/Week 2 108/01/2005 006 00610 Nitrogen, Ammonia (NH3 1/Quarter 1 008/01/2005 006 00665 Phosphorus, Total (P) 1/Quarter 1 008/01/2005 007 00610 Nitrogen, Ammonia (NH3 1/Quarter 1 008/01/2005 007 00665 Phosphorus, Total (1') 1/Quarter 1 008/08/2004 009 80082 CBOD 5 day 2/Week 2 108/01/2005 009 00610 Nitrogen, Ammonia (NH3 1/Quarter 1 008/01/2005 009 00665 Phosphorus, Total (P) 1/Quarter 1 005/22/2004 001 00530 Total Suspended Solids 2/Week 2 106/22/2004 001 00610 Nitrogen, Ammonia (NH3 2/Week 2 106/22/2004 001 80082 CBOD 5 day 2/Week 2 106/22/2004 001 50060 Chlorine, Total Residu 2/Week 2 108/22/2004 001 50060 Chlorine, Total Residu 2/Week 2 111/22/2004 001 00530 Total Suspended Solids 2/Week 2 111/22/2004 001 00530 Total Suspended Solids 2/Week 2 111/22/2004 001 00530 Total Suspended Solids 2/Week 2 111/22/2004 001 00530 - Total Suspended Solids 2/Week 2 111/22/2004 001 00610 Nitrogen, Ammonia (NH3 2/Week 2 111/22/2004 001 80082 CBOD 5 day 2/Week 2 111/22/2004 001 80082 CBOD S day 2/Week 2 111/22/2004 001 80082 CBOD 5 day 2/Week 2 111/22/2004 001 80082 CBOD S day 2/Week 2 102/22/2005 001 00530 Total Suspended Solids 2/Week 2 102/22/2005 001 00530 Total Suspended Solids 2/Week 2 102/22/2005 001 00530 Total Suspended Solids 2/Week 2 102/22/2005 001 00530 Total Suspended Solids 2/Week 2 102/22/2005 001 00610 Nitrogen, Ammonia (NH3 2/Week 2 102/22/2005 001 80082 CBOD Sday 2/Week 2 102/22/2005 001 80082 CBOD Sday 2/Week 2 102/22/2005 001 80082 CBOD 5 day 2/Week 2 102/22/2005 001 80082 - CBOD 5day 2/Week 2 103/01/2005 001 01220 Chromium, Dissolved He 1/Quarter 1 003/01/2005 001 00515 Residue, Total Dissolv 1/Quarter 1 003/01/2005 001 01082 Strontium, Total (Sr) 1/Quarter 1 007/01/2005 001 01330 Odor, Severity 1/Day 1 0 -07/02/2005 001 01330 Odor, Severity 1/Day 1 007/03/2005 001 01330 Odor, Severity 1/Day 1 007/04/2005 001 01330 Odor, Severity 1/Day 1 007/05/2005 001 01330 Odor, Severity 1/Day, 1 007/06/2005 001 01330 Odor, Severity 1/Day I 1 0
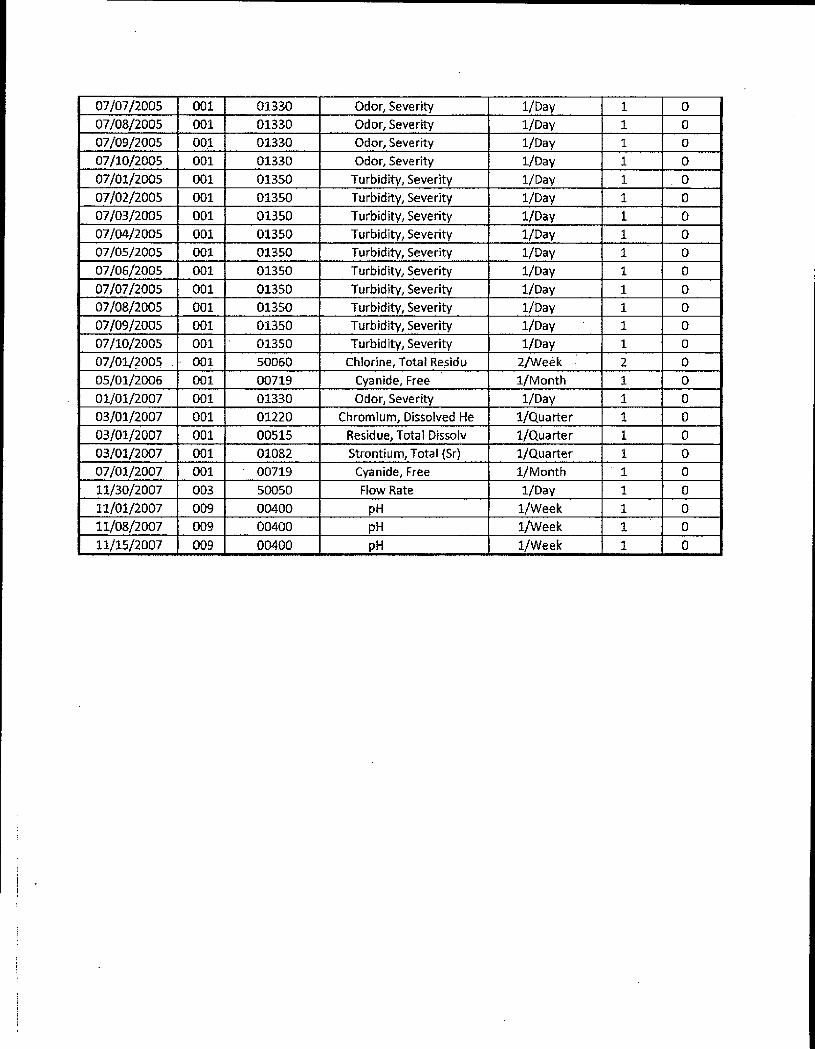
07/07/2005 001 01330 Odor, Severity 1/Day 1 007/08/2005 001 01330 Odor, Severity 1/Day 1 007/09/2005 00.1 01330 Odor, Severity 1/Day 1 007/10/2005 001 01330 Odor, Severity 1/Day 1 0 -07/01/2005 001 01350 Turbidity, Severity 1/Day 1 007/02/2005 001 01350 Turbidity, Severity 1/Day 1 007/03/2005 001 01350 Turbidity, Severity 1/Day 1 007/04/2005 001 01350 Turbidity, Severity 1/Day 1 007/05/2005 001 01350 Turbidity, Severity 1/Day I 007106/2005 001 01350 Turbidity, Severity 1/Day 1 007/07/2005 001 01350 Turbidity, Severity 1/Day 1 007/08/2005 001 01350 Turbidity, Severity 1/Day 1 007/09/2005 001 01350 Turbidity, Severity 1/Day . 1 007/10/2005 001 01350 Turbidity, Severity 1/Day 1 007/01/2005 001 50060 Chlorine, Total Residu 2/Week 2 005/01/2005 001 00719 Cyanide, Free 1/Month 1 001/01/2007 001 01330 -- Odor, Severity 1/Day -- 1 003/01/2007 001 01220 Chromium, Dissolved He 1/Quarter 1 003/01/2007 001 00515 Residue, Total Dissolv 1/Quarter 1 003/01/2007 001 01082 Strontium, Total (Sr) 1/Quarter 1 007/01/2007 001 00719 Cyanide, Free 1/Month 1 011/30/2007 003 50050 Flow Rate 1/Day 1 011/01/2007 009 00400 pH 1/ Week 1 C)11/0812007 009 00400 pH 1/Week 1 011/15/2007 009 00400 pH 1/Week 1 0

Attachment 11

ciciiuiChlorideFluorideMa umSCKUUMo:a iu
SulfateTotal AlkalinityTh1a1 HadesOther MjneraLe
Irm1nminum -
CaltVanadium
x1bLt 7LC(4 exceadaiie af 1it
rup E Pollutants-.1Ci.4 -
Oçgn Deixidfli.h€iica1 Oxygen flriamdChthia1 oxygR3i DemandTøtal Oxygen DemandnThta]. Organic Carbon.
So1idTotal Suspended SalidaMvntduemlTotal Pizaolved aoUOther
inorganir- phopphoruo Componnovinorganic Nitrogen Ci>trndOther
D0t,drg=tr, a4•MRASNAOil az4 xeiaQtber detergento o iCidea
• -- 120 excdanee of Unit)
Gro tI P ta1Lts1-C1 2
• etal (eli fo - - -Other rnetal3 zot spec&ici1y listed urzdei Group I
Cyamidarogac
Total Residual chlorin
All cnaniCa are tOp II ec?pt the specificaly listedunder Gto-up 13

Attachment III

590-1
NATURAL RESOURCES CONSERVATION SERVICECONSERVATION PRACTICE STANDARD
NUTRIENT MANAGEMENT(Ac.)
CODE 590
DEFINITION
Managing the amount (rate), source, placement (method of application), and timing of plant nutrients andsoil amendments.
PURPOSE
• To budget, supply, and conserve nutrients for plant production.
• To minimize agricultural noripoint source pollution of surface and groundwater resources.
• To properly utilize oommorcial fertilizer, manure andor organic by-products as a plant nutrientresource or soil amendment.
• To proteet air quality by reduoin-eders, nitrogen emieciono (ammonia, oridee of nitrogen), arid theformation of atmosphcrio particulatec.
• To maintain or improve the physical, chemical, and biological condition of soil.
CONDITIONS WHERE PRACTICE APPLIES
This practice applies to all lands where plant nutrients and soil amendments are applied.
CRITERIA
General Criteria Applicable to All Purposes
All Nutrients:
Plans for nutrient management are to comply with all applieale- Federal, state, aiid local lawsand rcguIation& A nutrient budget for nitrogen, phosphorus, and potassium must be developedthat considers all potential sources of nutrients including, but not limited to, green manure,legumes, crop residues, compost, animal manure, organic by-products, biosolids, waste water,organic matter, soil biological activity, commercial fertilizer, and irrigation water.
For nutrient risR-assessment policy arid-precedures see Title 100, Gerieral Manual (GM), Part402, Nutrient Management, and flIp 190, National Instruction (NI), Part 392, NutrientManagement Policy Implementation. The Nitrogen and Pheephorous Tmneport R4ok AsnocamentPr000duoc ic attached as Appendix I.
To avoid salt damage, -tho rate and placement of applied nitrogen and potassium in sta49cfertilizer must be conoistent with the T-F i State-Fertility-Guide recommendations, or mdi trypractice.
Conservation practice standards are reviewed periodically and updated if needed. To NRCS Ohioobtain the current version of this standard, contact your Natural ResourcesConservation Service State Office or visit the Field Office Technical Guide. August 2012
590-2
1FJj Pill iirsiiiirwiiri ul u
The Phosphorous Index Risk Assessment Procedure (P-Risk Index) or Soil Test RiskAssessment Procedure (STRAP) must be completed when:
• Soil Test Phosphorus (STP) levels exceed the maintenance limit in the Tr i-State FertilityGuide (Extension Bulletin E-2567) for the planned crop and/or the planned phosphorusapplication rate exceeds recommended rates. (There is no agronomic reason to applynutrients when soil tests are above the maintenance plateau level)
See Appendix I at the end of this standard for an explanation of the Ohio NRCS Risk AssessmentProcedures.
A phosphorus risk assessment will not be required for fields that have a documented agronomicneed for phosphorus based on soil test phosphorus (STP) level and the Tri-State Fertility Guide(Extension Bulletin E-2567) nutrient recommendations. On organic operations, the nutrientsources and management must be consistent with the USDA's National Organic Program andmeet the requirements of this practice standard.
Areas contained within minimum application setbacks (e.g., sinkholes, wellheads, gullies, ditches,or surface inlets) must receive nutrients consistent with the setback restrictions. (See Table 4Minimum Setback Distances for the Application of Manure and other Organic By-Products at theend of this standard for setback).
Applications of irrigation water must minimize the risk of nutrient loss to surface and groundwater.
Soil pH must be maintained in a range that enhances an adequate level for crop nutrientavailability and utilization. Refer to the Tri-State Fertility Guide or the Ohio Agronomy Guide forguidance.
Commorcial Fertilizer:don-I.'-' .TV ,, •2Z3WV
I tUUL 1LJ!1l -
ETTMI
*1P4 *rl!jbl1n LIJ
-.w -
P*1L!IJ1 ILIIII '
Soil, Manure, and Tissue Sampling and Laboratory Analyses (Testing):All Nutrients:Nutrient planning must be based on current soil, manure, and (where used as supplementalinformation) tissue test results developed in accordance with The Ohio State University guidance,or industry practice, if recognized by the university.
Current soil tests are those that are no older than 3 years or as required by State code or atshorter intervals if nutrient applications and crop yields are sufficiently variable to make nutrientstatus levels difficult to predict.
August 2012NRCS, Ohio
590-3
Soil samples for soil tests should represent 25 acres or less. Soil sampling depth for P and Kshall be 6-8 inches. Under no till conditions pH should be tested at a depth of 4 inches or less.
For precision nutrient magem-entpIans, soil samples for soil totc cheld represent 12 acres orloss for a zone-management system and 6 ocr-es or less for grid sampling. Whe-a-oeprecision nutrient management plan is being developed, soil fertility, so' ! types, cropping history,and crop managomont practoes should be takon-into oonciieration when delineating the zeRes.
Soil tests taken soon after nutrient application may produce high (inaccurate) nutrient results.
The soil and tissue tests must include analyses pertinent to monitoring or amending the annualnutrient budget, e.g., pH, electrical conductivity (EC) and sodicity (where salts are a concern), soilorganic matter, phosphorus, potassium, calcium, magnesium, and CEC and other nutrients wherethey are known to be crop limiting and test for nitrogen where applicable. Follow The Ohio StateUniversity guidelines regarding required sampling procedures and test methodology.
Soil samples shall be collected and prepared according to The Ohio State University guidance orstandard industry practice. Soil test analyses shall be performed by laboratories that can providethe North Central Region 13 (NCR 13) method of testing. (NCR 13 specifies extraction methodsappropriate for the Midwest conditions). Laboratories must successfully meet the requirementsand performance standards of the North American Proficiency Testing Program-PerformanceAssessment Program (NAPT-PAP) under the auspices of the Soil Science Society of America(SSSA) and NRCS.
Manure:
Nutrient values of manure, organic by-products and biosolids must be determined prior to landapplication.
Manure, organic by-products and bio-solids analyses must include, at minimum, total nitrogen(N), ammonium N, nitrate N, total phosphorus (P) as P205 , total potassium (K) as 1<20, andpercent solids, or follow The Ohio State University guidance regarding required analyses.
The uce of manure as a nutrient source is to bo- based -on at least one annual analysis of thematerial in storage pr i or to appileation. Manure, organic by products, and biosoli4s-samplocmust be ool1e6ted and analyzed at least annually from oasi-soparato storage facility, or morefrequently if needed to account for opor.atienal changes (feed management, animal type, manurehandling strategy, etc.) impaothg morure nutrient concentrations. If no operati€øaI changesoccur, Iess-keguont manure testing is allowable whore operations pan-document a stable level ofnutrient concentrations for the pr000diAg thro p consecutive years, unless federal, State, OF-lesalregulations require more froguoF4405ting Samples must be collected, prepared, storo€I, anshipped, following test ing 4ab-sampl ing requirements, The Ohio State WRiYeFs ity guidance oririductry practice-
When planning-fe-esw-or modified livotook operations manure nutF ieRt values can be obtainedfrom acooptahic "book aIues" recognized by the NRCS (e.g., NR--AgrieiMtural WasteManagement F-ietd-Hendbook), the Ohio Livestock Manuo Managomont guide (bulletin 601 06),or the Midwest-Plan Ser.'ioeif manure from the existing oporetion is not availab'e-. Analysesfrom similar operations in -the geographical area may be used if they ascwately-represent nutrientoutput storage and-tFeatmont-methods of the proposed epeFatieR.
Manuro testing analyses must be performed by laeratories successfully mooting therequirements and peeraoo standards of the Manure Testing Lb€watory Cortitloation program(MTLCP) under the auspices of the Minnesota Dopartesnt of Ariou1ture, or other NRCSapproved program that considers laborate-porformance and proficiency to assure accuratemanure test results.
NRCS, OhioAugust 2012

590-4
Nutrient Application Rates:
All Nutrients:
At a minimum, determination of nutrient application rate must be based on current soil testresults, a cropping sequence, and realistic yield goals utilizing the recommendations from the Tri-State Fertility Guide. If nutrients from manure areapp lied i n exress of agronomic neod--anNRQ5- approved nutrient risk assos&montc must be completed.
Realistic yield goals must be established based on a combination of the following,., historicalyield data (specific farm or county data if specific farm data is not available), soil productivityinformation, climatic conditions, nutrient test results, level of management, future managementconsiderations, and local research results considering comparable production conditions asavailable. Applications of all sources of nutrients, including biosolids, starter fertilizers, or pop-upfertilizers must be accounted for in the nutrient budget.
Estimates of yield response must consider factors such as poor soil quality, drainage, pH, salinity,etc., before recommendations of adequate levels of nitrogen and/or phosphorus can beestablished.
For new crops or varieties, other land grant universities, industry- demonstrated yield, andnutrient utilization information may be used until The Ohio State University information isavailable.
Develop nutrient draw-down strategies when the phosphorus risk assessment proceduresindicate a very high risk of transport. In addition to not applying additional nutrients, draw-downstrategies may include changing the rotation to crops having higher nutrient demands, removal ofcrop biomass (e.g. straw or hay), and utilizing harvested cover crops to remove nutrients from thesystem.
Lower-than-recommended nutrient application rates are permissible if the grower's objectives aremet. Participation in an Adaptive Nutrient Management on-farm trial is a good way to helpachieve yield goals while minimizing nutrient application.
Maximum Allowable Nutrient Application Rates:The maximum allowable rate of nutrient application are to be determined based on the following:
Phosphate (P 205), and potash (K20) application rates are to follow the recommended rates inthe Tri-State Fertility Guide (Extension Bulletin E-2567.-[See--Manure" section below in forlivestovk operations that produoo mre nutrients (manure) than can be utilizod by oropc.Excess potash is not to be applied in situations in which it causes unacceptable nutrientimbalances in crops or forages.
Nitrogen rates Will be based on the economic threshold models developed by PurdueUniversity or The Ohio State University. Adjust N rates for contributions from previous crops(legumes or forages), and soil organic matter.
Applications of phosphate (P20), and potash (K20) via fertilizer, manure, or other organic by-products can be made for multiple years of the rotation as long as
• no more than 500 Lbs/ac of potash (K 20) are applied in any one year.
• no more than 250 Lbs/ac of (P205) are applied in any one year.
NOTE: In cases where liquid manure exceeds 60 Lbs P205 per 1000 gallons or solidmanure exceeds 80 Lbs P205 per ton the P205 rates can be increased up to a maximum of500 Lbs P205 /acre as long as nitrogen rates for the next crop are not exceeded nor theannual limit for K20 of 500 Lbs/acre.
NRCS, OhioAugust 2012
590-5
C am- mercual-Fortilizer:
PlanRed nutrient application rates for phospherus and potassium must not exceed -the TF b StateFertility Guide recommondationa-. Nitrogen rates will bo baood on the economic threshold modelsdeveloped by Puduo University or The Ohio State Jnivoicity
When applying fertilizer, the phosphon&-application rate can account for multiple years in thecrop rotation in one application. When such applications are made-the rate must not exceed:
• the acceptable phosphorus risk assecs-ont criteria• and rio additional phosphorus may be in the current year or any additional years
for which the &iRglo application of phosphorus is supplying nutrients.
M:inuro:
Appliotion rates for manure are to be based on the mostlimiting factor of nutrient GGnteRt1volume/woght limitation of the material.
When applying manure, the phosphorus application rate can account for multiple years in thecrop rotation in one application. When such applications are rriado, the rate must not exceed:
• the acceptable phephoruc risk assessment criteria• the recommended nitrogen application iato fai-tho current-crop• and no additional phosphorus-may be applied-in The current year or any additional yeas
for which the single application of phosphorus is supplying nutrients.
Planned nutrient applioation rates for phoopheruc and potassium should not exceed the Tri StateFertility Gu i de reoommorieations. For livestock operations that produce more nutr-ienits (manure)than can be utilized by crops and nutrient planned application rates exceed TF F State FertilityGuide recommendations, an A I RS- approved nutrient risk assessment must be completed priorto nutrient application. Nutrient application beyond agronomio flood should be viewed as a shortterm-solution and other alternatives-such as roduoing-nutrients in the manure arid/or doveopingmanure markoting strategies -should be strongly considered.
For fields receiving manure, where phosphorus risk-asaccomont results equate to:
LOW RISK:
Additional -phacphorus son be applied at rates greater than ofop-Foquiromont not toexceed the nitrogen requirement for the succeeding crop
MODERATE RISK:---.-'.--y-,--, _.-• --.-'.,.-_,
H I GH -PdSK
Additional phosphorus May b@ applied at phosphorus prop removal rates if the followiRgrequirements- am met:
• there-is-Ieee than-a 50% chance of rainfall of more -then inch -within 24 hours.• a long term soil phosphorus dFawdewFi stratogy has been implemented, and• a-site assessment for nutrients and sell-less hog boon- conducted to dotormino if
mitigation praotiocc-aro-rcquired to protect water quality.Any deviation from these high risk requirements must have the approval of the Chief ofthe NRCS
NRCS, OhioAugust 2012
590-6
..,P W1..
MI
..
1iwrI iiiii . i.iin
Additional Cfitena for Li quid Manure:For liquid rnanuro, the appli€ation -rate is to be adjusted to the mast limiting factor to avedpending, surfaoe runoff, subsurface drainage (tile) discharge, the nutrient noede-af-the field, orthe nitraen or phosphoi-us nokci for-the field. The total application is riot to exceed the fieldcapacity of the uppo-a-inches of coil. See Table 1. oI-thi€-standard (Available Water Capa6ity(AWC) P-ractioal Soil Moisture Interpretations fer Various Soils Textures and Conditions toDetermine Liquid MOrIUFO Volume Applications not to exceed AWC) to determine AWC and theamount (volume) that can be applied to reach the AWC. The actual application rate shall b-sadjusted during application to avo id-pending or runoff. Bare/Crusted-soils may require cornsti llage to improve infiltration. So p Table 3, of this standard, (Determining The Most LimitingManure Applisatien Rates) to determine the most lim iting application rate factor base OR the fieldcondition and site Iimitafiono.
Additional Criteria for Nitro gen Application via Manure, Organic By-Products, and biosolids(during Summer and Fall Periods):On fields with a 'High Nitrogen Leaching Potential (rating more than 10) and with no growing
manure and other organic by-products application is to be limited to 50 Lbs/ac of Nitrogen(Ammonium N + 1/3 of the Organic N) calculated at the time of application from June to October
to limit nitrogen leaching. When a grass or legume cover crop is growing or establishedimmediately after manure application, monuro or -other organic by-products can be applied priorto October 1 at the recommended Nitrogen rate for the next non-legume crop or the nitrogenremoval rate for the next legume (maximum 150 Lbs/ac) crop
Nutrient Sources:
All Nutrients:
Nutrient sources utilized must be compatible with the application timing, tillage and plantingsystem, soil properties, crop, crop rotation, soil organic content, and local climate to minimize riskto the environment.
Nutrient Application Timing and Placement:
All Nutrients:
Timing and placement of all nutrients must correspond as closely as practical with plant nutrientuptake (utilization by crops or cover crops), and consider nutrient source, cropping systemlimitations, soil properties, weather conditions, drainage system, soil biology, and nutrient riskassessment results.
Nutrients from any source must not be surface-applied if nutrient losses offsite are likely.This precludes spreading on:• Frozen and/or snow-covered soils
and not• When the top 2 inches of soil are saturated from rainfall or snow melt.• When there is a greater than 50% chance of rainfall of more than 1/2 inch within 24 hours.
NRCS, Ohio
August 2012
590-7
Manure:
rMl111Jwu.L 1Mi iiiraii ITfl(Tt1flflI1U41WUU,W -
Additionp Critenp for Fields Prone to Flooding:Agricultural rnonuro is not to be Ind applied on oil€ that are frequent l y fkodod, as defined bytho-Nofional Cooperative Soil Survey (or in the Flooding Froguonoy-Seil List posted in Section IIeFOTG), during the period when flooding ic oe61ed unless incorporated imrnodla4el
Iarrlp flI,.,, lrs-pn-sn-crl•I---tnsre•-d!1s•sr rarr_L
JT LII I1J JJ1WI ll$ .......... ii II OII JU11t1I1'W$t14!j111i 1!I LIIOJILL AIL!iI J W!IIIPLi -
1flt4$ JJrII1W flLIMJ1IIJ 1I%UJ u1I1,i1I4 PIilklINIU[1JPAII .*4t i1i'thJi1Lwrrj.......
--
I 1l1I1U!AUT-HA tlfl i1TS?$iJ1Jiijrt 1JJ irL1JxJjwkr u*a it nrr
- I*iiIItIU . -
LJJIJ'!fl rI IU14RI1ItI[II1 JJj1flhIj j 9)iiin 11III!l Ui MLILIV i inu I IiFJi1.i1 iri NJME1!PU1 lL (11Ufl 1 *V1iIJ1JI Th111L
iLl k$A PthL fluff 1i1l JLIMI!fl1rriL'ErP1L1.....
. ...... fl!1 lJU i fl1 JJJJ rlJjjjIIIB 11 L]1llJ 1IAt MNMlMPJll Jill IJ1
NOWj-• rmaa.a Jaan-ac-a'-Ira,4.srar.--'. Cp.L. •tE.,-.-flJJr.
A$Ifl 1P IF - -IrIi1!! I T LI 11M1I11L1 I 11WLLJ1j11JWJI&!pit 0. Rim•__ '_•• .
..&A.Sn ,trrra-p..cara.SRGL-pn-p---.1=.
I1J II1!IItW III J Ifl!
HuIiU1ftJJL1Jl 114rJ i I UWib$11u*..H ------
IIiJ:4.iIi I'I 1JU1?411L! P !IIIIJ1U flIfrT1 It UJU TUUI 1 (It1Ia*I -.
Wfl!11I1J 1 1t TUfflh1* I!N MV I IIRMjfli t
August 2012
NRCS, Ohio

590-8
Adc1iional Critorici for Surface Drained Fiolds:Fields or areas of fields that hovo .systomatic 26ugaGe drainage" systems (e.g.-- shalJw surfacedrains spaced 100 200 feet apart NRCS Practice-Code 507). These "internal" surface drainsare considered concentrated flow areas. Howovo, 4-specol--precautione are taken, manure canbe applied in the surface drains with minimal risk of surface runoff. THIS DOES -NQT APPLY TOTHE COLLECTOR SURFACE DRAINS (mains) OR DRA I NS -BORDER1NG THE FIELDS. Thefollowing special manure application techniques sha ll be used:a. Limit LIQUID application fates to 13,000 gallons per aco or 1666 per application.Ia. l.1anure is applied to a growing cover oropo If the field is not ostablithod in a growing-cover crop, till the surface at least 3 to 5-nohes
deep prior to liquid manure surface application. For SOLID manure incorporate within 24hours. This can be done with a hoavj-diok, chisel-plow, plow, field cultivator, AERWAY tool,or similar tool that can provide "full width"soil disturbance to a depth of 3 5-inches.
d. Surface app l y the liquid manure uniformIy-eor the entire so il surface on a growing cover cropor a freshly tilled soil.
e. For fields that have no subsurface (tile) drainage, the liquid rrranuro pan be injected directlyWith no prior tillage.
Additional Criteria for Highl' Sloping Fields:Organic nutriontc applied to oropland over 4-5% slope or to pastures/hayland over 20% slopeunless one of the following precautions is taken:a. Manure is app li edto a growing cover crop.b. If there is not a growing cover crop, imodiatp incorporation, banding, or injection with
operations done on tho contour, UNLESS the field has 50% -ground cover (rocidus and/orcanopy).
e Applications are timed during -periods of lower runoff and/or rainfall (Late May to M M 4-
d. Apply low rates through split applications (separated by rainfal-events). Apply no more than10 wet tons/acre for s8-l4rnanuro,".va9t9s- or 5000 gallons/acre for liquid m-anurolwnctoc.
e. The field is estab lishedin a no till cropping system Wih altomcito strips in grass or legume.
Setback Distances:No application of manure or organic by-products shall be made within a minimum distancesshown in Table 4 Minimum Setback Distances for the Application of Manure and Other OrganicBy Products. Those distanaoe--ay nood to be increased due to local oo-nditioRs-o.g. pond or lakeused for a water supply or roccetion aroa--or a stream that is already impaiFod--by excessnutrients, etc. Setback distances from water and drainageways etc. is measured from the top ofthe edge of the bank at field level.
Emergency o plication-cf manure to frozen and br snow covered soil-:Application on-frozen and snow covered soil is not acceptable. Howo'.'or, in an emergency, ifmanure application becomes necessary on frozen or snov: Severed soils, only limited quantities.cfmanure shall be applied to address manure storage limitations until non frozen coils -ace availablefor manure application-These situations need to be documented in- the Cernprehensive NutrientManagement Plan (CNMP) and in the produoor reoors. If winter application becomesnecessary, 3pplioations are to be applied onli ii ALL the following criteria are met:a. Application rate is limited to-40-wet tens/acre-fur solid manure more than -50%-rn oiture is and
5 wet tons-for manure less than 50% moisture. For Liquid rnanure the application rate limitedto 5990 g3lloncbacro.
b. Applications are to-bo-Made on land with at least 90% surface msidu.a-cever (e.g. growingcover crop, good qua li ty hay or pasture field, all corn grain residue-remaining after harvest, allwheat -residue cover remaining after harvest).
August 2012NRCS, Ohio

590-9
I Manuro chafl not be appl i ed -en-more than 2-oontiguouc acres Contiguou€ areac forapplication are to be ceparated by a break of at leoct 200 foot. Utilize these areas for manureoppliootion that aro furthest from -ctroam&, ditches, waterways, curfaco wator-ete-(area&-4hatprocont the boot runoff p81ontiaT-an4-aco furthoct from curfooe-watef).
III Increace the application setback distance to 200 feet 'minimum" from all grassed waterways,ourfooc droinogo ditohoc, otroamc, curlaco inlotc, water bodioc. Thi tance- May -riead tobe further-iriereased-due to local GandifieRs.
e. The rate of application sha ll not ox000d the Fates specified i-Tablo 3 Dotorrnining Tho MoctLimiting r.lonuro Application Rates for winter application.Additional winter application criteria for fioldc with cignificant clopoc more than 6% (Aloxocoding 6% are to be identified in-The CNMP). Manure choll bo appUeEI-in altematin€tnps60 to 200 foot wide generally-on the contour, or in the ease of contour strips on thealternating otripo.
Addition31- Criter 0 3 to Minimize Agricultural Nonpoint Source Pollution of SurfaGo andGroundwater
All -Nutriont&
•, ..,,IjLll 1 1U4I1&W
rLI .JIt .I
M1LirUF1ll iurI M HIII1JWiIUft11i Jill irrr14j Jij4 114 JJfk$Ji1 1 hf F!1 1I 1lll( 1)JJT II!lil]1 I
utt' initij jipkPJthJUJt-I'L 1lThJi I UJIrI4IIrrffirøSIWl*Llff T fTIii I II *IIhtIl4$i1i&
- •. ••.... ..,. ..
PULL WU W1MiJ$IJIIJII1JJU fl fl1 fj lJ LiiJ JIP1,1$J Iii i l 'riiiii p&i --
istiiuit
J..EIIL MMI- - 1J U.LU1]L..
IIk1TU1U1tV1f 1 I!WrJ J1U-- n
- L([1ffjE1i1 J1J ': ..
August 2012
NRCS, Ohio

590-10
Ackitional-Ci4eria Applicable to Properly Utilize Manure o-Organio By-Preducts as a Plant NutrientSource
Manure:
Crop production activities and nutrient use offis cy teehn gl eg m es must be coordinated to takeadvantage of rninoFaliod-plant-ava i lab l e nitrogen to minimize the potential for -nitrogen lossesdue -to-enitrific ptipn or ammonia volatilization.
Additional Criteria to-PFotoot Air Qua lity by Reducing Odors, Nitrogencsions and-thaFormation of Atmocphoric Particulates
To address air quality concerns caused- by odor, nitrogen, sulfur, and/er particulate om+&sions; thesource, lim i ng,- amount, and placement of nuthents must be adjusted to m i n i m i ze the negativeimpact of these emissions-on-the onvironment and human health. One or more of the follov.ingmay be tiscd
• slow or controlled release fcrtilizors• nitritication inhibitors• urcasc inhibitors• nutrient ontancement technologies• incorporation• injoction• stabi4iod nitrogen fertilizers• residue and tillage managomont• AG till or strip till• other toohnologios- that -rninimize the impact of these emissions
Manure:
Do not apply pouftry littor, manure, or organic by products of similar I os/density when thereis a high pFebabi li ty that wind will blow the material offsito.
Ways to -minimize the impact of odors of land--app4ied manuro include:• Making application at t imes when Iemjeratures are cool and when wind direction is away
from neighbors.• If manure is spread on warm days,do-Eon the morning.• On windy -days, odors travel shorter distances before being mixed in the atmosphore-to
the point that odor is not dotooted.• Do not oproad-on caIrn, humid days unless the field is icolatoEi=• Communicate with neighbors to-Ian applications -that do not interfere with holidays or
outdoor social functions.• Injection or immodioto incorporation will minimize odors.
Spoolal Criteria for Manure Irrigation to Mirwi3ize Odors:cT Use lower precsuo nozzloc (less than 80 psi) to reduce the aerosol effects of
fine droplets.u Uce low trajectory nozzles to reduce drift..o Use Pulse Irrigation T-ochnolog to improve infiltration.
NRCS, OhioAugust 2012

590-11
u rrw ,. ,., . .rui ri • u irII!A1All Nutriontg-
Inoorporato cover oropo into the rotatioR
Utilized reduced tilkiige-system€ €uoh as no tilkigo or -strip tulage.
Time the aplication of nutrients to avoid--periods when field aelivities wiIl-c.esiIt in soil compactionQ- r the creation of Pd
area whore salinity io a concern, select nutrient sources that minimize the buU-dip of 69il salts.
CONSIDERATIONSAll Nutrients:
Use a system of practices to sequester nutrients, increase soil organic matter, increaseaggregate stability, reduce compaction, improve infiltration, and enhance soil biological activity toimprove nutrient use efficiency.
These include:• Precision Nutrient Management (590)• Conservation Crop Rotation (328)• Residue and Tillage Management (329, 345, or 346)• Controlled Traffic Farming (720)• Cover Crop (340)• Critical Area Planting (342)• Grassed Waterway (412)• Filter Strips/Areas (393)• Conservation Cover (327)1 Filter Recharge Areas (FSA CP1 and CP2)• Diversion (362)• Riparian Herbaceous Cover (390)• Riparian Forest Buffer (391)• Constructed Wetlands (656)1 Wetland Restoration (657) 1 Wetland Creation (658)• Drainage Water Management (554)• Structure for Water Control (587)• Bio-Reactors and Tile Discharge Filters
Consider application methods and timing that reduce the risk of nutrients being transported toground and surface waters, or into the atmosphere. Suggestions include:
a. Split applications of nitrogen to provide nutrients at the times of maximum crop utilization.b. Greater nitrogen efficiency for crop production and reduced leaching potential can be
obtained by applying the most of the recommended nitrogen rate for full season springplanted crops as a sidedress application.
c. Maintain adequate levels of potassium and a balance of all crop nutrients to optimizenutrient efficiencies including nitrogen
d. Avoiding winter nutrient application for spring seeded crops.e. Band applications of phosphorus near the seed row.f. Inject or incorporate nutrients with good erosion control practices to reduce surface runoff
of nutrients, especially Phosphorus.g. Applying nutrient materials uniformly to application areas or as prescribed by precision
agricultural techniques.
NRCS, OhioAugust 2012

590-12
Use cover crops (i.e., wheat, rye, ryegrass, oats) to recycle nutrients, improve soil health andreduce soil erosion. It is critical to establish cover crops in the early fall to achieve the desiredresults.
Consider us i ng RMAGat i OR inlithitors for early spring N applications especially on poorly andsomewhat poorly drained coils.
Keep good field records of soil test results, yields achieved, and nutrients applied (time, form,rate, and method of application).
Consider annual rovie'.'c to 61949FR i ne-if ehongoc in the nutrient budget are desirable (or needed)for the next planned crop.
Perform periodic inspections of tile systems to repair blow holes, broken tile, and inlets.
On si-tee-en-which there are special environmental concerns, consider other sampling techniques.(For example: Soil profile sampling for nitrogen, Pre-Sidediess-Nitrogon Tost-(PSNT), Pro PlantSoil Nitrate Test P.PSN or coil surface sampling for phosphows accumulation OF PH ohangoc.)
Use legume crops and cover crops to provide nitrogen through biological fxoUon and nutrientrecycling.
Consider a balance of crop- nutrients for maximum efficiency. For example: -excessive levels ofsomo nutrients con pause induced deficiencies of other nutrtent, e.g., high coil-test phosphorusl eyels r7aR-rcsuft4n-inc-dcfi6icncy in corn.
Workers should be proteeted from and ave-id unnesoccary contpct with plant--nutrient-souroos.Extra caution must be taken when handling anhydrous ammonia or when dealing with organiemanure stored in unvec4ilated-onolosure&.
Use the adaptive nutrient management learning process-to improve nutriont u&o-cffioiency onfacmc-.as-outlined--in the -NRCS' National Nutrient Policy in GM 190, Part 402, NutrientMo rio om nt.
Material generated from cleaning nutrient application equipment should beutlIi-e4n-anonvironmontally cafe mannor—Exoss-matorial should be oollootod and stored for approveddcpocol method or field applied in an appropr iate manner.
Nutrient containers should be rooyclod in compliance with State and -losal guirlolinoc orregulations.
Manure:
Apply a minimum of 1 2 dry tono/aorefyear of manure-, organic -by prodcts--er-biesolidc tosupplement low biomass producing crops (coybeanc, corn Silage, -€anela- €vnfloworc, otc.) orenhance coil tilth after high biomacs crops.
If injection is desired consider using straight points and spaced closer ( 30 inches, 10 4-5-inch-ecwould bo better) to roduoc the -volume of liquid manure coming out of 000h knife point (or a disktype implement with a distribution- manifeldfer eveR-4is4bution-aoross . the swath). This helps toroduoo the volume that can roach the preferential flow channels. If injection is used, it should-onlybe deep enough to oovor !he manure With coiL
The pathogonc and other pathogonlo-organisms may be contained in manure and should beutilizod in a manner-that minimizes their exposure to animals and humans.
NRCS, OhioAugust 2012

590-13
It is preferable to apply manure on pastures and hayland soon after cutting or grazing before regrowth has-occurred. Also, limit the -application rate to avoid colt damage and/or coverage to thepasture and hayland.
When fioldc are not 93 1 IiIPd fGF FRaRUFe-applicatlon-duo to weather, crop, or coil conditions, fieldstock piling of manure may provide an option to move manure to fields for later applEcalion- whenthe manure can-bc applied under more ouitabio and lower rick situations. Utilize the Ohio NRCS63-1Waste Transfer Manure- Stockpi ling Job-Sheet for-further 4nfermat+en-
The -Ohio-L-ivoctock Waste Management Guido (OSU Bullotin 604); the Ohio Irrigation Guido; andQSUAEX 7-1- and 74-: and BRA CAF9-RIesemanualisen-previde-additionaIguidelines and procedures for land application of animal manure.
A planned grazing system can substantially reduce manure to be meohanically handled andspread to reduce cost and cnvironmcntal hazards.
Avoid applying lime stabilized b iese li ds on coils with a pH 7.5.
lmmediate-ineorporation o1and app lied FnanuFe,-b-iecoIidc, er-ergamo-by-predtkete-If fields have a history of liquid manure entering the subsurface drainage system, the subsurfacedrainago-outlo She u&oug.ged-pcior toapplicatioc
Avoid applications through surface waterways and by methods that would cause nutrients to beapplied into ditches-and streams through fringe particle spreading patterns-
Consider additional application setback distances from neighbors, environmentally sensitiveareas, such as sinkholes, wells, gullies, ditches, surface inlets or rapidly permeable soil areas.
Consider the potential problems from odors associated with the land application of animal manureor other organic by-products especially when applied near or upwind of residences.
Consider nilrogon volatilization losses accociatod with the land application of animal manure.Volatilization losses can become -significant, if monure-or-other-organle-by produeto ore notimmediately incorporated into the soil after application.
Where manure nutrients are produced in excess of farm needs, develop alternate manuremanagement systems such as transporting to fie l ds ortamis-riccding additional nutrients orbrokering the-manure to others in need of the nutrients from the Mani,re.
Consider ways to modify the chemical/physical properties of the manure such as addingamendments to the manure that flocsulatc phosphorus from the liquid faction and solid /liquidseparators That will concentrate nutrients and reduce transportation costs.
Apply manure at a rate that will result in an "improving" Soil Conditioning Index (SC I) withoutexceeding acceptable iisk-ofntrogcn or phosphorus loss.
Modify animal feed d i ets to reduce the-nutrient content of manure- following guidance oontaine4inConservation Practice Standard (CPS) Code 592, Feed Management.
NRCS, OhioAugust 2012
590-14
!TF.
.. 1?TT7W ,.,1b
P11 hLLIIfl 4t* ')(r -
•!r PW51,., Urv i TT
.1fl11ILfl U PEIT11J IIllThU4Wt1 11J11U fl Ifl WIL
I--------
Considerations to Minimize Agricultural Nonpoint Source Pollution of Surface and Groundwater.
Use conservation practices that slow runoff, reduce erosion, and increase infiltration, e.g., filterstrip, contour farming, or contour buffer strips. These practices can also reduce the loss ofnitrates or soluble phosphorus.
Use application methods and timing strategies that reduce the risk of nutrient transport by groundand surface waters, such as:
• split applications of nitrogen to deliver nutrients during periods of maximum croputilization,
• banded applications of nitrogen and/or phosphorus to improve nutrient availability,• drainage water management to reduce nutrient discharge through drainage systems, and• incorporation of surface-applied manure or organic by-products if precipitation capable of
producing runoff or erosion is forecast within the time of planned application.• Use the agricultural chemical storage facility conservation practice to protect air, soil, and
water quality.• Use bioreactors, tile discharge filters and multistage drainage strategies.
Considerations to Protoet Air Quality by Reducing Nitrogen and/er Paiticul at- e Emissions to-theAtmosphere.
Avoid applying manure and othec 19Y-pFeduots upwind of inhabited areas
Use high efficiency irrigation teshnolegres. (e.g., reduced pressure drop no4ofor center pivots)to roduco the potontft1-for nutrient losses.
August 2012NRCS, Ohio

590-15
RIANS-AND SPECIFICATIONS
1------Plan6 and specifications sha ll be in keeping with this standard and sha ll describe the requirements forapplying the practise-ta ashieve its intended purpose(s), using nutrients to achieve produotionlealsand to prevent or minimize water qua lity -iepairmer,4-. Te Purdue MMP softwaFe -s the -officialsoftware to be used to develop -the nutrient management plan orC-NMP. The Purdue MMP inconjunction with the Ohio MMP templates wi ll -generate a nutrient management plan with all therequired components. For niitriont management plans that involve only-semmercial feftIireradditional p lan formats are available in: Section I -Software And -Pl pn Formats of the EFO-TG--http:/!ww ph.nro.u&qsy/fotg/Ohip oFOTG.htn -See-referenoes at the end of this chndord far seliware toassist in planning and docurnoatin-speciflcations.
Thetollowing components must be inoIued-in the nutrient management plan-
• aerial site phot graph(s)/image or site map(s), and a soil suroy mop of the site,
• soil information-Including: soil type surface -texture, pH,--rainage class, permeability, availablewater capacity, depth to water 1able--ectrictive features, and flooding andlor ponding frequency,
• location of designated sensitive areas and the associated nutrient application restrictions and&cthackc
• for manure applications, location of noarbresidenoes, or other locationswher.e humans may-bepresent on a regular basic, and any identified meteorological (e.g., prevailing winds at differenttimes of the year), or topographical influences that may affect the transport of odors to thoselosetions,
• results of approved -risk assessment tools for nitrogen, phosphorus, and-erosion-losses,
• documentation establishing that the application site presents low risk for phosphorus tFaRSPE)Ft tolocal water when phosphorus is applied in excess of crop nutrient needs.
• current and/or planned- p lant production -sequence or crop rotation,
• soil, water, compost, manure, organic by product, and plant tiocu p comple-analyses applicable totho-pla
• when sotl phosphorus levels are increasing, include a discussion of the risk associated withphosphorus accumulation-and a proposed phosphorus draw down strato
• realistic-yield goals for the crops,
• complete nutrient budget for nitrogen, phosphorus, and potassium for the plant productionsequence or crop rotation,
• listing and quantification of- all -nuti4ont-seuroes and form,
• all enhanced-efficiency fertilizer products that are planned ter-uce1
• in accordance with the T-Fi State Fertility Guide or the nitrogen -and phoopherus risk assessmenttool(s), specify the recommended nutrient applioation-oource--tiniing, amount (except forpresision/variable rate applications specify method- used to determine rato), and placement ofplant nutrients foF cash -field or management unit, and
• guidanoo for implementation, operation and maintenance, and rooerdheeping.
NRCS, OhioAugust 2012
590-16
LP4!&*L!lH IJL4J flNw JIw n'rri*jiriiir. (L l[ILIWIkL.In-'-.- - --.-'-.
................. -
W''I'll ..,. -. --...-rr...,-,..,.
• foc-AOc, a quantification of manure produood in oxce€ of crop nutrient reguiremonte, and• a long teFFA propocod irnplomontatori 'timeline for reducing coil P to levolo that
protect water quality,
Additional Conaidorationc for Procicion Nutrient Management:In addition, the following oornponont& must be includod in a pFeG m s m enivaF m ab le-cate nutrientmanagement -plorr
• Document the gee referenced field boundary and data collected that was proocceod andanalyzed as a GIS layer or layere to generate nutr-i.ont or coil amendment rocommondotione.
• Document the nutrient rocemmendatien gukiarice and recommendation oquationc used to60n':ort the 016 boco data layer or layere to a nutrient courco motoriol recommendation GIS layerOF layers.
• Document if a variable rato-nuThont or coil amendment application was made.
• Provide applioatio-r000rdo per management WHO or cc applied map within individual fieldboundarioc (or electronic reoordc) documenting courco, timing, method , and-vote of-allapplioationo that resulted -from- use -of-the procicion agrioutture procaco for nutrient or coilamendment applicationc.
• Maintain the electronic recordo of the GIS data loyaro-and nutrient apUsatierio for at Ieat 5yoarc.
NRCS, OhioAugust 2012

590-17
1 irrii -. r
LIT -
11LU1 1'U
k*' #11(111 P1S11fl!i ffiu'lr -.WVM!1$fl.
U1fIMI1Ffl ILWI III 11 I PI IW111 IjJJ T lIt I?,1G IJUfJ 1 J -
__ ! ?It!J1 1i!t..
lTr.tIJ Lilt TflMI*4VPI.1*1WPIIJr
MLhUJJ iiuitiuur JJJ ii w]j.rwJtt*1 'LW
W~10- 111 U[,rur y -IIJU
irri1*a i utoo ni ,.
1 . ReGer4s-Shal l be lef4-for a period of five years or longer (heav y metals analyses for biosolids andassociated application rates and locations ore to be maintaod rmanont1y)--an-include whenapplicable:a. Quantity of manure produced, and its appropriate analysis.b. The last 3 coil toot results.
4G7 Dates, analysis., -and -amounts of m .nure-that is land applied.d The dates and amounts of manure removod from the system due to -feeding, energy production,
OF export from the operation.a. Organic nutrien4c application -methods.f Crops grown and yields (both yield goals and measured yield).g. Other tests, ouch as determining the nutrient Gentent of the hor'ested product.h. Calibration of--application equipment (Refer to Ohio State University Foot Shoot AEX 707).i A-reeerd-of the soil moisture conditions and weather conditions (tcmpeaturo and wind diroctien-)
at the time of application.j Monitor fields during-and-after applicatieri-for runoff or subsurface drainage discharge.
- v_ PIP _, ._,
ii uiuir UilIFt ii iouii rrr
NRCS, OhioAugust 2012
590-18
.r..,.r. • TELMETIWAR r
rzrml
- ru.i • r,.vi iririiw- ..,.-
1dtUF1 UL UUJEJk' 41I'I 1liLWLUISW&tWJ Ji
WfAA-
Mn
-TEM. MTI
J IJiTlTfrr. ....,
- *IVIJn- -
..., .
I !IIr r ruri
• ...,,,. L*W tuTi rnii I4U.W-
l . JJIUL—
fti://otnoFi ne.00u . oduIo257lindox htmlrai p,i,iiurt, .try
http:lloh p lin p . pcu. p dufbO1/OO1 2.htm
http;llwww.ciapfao. orgl
Mtdwect Cover Crop6 COUI-16II
http://www.moo&mcu.odu/
NRCS, OhioAugust 2012
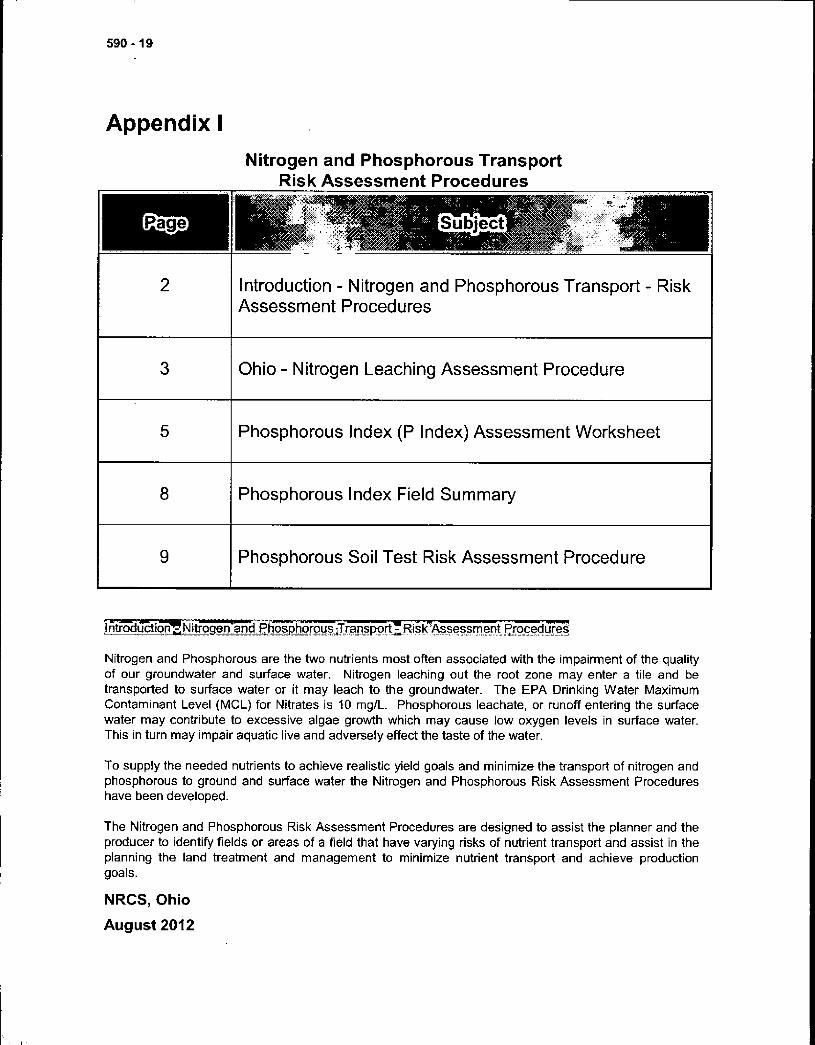
590-19
Appendix INitrogen and Phosphorous Transport
Risk Assessment Procedures
i W" . ..... ........... .. ..... ........... ........412 Introduction - Nitrogen and Phosphorous Transport - Risk
Assessment Procedures
3 Ohio - Nitrogen Leaching Assessment Procedure
5 Phosphorous Index (P Index) Assessment Worksheet
8 Phosphorous Index Field Summary
9 Phosphorous Soil Test Risk Assessment Procedure
....r,,.T...ij51Rik'A
Nitrogen and Phosphorous are the two nutrients most often associated with the impairment of the qualityof our groundwater and surface water. Nitrogen leaching out the root zone may enter a tile and betransported to surface water or it may leach to the groundwater. The EPA Drinking Water MaximumContaminant Level (MCL) for Nitrates is 10 mg/L. Phosphorous leachate, or runoff entering the surfacewater may contribute to excessive algae growth which may cause low oxygen levels in surface water.This in turn may impair aquatic live and adversely effect the taste of the water.
To supply the needed nutrients to achieve realistic yield goals and minimize the transport of nitrogen andphosphorous to ground and surface water the Nitrogen and Phosphorous Risk Assessment Procedureshave been developed.
The Nitrogen and Phosphorous Risk Assessment Procedures are designed to assist the planner and theproducer to identify fields or areas of a field that have varying risks of nutrient transport and assist in theplanning the land treatment and management to minimize nutrient transport and achieve productiongoals.
August 2012NRCS, Ohio

590-20
Nitrogen Leaching Risk Assessment
The Nitrogen Leaching index evaluates a sites risk of nitrogen leaching out of the plant root zone into tileflow or to groundwater.
The Nitrogen Leaching Index classifies soils as having a high, medium, or low nitrogen leaching potentialwith relative index ratings from 0-10+ for their potential to leach nitrates below the root zone. Theleaching potential is rated as high, medium, or low by combining the soil's hydrologic soil grouping (A, B,C, or 0), the local county's annual rainfall, and the local county's season rainfall (Oct. Ito March 1).
Phosphorous Transport Risk Assessments
Two phosphorous risk assessment options are available in Ohio for planners and producers to use toplan land treatment and management to minimize phosphorous transport and achieve production goals.The two options are (1) The Phosphorous Index and (2) the Soil Test Risk Assessment Procedure. It isthe decision of the planner and the producer as to which method is most appropriate to meet the resourceconcerns and producer objectives.
(1) Phosphorous Index (P Index) Risk Assessment ProcedureThe P Index is a procedure that combines well established factors that influence the transport ofphosphorous to surface waters. Each of the factors is evaluated based on site specific data andweighted according to its overall effect on phosphorous transport. Each of the site subvalues are addedtogether to establish an overall site rating of Low, Moderate, High, or Very High risk.
In most cases the use of the P Index will allow higher rates of phosphorous application than the Soil TestRisk Assessment Procedure. The use of the P Index should be viewed as a temporary measure untilother alternatives can be developed to utilize excess phosphorous produced on the farm.
(2) Soil Test Risk Assessment ProcedureThe Soil Test Risk Assessment Procedure establishes risk based on the soil test phosphorous level of thesoil. As soil test phosphorous levels increase, water passing over the surface more easily absorbsphosphorous and transports it in the runoff. The Soil Test Risk Assessment Procedure establishesincreasing levels of phosphorous application management as the soil test phosphorous levels increase.When soil test values for phosphorous reach Bray P1 of 150 ppm or more no additional phosphorousapplication is recommended.
The Soil Test Risk Assessment Procedure allows a more sustainable soil and water resource systembecause it establishes a maximum of 150 ppm Bray P1. By keeping soil test levels below 150 ppm BrayP1 the producer keeps more options open for future land use and treatment options. The use of the PIndex, although it may allow additional phosphorous application in the short term, will require morerestrictive land treatment and management in the future to minimize the risk of phosphorous transport.
Ohio - Nitrogen Leaching Assessment ProcedureSoils are classified as having a high, medium, or low nitrogen leaching potential with relative index ratingsfrom 0-10+ for their potential to leach nitrates below the root zone. The leaching potential is rated ashigh, medium, or low by combining the soil's hydrologic soil grouping (A, B, C, or 0), the local county'sannual rainfall, and the local county's season rainfall (Oct. 1 to March 1).
August 2012
NRCS, Ohio
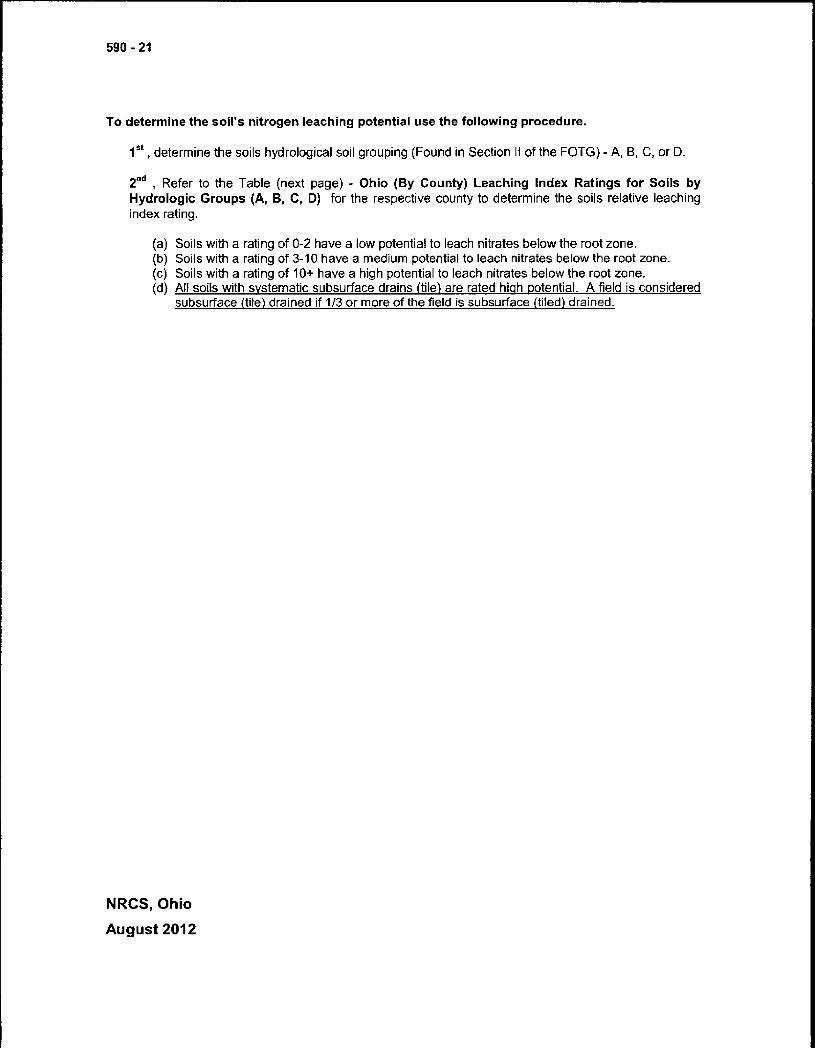
590-21
To determine the soil's nitrogen leaching potential use the following procedure.
1st , determine the soils hydrological soil grouping (Found in Section II of the FOTG) - A, B, C, or D.
2 , Refer to the Table (next page) - Ohio (By County) Leaching Index Ratings for Soils byHydrologic Groups (A, B, C, D) for the respective county to determine the soils relative leachingindex rating.
(a) Soils with a rating of 0-2 have a low potential to leach nitrates below the root zone.(b) Soils with a rating of 3-10 have a medium potential to leach nitrates below the root zone(c) Soils with a rating of 10+ have a high potential to leach nitrates below the root zone.(d) All soils with s ystematic subsurface drains (tile) are rated high potential. A field is considered
subsurface (tile) drained if 1/3 or more of the field is subsurface (tiled) drained
NRCS, OhioAugust 2012
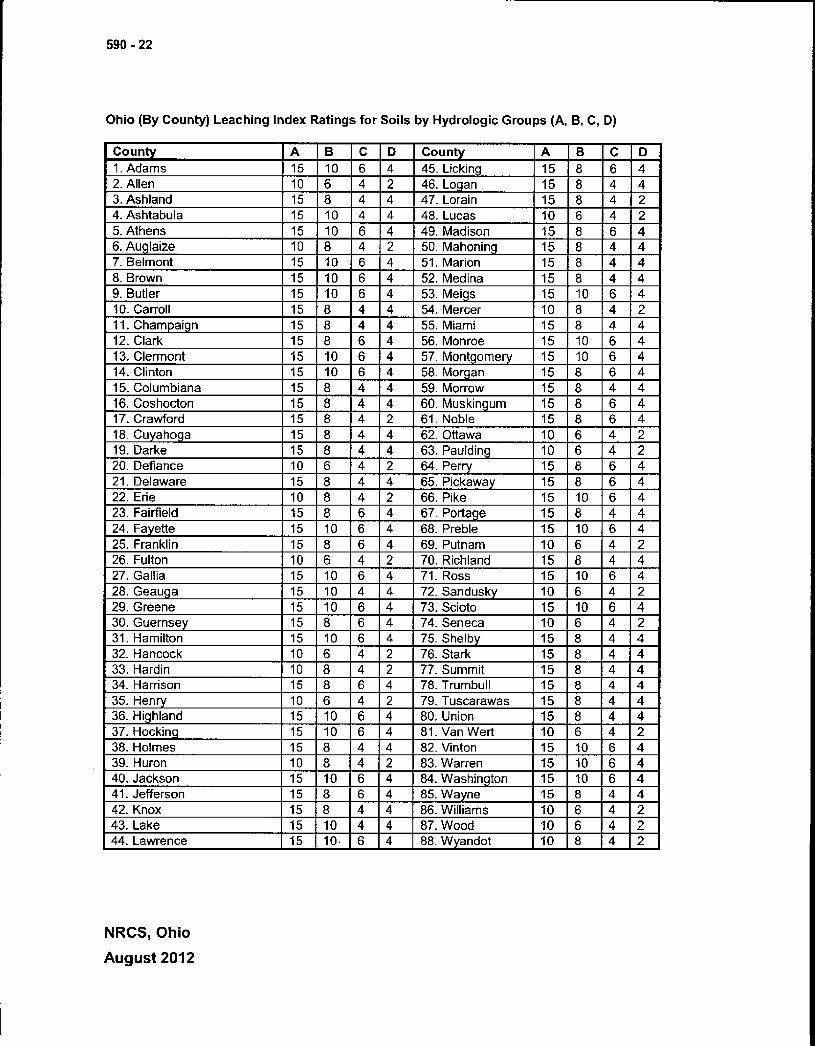
590-22
Ohio (By County) Leaching Index Ratings for Soils by Hydrologic Groups (A, B, C, D)
County A B C D County A B C 01.Adams 15 10 6 4 45. Licking 15 8 6 42. Allen 10 6 4 2 46. Logan 15 8 4 43. Ashland 15 8 4 4 47. Lorain 15 8 4 24. Ashtabula 15 10 4 4 48. Lucas 10 6 4 25. Athens 15 10 6 4 49. Madison 15 8 8 46.Auglaize 10 8 4 2 50. Mahoning 15 8 4 47. Belmont 15 10 6 4 51. Marion 15 8 4 48. Brown 15 10 6 4 52. Medina 15 8 4 49. Butler 15 10 6 4 53. Meigs 15 10 6 410.Carroll 15 8 4 4 54. Mercer 10 8 4 211.Champaign 15 8 4 14 55. Miami 15 8 4 412.Clark 15 8 6 4 56. Monroe 15 10 6 413.Clermont _15_ 10 6 4 57. Montgomery 15 10 6 414.Clinton 15 10 6 4 58. Morgan 15 8 6 415.Columbiana 15 8 4 4 59. Morrow 15 8 4 416.Coshocton _15 8 4 4 60. Muskingum 15 8 6 417.Crawford 15 8 4 2 61. Noble 15 8 6 418.Cuyahoga 15 8 4 4 62. Ottawa 10 6 4 219.Darke 15 8 4 4 1 63. Paulding 10 6 4 220. Defiance 10 6 4 2 64. Perry 15 8 6 421, Delaware 15 8 4 4 65. Pickaway 15 8 6 422. Erie 10 8 4 2 66. Pike 15 10 6 423. Fairfield 15 8 6 4 67. Portage 15 8 4 424. Fayette 15 10 6 4 68. Preble 15 10 6 425. Franklin 15 8 6 4 69. Putnam 10 6 4 226. Fulton 10 6 4 2 70. Richland 15 8 4 427. Gallia 15 10 6 4 71. Ross 15 10 6 428.Geauga 15 10 4 4 72- Sandusky 10 6 4 229. Greene 15 1 10 6 4 73. Scioto 15 10 6 430. Guernsey 15 8 6 4 74. Seneca 10 6 4 231. Hamilton 15 10 6 4 75. Shelby 15 8 4 432. Hancock 10 6 4 2 76. Stark 15 8 4 433. Hardin 10 8 4 2 77. Summit 15 8 4 434. Harrison 15 8 6 4 78. Trumbull 15 8 4 435. Henry 10 6 4 2 79.Tuscarawas 15 8 4 436. Highland 15 10 6 4 80. Union 15 8 4 437. Hocking 15 10 6 4 81. Van Wert 10 6 4 238. Holmes 15 8 4 4 82. Vinton 15 10 6 439. Huron 10 8 4 2 83. Warren 15 10 6 440. Jackson 15 10 6 4 84. Washington 15 10 6 441. Jefferson 15 8 6 4 85. Wayne 15 8 4 442. Knox 15 8 4 4 86. Williams 10 6 4 243. Lake 15 10 4 4 87. Wood 10 6 4 244. Lawrence 15 10 . 6 4 88.Wyandot 10 8 4 2
NRCS, OhioAugust 2012
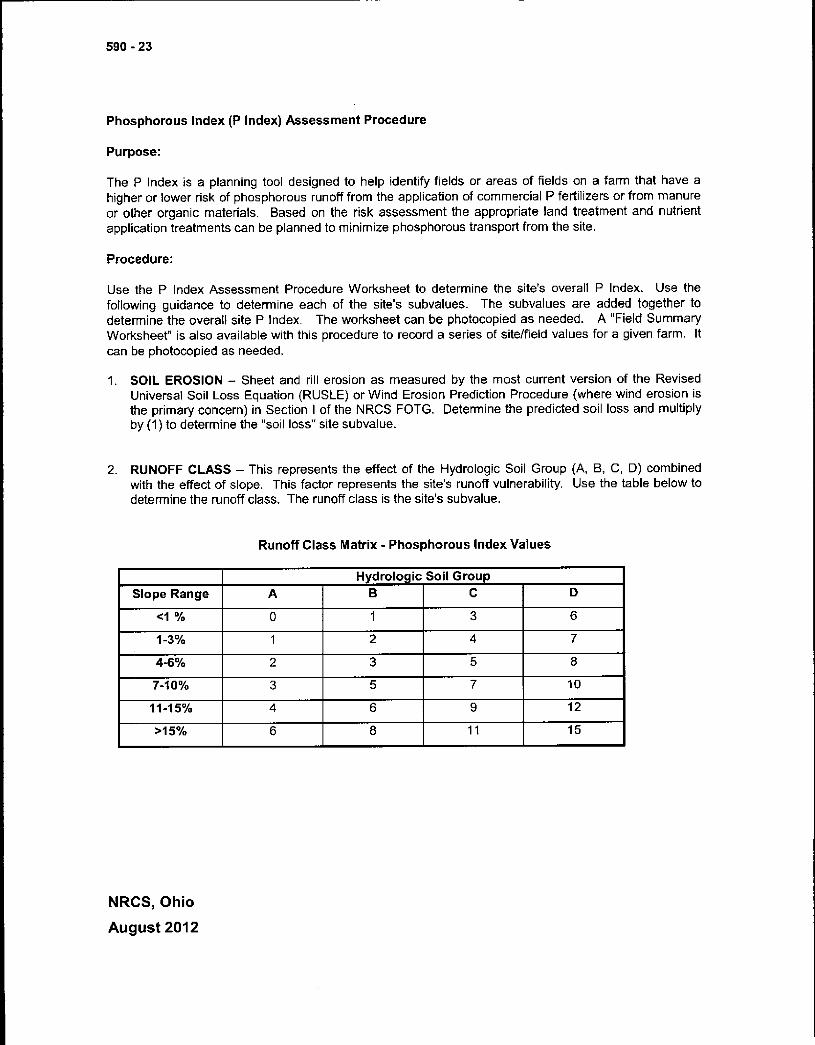
590-23
Phosphorous Index (P Index) Assessment Procedure
Purpose:
The P Index is a planning tool designed to help identify fields or areas of fields on a farm that have ahigher or lower risk of phosphorous runoff from the application of commercial P fertilizers or from manureor other organic materials Based on the risk assessment the appropriate land treatment and nutrientapplication treatments can be planned to minimize phosphorous transport from the site.
Procedure:
Use the P Index Assessment Procedure Worksheet to determine the sites overall P Index. Use thefollowing guidance to determine each of the site's subvalues. The subvalues are added together todetermine the overall site P Index. The worksheet can be photocopied as needed. A "Field SummaryWorksheet" is also available with this procedure to record a series of site/field values for a given farm. Itcan be photocopied as needed.
1. SOIL EROSION - Sheet and rill erosion as measured by the most current version of the RevisedUniversal Soil Loss Equation (RUSLE) or Wind Erosion Prediction Procedure (where wind erosion isthe primary concern) in Section I of the NRCS FOTG. Determine the predicted soil loss and multiplyby (1)to determine the "soil loss" site subvalue.
RUNOFF CLASS - This represents the effect of the Hydrologic Soil Group (A, B, C, D) combinedwith the effect of slope. This factor represents the site's runoff vulnerability. Use the table below todetermine the runoff class. The runoff class is the site's subvalue.
Runoff Class Matrix - Phosphorous Index Values
Hydrologic Soil GroupSlope Range A B C D
<1% 0 1 3 6
1-3% 1 2 4 7
4-6% 2 3 5 8
7-10% 3 5 7 10
11-15% 4 6 9 12
>15% 6 8 11 15
August 2012NRCS, Ohio
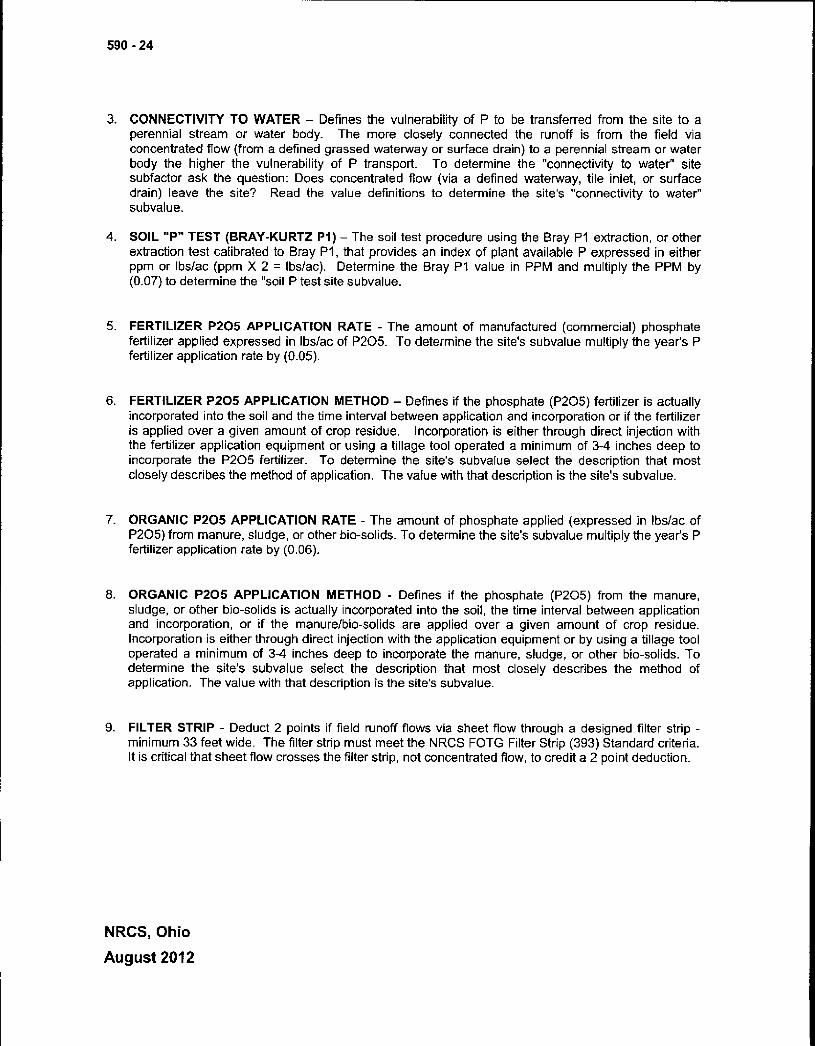
590-24
3. CONNECTIVITY TO WATER - Defines the vulnerability of P to be transferred from the site to aperennial stream or water body. The more closely connected the runoff is from the field viaconcentrated flow (from a defined grassed waterway or surface drain) to a perennial stream or waterbody the higher the vulnerability of P transport. To determine the connectivity to water" sitesubfactor ask the question: Does concentrated flow (via a defined waterway, tile inlet, or surfacedrain) leave the site? Read the value definitions to determine the sites "connectivity to water'subvalue.
4. SOIL "P" TEST (BRAY-KURTZ P1) - The soil test procedure using the Bray P1 extraction, or otherextraction test calibrated to Bray P1, that provides an index of plant available P expressed in eitherppm or lbs/ac (ppm X 2 = lbs/ac). Determine the Bray P1 value in PPM and multiply the PPM by(0.07) to determine the "soil P test site subvalue.
5. FERTILIZER P205 APPLICATION RATE - The amount of manufactured (commercial) phosphatefertilizer applied expressed in lbs/ac of P205. To determine the site's subvalue multiply the years Pfertilizer application rate by (0.05).
6. FERTILIZER P205 APPLICATION METHOD - Defines if the phosphate (P205) fertilizer is actuallyincorporated into the soil and the time interval between application and incorporation or if the fertilizeris applied over a given amount of crop residue, Incorporation is either through direct injection withthe fertilizer application equipment or using a tillage tool operated a minimum of 3-4 inches deep toincorporate the P205 fertilizer. To determine the site's subvalue select the description that mostclosely describes the method of application. The value with that description is the site's subvalue.
7. ORGANIC P205 APPLICATION RATE - The amount of phosphate applied (expressed in lbs/ac ofP205) from manure, sludge, or other bio-solids. To determine the site's subvalue multiply the year's Pfertilizer application rate by (0.06).
ORGANIC P205 APPLICATION METHOD - Defines if the phosphate (P205) from the manure,sludge, or other bio-solids is actually incorporated into the soil, the time interval between applicationand incorporation, or if the rnanure/bio-solids are applied over a given amount of crop residue.Incorporation is either through direct injection with the application equipment or by using a tillage tooloperated a minimum of 3-4 inches deep to incorporate the manure, sludge, or other bio-solids. Todetermine the site's subvalue select the description that most closely describes the method ofapplication. The value with that description is the site's subvalue.
9. FILTER STRIP - Deduct 2 points if field runoff flows via sheet flow through a designed filter strip -minimum 33 feet wide. The filter strip must meet the NRCS FOTG Filter Strip (393) Standard criteria.It is critical that sheet flow crosses the filter strip, not concentrated flow, to credit a 2 point deduction.
NRCS, Ohio
August 2012

590-25
Phosphorous Index Risk Assessment Procedure Worksheet
Site Characteristic Phosphorous Vulnerability Values Sub -Value
I Soil Erosion Soil Loss (Tons/Acre/Year) X 1.0
2. Connectivity to NO, and the NO, but the Yes, but the site Yes, and the site is Yes, and the site isWater. site is not site is adjacent is not adjacent adjacent to and/or adjacent to and/or
Does concentrated adjacent to to an to an the concentrated the concentrated
an intermittent or intermittent or flow outlets into an flow outlets into aflow (via a defined intermittent perennial perennial intermittent stream perennial stream orwaterway, tile inlet, or perennial stream. stream. or through a tile through a tile inlet;or surface drain) stream. inlet. OR Outlets to aleave the site?
Value 0 Value = 12.0pond or lake within
Value = 4.0 Value = 8.0 1 mile.
Value = 16.0
Runoff Class See Runoff Class Matrix
4. Soil Test Bray- Bray - Kurtz P1 (PPM) X ( 0.07)Kurtz P1 PPM
S. Fertilizer P205 Fertilizer P205 Applied (Lbs/Acre) X (0.05)Application Rate
6. Fertilizer P205 0 Applied Immediate Incorporation < 1 Incorporation> I No Incorporation OrApplication Method Incorporation Week Week & < 3 Incorporation> 3
Months MonthsOr Or
Applied on 80% Applied on 50-Or Or
Cover 80% Cover Applied on 30- Applied on < 30%
Value = 0 49% Cover CoverValue = 0.75 Value = 1.5
Value = 3.0 Value = 6.0
7. Organic P205 Available - Manure / Biosolids P205 Applied (Lbs/Ac) X (0.06)Application Rate
B. Organic P205 0 Applied Immediate Incorporation < 1 Incorporation> 1 No Incorporation OrIncorporation Week Week & < 3 Incorporation> 3
Application Method Months MonthsOr, Applied on Or, Applied on80% Cover 50-80% Cover Or, Applied on 30- Or Applied on <
Value 0 49% Cover 30% CoverValue = 0.5 Value = 1.0
Value = 2.0 Value = 4.0
Filter Strip Factor (Deduct 2 points if field runoff flows through a designed filter strip - minimum 33 feet wide)
Total Site Index Value
NRCS, OhioAugust 2012

590-26
P Index Field Summary
Name: Farm:
Fields
Site
CharacteristicI Erosion (Value)
2.Connectivity to
Water (Value)
3. Runoff Class
(Value)
4. STP (Value)
5. P205 Fertilizer
Rate (Value)
6. P205 Fertilizer
Method (Value)
7. Manure Rate
(Value)
8,Manure
Application Method
(Value)
9. Fitter Strip
(2)
Total FieldScore
Field Rating
NRCS, OhioAugust 2012
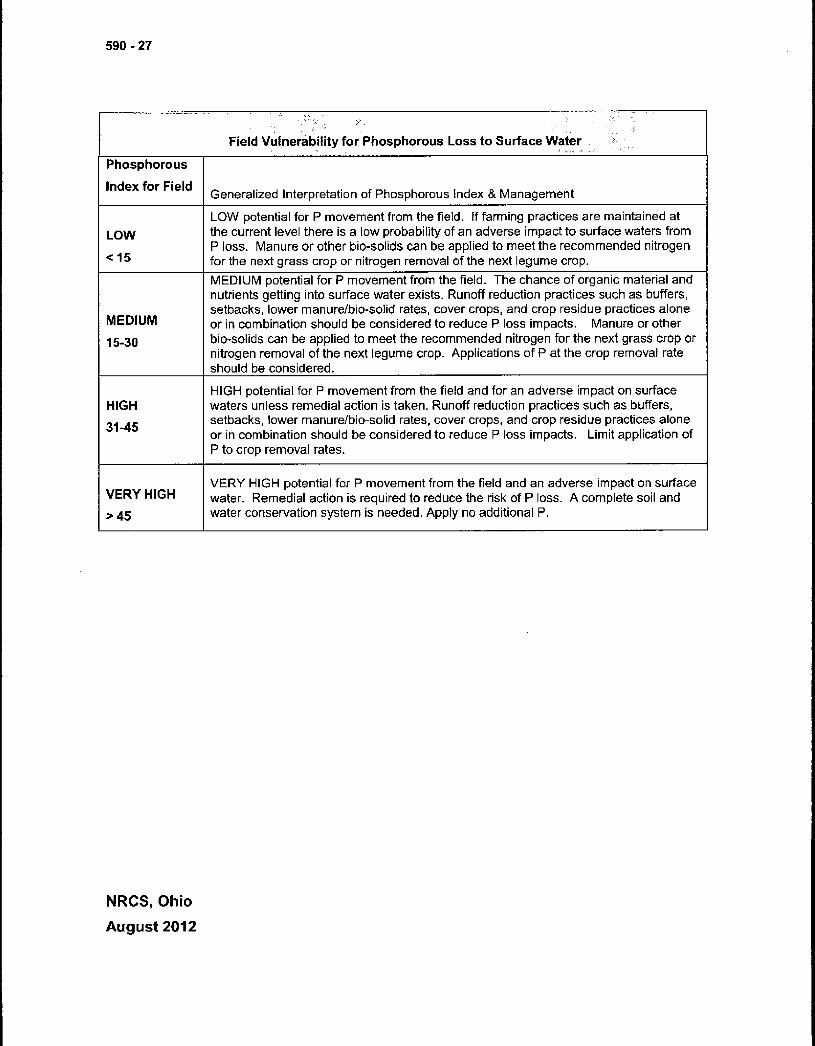
590-27
Field Vulnerability for Phosphorous Loss to Surface Water
Generalized Interpretation of Phosphorous index & Management
LOW potential for P movement from the field. if farming practices are maintained atthe current level there is a low probability of an adverse impact to surface waters fromP loss. Manure or other bio-solids can be applied to meet the recommended nitrogenfor the next grass crop or nitrogen removal of the next legume crop.
MEDIUM potential for P movement from the field. The chance of organic material andnutrients getting into surface water exists. Runoff reduction practices such as buffers,setbacks, lower manure/bio-solid rates, cover crops, and crop residue practices aloneor in combination should be considered to reduce P loss impacts. Manure or otherbio-solids can be applied to meet the recommended nitrogen for the next grass crop ornitrogen removal of the next legume crop. Applications of P at the crop removal rateshould be considered.
Phosphorous
Index for Field
LOW
<15
MEDIUM
15-30
HIGH potential for P movement from the field and for an adverse impact on surfaceHIGH waters unless remedial action is taken. Runoff reduction practices such as buffers,31-45 setbacks, lower manure/bio-solid rates, cover crops, and crop residue practices alone
or in combination should be considered to reduce P loss impacts. Limit application ofP to crop removal rates.
VERY HIGH
>45
VERY HIGH potential for P movement from the field and an adverse impact on surfacewater. Remedial action is required to reduce the risk of P loss. A complete soil andwater conservation system is needed. Apply no additional P.
August 2012NRCS, Ohio

590-28
Phosphorous Soil Test Risk Assessment Procedure
Nitrogen and Phosphorous Application Criteria for Manure, Organic By-Products, and BiosolidsCriteria Applicable to All Soil Test Levels:1. Nitrogen application rates from manure, other organic by-products, or biosolids shall be based on Total Ammonium Nitrogen
Content plus 1/3 of the Organic Nitrogen calculated at time of application when applied during the summer, fall, or winter forspring planted crops. When applied in the spring for spring planted crops the nitrogen application rate can be adjusted to applythe recommended nitrogen within the P205, K20, and other limitations.
2. Nitrogen rates are not to exceed the succeeding crop's recommended Nitrogen for non-legume crops or the Nitrogen removal inthe crop's biomass for legume crops.
3. All applications are based on current soil test results (not more than 3-5 years old).4. No manufactured P205 applied above 40 ppm Bray P1 or equivalent test, unless recommended by appropriate industry
standards or the land grant universities for specialty crops, vegetable crops, etc.
"F" Soil Test Level Application CriteriaBray P1 <40 ppm Recommended N or P205.(<80 Lbs/Ac) Manure or other Organic By-Products can be applied to meet the succeeding crop's
recommended NITROGEN requirements for non-legume crops or the NITROGENOR removal for legume crops; OR the recommended P205 but not to exceed the
NITROGEN needs of the succeeding crop.Other Ec:iuivalents (e. g . Mehlich 3)LOW POTENTIALBray P1 40-100 ppm'80— 200 Lbs/Ac' Recommended N or P205 Removal whichever is less.
The field shall have > 30% ground cover at the time of application or the manure or other
OR organic by-products shall be incorporated within one week. The manure or other organic by-products can be applied to meet the succeeding crop's recommended NITROGEN
Other Equivalents (e.g . Mehlich 3) requirements for non-Legume crops or the NITROGEN removal for legume crops; OR
MODERATE POTENTIAL removal (annual or multiple year applications) whichever is less.
Recommended N or P205 Removal whichever is less PLUS additional distancecriteria from drainageway/water source or other sensitive area, OR Filter Strips.Manure or other organic by-products can be applied to meet the succeeding crop's
Bray P1 100-150 ppm recommended NITROGEN requirements for non-legume crops or the NITROGEN removal
(200-300 Lbs/Ac) for legume crops; OR P205 removal (annual or multiple year applications) whichever isless IF:
OR 1. The field has> 50% ground cover at the time of application or the material isincorporatedOther Equivalents (e .Q. Mehlich AND
within 7 days on areas with < 50% cover.
HIGH P0 TEN TIAL2. Unless the manure or other organic by-products are incorporated within 24 hours, no
manure or other organic by-products are to be applied within 100 feet of adrainageway, water source or other sensitive area; OR, the width of a vegetative filterstrip (minimum width 33 feet) maintained adjacent to the drainageway, water source, orsensitive area.
Bray P1 >150 ppm(>300 Lbs/Ac)
OR No additional P205 - Use P205 Draw-down Strategies
Other Eguivalents (e. g . Mehlich 3)VERY HIGH POTENTIAL
NRCS, OhioAugust 2012
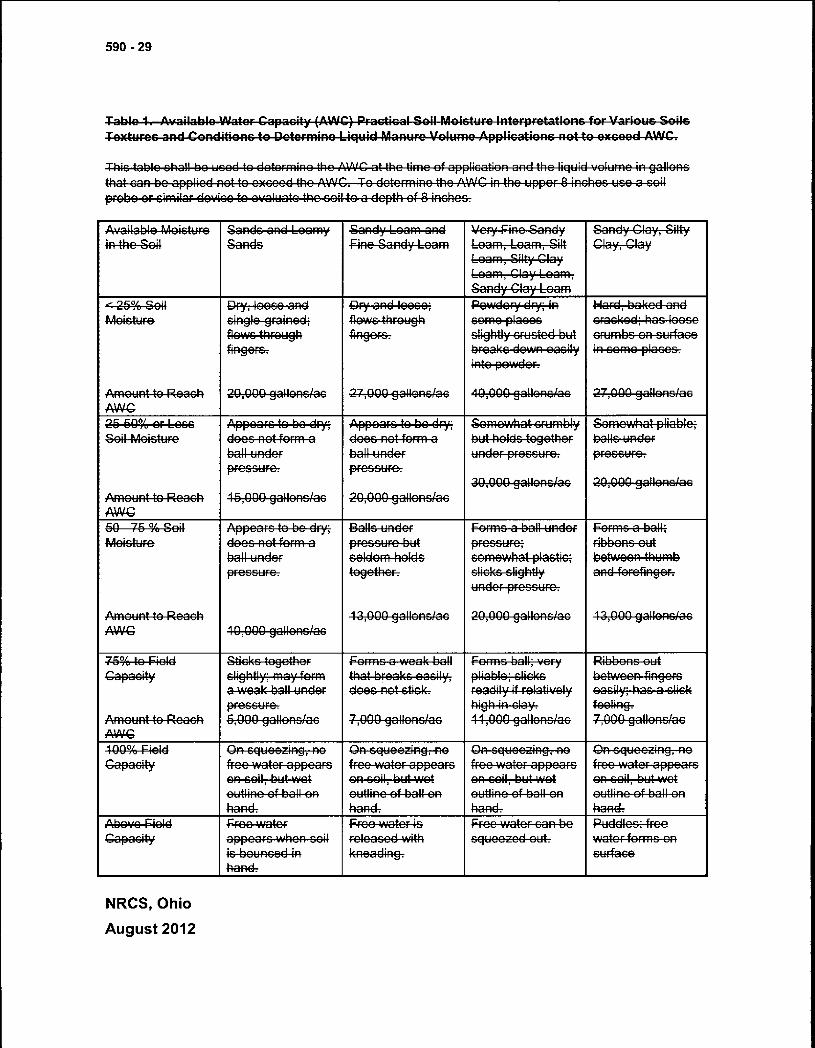
590-29
Table 1-. Availablo Water Capioity (AWc-P-aettcai-Soil Moisture lntorprotations for Various SoilsTextures 2nd Conditionc to Dotormino- Liqu id-Manur& Vo l ume -Applications not to exceed NAM—
Th is tab le shall bo ucod to determine the-AWC-ot-the time of application and the liquid volume in gallonsthat-can be app li ed not to oxcood- the-AWC. To determine the AWC in the upper 8 inohos use a soilprobe-sr-similar devico to evaluate-the-sod to-a depth of B inohos.
Available Mok;ture Sands and Loamy Sandy Loam and Very Fine Sandy Sandy Gfay-SiIty,iR the Soil Sands Fine Sandy Loam Loam, Loam, Silt Clay, Clay
Loam, Silty-CloyLoam, Clay Loam,Sandy Cloy Loam
25% Soil Dry, loose and IDFY and looco; Powdorj drj; in Hard, baked andMoisture single grainod; flows through come places cracked: hasI-oece
flowc through fingers. slightly crusted but crumbs on surfacefingers. breake-down--eae-ily in como places-.
into powder.
Amount to Reach 20,000 gallons/ac 27,000 oa llenc/ac 4000-galleneJae 27,999 gallon&aoAWG25 50% or Locc Appoarc to bo_dnjj Appoarc-to--be-dryj Semowhatcrtimbly Somewhat pliable;Soil Moisture does not form i3 does not form a but holds together halls under
ball under ball under under pressure. pressure.pressure. pressure.
30,000 gallons/ac 20,-clOG gallonc/acAmount to-Reach 4-5-000-gaIIonsIac 20,000-gallons/acAWG50 75% Soil Appears to be dry; Balls under Forms a ball undor Forms a ball:Moicturo does not for pressure -but pressure; ribbons out
ball under seldom holds somewhat plastic; between thumbpressure. together. clicks slightly and forefinger.
under-pressure.
Amount to Reach 13,000 gallons/ac 20,000 gallons/ac 13,000 gallons/acAWG 19,999 gallons/ac
75% to Field Sticks together Forms-a weak ball Forms ball; very Ribbons outCapacity slightly: may form that breaks easily, pliable; clickc between-flFgefs
a weak ball under does not etick. readily if relatively easily; has a-clickpressure. high in clay, feeling.
Amount to Reach 5,000 gallons/ac 7,000 gallons/ac 11,000 gallons/ac 7,000 gallons/acAW 100% Field On squeezing, no On squeezing, no On squeezing, no On squeezing, noCapacity free water appears free water appears free water appears free water appears
OR Se" , wet en-soit-but wot on coil, but '.vet on coil, but -wetoutlino of ball on outline of boll on outline of ba ll -SR outline of -ball onhand. hand. hand. hand
Abovo Field F-roe-water F-re-c water is Frcc water can be Puddles: freeCapacity appears when cell released with sioozod out '..'ator forms- on
is bounced in kneading, surfacehand- I
NRCS, Ohio
August 2012

590-30
, Lii
j1 i • r.'i• I -.U.i 0 ii • ThIY!'1 M
W.IY'i II! WW, I fr 1kT I i1 1J I! SI1P —
The -following criteria shall be foliewed if-land-users desire to apply marwro on idle€t-cropland with agrow rig over, set aside or on land in government perams (CRP, WRP, Other Govemm1-asomontTypo Land).
1. Use tho-onginal soil test that was used to make-the fertilizer determinations when the land wentnder-sp t aoldo or obtain a new soil test if one 1€; net available.
., ----- •,E!,!rdILA_ -- - -
11*A J
Im:e
Phosphorus 4P4 Nitrogon (N)
Bray P1 or Annual Appliaation Rate (Lbs/Ag of P205) Based on Available N at theequivalent Value
limo of Application-(Max i mum of 1-0-years of Applioation)
Or Equivalent
5ppm
SlOppm
1015ppm 99 444
4 5-20-ppn 45
20 25 ppm 66 4m-29
25 45 ppFn
m1 ,II.1U.WX1- 4 I R VUIl !WWP1 riwynr viiiu
iIliIPii*I!iL!LIl%'!uI'l.-.1:i:ItIrJirJI -
a1 !I 'IU VI1.J L II!TJ II !WW1 r1 v.rP&MvArl-1 Iii 'i .i'iu WI! -iryiii
August 2012NRCS, Ohio

590-31
Table 3. Determining the Most Limig Manure Application Rates
Select the Most Limiting Applica1ien Rate-Based on the Following Crite4a
Fie1d-Situion & Time of YearLimiting -Application Rate Criteria
I TonAc IK20 __
GalloncIAc
Part 1. Subsurface Drained- (Tiled) Fields(April June) 4/ CFOp Crop Needs Crop NeedsSubeurfaco Drinod or Hgh N Needs or Crop OF GFe
13,000 gal. Upper 8Leaching Potential factoring N Remoya1- Removal
loccoc 250 Lbe/ae 600 Lbciac5110 wot tone
(April June) _______ _ r_________ ___00____l.___________________________ Crop Needs Cop Nood 5,0 gaPas tu re '. 20% or Croij4and-'--1-5% or Crop orCrop unlace _______
_______ _______ _______ Uppor8Suburfoed gioinod or -Hg1 -N factoring N Removal Removal - contoured otripeLeaching Potential loccoc Lb/ac 500 Lbc/ac 9F incorporated
(Juty-Septi-) __________________ Crop Needs Crop NeedNo Growing Cr013 21L 50 Ibe/ac or Crop or Crop ________ ____ r___
_________ _______ ________ 3,000-gol UppeS"Subsurfaso Drainod or High N cc applioii N Removal Remova l -1
Leaching Potential 250 Lbcfac 500 Lbe/ac
(July - Sept.) 31-Ne4 Ccop-Nocds Crop NeedsWith a Growing Cover Crop ________r ___ r___ _r_____________________________ yoar'c-cep or Cop o Crop 13.000 gal. tJpper8r&ibcurfacc Drained or High H ncodc-ac Removal - Reov&-Loactiing Poflftal ppliod N 250 1 hg ka 690-L-bcJac
(July - Sept-) ____________________ Crop4'feods _ rop _____No Growing Crop 2/50 lbs/ac or Crop
C Needs 5/10-wet tone
Cropland 15% as applied N Removal or Crop tipper 8
Subsurfaced Drained or HIGh N 250 Lbc/ac Removal-< 13,000 gal.
kocohing Potential 500 Lbiiao
(Oct. - March) 3! Noxt Crop Neede Crop NeedsSubsurface Drained or I-ugh-N yoar'c crop or Crop or Crop 13,000 ga l . Upper 8"Leaching Potential itOOdE as Removal Removal
app-lied-N 250 Lbefac 500 Lbs/ac5/10 wet (eric
(Oct. - March) 31 No (Fop Needs Crop Needs 5,000 ga l .—Pasture • 20%,-o-CropIand 15% ________ ___ ______________________________ year's crop or-Crop or Cro_ p unless
Upper 9"Suburfaccd Drained or High N needs as Removal Rpm oval - contoured SOPS
Loaching Potontial applied N 250 Lbs/ac 500-6bc^ac or incorporatedimmediately5140 wot tons
Frozen-or-Snow Cover 3I-Ne4 Crop Need e Crop Needs 60-0A Solids; 5Subsurface Drained oc-H4gh-N ycare crop or Crop or C-rep wet tone - 50%Leaching Potoritil noode as Remova4- Removal solids; Liquid
applied N 25LbsJac 500 Lbs/ac Manure 6000
NRCS, OhioAugust 2012
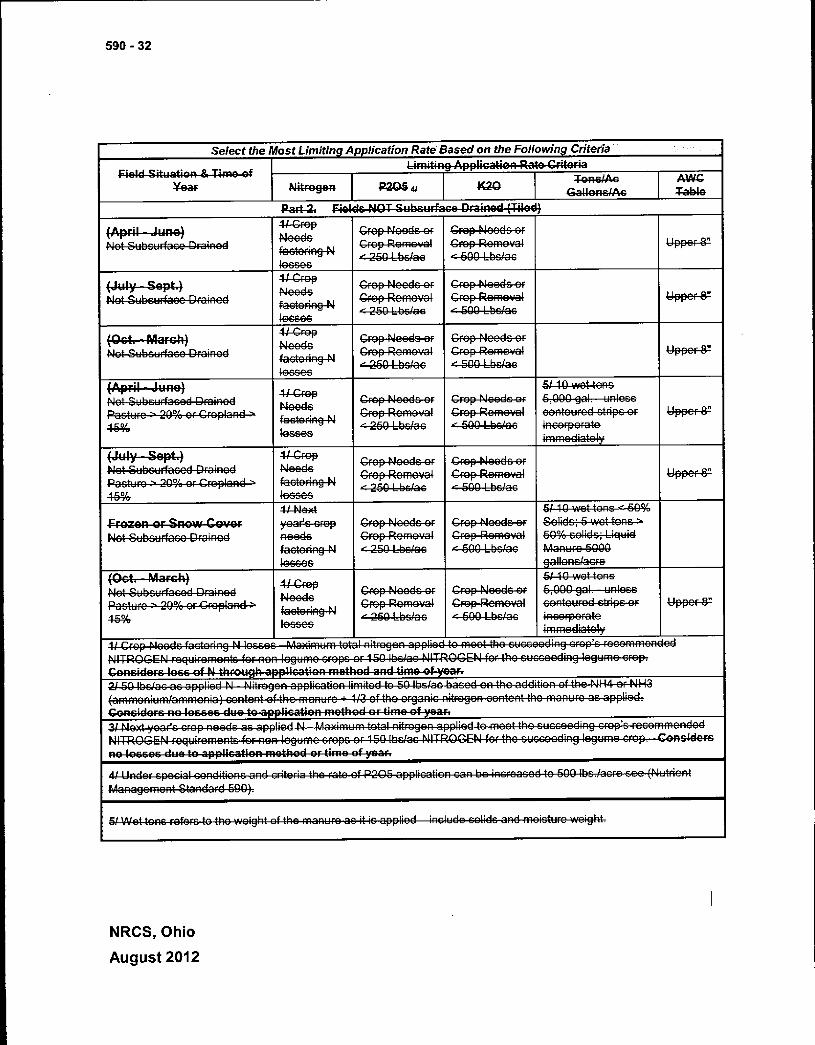
590-32
Select the Most Limiting Application Rate Based on the Following Criteria____
i __________im__e__
ofLimiting Applicatien-R1-o- Criteria
d St uation & T _ I AWCea Nitrogen P205 K20 GalIpncIAc I
Part 2 Relds-NOT Subcurf we Drained Riled)
(April June)4 G. FepNoode
Crop Node or Crop Needs orNot Subourf000 Drained moval
taotng NCrop Re Crop Removal Uppor 8"
_____ <250 Lbe/ae <500 Lbelacloccoc _________
(Ju__ly - Sept.) Crop_______ 11- Crop ___N__oo de or C ____ Needs Needs
de orNot Subsurface Droinod Crop Removal Crop-Remei4 tJ-pper 8'
-: 250 Lbc/ac 500 Lbc/oc
(Oct. - March)41-GcepNeeds
________ ________Crop Needs-er Crop Needs orNot Subsurface Drained _act_____ Crop-Romoval Crop Removal 1Jpper-8
foring N LbC/aC <500 Lbs/acI occee
(April - Juno) if__ C___ 5110we4-tensrop _r___________ ____________e ___00____ l. u______
Not Subsurfacod ID Fa MoodsCop Noede-or Crop Needs or 5,0 ganloc.o
Pasturo-' 20% or Cropland f3cto'Jflg f4______ Crop Removal Crop Reme.'al contoured ctripo or Jippor 8<250 Lbs/ac 500 Lbsloo incorporate45% 105005
(July - Sept.) li-Crop Crop-Noode or Crop Needs orNot Subourtacod Drained Needs ____________ __________ ________________________ _______ Crop Removal Crop Rem_ea1 Upper 8"Pacturo - 20% or Cropland factotng-N <:25(41 Wag -500-LbcJac44% Ioacc
1/ Next 51-413 wet tone < 50%Frozen or. Snow Cover yoarc crop Crop Needs or Crop Neoder-er, Solids; 5 wet tons-Not Subcurfaco Drained needs Crop Removal Crop -Removal 50% solids; Liquid
faotoring-N <250 Lbs/ac <600 Lbs/ac Manure 5000106666 gallons/acre
(Oct. March) 5/-40 wet tensNot SubourIaood Drained _____ Crop Needs or Crop Needs -or 6,000 gal. unlocePasture 20% orCrnplee4- otorjflg N
Crop Removal Ccop-Rcmoval contoured ctdpe or Uppor 5"- 250 Lbs/as 500 Lbs/ac incorporate
locsc.. 4mmedito1y11 Crop Needs factoring W4 gr r-, R-i-; —Maimum total nitrogen applied to reset-the succeeding crop's resemmendedNITROGEN requirements for non legume -crepe or 150 lbs/as NITROGEN for the suocoeding legume--erepConsiders loss of N through-application method and time of-year,21 50 lbs/aa-as applied N Nitrogen applisatien limited to 50 lbs/as based er the -addition of the NH4 or NH3(aromonium/ammonia) oentent-ef thoenuro + 113 of the organic nitrogen-eontent the manure as applied.Considers no losses due to appilca4ion method or time of year.3! Next years crop needs as applied N - Madmuei-tetaI nitrogen applied to meet-the-succeeding crop's recommendedNITROGEN requirementa4er-nen legume reps or 150 lbs/ac NITROGEN for the succeeding legume crop. Considersno losses due to application method or time of year.
4! Under special conddion.s-and &iteria the rate of P205-applisatien can be increased to 500 lbs/acre see (NutrientManagement-8tardard 500)7
5/ Wet tons refers-4o the weight of the manure as it i&applied include solids-and-moisture weight.
August 2012NRCS, Ohio

590-33
Table 4.Minimum Setback Distances for the Application of Manure and Other Organic By Products
Type of Sensitive - Setbacks Based on Methods of Manure ApplicationSetback Area Surface Application Winter Application Surface Incorporation
Frozen or Snow W11 24 Hours OR
Covered Soils 71 Direct InjectionResidences / Private Wellsdown slope from the 100 ft
200 ft. 100 ft.
- 35ft. Vegetative Barrier11 , with the remaining 100ft. setback in non-vegetative Setback 21
- 35ft. Vegetative Barrierv, OR- 100 ft. setback in non-vegetative Setback. OR- 35 ft. in non-vegetativesetback
300 ft.- - 35ff. Vegetative Barrier 1f,
with the remaining 200 ft.setback in non-vegetativeSetback ,
200 ft.
100 ft,
- 35ff. Vegetative Barrier 11
None
- Sinkholes
- Pond or Lake
- Streams- Ditches- Surface Inlets
Grassed Waterway 35 ft. 200 It, None
Field Surface Drains 35 ft. 41 200 ft. NonePublic Wells 300 ft. 300 ft. 100 ft.
Developed Springs 300 ft. upslope 300 ft. upslope 300 ft. upsiopePublic Surface Drinking 300 ft. 300 ft. 300 ft.Water Intake1/ Permanent vegetation consisting of grass, grass/legume mix, trees/shrubs, or trees/shrubs and grass/legumes. Measured fromtop of bank.2J Includes 100 ft. total setback. The setback must include a minimum of 35 ft. of vegetative cover from top of bank with theremainder of the 100 feet with no vegetative requirement. The setback is measured from the top of bank.3/ Applies if the manure application area has at least 50% vegetation/residue cover at the time of application.
4/ No setback required for field surface drains if the Additional Criteria to Protect Water Quality, Item 5 isapplied from this standard.51 CAFOs must follow the setbacks defined in the Ohio Department of Agriculture (ODA) rules regarding manure application. SeeTable 5— ODA Setbacks - Appendix A Table 1 of rule 901:10-1-14: Land Application Restrictions and Setbacks6/ Excludes sludge that is regulated by the Ohio Environmental Protection Agency (OEPA) and septage regulated by the OhioDepartment of Health.
7/ See Additional Criteria to Protect Water Quality, Item 7, for the special manure application criteria onfrozen and snow covered fields.
August 2012NRCS, Ohio

Stockpiles
300'300'300'300'300'300'3001500300'500'
Surface Application
300'35' veg cover, 100' (25' veg.cover or 100'(5' veg.cover or 100'(
35,35,
300'300'300'300'
do not apply
Winter ApplicationsFrozen or Snow
Covered Ground (1)300'
35' yea, cover. 100'(2i veg. cover, 135' veg. cover, 1
100'
300'300'
590-34
Table 5 - Ohio Department of Agriculture Setbacks Source: USDA-NRCS (2003). Field Office Technical Guide-Conservation Practice StandardOhio,Appendix A Table I of rule 901:10-1-14: Land Application Restrictions and SetbacksLand Application Restrictions I I 1 2 3 I
Class V wells, sinkholesPerennial Streams
Seasonal salmonid and cold water habitat:Intermittent Stream I Ditch or Surface Inlet
Drainageways, grassed waterwaysPond or Lake
Private or Public WellPublic Surface Drinking Water Intake
SpringsNeighboring residences:
Floodin g/flood olainslfloodwavs (3):
633, Columbus,
Surface Incorporationw/I 24 Hours ORDirect Injection
100'35' yea, cover
35,100'
Slope (4): 1 0-6% I >15% see note S I-. If> 6% see note S I >15% see note 5Liquid Manure - Based on Appendix B (AWC Chart) & Appendix F (Most Limiting Nutrient Chart)
Maximum Application Rate: I Solid Manure - Based on Appendix F (Most Limiting Nutrient Chart)Note (1): For surface applications without snow there must be > 80% ground and/or canopy cover. For snow or ice covered fields, only 10% or 2 acres,
whichever is greater can be used for application. All winter surface applications must have prior approval from the Ohio Department of Agriculture.Note (2): The first setback refers to a vegetative cover setback that must be maintained while the second refers to the total setback distance.Permanent vegetation consisting of grass, grass/legume mix, trees/shrubs, or trees/shrubs and grass/legumes, measured from top of bank.Can use a 35' non vegetative buffer for intermittent stream / ditches or surface inlets if the manure application area has at least 50% vegetation/residue cover at the time of application.Note (3): No applications during expected flooding season as reported In Appendix A, Table 2Note (4): Must have < 5 ton/ac yearly average soil loss to perform surface manure applicationsNote (5): Manure is not to be applied to cropland over 15% slope or to pastures/hayland over 20% slope unless PNIL of the following precautions are taken:
a. Immediate incorporation or injection with operations done on the contour, UNLESS the field has 80% ground cover (residue or canopy).
b. Applications are timed during periods of lower runoff and/or rainfall (May 20th - October 15th)
c. Split applications are made (separated by rainfall events) with single applications not exceeding 10 wet tons/ac or 5000 gal/ac.
d.The field is established and managed in contour strips with alternated strips in grass or legume.Note (6): Manure is not to be applied in the winter to fields with over 6% slope unless one of the following precautions are taken:
a. The field is established in grass or legume with 90% cover, or the fields has 90% or more residue cover, or the land is managed in contour strips.
b. The fields has 90% or more residue cover.c. Contour strips are used with alternate strips in grass or legume and manure is applied on alternate strips only.
August 2012
NRCS, Ohio

Attachment IV
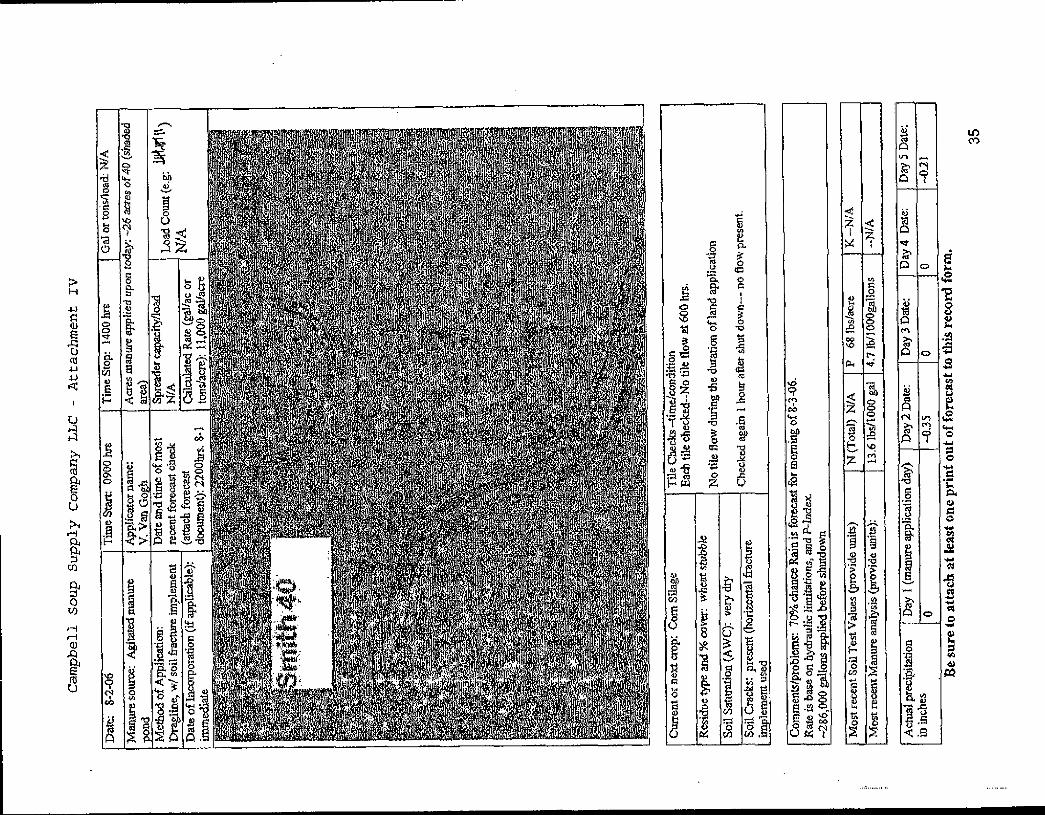

Attachment V
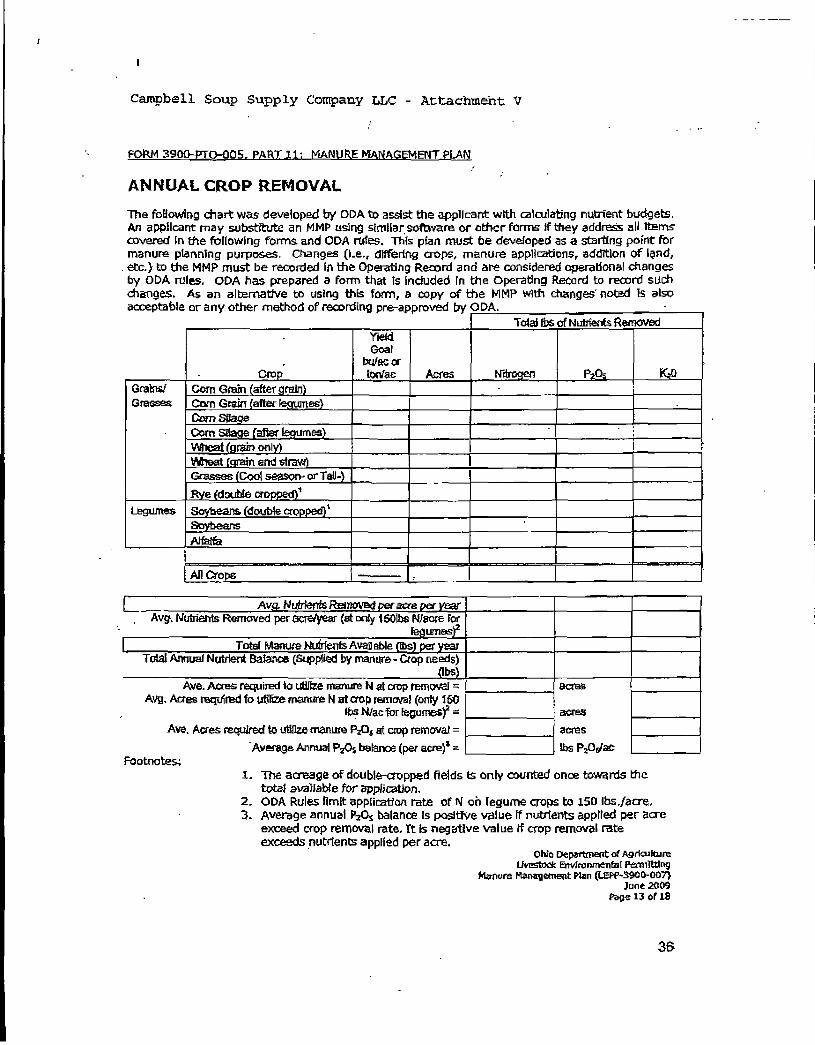
Campbell Soup Supply Cornpa.y LLC - Attachment V
FOPJ1 3900-P1jO-005, PART 11; MANURE MANAGEM1T PLAN
ANNUAL CROP REMOVAL
The foliowing chart was developed by ODA to assist the applicant with calculating nutrient budgets.An applicant may substitute an MMP using 91milar l software or other forms If they address all itemscovered In the following forms and ODA rules. This plan must be deve!oped as a starting point formanure planning purposes. Changes (i.e., dIfér1ng crops, manure applications, addition of lend,etc.) to the lIMP must be recorded in the Operating Record and are considered operational changesby ODA rules, ODA has prepared a form that is Included In the Operating Record to record suchchanges. As an alternative to using this form, a copy of the MMP with changes noted Is alsoacceotabie or any other method of recordino ore-aDoroved by aDA, -
Avg. Nutrients Removed per acre/year (at ciy l5Otbs N/acne for
ivagablemanure-
Ave. Acres required to utIfze manure N at cnrip removal =Avg. Acres required to ute manure N at aop removal (only 150
lbs N/actor legumes)Ave. Acres required to utilize manure PA at crop remova/ =
Average Annual PA balance (per acre)Footnotes.
acmacreslbs 1`20daf-
1. The acreage of doubls-cropped fields is only counted once towards thetotal ava)Jable for application,
2. ODA Rules limit application rate of N on legume crops to 150 lbs/acre.3. Average annual P2Q balance Is positive value If nutrients applied per acre
exceed crop removal rate. ft Is negative value if crop removal rateexceeds nutcients applied per acre.
Ohio Departmental AarlcultweUtock ErMrownentsl Permltdn
Manure Mangemmt Men (lPf-590D-O07)June 2009
Page 13 o f
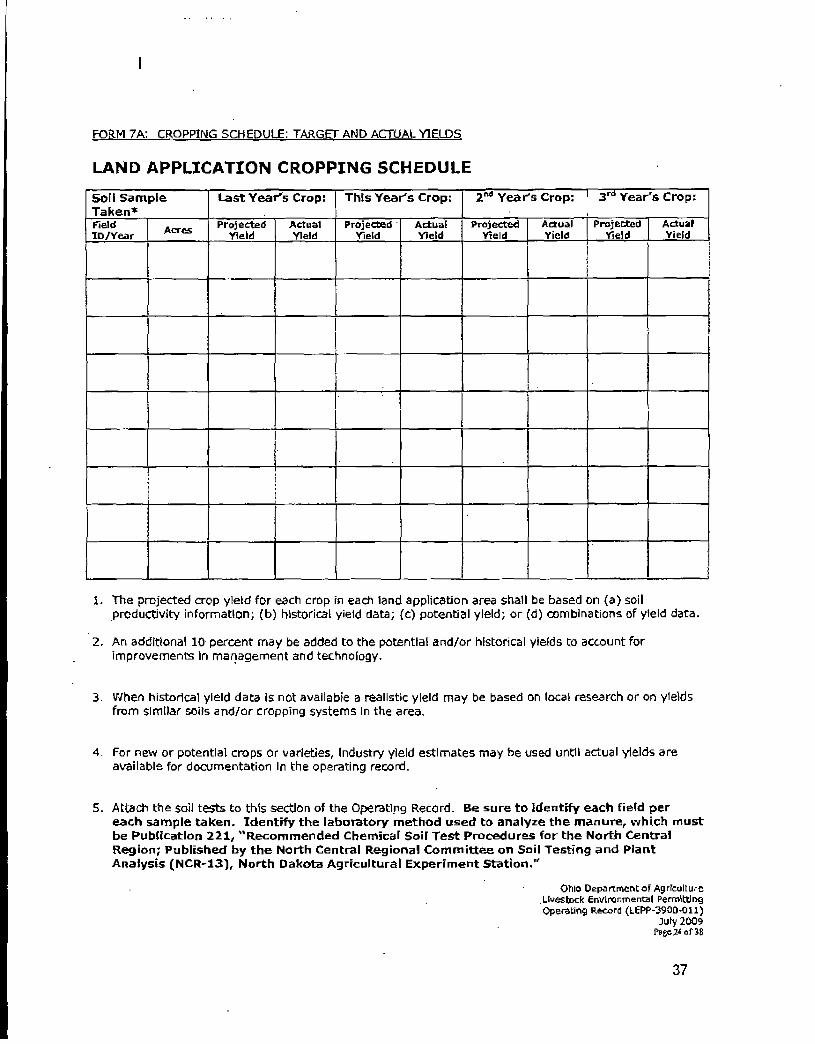
FORM 7A: CROPPING SCHEDULE: TARGET AND ACTUAL Y1ELD
LAND APPLICATION CROPPING SCHEDULESoil Sample Last Years Crop: This Year's Crop: 2Years Crop; --I 3" Year's CropTaken* -Field ACIS Proectd Actual Projected Actual Projected Actual Projected ActualID/Year Yield Yield Yield Yield Yield Yield Yield Yield
i l --T1. The projected crop yield for each crop in each land application area shall be based on (a) soil
Productivity information; (b) historical yield data; (c) potential yield; or (d) combinations of yield data.
2. An additional 10- percent may be added to the potential and/or historical yields to account forimprovements In management and technology.
3. When historical yield data Is not available a realistic yield may be based on local research or on yieldsfrom similar soils and/or cropping systems In the area.
4. For new or potential crops or varieties, Industry yield estimates may be used until actual yields areavailable for documentation in the operating record.
S. Attach the soil tests to this section of the Operating Record. Be sure to identify each field pereach sample taken. Identify the laboratory method used ta analyze the manure, which mustbe Publication 221, Recommended Chemical Soil Test Procedures for the North CentralRegion; Published by the North Central Regional Committee on Soil Testing and PlantAnalysis (NCR-13), North Dakota Agricultural Experiment Station.'
Ohio Department of AgrTuItu-eLlvestncic Environmental PermittingOperating Record (LSPP-3900-011)
July 2005PeZ4 o138
37
![PDF - Ohio EPAchagrin.epa.ohio.gov/edoc/images/108100/1081000017.pdf · Used Oil Collection Centers [OAC 3745-279-31(B)(2)] Owners and operators of all used oil collections centers](https://static.fdocuments.us/doc/165x107/5f5b3cec9e294b33985d7fc3/pdf-ohio-used-oil-collection-centers-oac-3745-279-31b2-owners-and-operators.jpg)