N e v e r s t o p t h i n k i n g .
16
06/16/2004 Arasch Lagies Jörg Berkner Ramana M. Malladi Kim M. Newton, Scott M. Parker Page 1 N e v e r s t o p t h i k i n g . S e c u r e M o b i l e S o l u t i o n s June 15/16, 2004, Bordeaux, France DC Temperature Behavior of Hicum Arasch Lagies (IFX), Jörg Berkner (IFX), Ramana M. Malladi (IBM), Kim M. Newton (IBM), Scott M. Parker (IBM) Temperature Dependent Modeling Problems Reason for the Modeling Problems Solution for the Modeling Problems Results
-
Upload
fatima-little -
Category
Documents
-
view
25 -
download
1
description
DC Temperature Behavior of Hicum Arasch Lagies (IFX), Jörg Berkner (IFX), Ramana M. Malladi (IBM), Kim M. Newton (IBM), Scott M. Parker (IBM). June 15/16, 2004, Bordeaux, France. Temperature Dependent Modeling Problems Reason for the Modeling Problems Solution for the Modeling Problems - PowerPoint PPT Presentation
Transcript of N e v e r s t o p t h i n k i n g .
06/16/2004Arasch LagiesJörg BerknerRamana M.
MalladiKim M. Newton, Scott M. Parker
Page 1 N e v e r s t o p t h i n k i n g .Sec
ure
Mo
bile
So
luti
on
s
June 15/16, 2004, Bordeaux, France
DC Temperature Behavior of HicumArasch Lagies (IFX), Jörg Berkner (IFX), Ramana M. Malladi (IBM), Kim M. Newton (IBM), Scott M. Parker (IBM)
Temperature Dependent Modeling Problems
Reason for the Modeling Problems
Solution for the Modeling Problems
Results
06/16/2004Arasch LagiesJörg BerknerRamana M.
MalladiKim M. Newton, Scott M. Parker
Page 2
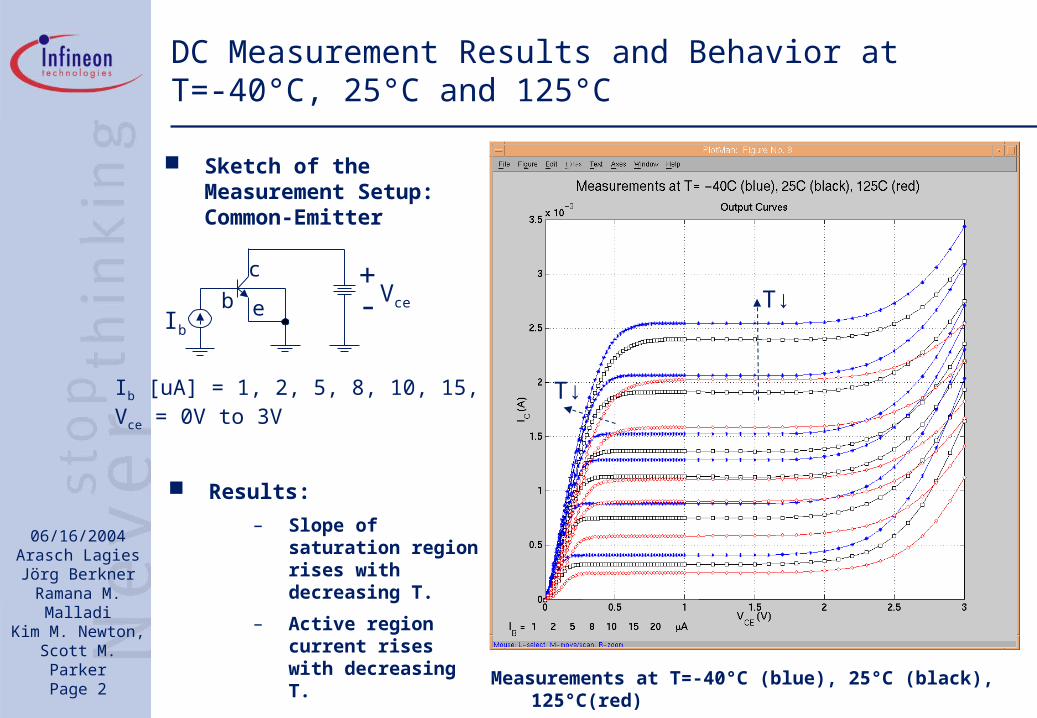
DC Measurement Results and Behavior at T=-40°C, 25°C and 125°C
Sketch of the Measurement Setup:Common-Emitter
+-Ib
Vce
c
eb
Ib [uA] = 1, 2, 5, 8, 10, 15, 20Vce = 0V to 3V
Results:
– Slope of saturation region rises with decreasing T.
– Active region current rises with decreasing T.
Measurements at T=-40°C (blue), 25°C (black), 125°C(red)
T↓
T↓
06/16/2004Arasch LagiesJörg BerknerRamana M.
MalladiKim M. Newton, Scott M. Parker
Page 3
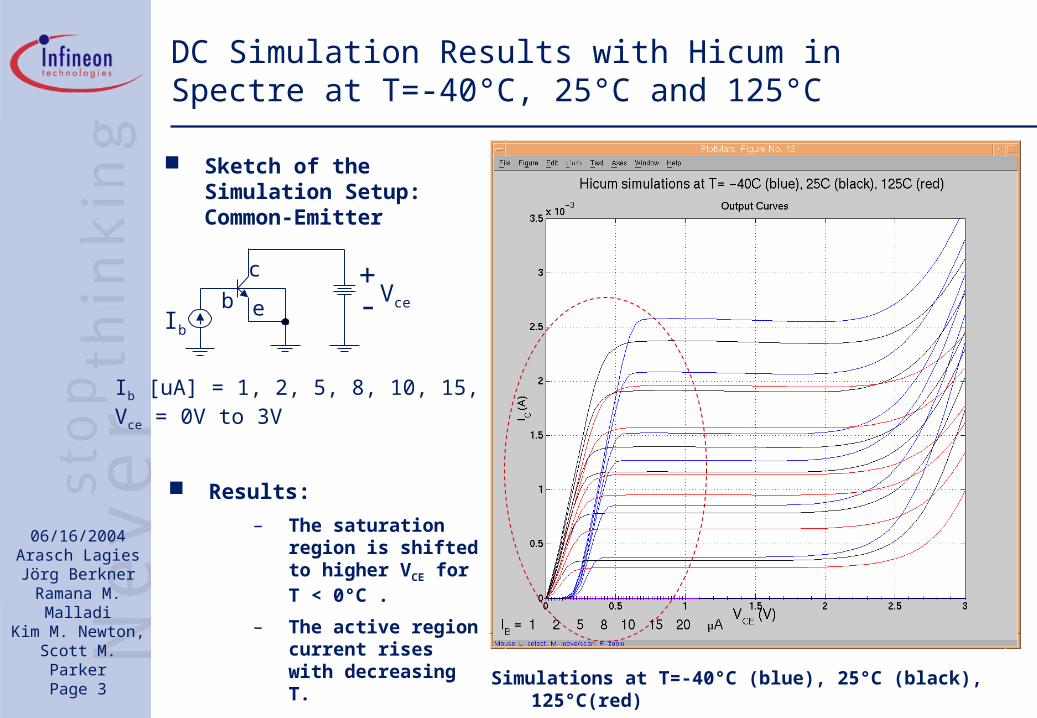
DC Simulation Results with Hicum in Spectre at T=-40°C, 25°C and 125°C
Sketch of the Simulation Setup:Common-Emitter
+-Ib
Vce
c
eb
Ib [uA] = 1, 2, 5, 8, 10, 15, 20Vce = 0V to 3V
Results:
– The saturation region is shifted to higher VCE for T < 0°C .
– The active region current rises with decreasing T. Simulations at T=-40°C (blue), 25°C (black), 125°C(red)
06/16/2004Arasch LagiesJörg BerknerRamana M.
MalladiKim M. Newton, Scott M. Parker
Page 4
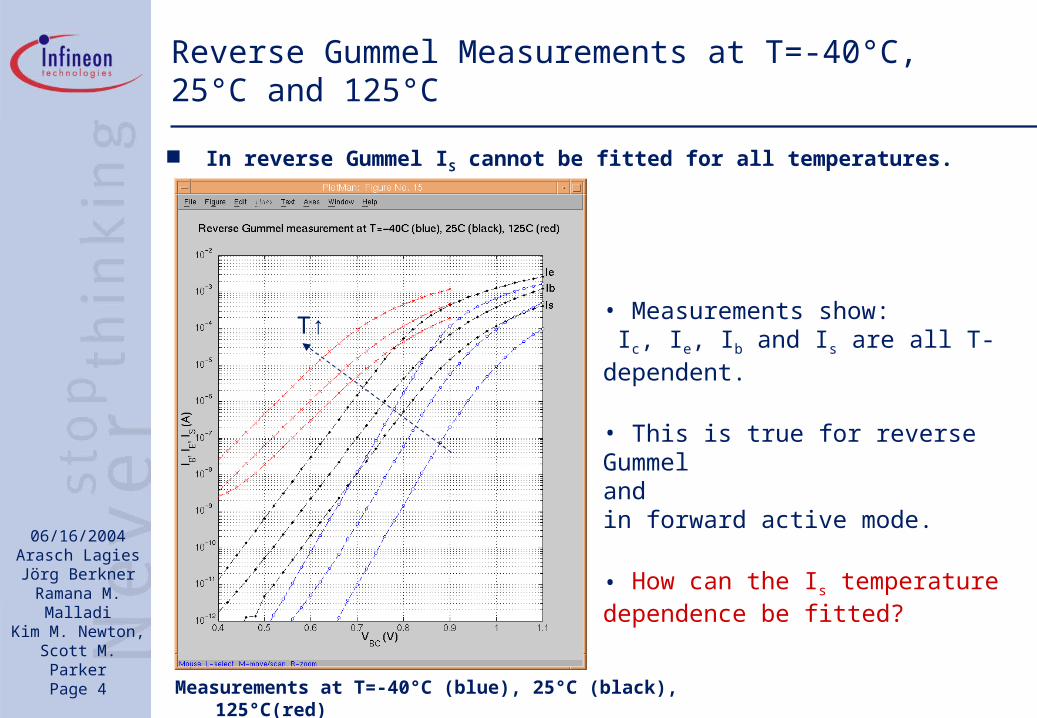
Reverse Gummel Measurements at T=-40°C, 25°C and 125°C
In reverse Gummel IS cannot be fitted for all temperatures.
• Measurements show: Ic, Ie, Ib and Is are all T-dependent.
• This is true for reverse Gummel and in forward active mode.
• How can the Is temperature dependence be fitted?
Measurements at T=-40°C (blue), 25°C (black), 125°C(red)
T↑

06/16/2004Arasch LagiesJörg BerknerRamana M.
MalladiKim M. Newton, Scott M. Parker
Page 5
Reason for Fitting Difficulties
The saturation current of the parasitic pnp substrate transistor ITSS is temperature-independent modeled.
If ITSS is fitted for T=25°C the current through the pnp substrate transistor becomes too big for T < 0°C, compared to the base current of the npn transistor.
This leads to
1. The shift for the DC output curves for T< 0°C toward higher VCE.
2. Bad fitting of IS in the reverse Gummel and in forward active mode over temperature.
3. Bad convergence behavior for T< 0°C.

06/16/2004Arasch LagiesJörg BerknerRamana M.
MalladiKim M. Newton, Scott M. Parker
Page 6
Solution for the Fitting Difficulties (1)
KTNOMTT ABSINI 15.300
For good results ITSS shows an exponential behavior with the temperature.
By using a similar function as used for the saturation current of the parasitic pnp transistor, ISP(T) in Vbic, this problem can be solved.
Here is
RTHABSDEV VDTEMPTT
NFP
T
INI
DEVXIS
INI
DEVNOM V
TT
EAP
T
TTITSSTITSS
1
1
exp)()(
06/16/2004Arasch LagiesJörg BerknerRamana M.
MalladiKim M. Newton, Scott M. Parker
Page 7
Solution for the Fitting Difficulties (2)
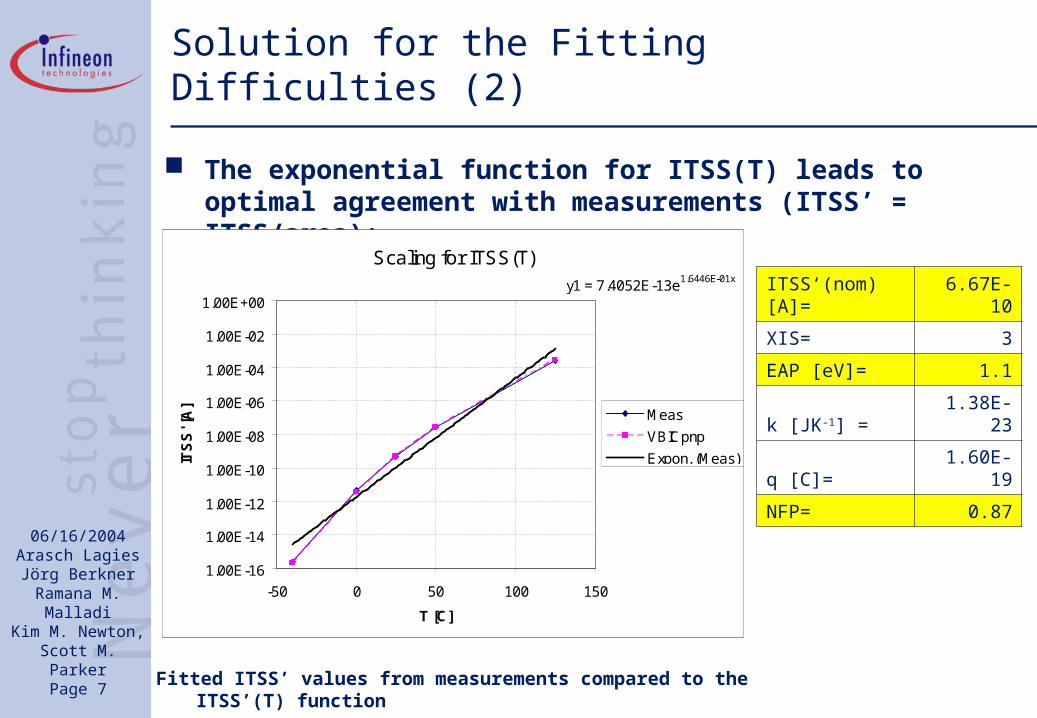
ITSS‘(nom) [A]= 6.67E-10
XIS= 3
EAP [eV]= 1.1
k [JK-1] = 1.38E-23
q [C]= 1.60E-19
NFP= 0.87
The exponential function for ITSS(T) leads to optimal agreement with measurements (ITSS’ = ITSS/area):
Fitted ITSS’ values from measurements compared to the ITSS’(T) function
Scaling for ITSS(T)
y1 = 7.4052E-13e1.6446E-01x
1.00E-16
1.00E-14
1.00E-12
1.00E-10
1.00E-08
1.00E-06
1.00E-04
1.00E-02
1.00E+00
-50 0 50 100 150
T [C]
ITS
S' [
A]
Meas
VBICpnp
Expon. (Meas)
06/16/2004Arasch LagiesJörg BerknerRamana M.
MalladiKim M. Newton, Scott M. Parker
Page 8
Solution for the Fitting Difficulties (3)
Some possibilities for the introduction of ITSS(T):
1. If a scaling file is available ITSS(T) can be implemented there (work around).
2. Generally ITSS(T) should be implemented in the model code.

06/16/2004Arasch LagiesJörg BerknerRamana M.
MalladiKim M. Newton, Scott M. Parker
Page 9
Measurement vs. DC Simulation Results with Hicum in Spectre at T=-40°C, 25°C and 125°C using ITSS = ITSS(T)
With ITSS=ITSS(T) there is no shift of the saturation region to higher VCE.
Meas. (dash-dotted) vs. sim. (solid) at T=-40°C.
Meas. (dash-dotted) vs. sim. (solid) at T=25°C.
Meas. (dash-dotted) vs. sim. (solid) at T=125°C.

06/16/2004Arasch LagiesJörg BerknerRamana M.
MalladiKim M. Newton, Scott M. Parker
Page 10
Measurement vs. Reverse Gummel Results with Hicum in Spectre at T=-40°C, 25°C and 125°C using ITSS = ITSS(T)
With ITSS=ITSS(T) the low current region of IS in the reverse Gummel plot can be fitted accurately.
Meas. (dash-dotted) vs. sim. (solid) at T=-40°C.
Meas. (dash-dotted) vs. sim. (solid) at T=25°C.
Meas. (dash-dotted) vs. sim. (solid) at T=125°C.
06/16/2004Arasch LagiesJörg BerknerRamana M.
MalladiKim M. Newton, Scott M. Parker
Page 11
Conclusions
The temperature independence of ITSS for the parasitic pnp substrate transistor leads for some temperatures to a strong current imbalance compared to the base current of the npn main transistor.
This imbalance leads to
– a shift of the saturation region in the DC output curves for T < 0°C,
– a bad fitting of IS in the reverse Gummel and in forward active mode over T and
– difficulties in the simulator convergence for some T.
The problem can be solved by using a T-dependent function for ITSS similar to the saturation current ISP(T), as used in Vbic.
ITSS(T) can be implemented in a scaling file or better in the model code itself.
06/16/2004Arasch LagiesJörg BerknerRamana M.
MalladiKim M. Newton, Scott M. Parker
Page 12
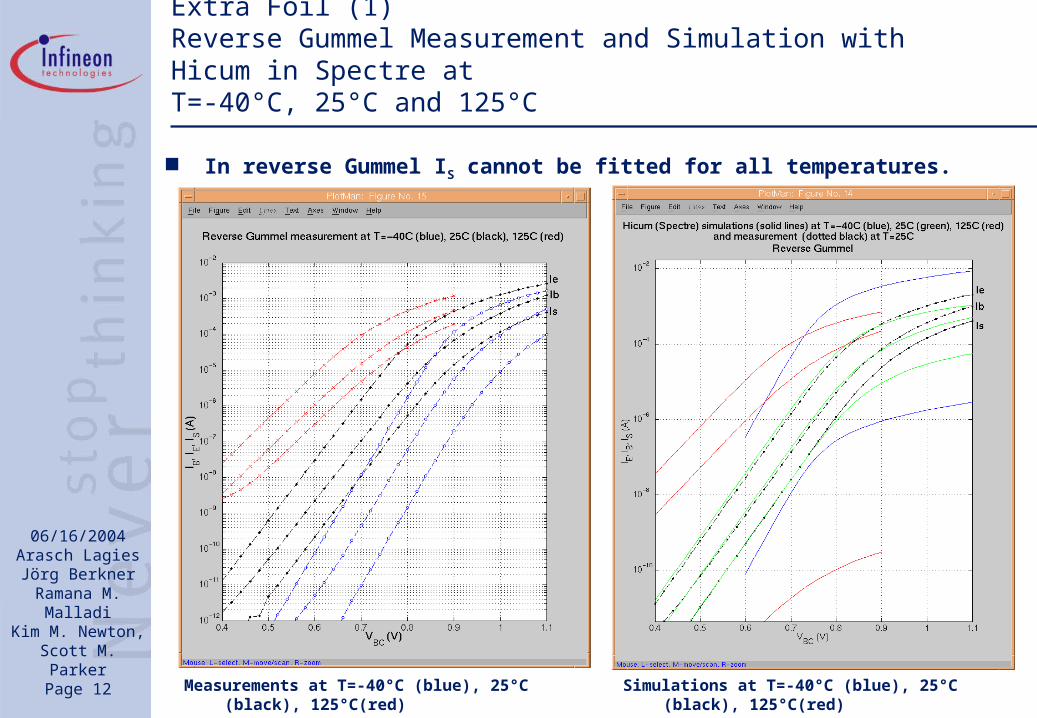
Extra Foil (1)Reverse Gummel Measurement and Simulation with Hicum in Spectre at T=-40°C, 25°C and 125°C
In reverse Gummel IS cannot be fitted for all temperatures.
Measurements at T=-40°C (blue), 25°C (black), 125°C(red)
Simulations at T=-40°C (blue), 25°C (black), 125°C(red)

06/16/2004Arasch LagiesJörg BerknerRamana M.
MalladiKim M. Newton, Scott M. Parker
Page 13
Extra Foil (2)IS Reverse Gummel Measurement and Simulation with Hicum in Spectre
Measurement and simulation in a technology of Infineon.
In reverse Gummel IS cannot be fitted for all temperatures.
Here the fitting was done for T=25°C (green).
– For T=125°C (blue) the simulation deviates significantly.
– For T=-25°C (red) no simulator convergence was achieved.
Measurement solid lines, simulation dashed lines.
For T = -25°C (red), 25°C (green), 125°C (blue)

06/16/2004Arasch LagiesJörg BerknerRamana M.
MalladiKim M. Newton, Scott M. Parker
Page 14
Extra Foil (3)DC Output Characteristics Simulation with Hicum in ADS
Here the same parameter set was used as in Spectre.
The default parameter set gives similar results.
For T < 0°C a shift of the saturation region to higher Vce can be observed.
Simulation plot of ADS.
For T = -40°C (blue), 25°C (black), 125°C (red).
+-Ib
Vce
c
eb
Ib [uA] = 1, 2, 5, 8, 10, 15Vce = 0V to 3V
06/16/2004Arasch LagiesJörg BerknerRamana M.
MalladiKim M. Newton, Scott M. Parker
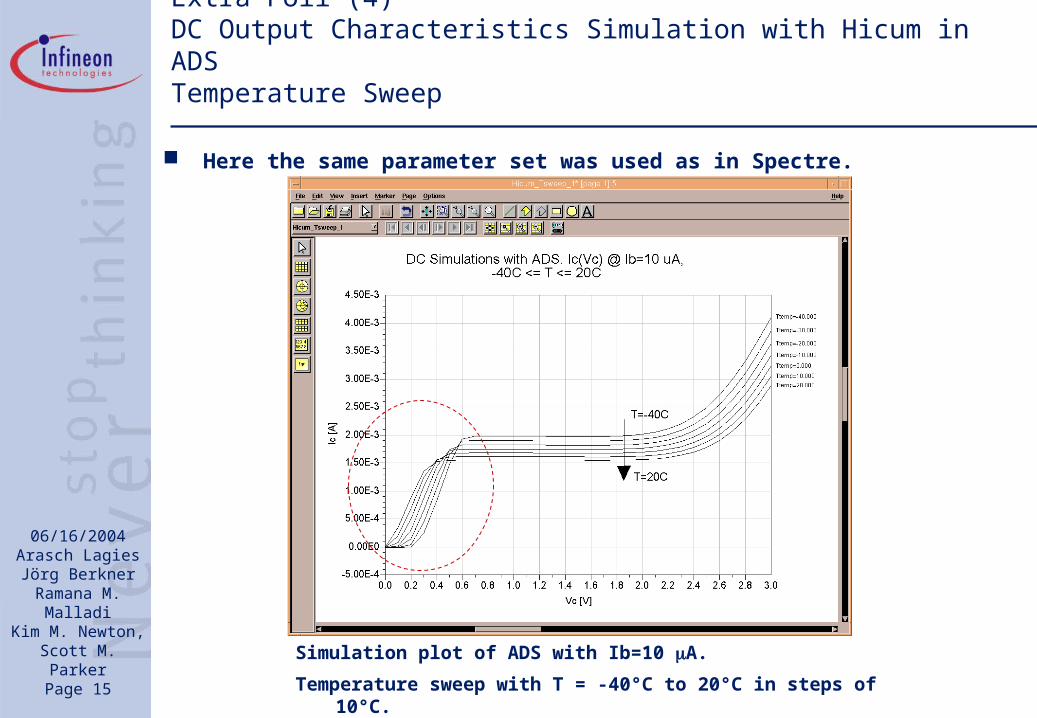
Page 15Simulation plot of ADS with Ib=10 A.
Temperature sweep with T = -40°C to 20°C in steps of 10°C.
Extra Foil (4)DC Output Characteristics Simulation with Hicum in ADSTemperature Sweep
Here the same parameter set was used as in Spectre.
06/16/2004Arasch LagiesJörg BerknerRamana M.
MalladiKim M. Newton, Scott M. Parker
Page 16
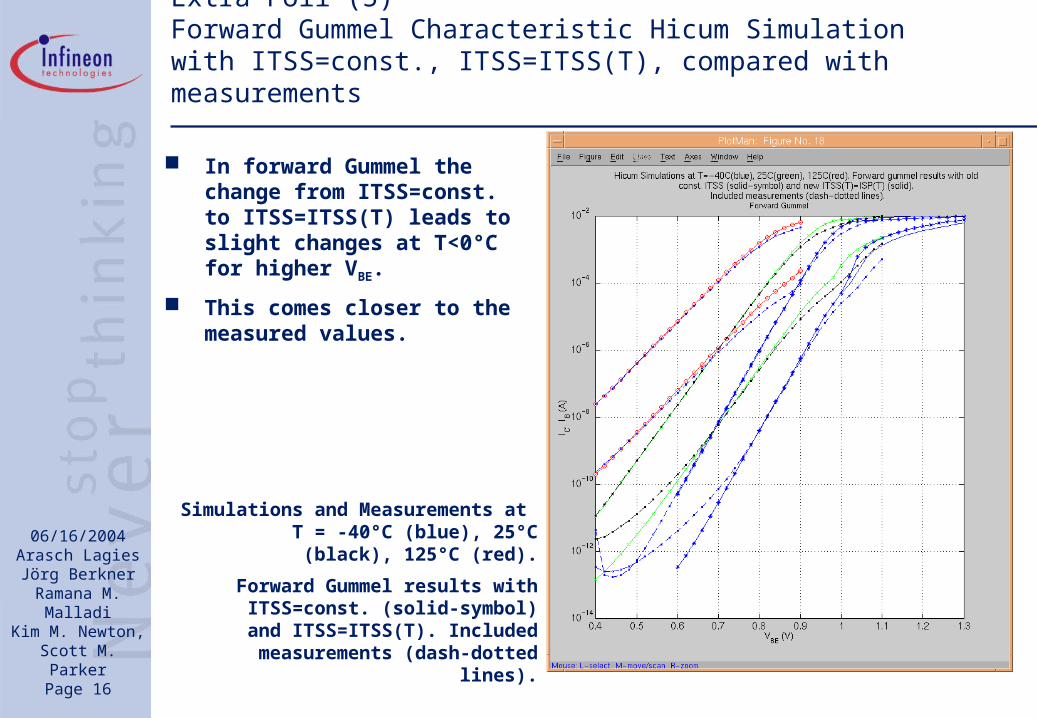
Extra Foil (5)Forward Gummel Characteristic Hicum Simulation with ITSS=const., ITSS=ITSS(T), compared with measurements
In forward Gummel the change from ITSS=const. to ITSS=ITSS(T) leads to slight changes at T<0°C for higher VBE.
This comes closer to the measured values.
Simulations and Measurements at T = -40°C (blue), 25°C (black), 125°C
(red).
Forward Gummel results with ITSS=const. (solid-symbol) and
ITSS=ITSS(T). Included measurements (dash-dotted lines).