N-1759 NCEL Note By Sponsored Explosives Safety · PDF fileDepartment of Defense Explosives...
188
N-1759 September 1986 NCEL By Robert N. Murtha Technical Note Sponsored By Department of Defense Explosives Safety Board BLAST DESIGN PROCEDURE FOR tFLAT SLAB STRUCTURES ABSTRACT 'A general step-by-step procedure was developed for designing flat slab structures to resist dynamic blast loads. The procedure is consistent with the Navy's current blast-resistant design manual NAVFAC P-397 and is based on an equivalent single-degree-of-freedom (SDOF) model of a flat slab. The distribution of reinforcement throughout the slab is based on the elastic distribution of design moments outlined by the American Concrete Institute (ACl). The step-by-step procedure is easily adapted to flat slabs of any configuration and considers both flexural and shear behavior. C)- NAVAL CIVIL ENGINEERING LABORATORY PORT HUENEME, CALIFORNIA 93043 Approved for public release; distributon is unlimited.
-
Upload
truongxuyen -
Category
Documents
-
view
225 -
download
3
Transcript of N-1759 NCEL Note By Sponsored Explosives Safety · PDF fileDepartment of Defense Explosives...

N-1759September 1986
NCEL By Robert N. Murtha
Technical Note Sponsored By Department of DefenseExplosives Safety Board
BLAST DESIGN PROCEDURE FORtFLAT SLAB STRUCTURES
ABSTRACT 'A general step-by-step procedure was developed for designingflat slab structures to resist dynamic blast loads. The procedure is consistentwith the Navy's current blast-resistant design manual NAVFAC P-397 and isbased on an equivalent single-degree-of-freedom (SDOF) model of a flat slab.The distribution of reinforcement throughout the slab is based on the elasticdistribution of design moments outlined by the American Concrete Institute(ACl). The step-by-step procedure is easily adapted to flat slabs of anyconfiguration and considers both flexural and shear behavior.
C)-
NAVAL CIVIL ENGINEERING LABORATORY PORT HUENEME, CALIFORNIA 93043
Approved for public release; distributon is unlimited.

UnclassifiedSECURITY CLASSIFICATION 0' T.iS PAGE (When D618 Fned) - A
REPORT DCUMENTATION READ INSTRUCTIONSPAGE BEFORE COMPLETING FORMI REPORT NUMBER GOVT ACCESSION NO. 3 RECIPIENT'S CATALOG NUMBER
TN-1759 DN3872744 TITLE Ad S4b0:eI TYPE OF REPORT & PERIOD COVERED
BLAST DESIGN PROCEDURE FOR Final; Jan 1983 - Sep 1984FLAT SLAB STRUCTURES P PERFORMING ORG REPORT NUMBER
AU T.OR(. B CONTRACT OR GRANT NUMBER(s)
Robert N. Murtha
2 PERFORMING ORGANIZATION NAME AND ADDRESS 10 PROGRAM ELEMENT. PROJECT, TASK
NAVAL CIVIL ENGINEERING LABORATORY AREA 6 WORK UNIT NUMBERS
Port Hueneme, California 93043-5003 51-112
1 CONTROLLING OFFICE NAME AND ADDRESS 12 REPORT DATE
Department of Defense Explosives Safety Board September 1986Alexandria, Virginia 22331 187 UMBER OF PASES
14 MONITORING AGENCY NAME & AODRESSUI d-l1een Irom ConrcolInj Ollee) 15 SECURITY CLASS (o rho .Port)
Unclassified
IS. DECLASSI FIC ATION DOWNGRADINGSCHEDULE
I DISTRIBUTION STATEMENT (,f til, Report)
Approved for public release; distribution unlimited.
17 DISTRIBUTION STATEMENT (of Ihe abst erf entpred i0 Stock 20. it different ftom Reporfj
18 SUPPLEMENTARY NOTES
19 KEY WORDS (C.on-.. on Ie -ese side -y nec-nnr' And denfl, by block n-.ber)
Blast design, flat slab structures, explosives safety
20 ABSTRACT (Con,non - - .e..... de It n.ce..-y nd Iden, y b, ob n151-h S)
A general step-by-step procedure was developed for designing flat slab structures toresist dynamic blast loads. The procedure is consistent with the Navy's current blast-resistantdesign manual NAVFAC P-397 and is based on an equivalent single-degree-of-freedom (SDOF)model of a flat slab. The distribution of reinforcement throughout the slab is based on theelastic distribution of design moments outlined by the American Concrete Institute (ACI).The step-by-step procedure is easily . lapted to flat slabs of any configuration and considersboth flexural and shear behavior.
DD JA,73, 1473 ED, TION oF N .0,, I5 ,s OBSOLETE UnclassifiedSECURITY CLASSIFICATION OF THIS PAGE AW*%, V-i1 FnrC-II

UnclassifiedSECURITY CLASSIFICATION OF THIS PAGE(Whe D.. Entered)
Library Card------------------------------ - ---- -- -- -- ---
I Naval Civil Engineering LaboratoryBLAST DESIGN PROCEDURE FOR FLAT SLAB STRUCTURES(Final), by Robert N. MurthaTN-1759 187 pp illus September 1986 Unclassified
1. Blast design 2. Flat slab structures I. 51-112
A general step-by-step procedure was developed for designing flat slab structures to resistdynamic blast loads. The procedure is consistent with the Navy's current blast-resistant designmanual NAVFAC P-397 and is based on an equivalent single-degree-of-freedom (SDOF) modelof a flat slab. The distribution of reinforcement throughout the slab is based on the elasticdistribution of design moments outlined by the American Concrete Institute (ACI). The step-by-step procedure is easily adapted to flat slabs of any configuration and considers both flexural
and shear behavior.
Unclassified
SECURITY CLASSIFICATION OF THIS PAGE'When D.I F.,,-d)

CONTENTS
Page
INTRODUCTION .. .......... ...................
BACKGROUND .. .......... ................... I
SCOPE AND APPROACH .. ......... ................ 2
DESCRIPTION OF FLAT SLAB. .. ................. ... 3
EQUIVALENT SDOF MODEL ... ................ ..... 4
Ultimate Unit Flexural Resistance .. .......... .... 6Equivalent Elastic Unit Stiffness. ... ............ 10Effective Unit Mass .. .......... ........... 12
PANEL DEFINITION .. ......... ................. 15
DESIGN CRITERIA. .......... ................. 16
Ultimate Unit Moment Capacity. ... .............. 16Ultimate Shear Strength .. ......... .......... 17Allowable Deflections .. ........... ......... 19
WALL DESIGN ... ................ .......... 20
COLUMN DESIGN ... ................ ......... 20
DETAILING OF REINFORCEMENT .. .......... .......... 21
DESIGN PROCEDURE... ................ ....... 22
EXAMIPLE PROBLEM...........................27
DISCUSSION .. .................. ........... 56
REFERENCES. ............................
APPENDIXES
A - ACI Elastic Distribution of Reinforcement. ... ..... A-1B - Ultimate Unit Flexural Resistance for Flat Slab. ... .. B-1C - Effective Unit Mass for Flat Slab . . .......... C-1D - Column Design. ...................... D-1
r
V

INTRODUCTION
Many explosive storage magazines with flat slab roofs, such as the
Navy Type IIB magazine, are in use by the Navy, but at the relatively
large, nonstandard magazine separation distances required by NAVSEA OP-5
(Ref 1). Since box-type flat slab roof magazines are popular with
operations personnel, many new magazines will be of this design. In
order to reduce the land requirements, these new magazines will be
designed to withstand the larger blast loads associated with the shorter
standard magazine separation distances in Reference 1. However, the
Navy's current blast-resistant design manual, NAVFAC P-397 (Ref 2), does
not contain a design procedure for flat slabs. Therefore, the objective
of this report was to develop and document the procedures for designing
flat slab structures to resist dynamic blast loads. The work discussed
in this report was sponsored by the Department of Defense Explosives
Safety Board and is part of the Naval Civil Engineering Laboratory's
explosives safety program supporting ordnance logistics to the Fleet.
BACKGROUND
NAVFAC P-397 presents methods of design for protective construction
used in facilities for the storage of explosive materials. The primary
objectives of this manual were to establish design procedures and construc-
tion techniques whereby propagation of explosions or mass detonations
would be prevented and protection for personnel and valuable equipment
would be provided. The objectives are based upon the results of numerous
full- and small-scale structural response and explosive effects tests.
Questions about the safety of the older Type IIB design and uncertainties
in the design of a new Type A magazine resulted in the tests of 1/2-scale
models of these magazines in ESKIMO VI (Ref 3 and 4). The results of
ESKIMO VI and tests at U.S. Army Waterways Experiment Station (Ref 5)

clearly demonstrated that the existing (pre-1980) design procedure for
flat slab roofs provided an excessive margin of safety against failure
from design blast loads. A preliminary blast design procedure, using
test results and analysis methods, was developed in 1981 by NCEL for
safe and efficient flat slab structures (Ref 6). This procedure was
expanded by Anunann and Whitney Consulting Engineers (Ref 7) to include
requirements on the design of columns, column capitals, drop panels,
elastic distribution of reinforcement , and the calculation of stiffness
and deflection. The procedure was then used by Annann and Whitney in
the design of a typical flat slab box magazine with two interior circular
columns and continuous exterior walls.
SCOPE AND APPROACH
The primary purpose of this study was to develop and document a
general design procedure for flat slab structures subjected to blast
loads. Eventually this procedure would be implemented into NAVFAC
P-397. The structures were to be limited to single-story, box-type
configurations with continuous exterior walls. There was to be no limit
on the number of continuous spans in any direction, but each panel had
to be rectangular and have its ratio of longer to shorter span not
* greater that 2.0.
The analysis portion of the design would use the same basic theory,
* most of the same notation, and many of the same equations that were used
in NAVFAC P-397. Thus, a working knowledge of P-397 would be very
important in understanding the design procedures to be outlined in this
report. An equivalent elastic-plastic, single-degree-of-freedom (SDOF)
model of the flat slab would form the basis of the design. Its ultimate
flexural resistance would be determined from "yield-line" theory using a
collapse mechanism similar to that found by tests. Response of the
system could then be found using equations and charts in NAVFAC P-397
for idealized impulse or triangular loads, or with numerical integration
of the equations of motion for more complicated loading functions.
Since the prediction of the response of reinforced-concrete structures
to dynamic loads is relatively inexact, simplifying assumptions were to
2

be made, when appropriate, to facilitate the design process. Results of
two-way and flat slab tests were to be used to establish flexural failure
criteria that would limit the maximum deflection and support rotation of
the structure. Sufficient shear capacity must then be provided to
preclude premature shear failure and allow development of the flexural
capacity of the flat slab.
An important aspect of the design was the use of the ACT (Ref 8)
published elastic factored moment distribution for initial selection of
the reinforcement throughout the flat slab. Yield-line theory allows
freedom in the choice of the reinforcement arrangement; however, an
elastic distribution is recommended for several reasons:
" The design is more economical.
" Better service load behavior is obtained in regards to cracking,
especially when the design blast loads are relatively low in
relation to the service loads.
" Moment distribution required to achieve the design configuration
is minimized.
" With the required concentration of the reinforcement in the
column strips, the possibility of failure by localized yield
patterns is remote.
A detailed discussion of this elastic distribution is contained in
Appendix A.
DESCRIPTION OF FLAT SLAB
In reinforced-concrete buildings, slabs are used to provide flat,
useful surfaces. A reinforced-concrete slab is a broad, flat plate,
usually horizontal, with top and bottom surfaces parallel or nearly so.
By definition, a flat slab structure consists of a slab built mono-
lithically with columns and supported directly by these columns without
3

- , :rrr W lu -
the aid of beams and girders. The flat slab system analyzed in this
report has continuous monolithic exterior walls. When the ratio, 0, of
the long span, L, to the the short span, S, as shown in Figure 1(a), is
less than 2, the deflected surface becomes one of double curvature. The
roof load is then carried in both directions to the four supporting
columns of the panel. The column tends to punch upward through the
slab, and the inclined cracking arising from the punching shear must be
prevented. Thus, it is common to enlarge the top of the column in the
shape of an inverted frustum, known as the column "capital." Further
shear (inclined cracking) resistance may be obtained by thickening the
slab in the vicinity of the column; this thickened portion is known as
the "drop panel" or simply the "drop" (see Figure 1(b)). The columns
and column capitals may be either round or square in cross section, but
round column capitals are preferred to avoid shear stress concentrations.
However, for calculational purposes, the circular capital is sometimes
converted to an equivalent square capital via the following etuality:
d2 24 = c
where: d = capital diameter (in.)
c equivalent square length (in.)
Therefore,
c =lr1d = 0.89 d (1)
EQUIVALENT SDOF MODEL
As stated earlier, the design method is based on the elasticplastic
analysis of a single-degree-of-freedom (SDOF) representation of the flat
slab. The following SDOF parameters are required to fully describe the
flat slab behavior:
4
S ..r-

e Ultimate unit flexural resistance, ru, (psi) of the actual
system.
* Equivalent un4t stiffness, KE, (psi/in.) of the actual system.
* Effective unit masses, mef , (lb-sec2/in. 3) of the equivalent
SDOF system in the elastic range and in the plastic range.
The effective natural period of vibration of the SDOF system is then
given by:
T = 2 K (2)n E
Structures designed for high pressure loads at short scaled distances,
such as storage magazines, will generally be sensitive to impulse loading.
The maximum response, Xm, of structural elements that are sensitive to
just the impulse loading (area under the pressure-time load history) and
that are allowed large deflections (maximum support rotations, 0M,
greater than 5 deg) can be determined from the impulse loading, i the
effective unit mass, mef, in the plastic range, and the ultimate unit
resistance, r . That is,
2
x - 2 (3)m 2 mef ru
where: X = maximum transient deflection (in.)
At allowable support rotations less than 5 degrees and for pressure-
sensitive structures, the elasto-plastic portion of the resistance
deflection curve must also be determined and used in the response calcula-
tions. Response of the structure can be found using charts in P-397 for
idealized impulse or triangular loads, or with numerical integration of
the equations of motion for more complicated loading functions.
5
.......

Ultimate Unit Flexural Resistance
The ultimate unit flexural resistance is the static uniform pressure
*load, r u(psi), that the structural element can sustain during plastic
yielding of the collapse mechanism. This resistance is assumed to
remain essentially constant over a wide range of deflection (0 m< 12 deg).
The r u value defines the plastic portion of the resistance deflection
curve (see Figure 2). A conservative lower bound can be determined
using yield-line procedures (Ref 9 and 10).
The ultimate uniform resistance is a function of the amount and
distribution of the reinforcement (i.e., moment capacities of the slab
strips), the geometry of the slab, and the support conditions. A yield-
.N. line analysis can be used to determine ru in terms of these parameters.
Since in-plane compression forces and membrane tensile forces are not
considered, the ultimate resistance determined from a yield-line analysis
will generally be lower than the actual resistance.
Yield-line analysis is an ultimate load determination method in
which a flexural element is assumed to fail along lines that form a
valid failure mechanism. The first step is to assume a yield-line
pattern consistent with the stated conditions. The pattern will contain
one or more unknown dimensions that locate the positions of the yield
lines. Sectors between yield lines are assumed to rotate rigidly, and
ultimate resisting moments are assumed to develop along the full length
of all yield lines. Either equilibrium or energy (virtual work) methods
can be used to find the critical collapse mechanism and associated
minimum r u value. Though P-397 uses the equilibrium method, the complex-
ity of reinforcement in most flat slabs makes the energy method a better
choice for flat slab design.
Figure 3 shows examples of failure mechanisms found by test and
analysis to apply to flat slabs. In order to calculate the ultimate
unit resistance, equations for the internal work, E, and external work,
Ware written in terms of rut the moment capacities of the sections,
and the geometry of the structure and failure mechanism. The expression
for external work is then set equal to that for internal work, and the
resulting equation is solved for the minimum value of r u and the associ-
ated geometry of the failure mechanism.
6

The external work done by r on rotating sector i is:
W. = r A.A. (4)1 U I I
where: A. = area of sector i (in. 2)1
A. = deflertion of the c.g. of sector i (in.)
The total external work is the sum of the work done on each sector:
W = IW. = I r A. A. (5)1 U 1 1
For illustration, see Figure 4 which shows a quarter section of the flat
slab given in Figure 3(a). The external work on sector B is the sum of
the work done on the rectangular portion and the work done on the tri-
angular portion. That is,
WE r[S y )x A. + x (6)
u f 3 4
where: L = long span length (in.)
S = short span length (in.)
x,y = distances to yield lines (in.)
A = maximum deflection of the sector (in.)
The internal work, E, done by the actions at the yield lines is due
only to the bending moments as the support reactions do not undergo any
displacement and the work done by the shear forces is zero when summed
over the entire slab. The internal work, E.., for each yield line is
the rotational energy done by moment M rotating through 0. That is,n n
E. . = M 0 = m 0 £ (7)E n n n n n (
7

where: M n= moment capacity along yield line (in.-lb)n
m = unit moment capacity along yield line (in.-lb/in.)
0 rotation about yield line (radian)n
I- n = length of yield line (in.)n
The total internal work is the sum of the rotational energies for all
yield lines:
E = aE.. = X m e g (8)13 n n n
As stated earlier, the flat slab design is based on the ACT elastic
distribution of reinforcement. This distribution recognizes three
orthogonal bands (i.e., column, middle, exterior), each containing
different levels of reinforcement. Thus, it is more convenient to write
the internal work in terms of moments (Mx, My ) and rotations (0x, 0 y) in
the principal reinforcement directions x and y. That is,
i- x x yy
or
Eij mx s 0x + my s 0y (10)
where: m , = ultimate unit moment capacities in the x and yy directions (in.-lb/in.)
SyS x = lengths of the yield line in the y and x directionsover which m and m apply (in.)x y
0 ,0 = relative rotations about the yield lines in the xx' y and y directions
As an example, consider the structure in Figure 4 with rotating sectors A
through D, areas 1 to 9 of equal moment capacities (in bands of width s
defined by dashed lines) and geometry defined by L, S, c, x, and y. The
internal work along yield line AB (yield line between sectors A and B)
A is
8
*7*" . .. . . .' . ~~

EAB = m9 x ey - eB + m 5 x ( ey GB
_ + c D(I)t
+ [m9y (sex tY)D + m5y ( 2 ex) GDJ
where: m9 = unit moment capacity in x direction in area 9
5x - unit moment capacity in x direction in area 5
m = unit moment capacity in y direction in area 9
m9y unit moment capacity in y direction in area 9
n5 y = unit moment capacity in y direction in area 5
Substituting eB = a/x and 6D = '/y
E A 9mx - +~ M2 -- SeEAB x A-r 9 (ey 2) m5x (X 2-- Say)]
y + m 9y sex -T ) 5y (x +2S. sex)]
Likewise, along line BD:
Scy + y 8
EB = [m 2 kx +m s2 -T 6~ )](A + GB) (13)EBD + m~x 2Smsx s2 c2 ~
Substituting GA = A/(L - x - c) and 0B A/x
S/EScy + m S - cy -c A +A
EBD = [m2x2 m5x (--- y2 L -x - c
(14)
The external work on all sectors and internal work on all positive
and negative yield lines are determined and summed. An equation for r
is written from:
W= m (15)
x A YS- V-) r + " =3 u " mx ASe -- x + " '
(2 9 mx (sey i)T
9
-1 L1&1lL

r -"9X (sey 2)' (6
Variables x and y are varied independently until r uis minimized. This
minimum solution provides the failure mechanism and the value of the
ultimate resistance, r.U A rapid determination of the solution can be
obtained using a programmable electronic calculator. A trial and error
procedure to solve for the minimum value of the resistance function, ru,
can be accomplished as follows:
* Start with both crack lines located close to the centerline of
the middle strip.
* Move one crack line, holding the other constant, in the direction
which minimizes the resistance function until r u begins to
increase.
* Hold the first crack line constant, and vary the second crack
line in the minimum direction until r ualso begins to increase.
e Once this minimum point is achieved, shift each crack line to
either side of the minimum location to check that a further
refined shifting of the crack line is not necessary to
minimize the resistance function.
It should be noted that if the crack line should shift out of the middle
strip, a new resistance function equation must be written and the procedure
then repeated. Appendix B contains detailed information on the determina-
tion of the ultimate unit flexural resistance for a flat slab.
Equiva lent Elastic Unit Stiffness
The elastic deflections for several points of an interior panel of
a flat slab are given by the general equation%
103

X C [rL 40 V2 )] /E a (17)
where: C = constant varying with panel aspect ratio L/S, the ratio ofsupport size c to the span length L, and the location withinthe panel.
E = modulus of elasticity of concrete = w1.5 33 fT-(psi)
w = unit weight of concrete (lb/ft3 )
f' = static ultimate compressive strength of concrete (psi)cIa = average of gross and cracked moments of inertia
4= (I + Ic)/2 (in. /in.)
I = moment of inertia of gross concrete sectiong
= (1/12)(t avg)3 (in. 4/in.)
I = moment of inertia of cracked concrete sectionc
= 5.5 p avg (davg)3 (in.4/in.)
t = average slab thickness within panel (in.)avg
Pavg average steel reinforcement ratio within panel
d = average effective depth within panel (in.)avg
V = Poisson's ratio of concrete
Values of the constant C are based on a finite difference method (Ref 11)
and are given in Table I for the center of the panel and the midpoints
of the long and short sides. The deflection for the center of the
interior panel is determined by using CC in the above expression. For
the corner, long and short side panels (Figure 1), no simplified solutions
for the center deflections are currently available. Generally, the
deflections for the side panels will be smaller than the deflection of
the interior panel because of the restraining effect of the exterior
walls. These deflections can be approximated by using the following
expressions:
CSLong Side Panel C = C C- - (18)
12

C-
Short Side Panel C = CC (19)C 2
where the values of CC, CSI and CL are those for the interior panel.
When the maximum allowable deflection of the panel is small (allow-
able support rotation < I deg), the dynamic response of the system will
be more sensitive to the elastic stiffness, and it will be necessary to
obtain a better value of the elastic deflections by using another pro-
cedure such as the equivalent frame method of Reference 12.
The equivalent elastic unit stiffness of a flat slab panel is given
by:
E IKE = ru/X E 4 c a 2 (20)
C L (I-
Because of the complexity of the behavior, the elastic-plastic transition
range will be ignored. That is, no method will be given to determine
the stiffness within this range. All dynamic response calculations will
use the previously given elastic stiffness and deflection relationships
rather than an "effective" bilinear resistance function based on the
actual non-bilinear function (e.g., fixed-fixed beam representation).
Effective Unit Mass
The mass of an equivalent SDOF system is not the actual mass of the
structure since movement of all elements of the mass is not equal. The
actual mass of the structure must be replaced by an effective mass, mef ,the mass of the equivalent single-degree-of-freedom system. The value
of the effective mass is dependent upon the deflected shape of the
structural member, varying with the type of spanning, end conditions,
etc., and therefore is different in the elastic, elasto-plastic, and
plastic ranges of behavior. The effective unit mass of the equivalent
system is related to the unit mass of the actual system by:
mef LM m (21)
12

where: mef= effective unit mass (lb-sec 2/in. 3)
m = actual unit mass (lb-sec2 /in. 3)
KLM = load-mass factor
For a flat slab without drop panels, the actual unit mass equals:
M = slab mob Pslab tslab Pb tob (22)
where: mslab = unit mass of slab (lb-sec2/in. 3)
mob = unit mass of soil overburden (lb-sec 2/in. 3 )
Pslab = mass density of slab (lb-sec /in. )
tslab = thickness of slab (in.)
Pub = mass density of soil overburden (lb-sec2/in. )
tub = thickness of soil overburden (in.)
For a flat slab with drop panels, the actual unit mass must be obtained
from this expression:
M = MT/AT (23)
where: M = total mass (slab + soil overburdenT + drop panel) (lb-sec 2/in.)
AT = total slab area (in.2)
Note that these quantities represent that portion of the structure which
rotates (deflects). Therefore, the mass/area inside of the equivalent
square capital and outside of the perimeter yield line (wall haunch) are %
excluded from the calculations.
No data are currently available to determine the load-mass factor,
K in the elastic range of behavior. Reference 13 gives a value ofLMI'0.64 for a typical interior panel on point supports with L/S = 1. This
value is reasonably close to the elastic value (0.61) for a square
fixed-ended panel. It is therefore recommended that the following
equation for KLM listed in Table 6-I of Reference 2 for two-way elements
with all supports fixed be used for the appropriate L/S ratio for all
panels:
13
.........

= 0.61+0.16 (LS- 1) 1<L/S<2 (24)
The load-mass factor in the plastic range is determined using a
procedure outlined in Section 6.6 of Reference 2. The procedure uses
the equation of angular motion for sections rotating about supports as
its basis. This linkage motion results from an assumption of zero
moment or curvature changes between plastic hinges under increasing
deflection. In Figure 5, a portion of a two-way element bounded by the
support and the yield line is shown. The load-mass factor, KLM, for
this sector is:
ImKIM = c L1 M (25)
where: I = mass moment of inertia about the axis of rotation ABm (lb-in._sec 2)
c= distance from the resultant applied load F to the axisof rotation AB (in.)
L = total length of sector normal to axis of rotation AB (in.)
M = total mass of sector (lb-sec2/in.)
When an element (such as a flat slab with drop panels and soil cover) is
composed of several sectors, each sector must be considered separately,
and the contributions then summed to determine the load-mass factor for
the entire element. That is,
7(I /c L1)m 1
K =- (26)LII IN
For elements of constant depth and therefore of constant unit mass (such
as a flat slab without drop panels but with uniform soil cover), the
load-mass factor equals:
71(I/c LI): " KI - (27)
14
.N4

where: I = area moment of inertia about the axis of rotation (in. 4
A = total area of sector (in.2 )
The plastic load-mass factors for typical cross sections (rectangle,
triangle) are shown in Figure 6. Appendix C contains detailed information
on the determination of both the actual unit mass, m, and the plastic
load-mass factor, KLM, for flat slabs.
PANEL DEFINITION
The development of the blast design procedure for flat slab struc-
tures led to the recognition of the following four panel types:
1. Corner panel, C2. Long side panel (panel side common to exterior short side), LS
3. Short side panel (panel side common to exterior long side), SS
4. Interior panel, I
These panels are depicted in Figure la for a portion of a typical flat
slab structure. It is possible to define any arbitrarily configured
flat slab structure as a combination of these four panel types. Because
of symmetry, the design/analysis can be simplified if the side and
interior panels are further divided into subpanels. Figure 7 shows the
make-up of five different flat slab configurations. Each of the divided
subpanels is equal for the flat slabs shown in Figures 7a through 7d.
However, for the 3x4 flat slab (Figure 7e), the distribution of the
reinforcement necessitates an A and B subpanel designation for the
interior and long side panels. That is, LS/A and LS/B are not identical
(different moment distribution and dimensions). By using symmetry in
the design procedure, the flat slab can be reduced to a quarter of the
15

total slab. In this report the lower right quadrant is used. Figure 8
shows the symmetric quadrants for the five flat slab configurations of
Figure 7.
DESIGN CRITERIA
Ultimate Unit Moment Capacity
The ultimate unit moment capacity of structural sections is based
on the ultimate strength design methods of the ACI Building Code (Ref 8)
with the strength reduction factor, 0, omitted as in Reference 2. For
structures that undergo support rotations less than 2 degrees, the
static unit moment resistance, mu, of a Type I cross section (where the
cover over the reinforcement on both surfaces remains intact) may be
used:
As fs
Mu - (d - a2) (28)
where: A = area of tension reinforcement within the width b (in.2 )
s
f = static design stress for reinforcement (psi)
a = depth of equivalent rectangular stress block (in.)
= A f /0.85 b f's s c
b = width of compression face (in.)
d : distance from extreme compression fiber to centroid oftension reinforcement (in.)
= static ultimate compressive strength of concrete (psi)c
For structures that undergo rotations greater than 2 degrees, the static
unit moment capacity of a Type II or Type III cross section may be used:
A f d
m S s c A <A' (29)u b s - s
16

where: A' = area of compression reinforcement (in.2)S
d c= distance between centroids of the compression and theC tension reinforcement (in.)
The static design stress, f., can be approximated (as in Ref 2) with a
weighted average of the yield strength, f y, and ultimate strength, f U
depending on the amount of deflection or rotation of the element (see
Table 2).The dynamic moment capacity of the reinforced-concrete sections is
determined from the above equations by substituting the dynamic design
stress for the reinforcement, f d'for f s, and the dynamic ultimate
compressive strength of concrete, f' c for f', as applicable, where
Vc (DIF) f' (30)
f (DIF) f (31)
Dynamic increase factors, DIF, for concrete and reinforcing steel are
reproduced from Reference 2 in Table 3. It is recommended that no
dynamic stress increases be considered when determining shear or bond
capacities.
Ultimate Shear Strength
The shear resistance must be sufficient to develop fully the flexural
capacity of the slab at large rotations and deflections. The conservative
approach in the evaluation of the ultimate resistance (neglecting in-plane
compression and membrane tensile forces) requires a conservative evaluation
of the shear capacity.
Therefore, the following recommended equations for calculating the
shear capacity are significantly lower than those given in Reference 8.
In general, shear reinforcement of the slab is to be avoided. The use
of a thicker slab is a less costly alternative.The nominal beam shear strength, vc, (psi) at a distance d fromI
the face of the wall support is:
17

v = 1.9 fi,/+ 2,500 p < 2.28V/f, (32)
where p =A /b d
The above expression for the maximum value of v ccorresponds to a 20 percent
increase in the 1.9 factor. This value of 2.28 is used, rather than the
3.5 factor of the ACI Building Code (ACI Section 11.3.2.1), in order to
provide a lower bound on the test data used in developing this equation.
k Beam shears should also be checked at the column capitals and at the
drop panels in both the longitudinal and transverse directions.
The shear strength of the slab around the column in two-way action
must also be checked. In two-way action, potential diagonal cracking
may occur along a truncated cone or pyramid around the column. Thus,
the critical section is located so its periphery, b 0, is at a distance
equal to one-half of the effective depth through the drop from the
periphery of the column capital, and also at a distance equal to one-half
of the effective depth outside of the drop from the periphery of the
drop. Where no drop is used, of course, there would be only one critical
section for two-way action. The nominal punching shear strength at
these locations is:
vc = .ovc(34)
This is identical to the ACI recommended value (ACI Section 11.11.2).
Design of all cross sections subject to shear shall be based on ACI
equation 11-1:
v < 0Vc(35)
-~where V uis the factored shear force at the sections considered, V cis
the nominal shear strength provided by the concrete, and 0 is the ACI
strength reduction factor for shear (~=0.85). The 0 factor is main-
tained to ensure against a premature failure due to shear which would
substantially reduce the overall blast resistant capacity of the slab.
Calculation of the factored shear force at any section should be made
using the tributary area, A, (in.2) defined by the yield lines and the
critical shear section. That is:
18

V =r A (36)
The nominal shear strength is given by these equations:
V =v cb wd (Beam shear) (37)
V c= v cb 0d (Punching shear) (38)
where: b = critical section length on which shear stress acts (in.)w
bo = perimeter of critical section for slabs (in.)
d = depth of section (in.)
The critical locations for the shear analysis are shown in Figure 9 for
a quarter panel of a flat slab with central column (Figure 3a).
Allowable Deflections
Reference 14 recommended a 12-degree maximum support rotation for
* laterally unrestrained two-way slabs with L/S ratios less than 2. The
static flat slab test in Reference 5 also showed that 12-degree rotations
can be attained while maintaining the ultimate resistance. Based on the
above, the rotation corresponding to the deflection at incipient failure
is 12 degrees. The ultimate deflection is therefore:
X m= L .Lntan 12' = 0.2L mi (39)
where L mi is the shortest sector length rotating through 12 degrees.
The maximum allowable deflections permitted in the design of a structure
vary according to the protection category required. The following
maximum values of the support rotation angle, e, were recommended in
Reference 7:
* Personnel shelter e = 2 degrees
* Equipment shelter e 5 degrees
* Explosives magazine e = 8 degrees
These values are also listed in Table 4. 5
19

i%
WALL DESIGN
It was shown in the ESKIMO test series that 12-inch concrete side-
walls and backwalls, reinforced to retain the earth backfill, are adequate
to resist blast loads at standard magazine separation distances. There-
fore, if these minimums are maintained, these walls need not be checked
for blast loads.
COLUMN DESIGN
The columns are designed to resist the axial load and unbalanced
moment resulting from the flat slab blast loads and the structure dead
load. The columns are designed in accordance with the criteria presented
in the ACI Code, Reference 8. Slenderness effects must be included, if
applicable, and it is assumed that there is no sidesway since such
motion is prevented by the rigidity of the roof slab as a diaphragm and
the end shear walls. Fixity at the base of the column is determined
from the relative stiffnesses of the column and column footing.
Design of the column shall be based on the ACI equation:
P < P (40)u - n
where P is the factored axial load at given eccentricity, P is theu n
nominal axial load strength at given eccentricity, and * is the ACI
strength reduction factor for axial compression ( varies from 0.70 to
0.90).
The axial load and moment at the top of the column (the critical
section is at the bottom of the capital) are obtained from the flat slab
shear forces acting on the perimeter of the column capital plus the load
on the tributary area of the equivalent square capital. The dynamic
load is essentially applied instantaneously to the column and remains
constant for a duration of t (time of maximum response for flat slab
obtained from the flat slab analysis). The column can then be idealized
as an EL-PL SDOF system with an allowable maximum ductility, X /XE, of
3.0.
20
, . -~ . . . . - - °. - -°

Useful design procedures and design charts are presented in ACI
publication SP-17A (Ref 15). Appendix D contains detailed information
on the design of a column.
DETAILING OF REINFORCEMENT
Proper detailing of the reinforcement is required to ensure adequate
structural behavior (see Figure 10). A portion of both the top and
bottom reinforcement must be continuous across the roof, adequately
anchored and spliced, if necessary. Splice locations should be staggered,
preferably on opposite sides of the columns and at opposite ends of the
slab spans. Splices should always be located in regions of low stress
and the number of splices minimized by using the longest rebar possible.
All splices of adjacent parallel bars must be staggered to prevent the
formation of a local plane of weakness. Added rebar, such as that at
the columns, should be discontinued at staggered locations also.
Additional reinforcement at the following two critical locations
will also assist in maintaining the integrity of the structure:
* Provide haunches and diagonal bars at the intersection of the
exterior wall and roof slab.
* Provide radial diagonal bars enclosed in hoops at the surface of
the column capitals.
To ensure proper structural behavior under dynamic loads and also
to minimize excessive deformations under conventional loads, the minimum
area of flexural reinforcement on each face should be at least equal to
that specified in Reference 8 (ACI 7.12.2) for shrinkage and temperature
reinforcement. That is,
Minimum A 0.0010 b t each face (Grade 40 or 50)
Minimum A s 0.0009 b t each face (Grade 60)
21

DESIGN PROCEDURE
A summary of the flat slab design procedure is provided here.
Problem: Design a flat slab subjected to a given blast loading
Required Information.
Slab geometry (number of spans, overall dimensions)
Pressure time loading
Material properties
*Concrete
*Soil overburden
*Steel reinforcement
Design criteria
*Minimum static design stress (Table 2)
*Dynamic increase factors (Table 3)
e Deflection failure criteria (Table 4)
.... Strength reduction factors
Assumptions:
Capital size
Depth of overburden
Wall/slab thickness ratio
Solution:
Step 1: Distribute the moments in the slab based on elastic responseusing the direct-design method outlined in ACI 318-77. (SeeAppendix A for detailed discussion.)
Step 2: Determine yield-lne locations and ultimate resistancerelationship using energy principles. (See Appendix Bfor a detailed discussion.)
Step 3: Establish maximum allowable displacement based onfailure defie-tion criteria.
X L tan 6m min m
22

Step 4: Assume trial slab thickness based on minimum ACI criteria.
tmi . > Lf +- (41)
Step 5: Perform dynamic analysis on SDOF representation of the slab.
a. Determine SDOF parameters.
Elastic stiffness (Assume I = 0)c
E IKE 4 c a
C L(1 - V)
Elastic load-mass factor
KLM = 0.61 + 0.16L
L(S ( 1)
Plastic load-mass factor
K - I MLM c L I
Actual unit mass
M = Pob tob + Pslab tslab
Natural time period (elastic range)
*K mT = 2n /K_ m
n
b. Check loading for definition of impulse.
tdd < 0.2 (42)Tn
c. Determine required dynamic ultimate unit resistance forimpulse sensitive structure using mef for the plastic range.
2b
r uud -2 mef Xm
d. Determine dead load.
rdl = g m (43)
23
, .. ,- , v . . ,' :, ; v ,.'" ,"". "" , " . .-.' . ". - . "

e. Determine the equivalent static required ultimate unit resis-tance of the slab necessary to flexurally resist both the deadload and the dynamic loading (i.e., must adjust rud).
~rud
uf = DIF dl (44)
f. Determine the actual dynamic flexural ultimate unit resistanceof the slab. Use Equation 45 to determine the factored shearforce for shear design calculations (ACI 11-1).
ruv = DIF (r ) (45)
g. Determine time to reach maximum response.
t b (46)m rud
Step 6: Modify slab thickness or steel percentage based upon requiredACI minimum steel percentage.
a. Determine required moment capacity and steel percentage atminimum moment section. That is,
m = f(r uf)
mreq f(me )
(As )req f(mreq )
Preq f(As)req
b. Compare with ACI minimum value, pmin' in both L and S directions(ACI 7.12.2).
Increase slab thickness. Return to Step 5.
If preq > Pmin or
Go to Step 12.
If possible, decrease slab thickness.(t (t must be equal to or greater than tmi.)Return to Step 5.
If preq < p min Otherwise,
Must use pmin at all locations where
Preq < Pmin" Go to Step 7.
24

Step 7: Revise distribution of moments at all locations where preq < pmin*
Step 8: Re-determine yield-line locations and value of ultimate resistancefor a given slab geometry using energy principles.
Step 9: Re-establish maximum allowable deflection.
Step 10: Perform another dynamic analysis on SDOF representation of slab.
Step 11: Re-check minimum steel percentages.
a. Determine required moment capacity and steel percentageat minimum moment section.
me f(ruf)
mreq f(me )
(As req = f(mreq )
Preq = f(As)req
b. Compare with ACI minimum value.
If Preq > Pmin {Go to Step 12.
Return to Step 7 if this is the firsttime through Step 11.
If Preq < Pmin or
Go to Step 12 if values are nearly identicaland this is not the first time through Step 11.
Step 12: Check beam shear at walls (within slab).
If Vu > *V c Increase slab thickness. Return to Step 5.
if V < *Vc Go to Step 13.
Step 13: Check punching shear at column capital (within slab).
If V > 0 V IGo to Step 14.
If V < 0 V cGo to Step 17.
Step 14: Design drop panel for punching shear; select dimensions andthickness of drop panel.
if V u< V c Go to Step 15.
U - ct

The following ACI requirements are applicable:
13.4.7.1: Drop panel shall extend in each direction from center-line of support a distance not less that 1/6 the span lengthmeasured from center-to-center of supports in that direction.Therefore,
L Ldp , 3
S Sdp 3 -
13.4.7.2: Projection of drop panel below the slab shall be atleast 1/4 the slab thickness beyond the drops. Therefore,
t > tslabdp - 4
13.4.7.3: In computing required slab reinforcement, the thick-ness of drop panel below the slab shall not be assumed greaterthat 1/4 the distance from edge of drop panel to edge of columnor column capital. Therefore,
td < Sdp-d
dp 8 where: d = capital diameter
When determining the steel area required for negative moment ina column strip with a drop panel, the smaller of the actual columnstrip width or the drop panel width is used. Therefore, it isrecommended that the width of the drop panel be set equal to orgreater than the column strip width. That is,
Ldp - cx
Sdp - cy
Step 15: Check punching shear at edge of drop panel (within slab).
Increase drop panel dimensions.Return to Step 15.
If V > V or
Increase slab thickness.Return to Step 5.
If V < ,V c Go to Step 16.u - c Go
26

Step 16: Check longitudinal and transverse beam shear at drop panel edge(within slab). (Unit width b = 1 ft)
Increase drop panel dimensions.Return to Step 16.
If V > V oru c
Increase slab thickness.Return to Step 5.
If V < V Go to Step 17.
Step 17: Check longitudinal and transverse beam shear at column capital(within drop panel). (Unit width b = 1 ft)
if V > V Increase drop panel thickness.u c Return to Step 17.
If V < V c Go to Step 18.
Step 18: Final design of slab.
a. Include drop panel mass in dynamic SDOF analysis if applicable.
b. Determine unit moments and steel areas.
c. Check all initial design assumptions (e.g., ot, OH).
Step 19: Design column.
Step 20: End.
The flow chart for the above design procedure is depicted in Table 5.
Because of the potential number of iterations necessary in the design of
the drop panel (size/thickness), the drop panel mass was not included in
the SDOF dynamic analysis until the very end (Step 18). However, it is
not necessary to redo all of the shear calculations with this new lower
ultimate resistance value.
EXAMPLE PROBLEM4.
Problem: Design a flat slab for an explosives magazine subjected to ablast load
27

Required Information:
Slab geometry (see Figure 11)
3 x 4 flat slab
L = 300 in.
S = 240 in.
H = 120 in.w
Loading
Triangular blast load
Peak pressure, B = 250 psi
Duration, td = 8 msec
Impulse, ib = 1,000 psi-msec
Material properties
" Concrete (slab, drop panel, capital, column)
p = 0.000217 ib-secZ/in.4
y = 145 pcf
V = 4,000 psi
Ec = (145)1" 5 (33) 14000 = 3.64 x 10⁶ psi
V = 0.17
" Overburden
p = 0.000150 lb-sec2/in.4
Y = 100 pcf
" Reinforcement (Grade 60)
f = 60,000 psify
Sfu = 90,000 psi
Design criteria
e Minimum static design stress (see Table 2)
f 1/2 (fy + f ) = 75,000 psi
28
- - . .* ~ 4 r v . .

o Dynamic increase factors (see Table 3)
DIF = 1.20, flexure reinforcement
DIF = 1.25, concrete compression
DIF = 1.00, concrete shear
o Allowable support rotation (see Table 4)
0 m 8 degrees (for explosives magazine)
Assumptions:
Capital size
Let a =0.20cap
d = ap L = (0.20)(300) =60 in. (diameter of capital)
c = 0.89 d = (0.89)(60) =53.4 in. (equivalent square capital)
Depth of overburden
Let t ob = 12 in.
Wall/slab thickness ratio
Let a = 1.0t
where at= twS /t slab ; t wL/Atslab
Solution:
Step 1: Distribute moments according to Appendix A. The distributionis shown in Figure 12 (reproduction of Figure A-9). The valuesof the unit moment coefficients are listed in Table 6 (reproduc-tion of Table A-7).
Step 2: Yield-line analysis according to Appendix B. The yield-linemechanism is shown in Figure 13 (reproduction of Figure B-2).The results of the analysis are listed in Table 7 (reproductionof Table B-11). That is,
a =u 10.102
x= 0.40
=' 0.30
z' 0.311
29q

Now, by definition:
m
u min ru L2
Therefore,
M
(ru ) n = 10.102 e = 0.0001122 m(300)2
Step 3: The calculated span lengths for the yield-line mechanism arelisted in Table 8. The minimum span length, Lmin' equals90.0 in. Therefore,
X = L tan 0 = 90.0 tan 8' = 12.65 in.m min m
Step 4: Assume trial slab thickness.
tm L (1 +3 = 1 + = 9.0 in.
Step 5: Perform dynamic analysis on SDOF representation of the slab.
a. Determine SDOF parameters.
Elastic stiffness
E Ic a
C L4 (1 -V 2)
where:
1_ 4I - = 9 = 30.4 in. /in.
(Approximation I = 0)c
CL 0.00155 = 0.00112C = CC -- - = 0.00189 - 2 .01
C 2 2
(See Table 1)
Because the minimum span length is in the shortside panel, use Equation 19. Therefore,
K = (3.64 x 10⁶ )(30.4) 12.6 psi/inKE 4 1. p2/n
(0.00112)(300)4 (1 - 0.17 2
30
low % ~-S~

Elastic load-mass factor
KLM = 0.61 + 0.16 (1.25 - 1) = 0.65
Plastic load-mass factor
KLM = 0.689 (from Appendix C)
Actual unit mass
M = Pob tob + Pslab tslab
= (0.00015)(12) + (0.000217)(9)
= 0.00375 lb-sec 2/in. 3 or 3,750 lb-msec 2/in. 3
Natural period
T = m 2n (O.65)(3,750)ff 2 =87.4 msec
Tn 12.6
b. Check loading for definition of impulse.
t d 8- = 0.09 < 0.2T 87.4 -
n
Therefore, loading is impulsive.
c. Determine required dynamic ultimate unit resistance forimpulse sensitive structure.
• 2ib (1,000)2
ud 2 mef Xm (2)(0.689)(3,750)(12.65) = 15.3 psi
d. Determine dead load.
rdl = g m = (386.4)(0.00375) = 1.45 psi
e. Determine equivalent static required ultimate unit flexuralresistance.
rud 15.30 = 14.20 psiruf - DIF + rdl - 1.20 +1.45
f. Determine dynamic unit resistance for shear calculations.
ruv = (DIF) (rf) = (1.20) (14.20) = 17.04 psi
31

g. Determine time to reach maximum response.
ib
t b 1,000 = 65.4 msecm rud 15.30
Step 6: Check minimum steel percentage.
a. Determine required static moment capacity and steel percentageat minimum moment section in both direction L and S.
From Step 2:
(ru)min = 0.0001122 me
where: ruf = (ru)min
Therefore,
rruf _ 14.20m - - - 126,560 in.-Ib/ine 0.0001122 0.0001122 1 0 l
From Table 6:
S-direction
mreq = m = 0.087 me
m 5 = (0.087)(126,560) = 11,010 in.-lb/in.
L-direction
mreq = m14 = 0.179 me
m14 = (0.179)(126,560) = 22,655 in.-lb/in.
Determine (A s)req for these two locations; use f :
S-direction
m = (A) fdn req s dcS
L-direction
m n (As) req s dcL
Since the largest unit moments occur in the L-direction,place the reinforcement for these moments nearest the top/bottom surfaces (see Figure 2b). According to ACI 7.7.1:
32
. . . . . .. .. n iim m a ~ l m li I n Ol / K d H i 'dp .

Concrete exposed to minimum
-earth or weather cover (in.)
#6 - #18bars. ................ 2#5 bar or smaller...... .. .. .. .. .. ... 1
Concrete not exposedto weather or in minimumcontact with ground. cover (in.)
#11 bar or smaller .............. 3/4#14 and #18 bars...... .. .. .. .. .. ... 1
Therefore,
top cover = 2 in.bottom cover =3/4 in.
3 3dcL tslab 4 L = slab 4 L
d t -2--2-- 2d -d = t 2 2-- 2d -dcS slb4 L S slab 4 L S
where: d L= diameter of long side bar
ds = diameter of short side bar
For #6 bars
d = 9 - 2---6 5.5 in.cL 4 8
*d 5 = 9 -2-2 - --- ~ 2 4.0 in.
S-direction (m 5)
11,010 = (A s) rq(75,000) (4)
* Therefore,
(A ) rq = 0.0367 in. 2 /n.
(As)req 0.0367
Preq b d cS (1)(4) 0.91
L-direction (in1 4 )
22,655 = (A s)e (75,000)(5.5)
33

Therefore,
(As) = 0.0549 in.2/in.sreq
(As)req _ 0.0549 0.0100
req - b dcl (1)(5.5)
b. Compare with ACI minimum value (p min).
For equal top/bottom reinforced slab:
(As)min = 0.009 b tslab
(As)min = (0.0009)(1)(9) = 0.0081 in.2/in.
(As)min 0.0081 0.0015
Pmin - b d -(1)(5.5) -001
' Therefore,T oIncrease slab thickness.
Return to Step 5.
Preq > Pmin orGo to Step 12.
Go to Step 12.
Step 12: Check shear at support (see Figure 14).
a. Shear at Location #1 (d from wall haunch sector \):cL
Critical shear width,
c dcLb = S -yw 2 x
53.4 5.5=(2)(240) - 2- (90)2 120 (0
= 449.2 in.
Tributary area,
S+ ( 2 S yA - 2 2 (x - dcL)
449.2 + (480 - 26.7 (090)=2 (120 -5 5)
2= 46,516 in.
34
: - '-,'- .,. ' -- ,a'.'- .'-.'-' .. ' '' . -'''- " " - . '#. "€ .. ' - '¢ _'

Factored shear force,
V = r Au uv
= (17.04)(46,516)
792,630 lb
Nominal shear strength at wall provided by concrete,
V =v b dc c w cL
where: v = 1.9 4-+ 2,500 p < 2.28 "i
c c C
m10 = 0.314 me = (0.314)(126,560) = 39,740 in.-lb/in.
A 1 0 = 39,740 = 0.0963 in. 2 /in.
s fs dcL (75,000)(5.5)
Ap s 0.0963P - b dc (1)(5.5) 0.0175
bdcL
v = 1.9 ./4,000 + 2,500(0.0175) < 2.28 .4,000C
= 163.9 psi < 144.2 psi
Therefore, v = 144.2 psi
V =v bdc c w cL
= (144.2)(449.2)(5.5)
= 356,261 lb
Therefore,
V > Vu c
792,630 > (0.85)(356,261)
792,630 > 302,821
b. Shear at Location #2 (dcs from wal'. haunch of Sector ICritical shear width,
c dscs
b = 1.5L xw 2 y
35
"1

= (1.5(30 53.4 4_ 10d.5j~3O2 90-~(10
= 418.0 in.
Tributary area,
A [b+ (1. 5L ---- x)] s
= 418 + (450 26. - 120)] (90 -4)
= 31,016 in. 2
Factored shear force,
*V =r AU UV
- (17.04)(31,016)
=528,510 lb
Nominal shear strength at wall provided by concrete,
Vc c bw dcS
where: m1 0.168 me (0.168)(126,560) = 21,260 in.-lb/in.
A = ____1 21,2600.79i2/ns f sd CS (75,000)(4T .79i./n
A s -0.0709
b (1)(4) =0.0177bdcS
v = 1.9 44,000 + 2,500(0.0177) < 2.28 f4-,000
- 164.4 psi < 144.2 psi
Therefore, v = 144.2 psic
Vc vc bw dCS
= (144.2)(418)(4)
= 241,102 lb
36

Therefore,
V > VU C
528,510 > (0.85)(241,102)
528,510 > 204,937
Increase slab thickness. Let t slab= 16 in. Returnto Step 5.
Step 5: Perform dynamic analysis on SDOF representation of the slab.
a. Determine SDOF parameters.
Elastic stiffness
1 170.7 in.4/ in.
C = 0.00112
(3.64 x 10 )(170.7)
(0.00112)(300) (1 - 0.172)
= 70.5 psi/in.
Elastic load-mass factor
KLM = 0.65
Plastic load-mass factor
KLM = 0.689
Actual unit mass
m = (0.00015)(12) + (0.000217)(16)
= 0.00527 lb-sec 2/in. 3 or 5,272 lb-msec 2/in. 3
Natural period
/(0.65) (5,272)NTn = 2n 70.5 43.8 msec
b. Check loading for definition of impulse.
td 8
T- = - 0.18 < 0.2n
Therefore, loading is impulsive.
37
N, N_
,-

C.
r (1,000)2 88 psiud (2)(0.689)(5,272)(12.65) 10.
d.
rdl = (386.4)(0.00527) = 2.04 psi
e.
re - 10.88 + 2.04 = 11.11 psi
uf 1.20
f.
r = (1.20)(11.11) = 13.33 psi
g.
1,000t 10.88 = 91.9 msec
Step 6: Check minimum steel percentage.
a. Determine preq
Um ruf - 11.11 99,020
e 0.0001122 0.0001122 in.-lb/in.
d t d 1 6dcL =tslab -4 =
4- 12.5 in.
2 2-L- d - d = 16 - 2-- 26
tislb 4 L S 4 8 8
-' , - = 11.0 in.. S-direction (i5)
i req = m5 = 0.087 m = (0.087)(99,020)
= 8,615 in. -lb/in.
m reg 8 615
(As) req P ,61 = 0.01044 in.2/in.sreq f sd c (75,000)(11)-
0164 (As req 0.01044req - d (1)(11) 0.000949
cS
381) rq c

L-direction ( 4
m re = m 1 0.179 ine = (0.179)(99,020)
= 17,725 in.1lb/in.
m(A) r .. 17 725 -0.0189 in 2/ins req f s - (75,000)(12.5) i.n
p e 0.0189 0011req b d c, (1)(12.5) 0011
b. Compare with ACI minimum value.
(A ). = 0.0009 b tsa
= (0.0009)(1)(16) = 0.0144 in.2/in.
L-direction
(A5 s min 0.01440.15pmin b d CL (1)(12-5) = 0.05
S-direction
(A5 dmin _ 0.0144 - 0.00131
Therefore,
pre p mi For S-direction only
Go to Step 7.
Step 7: Revise distribution of moments at all locations where p re <pmi(for S-direction only) according to Appendix B. That ires m
~um mn Pm in mdc5 fS (Eq. B-14)
2(0.00131)(1)(11) (75,000)99,020
=0.120
39

Minimum unit moment coefficient in the S-direction equals0.120. Table 6 shows that aum for m2 , m3 , m4Y and m5 mustall be increased to 0.120.
Step 8: Re-determine yield-line locations and value of ultimate resis-tance according to Appendix B. The results of the analysis arelisted in Table 9 (reproduction of Table B-14). That is,
a = 10.363ru
x' = 0.40
y' = 0.30
z' = 0.311
By definition:
m
(r e(r).mi = aumin ru L2
m e
10.363 (300) 0.0001151 me
Step 9: Since x', y', and z' did not change, X remains the same.Therefore,
X = 12.65 in.m
Step 10: Perform dynamic analysis. Since X did not change, the
previous dynamic analysis is still valid. That is,
m = 5,272 lb-msec2/in. 3
mef = 3,632 lb-msec2/in. 3
rud = 10.88 psi
rdl 2.04 psi
ruf = 11.11 psi
r = 13.33 psiuv
Step 11: Recheck minimum steel percentages.
a. Determine preq
m 0.0 151 .11 96,525 in.-lb/in.
40

S-direction (m 29' *31 m in 5 )
m rq= 0.120 mn e (0.120) (96,525) = 11,583 in.-lb/in.
(A ) m req 11,583 0044i./nsreq f sd cS (75,000) (11) = 0044i./n
(A Sreq = 0.01404 = 0.00128
cS
L-direction (in1 4 )
m rq= 0.179 m e (0.179)(96,525) = 17,278 in.-lb/in.
* reqeg
(A ) rq = rq - 17,278 = 0.01843 in.2/in.s req f sd cl 75,000(12.5
- (ASreq _ 0.01843 0.017~req b d cL (1)(12.5) -0017
b. Compare with ACI mninimumu value
L-direction
=mi 0.00115
S-direction
= 0.00131
Therefore,
Preq < mi For S-direction only.
However, these values are close enough. Go to Step 12.
Step 12: Check shear at support.
a. Shear at Location #1 (d from wall haunch of Sector /D)UL
Critical shear width,
bw =2(240) - 53.4 -12.5 (90) = 443.9 in.I
w2 120
41

Tributary area,
[ =443.9 + (480 - 26.7 -90)](2 25
A 43,387 in.2 (2 25
Factored shear force,
Vu = (13.33)(43,387) = 578,349 '
Nominal shear strength at wall provided by concrete,
where:
m 0 0.314 m* (0.314)(96,525) =30,309 in.-lb/in.
Ao -1 30,3090.33i2/nA f sd U (75,000)(12.5) .02 n./n
5 A 0.0323 0.05T-b dc (1)(12.5) -0.25
V c = 1.9 14,000 + 2,500(0.00259) < 2.28 qf4,000
=126.6 psi < 144.2 psi
Therefore, vc = 126.6 psi
V = (126.6)(443-9)(12.5) = 702,652 lb
Therefore,
V U< Vc
578,349 < (0-85)(702,652)
578,349 < 597,254
b. Shear at Location #2 (ds from wall haunch of Sector ®-A):Critical shear width,
bw I (.5) (300) -26. 7 --- 120) =408. 6 in.
42

Tributary area,
A = 408.6 + (450 2- 26.7 - 120) (90 - 11)
= 28,120 in. 2
Factored shear force,
V = (13.33)(28,120) = 374,840 lbu
Nominal shear strength at wall provided by concrete,
where:
m= 0.168 m = (0.168)(96,525) = 16,216 in.-lb/in.
Am 1 16,216 - 0.0197 in. 2/in.
s fs d cs (75,000)(11)-
Ap A s 0.0197 0.00179
b d - (1)(11) -
vc = 1.9 144,000 + 2,500(0.00179) < 2.28 14,000
- 124.6 psi < 144.2 psi
Therefore, vc = 124.6 psi
V = (124.6)(408.6)(11) = 560,214 lbc
Therefore,
V < Vo c
374,840 < (0.85)(560,214)
374,840 < 476,182
Go to Step 13.
Step 13: Check punching shear at column capital. The critical columnfor punching shear is the top column which has the largesttributary area (see Figure 15, Location #1).
Critical shear width,
2= n +avg
43

where: d = 12.5 in.
d = 11.0 in.cS
(d )avg = 11.75 in.
1(d 5.875 in.2 c avg
b = n(30 + 5.875) = 112.7 in.0
Tributary area,
A = 1.5L - x) d [ + (dc vg] 2
= (120)(303.3) --1-(35.875) = 34,375 in. 2
Factored shear force,
V r Au uv
= (13.33)(34,375) = 458,220 lb
Nominal shear strength provided by concrete,
V = v b 0(d c)*c c o cavg
where: v = 4 ."fF = 4 44,000 = 253 psic c
.4 VC = (253)(112.7)(11.75) = 335,005 lb
Therefore,
V > V
458,220 > (0.85)(335,005)
458,220 > 284,755
Go to Step 14.
Step 14: Design drop panel for punching shear. Select trial drop paneldimensions.
L = 5 cx S 240 120 in.dp
44

S = - S 240 = 120indp cy -2 2 - in
td = t slb - 1 n
Critical shear width,
F b~ [+ (d )avg]
where. (d )dro = d cL+ t dp= 12.5 + 4 = 16.5 in.
(cL drop =dcL dp=1.0+4=50in
(d) +tv = 105475.0iin
1 d ) 71.875 in.2 cavg
b 0=n(30 + 7.875) = 119.0 in.
Tributary area,
A 5L (x)- [-d +-- -L *[+ (dcag
(120)(303.3) - 2 (37.875)2 34,145 in.2
Factored shear force,
V r AU UV
= (13.33)(34,145) = 455,155 lb
Nominal shear strength provided by concrete,
V c= v cb 0 d)dv
where: vc = 253 psi
V c= (253)(119-0)(15.75) = 474,185 lb
45

Therefore,
V > Vu c
455,155 > (0.85)(747,185)
455,155 > 403,057
Increase t dp Let tdp = 6 in. and repeat Step 13.
Critical shear width,
where: (dcLd = 12.5 + 6 = 18.5 in.
(dcS)drop = 11.0 + 6 = 17.0 in.
(dcdavg = 17.75 in.A' c dcavg
)- = 8.875 in.
bo = n(30 + 8.875) = 122.1 in.
Tributary area,
A = (120)(303.3) -2(38.875)2 = 34,020 in. 2
Factored shear force,
V = (13.33)(34,020) = 453,485 lbu
Nominal shear strength provided by concrete,
V = (253)(122.1)(17.75) = 548,320 lbc
Therefore,~V < C
u c
453,485 < (0.85)(548,320)
453,485 < 466,070
*Go to Step 15.
46

-WNW IAW
Step 15: Check punching shear at edge of drop panel (see Figure 15,Location #2).
Critical shear width,
o dp +Sdp + dc avg
where: d cL 12.5 in.
d = 11.0 in.cS
(d d)v = 11.75 in.
b 0= 120 + 120 + 2(11.75) = 263.5
Tributary area,
A = ~-- 1.5L x [L + ()d- (dp + (ddavg 2
= (120)(303.3) - (131.75)(65.875) = 27,715 in.2
Factored shear force,
V =r Au UV
= (13.33)(27,715) = 369,440 lb
Nominal shear strength provided by concrete,
V c v cb 0(d)dv
where: v = 253 psic
V = (253)(263.5)(11.75) = 783,319 lb
Therefore,
V u < Vc
369,440 < (0.85)(783,319)
369,440 < 665,822
Go to Step 16. Shear reinforcement is not required.
47
iq ~ Y

Step 16: Check longitudinal (L-direction) and transverse (S-direction)beam shear at drop panel edge (see Figure 16). Let b = 1 in.(unit width) o
a. Location #1 (d from edge).
Tributary area,
L _ c _ dpA = b -2- 2 - dcL)
= (1.0)(300 - 26.7 - 120 - 60 - 12.5) = 80.8 in.2
Factored shear force,
V = r A "ru uv
= (13.33)(80.8) = 1,077 lb
Nominal shear strength at drop panel provided by concrete(see Figure 12 and Table 6),
Vc c o cL
where: v 1.9 fF+ 2,500 p < 2.28c c c
m = a mn urn e
a 1 5 + a1 1m =a m - mavg avg e 2 e
0.349 + 0.233=2 (96,525)
= 28,090 in.-lb/in.
mmavg - 28,090
( avg f d (75,000)(12.5)s ag fs dcL
0.0300 in. 2/in.
(As)avg _ 0.0300 0.00240
Pavg b d cL (1)(12.5)
vc = 1.9 [4,000 + 2,500(0.00240) < 2.28 4,000
= 126.2 psi < 144.2 psi
48
U.L

V = (126.2)(1)(12.5) = 1,578 lb
Therefore,
V u < V c
1,077 < (0.85)(1,578)
1,077 < 1,341
b. Location #2 (d from edge).CS
Tributary area,
A b ( S~ )p= (1.0) 240 120 ) 49 in.2
Factored shear force,
V =r AU UV
-(13.33)(49) = 653 lb
Nominal shear strength at drop panel provided by concrete,
V =v bdc C a cS
where: m av a agm em r92+ .
0.191 + 0.1202 (96,525)
-15,010 in. -lb/in.
m(A avg - (15,010) =0.0182 in.2/in.savg f d (75,000(11)
pav bA s)avg 0.0182 -0.00165
avg -b dcS W
v c= 1.9 14,000 + 2,500(1.00165) < 2.28 4,000
= 124.3 psi < 144.2 psi
V = (124.3)(1)(11) = 1,367 lb
49

Therefore,
V < Vu c
653 < (0.85)(1,367)
653 < 1,162
Because the strips in the transverse direction are shorter, theshear in the longitudinal direction is critical, and there is noneed to check shear in the transverse direction.
Go to Step 17.
Step 17: Check longitudinal (L-direction) and transverse (S-direction)beam shear at column capital. (See Figure 17.) Let b = 1 in.0
a. Location #1 (dcL from equivalent square capital).
Tributary area,
A = bo [L -c x 2 ( dcLavo -2 2 )Lavg]
ScL + (dcL)dropwhere: ( cLavg 2
= 12.5 + 18.5 = 15.5 in.2
A = (1.0)(300 - 26.7 - 120 - 26.7 - 15.5)
= 111.1 in. 2
Factored shear force,
V = r Au uv
= (13.33)(112.1) = 1,481 lb
Nominal shear strength at column capital provided byconcrete,
V = v b 0(dcL)c c o cavg
16 + 12where: m = av m - m
0.689 + 0.230 (96,525)2
= 44,353 in.-lb/in.
50
I2

m v 44,353
s avg s ( cL avg - (75,000)(155)
-0.0382 in.2/in.
(A s avg - 0.0382 =0.00246Pavg b (d c)av - (1)(15-5)
v c= 1.9 14,000 + 2,500(0.00246) < 2.28 14,000
= 126.3 psi < 144.2 psi
Therefore, v c = 126.3 psi
V c= (126.3)(1)(15.5) = 1,958 lb
Therefore,
V u< Vc
1,481 < (0.85)(1,958)
1,481 < 1,664
b. Location #2 (d CSfrom equivalent square capital).
Tributary area,
A b (dcsag
where: (d d cS + (d S)drocS avg2
= 11 + 17 =1. n
A = (1.0)(120 - 26.7 -14.0) =79.3 in.2
Factored shear force,
V r A
-(13.33)(79.3) = 1,057 lb
Nominal shear strength at column capital provided byconcrete,
V c= v cb 0Cd C) v
51

whr:mavg a vg Me - 72 3me
_0.496 +. 0.120 (96,525)2
=29,730 in.-lb/in.
(As M avg - 29,730savg f s(d c)av (75,00OM(4765)
=0.0283 in.2/in.
(Aavg _ 0.0283 =0.00202Pavg b (d c)av (1)(14.0)
vc 1.9 14,000 + 2,500(0.00202) < 2.28 14,000
-125.2 psi < 144.2 psi
V c (125.2)(1)(14.0) = 1,753 lb
Therefore,
v u < V c
1,057 < (0.85)(1,753)
1,057 < 1,490
Go to Step 18.
Step 18: Final design of slab.
a. Include drop panel mass in dynamic SDOF analysis.
Plastic load-mass factor (from Appendix C),
KL = 0.689
Actual unit mass (from Appendix C),
M = P ob t ob + Pslab t slab + Pdp t d (AT
= (0.00015)(12) + (0.000217)(16)
52

0. 1925 L2
+ (0.000217)(6)
2.0845 L2
= 0.00539 lb-sec 2/in. 3 or 5,392 lb-msec 2/in. 3
(Note: An increase of 120 lb-msec2 /in. 3)
Dynamic SDOF analysis,
d (1,000)2 1
ud (2)(0.689)(5,392)(12.65) = 10.64 psi
rdl = (386.4)(0.005392) = 2.08 psi
10.64ruf - 1.20 +2.08 = 10.95 psi
r = (1.20)(10.95) = 13.14 psi
= 1,000
m 10.6 94.0 msec
b. Determine unit moments and steel areas.
m - ruf 10.95 95,135 in.-lb/in. (From Step 8)e 0.0001151 0.0001151
where: m = a mn urm e
A = rnfdAs mn /fs c
p = As/b d c
These design quantities are calculated for the entire flatslab and are listed in Table 10. The reinforcement shown inFigures 18 and 19 was then selected to satisfy these quantities.The last three columns of Table 10 reflect these selections.
c. Check initial design assumptions.
The final check of the design involves the validation ofEquation 3 using the actual slab properties within the short sidepanel. This panel has nine unique locations (directly related tothe ACI assignment of reinforcement) where the slab properties(i.e., thickness, effective depth, reinforcement ratio) differ.Because these properties also differ in the two directions,
there would be a total of 18 values which must be used indetermining the average value for each short side panel parameter.The following equations were derived for the 3 x 4 slab shown inFigure 12:
53
I%

tavg =-T tslab + (ts a + tdp)
d7 (d +d+2--(
davg = (dcs +dL) slab + cs+ dcL)drop
Pavg = (3p + P2 + P3 + 2P6 + 2P7 + 2p1 2
+ P14 + 2p16 + P18 + 3p19 )/18
Substitution of the values listed in Table 10 yields thefollowing average properties:
tavg = -(16) +--(16 + 6) = 17.3 in.
davg -1- (11.0 + 12.5) +-- (17.0 + 18.5) = 13.1 in.
Pavg = [3(0.00176) + 0.00125 + 0.00125 + 2(0.00269)
" 2(0.00218) + 2(0.00186) + 0.00146
+ 2(0.00255) + 0.00207 + 3(0.00125)1/18
= 0.00187
Elastic stiffness,
I = -L (17.3)3 = 431.5 in.4/in.9 12
I = (5.5)(0.00187)(13.1)3 = 23.1 in. 4/in.C
a = 431.5 + 23.1 = 227.3 in.4/
Therefore,
6= (3.64 x 10 )(227.3)
(0.00112)(300) (1 - 0.172)
Natural period,
T 2 n 1/(0.65)(5,392) = 38.4 msecn V 93.9
54

td 8
- 3.4 = 0.21 0.20n
Therefore, loading is impulsive.
For illustrative purposes a dynamic analysis based onelastic-plastic response charts (Ref 16) for triangularloads will be shown.
Given:
rud 10.64 0 in.
XE KE 93.9
B 250rud 10.64 23
td 8- 8 = 0.21~T 38.4 i
n
Solution:
xm= 110 Therefore, Xm = 12.4 in.
t m-- = 2.4 Therefore, t = 92.2 msec
n
These values compare very favorably with the previously deter-mined values. It should be emphasized that the actual ductilityof the flat slab will be less than shown above (p = 100). Thisis a result of neglecting the elastic-plastic portion of theresistance function in arriving at the stiffness value.
Step 19: Design Column.
The determination of the design load, P , and eccentricity, e,for the lower column is shown in Appendix D. That is,
Pu = 918,945 lb
e 1.0 in.
The design procedure can be obtained from a reinforced concretedesign text book. It will not be illustrated in this report.
Step 20: End.
55

DISCUSSION
A general step-by-step design procedure for flat slab structures
subjected to blast loads was presented. This procedure is totally
consistent with the philosophy of the Navy's current blast-resistance
design manual, NAVFAC P-397. However, because this manual is periodi-
cally reviewed and updated, values of the following design parameters
may be affected by future P-397 revisions:
* Allowable rotations and deflections, 0 and X
* Design stresses, fs
* Dynamic increase factors, DIF
9 Strength reduction factors, 0
By dividing a flat slab into four distinct panel types (i.e., corner,
interior, exterior short side, and exterior long side), the design
procedure is applicable to flat slabs of any configuration (as defined
by interior column arrangement and spacing). The establishment of a
"step-by-step" process provides efficient execution of the design and
also allows designers to more easily understand the complex structural
behavior and interaction.
As a result of parameter studies, values for the following design
parameters were established:
" Location of positive yield line between interior columns
" Plastic load-mass factor, KLM
The yield-line analyses contained in Appendix B indicate that these
positive yield lines can be located midway between the columns.
". Appendix C shows that KLM is very insensitive to slab configuration and
yield-line pattern. In fact, K varied between 0.679 and 0.689 for ap LM
wide choice of configurations and assumed patterns.
56

REFERENCES
1. Naval Sea Systems Command, NAVSEA OP-5: Ammunition and Explosives
Ashore, vol I, change 12, Washington D.C., Oct 1984.
2. Naval Facilities Engineering Command, NAVFAC P-397, Army TM-5-1300,
and Air Force AFM 88-22: Sturctures to resist the effects of accidental
explosions, Washington D.C., Jun 1969.
3. Civil Engineering Laboratory. Technical Memorandum 51-80-06: The
ESKIMO VI test plan, by J.E. Tancreto and P.E. Tafoya. Port Hueneme,
Calif., Apr 1980.
4. Naval Civil Engineering Laboratory. Technical Report R-889:
ESKIMO VI test results, by P.E. Tafoya. Port Hueneme, Calif., Nov 1981.
5. U.S. Army Engineer Waterways Experiment Station. Technical Report
N-72-10: Design and testing of a blast-resistant reinforced concrete
slab system, by M.E. Criswell. Vicksburg, Miss., Nov 1972.
6. Naval Civil Engineering Laboratory. Technical Memorandum M-51-81-15:
Preliminary design procedure for flat slab structures subjected to blast
loads, by J.E. Tancreto. Port Hueneme, Calif., Sep 1981.
7. Civil Engineering Laboratory. Contract Report No. N62472-76-C-1148:
Design of flat slabs subjected to blast loads. Ammann & Whitney Consulting
Engineers, New York, N.Y.
8. American Concrete Institute. Building code requirements for reinforced
concrete (ACI 318-77), Detroit, Michigan, 1977.
9. L.L. Jones and R.H. Wood. Yield line analysis of slabs. New York,
N.Y., American Elsevier Publishing Co. Inc., 1967.
10. R. Park and W.L. Gamble. Reinforced concrete slabs. New York, N.Y.,
John Wiley and Sons, 1979.
57
V M .. &V *.t %, 1% - %, -,' - -~ %, %-%~ *,.-M -5 .X4 '6 _%1% .- C

11. M. Vanderbilt, M. Sozen, and C. Seiss. "Deflection of multiple-panel
reinforced concrete floor slabs," in Proceedings of the American Society
of Civil Engineers, Journal of the Structural Division, Aug 1965.
12. D.E. Branson. Deformation of concrete structures. New York, N.Y.,
McGraw-Hill International Book Co., 1977.
13. Department of the Army. Technical Manual 5-856-4: Design of
structures to resist the effects of atomic weapons. Washington D.C.,
1957.
14. Civil Engineering Laboratory. Design criteria for deflection
capacity of conventionally reinforced concrete slabs, by J. Tancreto.
Port Hueneme, Calif., 1980. (Internal Working Paper)
15. American Concrete Institute, Design Handbook, Volume 2 - Columns,
Publication SP-17A, Detroit, Mich., 1978.
16. Naval Civil Engineering Laboratory. Technical Note N-1669: Charts
for predicting response of a simple spring-mass system to bilinear blast
loads, by J.S. Hopkins. Port Hueneme, Calif., Jun 1983.
17. R.H. Wood. Plastic and elastic design of slabs and plates. New
York, N.Y., Ronald Press Co., 1961.
18. Department of the Army. Technical Manual 5-856-3: Design of
structures to resist the effects of atomic weapons. Washington, D.C.,
1957.
58

Table 1. Deflection Coefficients for Interior Panels
Deflection Coefficients for c/L of - 4-
0.0 0.1 0.2 0.3*
Center of Interior Panel, CC
1.00 0.00581 0.00441 0.00289 0.002001.25 0.00420 0.00301 0.00189 0.001201.67 0.00327 0.00234 0.00143 0.000802.50 0.00284 0.00204 0.00120 0.00065
Midspan of Long Side, CL
1.00 0.00435 0.00304 0.00173 0.001001.25 0.00378 0.00262 0.00155 0.000851.67 0.00321 0.00228 0.00137 0.000752.50 0.00284 0.00204 0.00120 0.00065
Midspan of Short Side, Cs
1.00 0.00435 0.00304 0.00173 0.001001.25 0.00230 0.00131 0.00057 0.000201.67 0.00099 0.00040 0.00008 0.000052.50 0.00031 0.00004 0.00001 ---
*Values are extrapolated.
. - column capital
+ CL %
+ + c SI -I
L-~C _+ C -- S_
L J
I i-' I I - I
ILL?1I I s l--
L
59
--- - -,-- -

Table 2. Minimum Static Design Stress*
Maximum Support Static DesignRotation Angle, Stress,
0 fm S
00 < 0 < 20 fm y
f - fu y
20<0< 5 f +m y 4
f +f50 < 6 < 120 y u1 m2
*From Section 5-6 of Reference 2.
Table 3. Dynamic Increase Factors (DIF)*
DIFs for
Stresses High Intermediate and LowPressure Pressure RangeRange
Reinforcing Steel
Bending 1.20 1.10Shear 1.00 1.00
Concrete
Compression 1.25 1.25Diagonal Tension 1.00 1.00Direct Shear - 1.10Bond 1.00
*Table 5-3 of Reference 2
60

.4
Table 4. Allowable Support Rotations
Allowable
Protection Support
Category Rotation,0(deg)
Personnel Shelter 2
Equipment Shelter 5
Explosives Magazine 8
61

Table 5. Flow chart of design procedure for flat slab.
(STA TRIUI~
ISTEP 1: ELASTIC M ENT DISTRIBUTIO STEP 13: "
PUNCH IN, YES
I STEP 2: YIELD-LINE ANALYSIS SHEAR\ AT COLUMNCAPITAL
STEP 3: ESTABLISH AMSXIMUM
DEFLECTION
STEP 4: ASSUME INITIAL SLABTHICKNESS STEP 14: DESIGN DROP PANELV , 0V C
YES
FECRASE T SLAB \ INCREASE T SLAB RP AE
STEP 15:DIMENSIONS
S 9 RSTEP 6 MAIU A CHECKSNO A WCHECK D C YES BEAMSHEAR NO
MINIMUM STEEL ES HEAPERCENTAGE / IAT EDGE OF
DROP PANEL
PG/ RQ 'IV INCREASE
SLA
STEP 8: YIELD-LINE ANALYSIS DI'"AE
STEP 10: DYNAIIC SlIF ANALYSIS SLA
i /
, ND ~s YES
STEP 16DIES:NNO RECHCKCYESK
LONGITUD INA L NO
I M AAND TRANSSEUE EEM S APIA
P P E
STEP(A 10,A DYNMI ANALYAALYSI
RE Vc MIININCINEASEOMAAOP PANEL
STEP 1 A YSTE S TNO REHECHECE
LNI UD INAL U TM ENO
ANDERANSERS
< YYESESE I?:O, OfS EP 1
CHEC NO _________________________CHECK_
LONIN UIN D N
BAND SEEARAS
ESYE
SHER STEP IA DESIGN CLM
SB DTE MN UN0 EN D ME
62
-e 0.
S*-- - - A .

Table 6. Values of Unit Moment Coefficients ( = 1.25;
a cap = 0.20; twS/tslab = twL /tslab 1.00;H /S = 0.5)
]w
Unit Unit Moment Adjusted PositiveMoment, Coefficient, Unit Momentm o t Coefficient,
n um a*urn
m 1 0.168 ---
m 2 0.114 ---
3 0.111 ---
m4 0.105 ---
m 5 0.090 0.087
m 6 0.257 ---
m 7 0.496
m8 0.472 ---
m9 0.203 0.191
m 10 0.314 ---
mll 0.233 --- 0
m 12 0.230
m 13 0.220 ---
m14 0.189 0.179
m 15 0.349 ---
m 16 0.689
m 17 0.660 ---
m1 8 0.284 0.255
m 1 9 minimum ---
Note: m = a mn urn e
q
m e = wL/8
63

Table 7. Ultimate Resistance Calculations
Coefficient of Coefficient of Coefficient ofx' y' z' Internal Work,* External Work,* Ultimate Resistance, "
alW tEW Oru
0.20 0.311 12.457 1.184 10.520
0.25 0.311 12.047 1.174 10.263
0.35 0.30 0.311 11.836 1.164 10.172
0.35 0.311 11.781 1.153 10.215
0.40 0.311 11.898 1.143 10.409
0.20 0.311 12.291 1.174 10.472
0.25 0.311 11.871 1.164 10.203
0.40 0.30 0.311 11.649 1.153 10.102
0.35 0.311 11.582 1.143 10.134
0.40 0.311 11.683 1.133 10.315
0.20 0.311 12.260 1.163 10.538
0.25 0.311 11.829 1.153 10.259
0.45 0.30 0.311 11.595 1.143 10.146
0.35 0.311 11.514 1.133 10.167
0.40 0.311 11.599 1.122 10.335
*From Table B-10.
*! From Table B-9.
ar- 1W u
ru nEW m/L 2
64

Table 8. Span Lengths
Angleof Span Exrsin Length
Support Direction Exrsin (in.)Rotation
o Long (L 0/c2 123.3
8BLong L-c -x 126.6
eCLong x 120.0
E) Short y 90.0
0EShort S -c - y 96.6
F Short z 93.3
GShort S -c - z 93.3
Note: L = 300 in.S = 240 in.C = 53.4 in.x = 120 in.y =90 in.Z = 93.3 in.
65A
I Z,

Table 9. Ultimate Resistance Calculations for
um~min 2 = 3 = 4 = 5 = 0.120
Coefficient of Coefficient of Coefficient ofx y z' Internal Work,* External Work,** Ultimate Resistance,~ -*
aiW EW aru
0.20 0.311 12.784 1.184 10.797
0.25 0.311 12.371 1.174 10.537
0.35 0.30 0.311 12.159 1.164 10.446
0.35 0.311 12.106 1.153 10.500
0.40 0.311 12.228 1.143 10.698
0.20 0.311 12.594 1.174 10.727
0.25 0.311 12.172 1.164 10.457
0.40 0.30 0.311 11.949 1.153 10.363
0.35 0.311 11.884 1.143 10.397
0.40 0.311 11.989 1.133 10.582
0.20 0.311 12.541 1.163 10.783
0.25 0.311 12.107 1.153 10.500
0.45 0.30 0.311 11.872 1.143 10.387
0.35 0.311 11.793 1.133 10.409
0.40 0.311 11.881 1.122 10.589
*From Table B-13.
'From Table B-9.
O IW u- _ Uru 2
rEW me/L
66
-p. ,

c 044 04 U ~ ~ V - -04 j- w4 0 0* 0- 0n C 4
6.0 - 0 0 0 0
00
U C-Q @ b e0z Q
4JA
- ~ ~ ~ ~ 1 - N uan jJ~ q J l
41 .. t -t
0 r
'0 'A 4) 4)I ~ -00 CL'0. ~ - N
4)4). 4j
-4~~~~~: c-4~4 -'o 0 0 0 0 '
. 4
4) 4 Q +- - - - - . r -W U 4- -
:3
-4.
04)~~ ~ CD0 0044 4 44 - 0
4- - - 4. 4 0
-4> m -4
)4., 0 0 0 0 0 0 0
.44
V .. ~ CN ~C4 '0 4- 0
_ _ _ _ _ _ __W_ _ _
67

r- c-
4.)
4) 00 0 0- 0 0 0 00
oo
444-
4,-4J4-
8V 4 c7 '0 .40 m 7 W) V) U, V4, C0 U- -0-r' co -T -C. -- - -
0 0r
c- u CD* '0tD". 0. 7 07 '0 '07.0 -C U
44 II n 0 a o ) 1 4'
.4%1
00
11 4- l
di04-) 0 a i r L n c 4-
0 0 0) 0D 0 0 0a
4; 0 0N 04 0 01 0 0 0o 0 0
4 4,. U
'V 4-44--
a .-- .r04 c 0 0 0 0o 0 0 0 0 0 0 0 '
~4J '.4 C'") In" C') It >,4. U U 4)> 14C CN C4 - C') -t . 04 - -
12 M' 0 0 0h a, 0 0 0
00 000 0000 0 0
4') 4') v' -' ic -
a4- V
4)4- 68
* '-. U, 0 0 0 0--0-0-----4

L L tW S
corner short Lside
long side interior drop panel
I4W L column7pha
(a) Plan view.
tslab
tw L pae round or square
FF
(b) Section View
Figure 1. Typical flat slab structure.
69

A 0r
-
X
(a) SDOF flexural structural element.
Idcs d cL tsa
(b) Reinforced-concrete, Section A-A.
K E
IX Deflection,X M
(c) Resistance-deflec.ion function.
Figure 2. SDOF resistance-deflection function.
70

. - - - Positive yield line (valley)
Negative yield line (ridge)
- - -- - - - -A 0,capital support
wall support(inside face of haunch)
(a) Flat slab with one column.
()Flat slab with two columns.
Figure 3. Possible flat slab yield-line mechanisms.
71

c/2 xC/2
0
_ 0'N.,
I ~ "-- 0
C4k XIN" N U
( ou n(middle band) (xteniOr
band) band)s cx /2 Jig s Sex ,
L I
(-Z Areas of equal steel reinforcement withincrossing strips identified with dashed lines
yreinforcementdirections
g
O Rigid sectors bounded by yield lines
- - - - Positive yield lines
Negative yield lines IFigure 4. Yield line mechanism for one-quarter panel of flat slab with
one central column.
72 Iu.
- -~-~ - ~ S'.V

A
AfN F
E~M
support _,
D_ yield line
B
(a) Plan view. (b) Section view.
Figure 5. Determination of load-mass factor in the plastic range.
b
I bd 3 /3 2Lr~d~d I L1 '\ =- bd
(a) Rectangle.
L =dI +I bd 3/12 _1
d -=
b
(b) Triangle rotating about side.
b
+ ~ ~ I bd 3 /4 3 3
dT 2
73
x7

capital - o oCorner = 4Long side = 0
Short side= 0
0 Interior = 0
(a) 2 x 2.
I I
I Corner -4
Longside= 0I' l IShort side= 4
@ ~~ IIInterior =0
(b) 3 x 2.
Corner = 4Long side= 4Short side= 0
)Interior = 0
(c) 2 x 3.
Figure 7. Flat slab configurations.
74
-C1 e, -r

Is I
SCorner 4
4 Long side= 4
T Short side= 4
Interior 4
(d) x 3.
0 1818,
S I Corner =4'S i1Longside= 8Short side=
/ IInterior = 8
G 188 ' ,~ 8
/I I
(e) 3 x 4.
Figure 7. (continued)
75

-- -- - --'
(a) 2 x2. (b) 3 x2.
00
Cc) 2 x 3. (d) 3 x3.
9,,
U 76

location no. 1 -
c/2d2location no. 2 x C
(dc) avg KiiI
N.
V/7777,1,7771 ?!? INL__
Loctin o.1:fro crcla clu nail2A
(dLoctin o.2: c 2av fomretanulr ro p n
(a) unchng seaN
Loth ctaio nolumncagfrmcrclrcouncaia
27

c/2Location no. 1 lidx
dL I d Location no. 5
Location rr - A Location no. 2 dno. 3 des I r dcL--x
-d Location c ono 4
NI
9'.- - "
NI
N
dLs Location no. 6
L 1Location no, 1: dcL from column capital (longitudinal
Location no. 2: dcL from drop panel (longitudinal)
Locaton no. 3: dcS from column capital (transverse)
Location no. 4: des from drop panel (transverse)
Location no. 5: dcL from wall haunch (longitudinal)
Location no. 6: des from wall haunch (transverse)
(b) Beam shear.
Figure 9. (continued)
78
S."~ *V': . '-.. ¢.:'' .. .- :.3 ..... . ....... 3• .-..- ,.- -.-.. ... v.... :-.-:..,'

0
0
0
a,U
a, h
I.0 ~
0.
U .-.4 40. ~ I.'~ 0 '- ..-4U ~ 'V
.00 U 4.)
'4 '4 0.0 0. *~ _ E00. 0 0o -~ '4
*0E
-~ 4)'4 U
1.4o
'0-I
I 4)
'-4
-4
'4 U
.- $
0
U
V'-I
00-'-I
a,
0.
'4
___ I

L L L
squarc
tw
Figure 11. 3 x 4 flat slab configuration.
80

s/2 C MS
M~ [4m M M4 Mr19
- I E
M M 1 -- - - rn1
EE
E IE
EI IM E
I _j
>Ir I I
m1 En T Tn
Figure 12. Unit moment distribution for 3 x 4 flat slab.
81

y
A _ C1
2/
e s
pN
b h
pf
U2E all L
Figure 13. Yield-line mechanism for a 3 x 4 flat slab.
82

y
Lx
c/2
x 0
I dCL-4
Location no. 1 w-
capital
j i -S cation o. 2
U/2 L K
Figure 14. Critical locations for beam shear at support for 3 x 4 flat
83
%' %

Ldp
no. 1 2(d
Lcation no.2 2 2flv S
S
84%

Ldp x~ /
I-*- d ILI Location
Location no. 2 cSI
equivalentsquareICapitalI
NN
Nn L
Figure 16. Critical locations for beam shear at drop panel edge for a3 x 4 flat slab.
85

Location
Location d Savg .I
no.i2
L/ id L BPI
Figure 17. Critical locations for beam shear at column capital for a3 x 4 flat slab.%
86(

no. 4 rebar at 14-in. n.4rbra7 spacing (continuous) 35-in, spacing
4 5 3
(a) Middle strip.
no. 4 rebar at10-in. spacing no. 4 rebar at 10-in, no. 4 rebar at no. 4 rebar at
-4spacing (continuous) 20-in, spacing r- 20-in. spacing
8 9761
(b) Column strip.
no. 4 rebar at 14-in, no. 4 rebar at
spacing (continuous) 35-in. spacing
in 19 in 19 mn1 1
(c) Exterior wall strip. M
Figure 18. Reinforcement for 3 x 4 flat slab in S-direction.I
87

n.4 rebar at 8-in, no. 3 rebar atspacing (continuous) 16-in. spacing
M+ M+ 1(a) Middle strip.
no. 6 rebar at 14-in, no. 4 rebar at no. 4 rebar atspacing (contintlous) 14-in. spacing 28-in, spacing
(b) Column strip.
no. 4 rebar at 14-in, no. 4 rebar atsaig(continuous) 14-in. spacing
M 1 9 M1 9M1
(c) Exterior wall strip. 1
Figure 19. Reinforcement for flat slab in L-direction.
88

Appendix A
ACI ELASTIC DISTRIBUTION OF REINFORCEMENT
INTRODUCTION
In gei.~ ral, yield-line theory allows freedom in the choice of
reinforcement arrangements. For the design of flat slabs, however, it
is recommnended that an elastic distribution of the reinforcement be
used. Several reasons may be cited (Ref 10 and 17):
" The design is more economical.
" Better service load behavior is obtained in regards to cracking,
especially when the design blast loads are relatively low in
relation to the service loads.
" Moment distribution required to achieve the design configuration
is minimized.
" With the required concentration of reinforcement in the
column strips, the possibility of failure by localized yield
patterns is remote.
DIRECT DESIGN METHOD
The determination of the elastic distribution of moments follows
the ACI procedures outlined in Chapter 13 of Reference 8. The ACI Code
reconmmends two methods for the design of two-way slab systems; they are
the direct-design method and the equivalent-frame method. In this study
the direct-design method will be adopted. In the direct-design method,
the distribution (between positive and negative moment zones) of the
total static design moment in each direction may be made according to a
A-1

set of coefficients prescribed in the ACI Code. As applied to flat
slabs, this method may be used under the following limitations on
continuity, dimensions, and live-load-to-dead-load ratios:
" There must be a minimum of three continuous spans in each
direction.
" The panels must be rectangular, each having the ratio of longer
to shorter spans not greater than 2.0.
" The successive span lengths in each direction must not differ
by more than one-third of the longer span.
" Columns may not be offset more than 10% of the span in the
direction of the offset.
" The live load must not exceed three times the dead load.
The basic ACI approach used in .he design of flat slabs involves
the consideration of rigid frames taken separately in the longitudinal
and the transverse directions. When a typical horizontal span in a
rigid frame is subjected to a total design load of wL2 per foot, as
shown in Figure A-l(a), equilibrium requires that the sum of the absolute
average value of the negative moments at the center of supports and the
positive moment at midspan be equal to wL2L1 2/8 where L is the span
length between centerlines of supports; thus
pos +T ( ni +nj 8 w L2 L1 (A-i)
While the maximum envelope value at midspan can be used directly in
design, the value at the centerline of supports can be used only as a
basis for obtaining the reduced value at the face of the supports, at
which location the slab thickness is investigated and reinforcement
A-2
ILAfL

designed. In the direct-design method, the reacting shears are assumed
to act on the clear span at the face of the supports, as shown in
Figure A-1(b). Thus, Equation A-i becomes:
M + Mni + M - -w L2 L = M (A-2)Mpos 2 ( - nj) 2 n 0
where L is the clear span, and M . and M . are the negative moments atn ni nj
the face of the supports. Thus, the ACI Code uses the total static
design moment, MO, which is then distributed using coefficients between
Mpo s at midspan and Mni and M nj at the face of the supports. The total
static design moment, Mo, is further differentiated in this report as
the moments MOL and M acting in the long and short directions, respec-OL OStively.
In the direct-design method, design moment curves in the direction
of the span length are nominally defined for regular situations. Refer-
ring to Figure A-2(a), LI and L2 are the centerline spans in the longitu-
dinal and transverse directions, while L is the clear span in then
longitudinal direction. The total static moment in the longitudinal
direction has been defined by Equation A-2. In the direct-design method,
the design curves, as shown in Figure A-2(c), may be "directly used for
design" for the exterior and interior spans. By incorporating these
design curves into the blast design methodology, the L values (for an
given direction) for the interior and exterior spans must then be equal.
These moment values are for the entire width (sum of two half panel
widths in the transverse direction, for an interior column line) of the
equivalent rigid frame. Each of these moments is to be divided between
a column strip and two half middle strips as defined in Figure A-3. For
the typical flat slab with continuous exterior walls and L/S >1, the
column strips are S/2 in width in each direction with the middle strips
forming the remaining portion of each panel. For flat slabs without
beams, the quantity aI(L 2/L I) equals zero. According to the ACI Code,
the negative moment at the interior support3 is distributed 75% to the
column strip and 25% to the middle strip (ACI-13.6.4.1), while the
positive moment is distributed 60% to the column strip and 40% to the
A-3

middle strip (ACI-13.6.4.4). When the exterior support consists of a
wall extending for a distance greater than three-fourths of the transverse
width, the exterior negative moment is to be uniformly distributed over
the transverse width (ACI-13.6.4.3).
The rules governing the elastic distribution of moments throughout
a flat slab have now been completely defined. All these rules are con-
tained in Table A-1, which shows the calculations employed in determining
the entire set of possible unit moments, m .Figure A-4 shows then
location of these unit moments for three flat slab configurations.
These configurations were selected because they illustrate the full
spectrum of ACI unit moment distribution. Distributions for other
configurations are easily obtained from these figures. All the distri-
butions as shown are symmetric in both directions. The proposed design
methodology is limited to this condition.
In Figure A-4(a) and (b) along the first rows of interior columns
(in either direction), two values of the negative unit moment acting in
the other direction are shown. One value represents a distribution from
the interior span, while the other value represents a distribution from
the end span. In all cases the value printed nearest the exterior wall
is associated with the end spa_. distribution. According to ACI convention,
the larger of the two negative factored moments shall be used. However,
ACI allows a reduction in the adjacent positive moment so as to maintain
the total panel moment (ACI 13.6.7). For example, if m 7 is greater than
M.8, then m 7 is used as the negative moment capacity at the column, and
mis decreased. In Figure A-4(a) and (b), this reduction is (in - m )/2
and mi7 - Mrespectively. Note that in Figure A-4(c) there is no
interior span and, therefore, all the unit moments are based on the end
span distribution.
ABSOLUTE VALUES OF UNIT M0!4ENTS
Expressions for the unit moments listed in Table A-! are of a
general nature and involve the following parameters.
A-4

L = long span measured center-to-center of supporting
columns*
S = short span measured center-to-center of supporting
columns*
a' = coefficient of flexural stiffness of exterior wall andecS
slab in the short span direction
a'cL = coefficient of flexural stiffness of exterior wall and
slab in the long span direction
MOS = total factored static moment in the short direction
M O = total factored static moment in the long direction
To define these unit moments further, it is necessary to introduce
these two design parameters:
= span ratio (L/S)
a = capital ratio (d/L)cap
where d = diameter of capital. By definition,
w L L22n
O 8 (A-3)
For the short side moment, MOS
L2 L
L S - c = S - 0.89 d = L -0.89 a L , -0.890.89 0.9-a =L -08 acap)n Pcap ( a
*For exterior spans these quantities have no direct physical corre-spondence. That is, it is the clear span, L n, in the interior andexterior spans that are equal.
A-5

where c = equivalent square capital length = 0.89 d. For the long
side moment, MOL:
L = S -2P
L = L- c = L-0.89d = L 0.89 ocap L = L (I - 0.89 cap)
Substitution into Equation A-3:
1 3 1 ap 2w L 0.89 acap w L(- 0.89 a
MOS = 8 = 8 (A-4)
L rL ca 2 L3 cp2
w - L (1 - 0.89 a w L3 (1 - 0.89 o 2
MOL = 8 L 8 Gcap)] 8F cap (A-5)
To simplify the design process, NCEL recommends the following substitution:
w 2m wL (A-6)
e 8
Therefore,
2M = ()- 089 L m = a L m (A-7)OS 0.8 cap e OS e(A7
(1 - 0.89 a) 2
MOL L me OL e (A-8)
where:
2o = (- 0.89 a cap) (A-9)
(1 - 0.89 a cap )2GOL = p (A-0)
Through direct substitution of the expressions in Equations A-6, A-7,
and A-8, it is now possible to reduce the unit moment expressions found00 in Table A-I to functions solely of acS' cL 'OS' "OL, and m
Let:
A-6

a = a m (A-il)n urn e
where a = unit moment coefficients. The unit moment coefficients
for the flat slab are listed in Table A-2. Values of the panel moment
coefficients (aS and OL) are listed in Tables A-3 and A-4 for typical
values of and sah. These values are also plotted in Figures A-5
and A-6.
Two additional design parameters are required to fully describe
a' and a' 1 1 are
ecS ecL esa = wall thickness ratio (twL/tsa or twS/tsla)
tc I slb wS sa
a H = wall height ratio (H s
where: s lab = slab thickness
twL = long side wall thickness*
tt = short side wall thickness*
Hw = wall height (interior clear height from floor to
ceiling)
By definition,
aec = (A-12)1+ 1
aS
- 1a'c - 1+___(A-13)
*In this symmnetric analysis, the sidewall thicknesses are considered
equal as are the backwa11 and headwall thicknesses. However, fortypical box-shaped ammunition storage magazines, the headwall will
tamning symmnetry by using the backwall thickness in all calculations
involving the moment distribution. This results in lower negative
between the headwal1 and the column line.
A- 7
" ,,L~~~~~.................... ........ ............. ..- X- , o. Qi . :' , .

ihere: t3a - (A- 14)
ecS slab Hw
t3LHL (A-15)
slab w
Therefore,
al 5 1 -(A-16)+tslab Hw+ t 3 S
WS
'; I 1 (A-17)
1+ slab w
Tables A-5 and A-6 list values of a'C and a'c for typical values of ~
t S/t A lb'wL slb H w/S, and HwIL. These values are also plotted in
Figures A-7 and A-8.
EXAMPLE PROBLEM
It is now possible to determine the unit moments for the 3 x 4 flat
slab configuration shown in Figure 11. Let,
=1.25
a - 0.20cap
____ W tL -1.0
tslab -tslab 10
H
S - 0.50
A-8

The following coefficients are obtained from Tables A-3, A-4, A-5, and A-6:
'OS 0.387
OfOL = 0.541
a 5c = 0.666
aGL = 0.714
Substitution of these quantities into the expressions found in Table A-2
yields the unit moment coefficients, a um, listed in Table A-7. Their
locations are shown in Figure A-9. The allowable ACI adjusted unit
moment coefficients in the positive interior moment regions are also
listed. For example,
or= a9 a - o r 8= 0.203- 0.496 -0.472 0.191
A-9

In O C4 - - 4En ~ N N N Nj
Cd, 0d 0~ U) (nI z Ua . . a
a ~ - - -~ 0u - 0 ON 0 ONCd0 .d 0 0w W . i-. U)l -.. 0'4 Cd, '- .' - .
m W to LI Q I -. -1 C 0 V2, UI Cd 0 -4 ed Cd 0 .441 cd v 0 -. C l d
td ', 'a Id 0 0 01 I IC X? -0 01 C~c x I N N n10 I* - 0 ID 0 00 00 0
N ICm In Id, m d
w C W E.V n. - j-V0 -_ uu.0 0 0 0 0 0
Gd, E E 0r
C/C Cd, Cd, md 'Q C .. ~ .0 LI LILI 0 LI LI LI LI
>d~ 0 d 7 0 C C.0 0 0
l~Z ~ W 0I en a~ZIC a 0 LI N a Z I ll a
oi i r . I
41 v 0C IC an 0a 0 N IC Ln In 0
0 Id 0C N IC a 0 0 0 IC N IC
41 ( n Vd, fn In I/.C-4
0 0 i 0 0u 0 0
zd O 0 Z34 l Id, 0 0 Id, Id 0 0) d I 0 0 Id, Id, 0
10 0 0 N 4 IC Nn N 0C 0 4 N 0CN N
0 Ea 0 0 0 0
100~~~0 -C-G -G-I-d-d-dG
00 ~ -G 0C 0 0l 0/ 0C 0 Id, 0, Gd 0 0 Id I/C 0C 0 I n
m 0 v/ 0 01 0 0 0 0 0 0 vl 0 01 0 0 0 0 0 0 -Cd.
00z . 2 a. CL m z z a. z C . z 3 3. 00 0 0 0 0
-48 -0 -0 'n- C, -(n 8_ u_ OUu-
0.C u 6 w 00 00 1 0 00 00 .0 0 00 00 1V) Gd Gd 0 0 0 Gd 0d Gd Gd a = Gd Gd r r Cd
Gd = = = 0 0 0 Gd Gd
3n M 1U A0 n V ) 3 . 4 -
-d -41 .3
LI~~~ ~~ . *. 0 Cd C 0 - -- - -. Cd 0 - I / Z..
Cd -a f f f I I I I I if if if if LI LI LI LI 10 LI L

Table A-2. Unit Moment Coefficients
Unit Unit Moment Coefficient,Moment, a
m urmn
m 1 0.65 a'cS aOS
m (0.504-0.224 r'S)a P/(20-1)2 ~ecS aOS
m 3 (0.376-0.05 aUcS)aoS P/(2p-1)
m4 0.326 aOS P/(2p-1)
m 5 0.28 aOS p/(2p-l)
m 6 (0.756-0.336 a'cS)aOS
m7 (1.126-0.15 a'cS)aOS
m8 0.976 a OS
m9 0.42 aOS P
m10 0.65 a;'L a0 L
m (0.504-0.224 a'cL)aOL
m12 (0.376-0.05 a'cL)aOL
m13 0.326 aOL
m"14 0.28 aOL
m (0.756-0.336 a'cL)OL
m16 (1.126-0.15 a'cL)aOL
m 17 0.976 aOL @
"18 0.42 aOL
m minimum
Note: a = rn/rnun mn Ae
IA-llq

Table A-3. Values of aOS
Case Ot aNo. cap OS
1 1.0 0.15 0.7510.20 0.6760.25 0.605
2 1.25 0.15 0.4440.20 0.3870.25 0.334
3 1.50 0.15 0.2840.20 0.2390.25 0.197
4 1.75 0.15 0.1920.20 0.1550.25 0.122
5 2.00 0.15 0.1340.20 0.1040.25 0.077
Note: o = [(l/B) 0.89 tca p 12
Table A-4. Values of aOL
CaseNo. O3 cap oOL
1 1.0 0.15 0.7510.20 0.6760.25 0.605
2 1.25 0.15 0.6010.20 0.5410.25 0.484
3 1.50 0.15 0.501
0.20 0.451
0.25 0.403
4 1.75 0.15 0.4290.20 0.3860.25 0.345
5 2.00 0.15 0.3750.20 0.3380.25 0.302
Note: aOL (1 - 0.89 aa)2/pA1 cap
A-12

Table A-5. Values of &'ecS
a' fort
H /S ecS f wS/tslab "
0.75 1.00 1.25 1.50 1.75
0.4 0.513 0.714 0.830 0.894 0.931
0.5 0.458 0.666 0.796 0.871 0.915
0.6 0.413 0.625 0.765 0.849 0.899
Note: a =1ecS t3S 1+ tslab Hwt3 S
wS
Table A-6. Values of a'ecL
H /L ecL for twL/tslab0.75 1.00 1.25 1.50 1.75
0.20 0.678 0.833 0.907 0.944 0.964
0.25 0.628 0.800 0.887 0.931 0.955
0.30 0.584 0.769 0.867 0.918 0.947
0.35 0.547 0.741 0.848 0.906 0.939
0.40 0.513 0.714 0.830 0.894 0.931
0.45 0.484 0.690 0.813 0.882 0.923
0.50 0.458 0.667 0.796 0.871 0.915
0.55 0.434 0.645 0.780 0.860 0.907
0.60 0.413 0.625 0.765 0.849 0.899
Note: a' 1ecL 3 H
I slab w1 H
3 ,tLL
A-13

Table A-7. Values of Unit Moment Coefficients(P = 1.25; Oca p = 0.20; t wS/t slab
twL/tslab = 1.00; Rw/S = 0.5)
Unit Unit Moment Adjusted PositiveUont, U icent, Unit MomentMoment, Coefficient, Coefficient,
n um orun
m 1 0.168
m 2 0.114
m3 0.111 -
m 4 0.105
m5 0.090 0.087
m 6 0.257
m 7 0.496 -
m 8 0.472
m9 0.203 0.191
ml0 0.314
mll 0.233
m 12 0.230
m 13 0.220
m14 0.189 0.179
m15 0.349 '-
m 16 0.689
m 17 0.660 -
m18 0.284 0.255
m19 miniumum
Note: m = a m, m = w L2/8n um e e
A-14
A L

I Il-2wL per unit width wL 2 per unit width
I - 4L(C to c of supports) L (face to face of support)
II I
. pos M pos
M
M
nni
L 1/2 L 12
* (a) Moment diagram referring to (b) Moment diagram referring
centerline of supports. to faces of support.
Figure A-1. Typical moment diagram of a horizontal span.
A- 15

I width of equivalentrigid frame L 2
L1 Li
io0
(a) Plan view.
wL 2 per unit length wL 2 per unit length
I
(b) Equivalent rigid frame.
Ln/2 L /2 L n/2 Ln/2
+ .- 0.63 M -0.28 MO 0e 035'
.75M 0-10OM Q' 65 MOo0.65 MO .
(c) Longitudinal design moment curve.
Figure A-2. Direct-design method: longitudinal distribution of moments.
A- 16
,J-

exterior wall centerline of panel
1 half middle strip
column strip
0
P half middle strip
centerline of panel
Figure A-3. Definition of column and middle strips.
A,.
A-17
I iijI pJ5 A

OILUE Olt, E2l 0 1 W 2 1 Ot 0 1" ~ Olw E OItu ol
2 E *1 E
61tu 1" "'w ________7_-1.- 61W
w I n n 81W t' 61u ca
I--
100 E 0E E 00
E EU E2E EIE E
6 1W iriw 8______ tiw situ t 91W Z. 61tu
2 E E2 0 'I" ~
.4r4
E E E
L 2~t Ou Oliu 2 2t E 2iu E 1 2l E 1 E 0w OILU
A- 18

E E E E E E Em 19 m2 m6 M 2 m6 m2 m19
S E E E E
M19 m 3 m7 m 3 m 7 m 3 m19i-- m-' m-- n-3 m-
E E E E
m 19 m 5 m 9 m5 m 9 m 5 m 19
E E E EEE
m 19 m4 m 8 m 4 m 8 m 4 m 19mi m3 m m"
000
EE 5 E E E
m19 m 2 m 6 m 2 m 6 m 2 m19
E E E
Figure A-4(b). Flat slab: 3 x 3.
smll in1 0 m m I n1 Om,2E E E Em19 m 2 m6 m2 m19
E E E"
m 19 m 3 m 7 m 3 m 19
E E E E E
m19 m2 m6 m 2 m 19
E E E E E
I ml
- E E E
Figure A-4(c). Flat slab: 2 x 2.
A-19

1.00
0.75
Cicap =0. 15
O 0.50 =02
0.25
1.00 1.25 1.50 1.75 2.00
U LS
Figure A-5. Values ofa '
A-20

1.00-
0.75 a cap 01
a =ca .2
cap
0.25
1.00 1.25 1.50 1.75 2.00
O = U/S
Figure A-6. Values ofa L
A-2 1

1.0
0.9 tS'""lab =1.75
twS/tslb~ 1.50
0.8
tSl A =1.25
S0.7
0.6
0.5
t wS/tslbO 0.
7 5
0.4 1
0.3 0.4 0.5 0.6 0.7 0.8
Hw/
Figure A-7. Values of c'ec s
A- 22

k
0.9 L/sa)17
twL/tslab 1 !.00O.W
0.
twL/tslab =0.75
0.4 1 1 I0.1 0.2 0.3 0.4 0.5 0.6
Hiw/L
Figure A-8. Values of a'ecL"
A-23
'4

y
x
S M 1 / 2 SrX ,.I. Sex
s I m4 ml r
4 , .,irj 12
M 12
I I ,rI I I E
m4 4 19
iE E
J I /
m12 9 6 2
I I I"
L/ s L21Fi ur A -9 Uit' m en di t ui on f oi l s l ab .
II I ,f
m~1 m 1 "t m I
2. 1 , ti , Is ,.
*L/2 L
Figure A=9. Unit moment distribution for 3 x 4 fat slab.
A-24
A' 5 IN.

Appendix B
ULTIMATE UNIT FLEXURAL RESISTANCE FOR FLAT SLAB
INTRODUCTION
The ultimate unit flexural resistance is the static uniform pressure
load, r u(psi), that a structural element can sustain during plastic
yielding of its collapse mechanism. The ultimate uniform resistance is
a function of the amount and distribution of the reinforcement (i.e.,
moment capacity of the slab strips), the geometry of the slab, and the
support conditions. A yield-line analysis is used to determine r u in
terms of these parameters.
Because of the complexity and wide choice of parameter values for
flat slab structures, it becomes imperative to develop a general procedure
for determining the ultimate resistance of any flat slab configuration.
The key to this or any general procedure is in the development of a
simple, but efficient, method that can be used for any flat slab.
Basically one needs to set up the methodology of calculating both the
iuternal and external work for any flat slab configuration (i.e.,
1.0 < 0< 2.0; various number of spans in either direction; various
wall/slab thickness ratios). In this report the calculations were
progranmmed on an HP-4iCV.
The procedure is illustrated for 3 x 4 flat slab structures
(Figure 11) for which the ACI elastic unit moment distribution has been
determined previously in Appendix A. The location and values of the
unit moments are shown in Figure B-1 and Table B-i (duplication of
Figure A-9 and Table A-7). The assumed yield-line mechanism is shown in
Figure B-2. The unknown distance quantities for this pattern are x, y,
and z. The negative yield moment along the walls is assumed to occur at
a distance of c/2 from the outer face of the wall (i.e., c/2 = wall
thickness plus haunch width). This assumption satisfies the clear span
equality criterion for interior and exterior spans mentioned in Appendix A
B-i

(i.e., L = L - c or Ln = S - c).* The division of the symmetric one-nnquarter slab into panel types (i.e., interior, I; corner, C; long side,
LS; and short side, SS) is shown in Figure B-3. These panels are further
divided into rotating sectors (rectangles and quadralaterals) about
supports for use in the calculation of external work (see Figure B-4).
EXTERNAL WORK
The external work done by ru on rotating sector i is:4u
W. = r A. A. (B-i)1 U 1 1
where: A. = area of sector i1
A. = deflection of the center of gravity (c.g.) of sector i1
A = maximum deflection of the sector
Each quadralateral sector is further divided into rectangular and tri-angular sub-sectors. The values of A and Ai for all sub-sectors are
listed in Table B-2. The total external work is the sum of the work4done on each sector. That is,
W = Wi = Er uA A. (B-2)
The external work is determined separately for each panel type after
making the following substitutions:
x x' L
y y' L
z z' L
c 0.89 a Lcap
*If the wall thickness plus haunch width does not equal c/2, one must
adjust the exterior span length accordingly. Thus, all the designassumptions remain unaffected.
B-2

Computer programs (Table B-3) were written for an HP-31CV to calculate
the external work (r uA L is factored out). The parameters stored in
the registers are shown in Table B-4. The five dimensionless input
parameters for a given yield line analysis are stored in registers 00Ithrough 04. The parameters stored in registers 05 through 20 areobtained from the initialization program INIT (Table B-5). The unit
moment coefficients are stored in registers 21 through 39. The sum of
the output from the external work programs is designated the coefficientI
of external work, "EW* That is,
W = of EW r u A L2 (B-3)
INTERNAL WORK
The internal work, E.., for each yield line is the rotational
energy done by moment n rotating through 6 n. That is:
Eij Mn 0n =mn en Pn =mx sy 0x +my sx 0y (B4
where: m*, my= ultimate unit moment capacities in the x and y
directions
s = lengths of the yield line in the y and x directions
over which m xand m yapply
6 0 -y relative rotations about the yield lines in the x
and y directions
Equations for the internal work are developed separately for each panel
type. The equations are in general terms such that they can be employed
in the design process of any flat slab configuration. Table B-6 wasI
developed at NCEL from Figures B-i and B-2 to show the parameters involved
in the internal work calculations for all the yield lines occurring in
each panel type. The absolute and dimensionless values of the lengths
B- 3

and rotational angles are listed in Table B-7. Computer programs were
written for an HP-31CV to calculate the internal work (m A is factored
out) for each panel type. The necessary parameters stored in the calcu-
lator registers (obtained from program INIT) are listed in Table B-4.
The internal work program listings are shown in Table B-8. The sum of
the output from these programs is designated the coefficient of internal
work, oIW. That is,
E = 1Ei. = 2m 0 £n n n
Eventually
E = me A 1iW (B-5)
SOLUTION OF ENERGY EQUATION
The total external work for all panels is set equal to the total
$16 internal work:
W = E (B-6)
orL2
r UL A = m A (B-7)u EW e 1lW
Therefore,
m Aor mcor mr.- e lW e lW er 2 2 r 2 (B-8)
L AciEW L aEW L
Usually, ot and P are given, and the solution involves varying x', y',cap2and z' independently until ru/(m /L 2) is minimized. This minimum solution
u eprovides both the failure mechanism and the value of the ultimate resis-
tance. To simplify and shorten this iterative procedure, the positive
yield line (rst) between columns is initially located at the mid-point.
That is, let:'B-4

z = -- (S - c) (B-9)2
Substituting yields:
z - - 0.89 a L (B-10)2 cap
or
= (-i 0. 89 tcap (B-11)
The iterative minimization solution process is then employed to determine
the appropriate values of x' and y'. The process is then repeated for
other values of z' until the r u/(me /L 2) expression is minimized. Accord-ing to yield-line theory, the positive yield line (rst) will move towards
the column with the smallest negative y-moment (m y) capacity (either
line vwx or opq).
EXAMPLE PROBLEM
Calculations were made in this section to determine the yield-line
locations and the ultimate resistance expression for the 3 x 4 flat
slab. Equation B-li was used to initially establish a value for z'.
That is,
= 0.89 acap) 1.2 (0.89)(0.20) = 0.311
A number of calculations were then made for various values of x' and y'.
These results are listed in Tables B-9, B-1O, and B-11 and plotted in
Figure B-5. The minimum solution is:
a = 10.102
ru
x'= 0.40
y'= 0.30
B-5 "
? ; ,' -, - .-, -, .- -. •.-.. .... . ". ., , . . . .. . . .. " ,-. ., ,,' ..-. " .. ., .

Substituting into Equation B-8:
(ru)min = 10.102 (B-12)
To obtain the actual minimum resistance, z' was then varied while keep-
ing x' and y' fixed at 0.4 and 0.3, respectively. The external work
coefficient, aEW' is unaffected by a change in the z' value. Therefore,
it remained fixed at 1.1531 (see Table B-9). The calculations for the
internal work coefficient are listed in Table B-12. It was necessary to
carry out the calculations to six significant figures in order to detect
a change in the z' value associated with the minimum resistance. There-
fore, for most flat slabs, a satisfactory value for z' can be obtained
directly from Equation B-11. That is, it is not necessary to employ the
iterization procedure for other values of z'.
This completes Step 2 of the Design Procedure (determination of
ultimate resistance relationship). The actual required absolute value
of ru is not obtained until Step 5 (dynamic SDOF analysis). Equation B-12
is then used to calculate an absolute value of m e . That is,
m u (B-13)e Ofru
The individual values of all the unit moments are then determined using
Equation A-l1 (i.e., m n a m ) in conjunction with the value of the' n urn
unit moment coefficients (a um) listed in Table B-1.
'4. UNIT MOMENT READJUSTMENT
In Steps 6 and II of the Design Procedure, a check on the minimum
steel percentage is made. In some cases (usually in middle bands), the
required steel percentages are less than the specified ACI minimum
(Pmin ), and these steel percentages must be increased. If so, then the
original unit moment coefficients for these sections must also be
.4.'-. increased. The following expression is the minimum unit moment coeffi-
cient that can occur:
B-6
.14:4

2!
Pmin bed fs (B-14)( u a) i n = (B 1 4
e
This new value is then used in another yield-line analysis. Note that
the values of the external work coefficients (see Table B-10) remain
unchanged. Only the internal work calculations are affected.
As an example, suppose that m2, m 3 , m 4 , and m 5 were too low and had
to be increased so that a2 = a3 = a4 = a5 = 0.120. If these new unit
moment coefficients were introduced into the internal work calculations,
the values in Tables B-14 and B-15 would result. As can be seen, the
minimum resistance still occurs at x' = 0.4 and y' = 0.3. However, a[ru
increases from 10.102 to 10.363. Since the absolute value of the required
ru remains unchanged, the required me value (calculated from Equation B-12)2 L2decreases from 0.0990 r L to 0.0965 r L . This results in an overallderaesfo 009 u u
2.5 percent decrease in the absolute values of the unadjusted unit
moments (i.e., mi, m 6 through m 18 ). Engineering intuition would have
predicted this effect.
I
I
' B-7

Table B-1. Values of Unit Moment Coefficients= 1.25; a cp= 0.20; t I t sa
= twL/t slab 1.00; H w/S = 0.5)
Unit nit Mment Adjusted Positive
Uomnt, UnefitcMoent, Unit Moment
Mmet Cofiiet Coefficient,n amU~i
ml1 0.168---
m 2 0.114---
m 3 0.111---
m 4 0.105
m 5 0.090 0.087
m 6 0.257---
in7 0.496---
in8 0.472---
m 9 0.203 0.191
in10 0.314
m 11 ~ 0.233---
in12 0.230---
in1 0.220---
in14 0.189 0.179
in15 0.349---
in1 6 0.689---
in17 0.660---
in1 8 0.284 0.255
in1 9 miniulum ---
Note: min = a um , in e'= wL 2/8
B-8

41 .2 2~ i~u M. cn' cn) m
4 m4' m4 (n ~ m ' m m
4 m (n (n I n cn
r- 0 1-4 C -1 N N* N1 N C1 Cq N~ C% N N
r-4
N- __ x(E-~~ N 4N
4) -r u u I-S s-SN U_ U
w4 C1 C- 04 a a
')0- .. N '-' e 9j Nw
$4 U IN e- 1.1% eS e. I- I-
'.4 -4 -4U1 - -4 - -.
i-s .u -H' N N ~ 1 * N -~ 04 N '-' '-Cj 1 j 0
4) 4 1-. 1-s U-. U- U- I IW .'.I~ IW
414 '- NI) I a I. IS I I IS I x I N
04) C14 04C1
(U U) NI-N N N N N) N N N. (n N
14 - 04 1 04 04 N .4 C1 -1 04 -C4 + .C4 C-4
C14 U)) 1Jc
(U 0 <J (n <1 W2 C/) <2 (n U3 <1 V)< 2 2 < <4)( U/ W. N4 N- N N N.
4))
064 [-- W 0- n=Vwr 0L0) 00 N N) N , ,
(U~ 4.' )4'- '' ' 4 Nn L
B-9-
4)~~. *.-.N

Table B-3. External Work Program Listings
a. Corner (C) b. Interior (I/A) c. Interior (I/B)
01*LBL "EC" 50 6 01*LBL "EIA" OI*LBL "EIB"02 2 51 1/X 02 2 02 203 1/X 52 RCL 00 03 1/X 03 1/X04 RCL 07 53 * 04 RCL 07 04 RCL 0705* 54 RCL 01 05 * 05*06 RCL 10 55 * 06 RCL 02 06 RCL 1407* 56 + 07 * 07*08 3 57 END 08 2 08 209 1/X 09 ENTERt 09 ENTERt10 RCL 12 10 3 10 311* 11 / 11 /12 RCL 10 12 RCL 20 12 RCL 2013* 13 * 13 *14 + 14 RCL 02 14 RCL 1415 2 15 * 15 *16 I/X 16 + 16 +17 RCL 13 17 2 17 218 * 18 1/X 18 1/X19 RCL 00 19 RCL 07 19 RCL 0720* 20 * 20*21 + 21 RCL 20 21 RCL 2022 6 22 * 22*23 I/X 23 + 23 +24 RCL 01 24 END 24 END25*26 RCL 0027 *28 +29 230 1/X31 RCL 0732 *33 RCL 1234 *35 +36 337 1/X38 RCL 1039*40 RCL 1241 *42 +43 244 I/X
45 RCL 1146 *47 RCL 0148 *49 +
(continued)
B-10

Table B-3. Continued
d. Short Side (SS) e. Long Side (LS/A) f. Long Side (LS/B)
01*LBL "ESS" 01*LBL "ELSA" 01*LBL "ELSB"02 2 02 2 02 203 1/X 03 1/X 03 1/X04 RCL 07 04 RCL 07 04 RCL 0705 * 05 * 05 *06 RCL 20 06 RCL 20 06 RCL 1407 * 07 * 07 *08 2 08 2 08 209 ENTERt 09 ENTER? 09 ENTERI10 3 10 3 10 311 / 11 / 11 /12 RCL 12 12 RCL 10 12 RCL 1013 * 13 * 13 *14 RCL 20 14 RCL 02 14 RCL 1415* 15 * 15 *16 + 16 + 16 +17 2 17 2 17 218 1/X 18 1/X 18 1/X19 RCL 07 19 RCL 07 19 RCL 0720 * 20 * 20*21 RCL 12 21 RCL 10 21 RCL 1022 * 22 * 22*23 + 23 + 23 +24 2 24 2 24 225 1/X 25 1/X 25 1/X26 2 26 RCL 18 26 RCL 1527 / 27 * 27*28 RCL 01 28 RCL 00 28 RCL 0029* 29 * 29 *30 + 30 + 30 +31 END 31 END 31 END
B-11
J6

Table B-4. RP-31CV Storage for Flat SlabYield-Line Analysis
a. Input Parameters
Absolute Dimensionless RegisterValue Value
x xt00
y y' 01
z ZI02
1/S 03
d* 0 ap 04
*c 0 89 d(continued)
B-12

Table B-4. Continued
b. Calculated Parameters
Absolute Dimensionless RegisterValue Value
S 1/p 05
c 0.89 a 06cap
c/2 0.445 a 07cap
L-c 1 - 0.89 a 08cap
S-c (1ip) - 0.89 a 09cap
L - c - x 1 - 0.89a - x' 10cap
L - (c/2) - x 1 - 0.445 a - xf 11cap
S - c - y (1/P) - 0.89 a - y' 12cap
S - (c/2) - y (I/P) - 0.445 a - y' 13cap
S - c - z (1+) - 0.89 a - 14cap
S - (c/2) - z (Ip ) - 0.445 a - z'15cap
x + (c/2) x' + 0.445 a 16cap
y + (c/2) y' + 0.445 a 17cap
z + (c/2) z' +- 0.445 a 18cap
L - (S/2) 1 - (1/2p) 19
(L - c)/2 (1 - 0.89 a )/2 20cap
(continued)
B-I 3

Table B-4. Continued
c. Unit Moment Coefficients, Gum
Unit Moment, Register Unit Moment, Registerm Number m Numbern n
m 21 m11 31
m 2 22 m12 32
m3 23 m13 33
m4 24 m 14 34
m5 25 m15 35
m6 26 m16 36
m7 27 1737
m8 28 m18 38
m9 29 m19 39
m10 30 --- --
Note: m = mn um e
B-14

Table B-5. Program to Initialize HP-31CV
Storage Registers
01*LBL "INIT" 39 RCL 0502 RCL 03 40 +03 1/X 41 RCL 0104 STO 05 42 -05 RCI. 04 43 STO 1306 .89 44 RCL 0907* 45 RCL 0208 STO 06 46 -09 RCL 06 47 STO 1410 2 48 RCL 0511 / 49 RCL 0712 STO 07 50 -13 1 51 RCL 0214 ENTERt 52 -15 RCL 06 53 STO 1516 - 54 RCL 0017 STO 08 55 RCL 0718 RCL 05 56 +19 RCL 06 57 STO 1620 - 58 RCL 0121 STO 09 59 RCL 0722 RCL 08 60 +23 RCL 00 61 STO 1724 - 62 RCL 0225 STO 10 63 RCL 0726 RCL 07 64 +27 CHS 65 STO 1828 1 66 129 + 67 ENTERt30 RCL 00 68 RCL 0531 - 69 232 STO 11 70 /33 RCL 09 7134 RCL 01 72 STO 1935 - 73 RCL 0836 STO 12 74 237 RCL 07 75 /38 CHS 76 STO 20
77 END
BIB-15

Q DC
0
co I Ic
00 EC U
C r
go uw
'00 '0 CD +'Dw0
0 00 -
CDC
0c .
1.4 >, C, E + I x C0 4. I
0 v
0M + W
1 Jo'04 C -- - - 'A
N N mU U U U
'-' '00
CD + '0 C 1
go C' I 4I. CIA NN N
a~ 00 >. N X C I '(U~~ ~ 4V C .. U ' ' 4U ~
u u ,
-1C4 r 4UU c'V
00
0 0 2 2 2___ '0
0~B 16.

0
00
00 CN I I I ci
41 IO q I I E
CN
0EE
o004,-
10 01 '
xN (
aB-17N

I -. '- -~--------------- - - - - - -- ----
iC
00
0-0
0
: 5,4
uL
~~IF"
C-4 C1
,e'
0)
C S I I I i i
i i
ox
-u 0
Z) 0 r=
oo
I N N
>4 >4
B11
4) a 4 .--o
oI " , .. t .7* , 1f4 . 4I
CE I S
.' . I 0 .
0 0 0 0 0 0
'-4U __- -
-a . N --~ C 0 -. 4 -

a. c
a..
41
0.J
A~~ ~ .x---a
-4 Oa U tI a
00c
lu0
B-1 --

000
4r.
V - .1
CEE E E
CD
0 qj
* cj ~ Er0 F 0
0 ~ ~ Z (N ( N i L
S0- '
C Li Li 0
VIII
Vu NNN N

cu 0
000
0 0
00I'
14 00.C
4) c IV I I)
0 qU
040
I 0 0 0
00 000e V
N0 x 9 n N
e . - -. ..
1i2~B- 1J'a

0
cn 0)
W -'
4 41 04 04 U U> 0 4 0 0
tv 0z FZ 0 u) If I0u Uu - 04
M ON ON m%- - 04 cc$4 co cm to - - 0 000. * 0. 0. 0 U4) -4* 0% x4 0', N W) 0 rT C14 -T 0 U t3
41C o co -.. 0 -.1 Q IT -- 4,j4) 0 * - - -4 -4 I --4 i
0 0) 0m Co -T '1.4 1- -4 _- -. .
0 r-4 -7 4
-*- 5-I-
-4WC/4T
00
0 %-W -41
04 1. 1 , -- *- > -
U) _) C14.
W -4
0 a a B-U2

4)1
*S -
4 -4 -t -
0 '-N
Cu N4
C14 C1 I.. I
It . It) 04IuC4rU) - ~ ~ . C-S -* 4 o
I ~ C' 04~- I)4
~C4 4) fA0 0
0.5 %- I-4 - **
4-b 1 -- -% I04 X N- -%
o + -
B-2

Table B-8. Internal Work Program Listings
a. Corner (C)
01*LBL "IC" 51 RCL 01 101 402 RCL 05 52 1/X 102/03 4 53 RCL 12 103-04 / 54 1/X 104 RCL 1005 RCL 19 55 + 105 /06 + 56 RCL 05 106 207 RCL 05 57 * 107*08 2 58 4 108 RCL 3109 / 59 / 109*10 + 60 RCL 26 110 +11RCL 07 61 * 111RCL 1312 2 62 + 112 RCL 0513* 63 RCL 05 113 414- 64 4 114/15 RCL 01 65 / 115-16 / 66 RCL 12 116 RCL 0017 RCL 21 67 / 117 /18* 68 RCL 27 118 RCL 3119 RCL 11 69 * 119*20 RCL 05 70 + 120 +21 4 71RCL 05 121RCL 1722/ 72 4 122 RCL 0523- 73 / 123 424 RCL 01 74 RCL 00 12425/ 75/ 125-26 RCL 22 76 RCL 30 126 RCL 0027* 77 * 127 /28 + 78 + 128 RCL 3129 RCL 11 79 RCL 05 129*30 RCL 05 80 2 130+31 4 81 / 131RCL 1032 / 82 RCL 00 132 1/X33- 83 / 133 RCL 0034 RCL 12 84 RCL 30 134 1/X35 / 85 * 135 +36 2 86 + 136 RCL 0537* 87 RCL 05 137 *
38 RCL 22 88 4 138 439* 89 / 139 /
40 + 90 RCL 07 140 RCL 3541RCL 16 91 - 141 *42 RCL 05 92 RCL 00 142 +43 4 93/ 143 RCL 0544/ 94 2 144 445- 95* 145/46 RCL 01 96 RCL 30 146 RCL 10
*47/ 97 * 147/48 RCL 22 98 + 148 RCL 3649* 99 RCL 13 149 *50 + 100 RCL 05 150 +
151 END
(continued)
B-24

Table B-8. Continued
b. Interior (I/A) c. Interior (I/B)
01*LBL "IIA" 01*LBL "IIB"02 RCL 19 02 RCL 1903 RCL 02 03 RCL 1404/ 04 /05 RCL 25 05 RCL 2506 * 06 *07 RCL 05 07 RCL 0508 4 08 409 / 09 /10 RCL 02 10 RCL 1411 / 11 /12 RCL 27 12 RCL 2813 * 13 *14 + 14 +15 RCL 05 15 RCL 0516 4 16 417 / 17 /18 RCL 02 18 RCL 1419 / 19 /20 RCL 29 20 RCL 2921* 21*22 + 22 +23 RCL 18 23 RCL 1524 RCL 05 24 RCL 0525 4 25 426/ 26/27 - 2728 RCL 20 28 RCL 2029 / 29 /30 2 30 231 * 31 *32 RCL 34 32 RCL 3433 * 33 *34 + 34 +35 RCL 05 35 RCL 0536 4 36 437 / 37 /38 RCL 20 38 RCL 2039 / 39 /40 RCL 36 40 RCL 3641 * 41 *42 + 42 +43 RCL 05 43 RCL 0544 4 44 445 / 45 /46 RCL 20 46 RCL 2047 / 47 / _
48 RCL 38 48 RCL 3849 * 49 *
50 + 50 +51 END 51 END.
(continued)
B-25
"KAI.
Mlvlv

Table B-8. Continued
d. Short Side (SS)
01*LBL "ISS" 50 *02 .5 51 RCL 3403 ENTERt 52 *04 RCL 01 53 +05 / 54 RCL 0506 RCL 21 55 407* 56 /08 RCL 01 57 RCL 2009 1/X 58 /10 RCL 12 59 RCL 3611 I/X 60 *12 2 61 +13* 62 RCL 0514 + 63 415 RCL 19 64 /16 65 RCL 2017 2 66 /18 / 67 RCL 3819 RCL 22 68 *20* 69 +21 + 70 END22 RCL 0123 1/X24 RCL 1225 1I/X26 +27 RCL 0528*29 430 /31 RCL 2632 *33 +34 RCL 0535 436 /37 RCL 1238 /39 RCL 274041 +42 RCL 1343 RCL 0544 445/
'.4' 46 -47 RCL 2048 /49 2
(continued)
B-26

Table B-8. Continued
e. Long Side (LS/A) f. Long Side (LS/B)
01*LBL "ILSA" 50 / 01*LBL "ILSB" 50 /02 RCL 11 51 02 RCL 11 51 -
03 RCL 05 52 RCL 10 03 RCL 05 52 RCL 1004 4 53 / 04 4 53 /05/ 54 2 05/ 54 206- 55 * 06- 55 *07 RCL 02 56 RCL 31 07 RCL 14 56 RCL 3108 / 57 * 08 / 57 *09 2 58 + 09 2 58 +10 * 59 RCL 18 10 * 59 RCL 1811 RCL 25 60 RCL 05 11 RCL 25 60 RCL 0512 * 61 4 12 * 61 413 RCL 05 62/ 13 RCL 05 62/14 4 63- 14 4 63-15 / 64 RCL 00 15 / 64 RCL O016 RCL 02 65 / 16 RCL 14 65 /17 / 66 RCL 31 17 / 66 RCL 3118 RCL 27 67 * 18 RCL 28 67 *19 * 68 + 19 * 68 +20 + 69 RCL 10 20 + 69 RCL 1021 RCL 05 70 1/X 21 RCL 05 70 1/X22 4 71 RCL 00 22 4 71 RCL 0023 / 72 i/X 23 / 72 1/X24 RCL 02 73 + 24 RCL 14 73 +25/ 74 RCL 05 25/ 74 RCL 0526 RCL 29 75* 26 RCL 29 75*27 * 76 4 27 * 76 428 + 77 / 28 + 77 /29 RCL 05 78 RCL 35 29 RCL 05 78 RCL 3530 4 79 * 30 4 79 *31 / 80 + 31 / 80 +32 RCL 00 81 RCL 05 32 RCL 00 81 RCL 0533/ 82 4 33/ 82 434 RCL 30 83 / 14 RCL 30 83 /35* 84 RCL 10 35 * 84 RCL 1036 + 85/ 36 + 85/37 RCL 18 86 RCL 36 37 RCL 18 86 RCL 3638 RCL 05 87* 38 RCL 05 87 *39 4 88 + 39 4 88 +40/ 89 END 40/ 89 END41- 41-42 RCL 00 42 RCL 0043 / 43 /44 RCL 30 44 RCL 3045* 45 *46 + 46 +47 RCL 18 47 RCL 1848 RCL 05 48 RCL 0549 4 49 4
B-27
I-%"
", 'L#"W' " -- q'W','-qqP "L<' ' -"LW- o
• '."" * - - " "- "' """ % "m k' ' " " .' - "- ". "- % . . " " " " " " '" "-- " - -'P
ta.,, "d ., ,,' 1,, , ,, ' " "/ P "/' " "P, #- -- 4 ' "'4 " " " "
- -' , ;,
. . . t'A - ." -. ".. t ," . " ,' - " ' "" "" "" f"" "-

COm - 4 J&UmG n m m m 1 nJ 1
4-1 W, W 04 r'- 00 .4 LI) IT r- %l O -. ) lZ Cn C'Y) C14 N ~ (
0 41~ 0 4.4 w , - - 4 -E-x 3t4.4 Z
cu- 4 - 4 .4 4 - ~ ~ '
0
14- -1. ~ t - - -4 -4 1-4 1 n U, U, Lei U,V 00 C1 N4 N* C1 0) 0 0 0 0 r'- P-. r- r- ,-.
a. 0 0 0D 0D 0D 0) 0 Q a 0 ON ON as 0%mU 0Cc1 (n C1 C1 C1 4 C4 C4 N1 C N cq -r- -
-4c .
-7T cIn N N C1 (14 0 0 0 0 a r- r- P- r- r-0) a 0 0 0 0D 0 0 a 0 ON ON % 0% ON
x ~ 0C V) N N1 N1 N1 N1 C1 N 1 N N -4 14 -4 r-4
0'- 0D 0 0 0 0) 0c 0 0 0 0
0
(n U2 .1*,4 r- C 7 00 I a r- n 00 1? 0 r- m 0 -'T 0c w~ C/n- N 0% U, N 0 N 0% U, N s 0% N s 0 U, N %0 W Ci D 01 CN as 00 0 0% m% m 00 0D ON % ON 00-4 b .)Jj N -4 .4 i N - rI 4 4 r4 N- 1-4 '
CU 0 0 0 0 0 0 0 0 0-4 -4 .
0) C/
0 m cn Cn cn CY M M Ct') M4
M~ cn 4
)
w~ -- 0. 4 .4 41- .4 r-4 -4 -4
w. Q)- - - 4 -4 r-4 r4 -4 --
1-4
cu- r- - Ir- r- F- r- - F-- F-- F-- F- F- -- F-1-. 4 r- -4 .4 - 4 r-4 14 .4 1 4 -4 r"
x 1-4 r- -414 r-4 r4 r-4 I
$4 T ( C* -Z Ln , 0 C14 -- 0
1 C. 0u 0 0 0 0 0N 0 0 0 0 1 0 0 D 0 m
-4 -4, -nC4 -4 -4 -4 - 4 -4 -4 m -4 r-4 1-4 -4
-4 r 4 r-4 .4 4 14 r4 r 4 I" I" 1 4 r4 NN M n M cn cn n cC, (C, C, MC (C, C, (cn mC mC
CD o 0 0n 0D 0 0 0 0n 0 0 0n 0 0n 0
o 4 U 0 n U, T 0 U, 0T U, C en U, 04,
- 0 C) C, C; N ; N; (C, 0C 7 N , C)*
B- 28

-4mc aj ('4 041 Ln 0 '.0 V) 0 r- 00 -4 ON '4 0 '0
,-4~ C 4 r- r- Ln -1 r- 0 r" (3 -4 C" Co ON 'T -It 0A-j4) - LA- a 00 cc 00 00 %D- '4 1.0 cc '. 4 0 -. 0"U0Q~- 4.) 0 ~ 04 cci c -. c '0 LA '0 (J cc L
C: :3t4-4 Z344 0 C- 04) 4 -4 1- - -4 4 -4 4 4
0
-- -4 -4 -4 4 C'4 C14 C14 C'4 C'4 00 00 00 00 00W g r- r-- r- r- r- co 00 00 00 00 00 00 00 00 c0
I. LA UlA LA LA ull r4 -4 -4 -4 -4 1" -4 4 1"
0
-4 a L) Ln ulA Le) LO . . . '.0 %D0 C.4 C' (4 (444 -4 '4 0'4 CsJ 0' ' ~(4 C14 C" ) C " -m4 '4 IT IT IT I
U r- (I- r- P- vr- (4) CY (v') m CV) ("4 CY) ("4 C") mV'C% ON ON0' 0 0*1 0' 0M 0'N ON 0s 07% 0'. 0as 0. ON m
x 0 .4. -. 4 '
o0
44 10tol .4 C14 c0 \0 CY4 LA ('4 00 %Q0 Cm' LA (4 cc '0 m' LA
cn 0.) c 1 r'- c) cc ON '.0 I'- Cf) co 0'% '.0 r'- CY) 00 0" \.0c En (M L 00 00 10 m LA 00 00 \.O C\ LA c0 00 \.D
o0 p, V 0 cm 00 0 0 C\ 00 0' O 0 M' 00 cc m'04 E'-44' - '4-
-4 .
-4o cccccc c c c cc c c c c c c c
-4 04 w
m0 ('4 ('0 04 C0 ('4 C0 ('4 0j 00J 004 0 0'4 ('4 (' 0'4-) -4 --N '4 '4 '4 '4 '4 '4 r- '4 '4 '4 '4 f 4 '4 '4I-
w0. (4 ('4 N' ('4 ('4 04 ('4 ('4 ('4 N' C14 C"4 (4 ('4 ('4.W4 w - 4 -4 -4 -4 -4 -4 -4 -4 -4 -4 -4 C4 -4 -4 4
-4-
-0 0'i C14 '4 0 01 '4 r. C4 C") Cc-4 (' C4 0 ccCYC M.L 0m M. MA '4 MA cc) L) '4 V"4 (4 c A (" CY) CY)
w) N.. ("N" C4 N" N" NV' CN) C C C" CN C14 CN C'4 N"-41
- ~~-4 r-4 -4 -4 - -4 - -4 - -4 - -4 4 -4 4
SM" C14 \D) -4) a" C") It) C) ON C") 0") C) ("4 0" C")
o u 0\\ - T L 0 0 0) 02 0n c 0 0 0n 0V 0C 000
('- 4 -C" C) 4 ('- 41 C C) 4 ('4 '4 -4) -) '-4
o oe 0 0n 0 0) 0 0 0n 0 0) 0r 0) 0 0
N" '4 '4 V''-4 1 M c T C4 C4 C) () 1
0 0 C0C ' C> ; C
Lf) L7
B- 29

Table B-11. Ultimate Resistance Calculations
I al OEW Oru
0.20 0.311 12.457 1.184 10.520
0.25 0.311 12.047 1.174 10.263
0.35 0.30 0.311 11.836 1.164 10.172
0.35 0.311 11.781 1.153 10.215
0.40 0.311 11.898 1.143 10.409
0.20 0.311 12.291 1.174 10.472
0.25 0.311 11.871 1.164 10.203
0.40 0.30 0.311 11.649 1.153 10.102
0.35 0.311 11.582 1.143 10.134
0.40 0.311 11.683 1.133 10.315
0.20 0.311 12.260 1.163 10.538
0.25 0.311 11.829 1.153 10.259
0.45 0.30 0.311 11.595 1.143 10.146
0.35 0.311 11.514 1.133 10.167
0.40 0.311 11.599 1.122 10.335
*From Table B-10.
N~*'From Table B-9.
~rofIW r u
ru oEW me/L 2
B-30

~~r J . C'J - t A ON IT Lnm 4-4- 3: 0 LO %.D 0 00 00 Ch N~ -4*4-1 W 0- C'4 Ln r- --I -4t -1 'D -T ON0Aj 0 -4~ Z3 I- .0 %D0 '.0 Q. . ~
4 44 C. 4 . 4 4 .)-4 1-4 .4 4 1- 4 -4 -4
0
Cuu
r-44
.fLI) 110 It C'J '.0 - t co41W o CY) - 0> 00 r- r- 00 -T ONm -Ln r- ~- -4 -1 '-4 0D r-4 0
- 0V 0 as 0) ON ON a% (M ON
CY4 cuC~ - (4 A C .
0) 00rC) M ON ON 0 ON ON a% a% 00o CY) 0- " 4 . - - -
Co Co Co Coo4C Co
30 C )
-I C
m at 4 (n 0 0 00 00 co 00 0.0 0- 00u'.4 r 0 00) 0 o 0 '0.0 0-4 04) 0~~'0 00 00 00i C0 c-i 00 00 -0
J4- 0 E
$4 -4
-4 . - U
C: 0 LAr 0D t% 00i 0-0 0) 0. r c144 X -,4 Co Mt -7 r 0 N -4 0'
4) $4 . %-A 00 C-D C'14 C14 C14 1i -1 r-4
.) w ~ 4j Cq .4 .44 m4 -
Cu
H -_ __ ON__r _____mm ____ ____ ____
5-4 m T 0 1? - -T r4 as~4) V) M- C14 C14 C%- r-4 r-14
C:_M_ c-i cn M' cn M M2 -
_0
B-31

to = Y - ..c N. 00 C'.J f-- ' IT 00 '0) ON r-. C" 4 C14 C)41 W W " 00, 0- V0 C.0 5- CN - --T 0 00 ~-4 N. CJ Os 0
0~~ ') 0o -4- 7Z 0, CJ 0 % V) -t 00 ON -) 0 r- 00 C
A'43c 4-4
- j 1" ,- - 4 r - -4 --4 4 r9 4 - ,4
0
(V- C 4 C'4 C4 C4 C-4 '4 - 4 - 14 C1 4
CY V YCV 0 0 0 0 0 % 0 00 00 0% r- 0% 0% 0%
0'- C"J (" c'4 C'i C'4 - 4 - 4 4 - -
-4 .-4 "-4 - - 4 0 ' . .0 ' '0 ' '%D .D '.0
V2 -T 'T .1 12 'T m% m% m% ON ON 00 C0 0o Co 0c;o 0000 0 En 0 0% C) 0% 0% 0% 0% 0%C 1 O
x 11 C: " C4 N (14 ("4 C("4 -
VY Lf)
0 11
(Ab.H 00 r- Co r- CY 00 5'- Co r- CY) 00 r- Co r- CYa (A~ (/n- -Z 0) in r r- -T 0 Ln r'- r- -T 0 V) r- I'-
0 11 rn -4 0% to 0 00 1-4 0- 0 a 00 - 0 0 0 00.,4 0 ON4 - 0% ON ON4 '4 ON as ON4 ON4 -ON
-4 .4
II0 Ln Ln IA) Ln LA) LA Ln Ln LA) Ln LA LA V Ln LA
ON' m 0% ON m% m% 0% 0 % 0% m% m 0% m% m 0m0 .-H '. ej C'4 c'4 C4I ("4 (4 C'4 C'4 N" ("4l 04 C"4 0"4 C1 (4
A* -4
4o C% 0D 0 0 0 0 0 0 C C) 0 0 0 0 0
r0 0-- '0 '0 '.0 '.0 'C0 It '0 '0 '.0 %D0 'N '0 '.0 '0 C .44)S4 0- 0 0 04 0- 0 0 0 0V 0N IT 0t 0T 0 0-
-4(V oo r4 t- (n M ~ %.D ON %0 t- C) C4 cn
S.' w- Co I- CA 0n -1 o D IT -m . ('4 -.1 . '0 m
5- Co '-4 5'- 0% r. Co 0 CA 0% '4 '4 '4 C'4 -4
-44 0-' Co 1- N 4 1-4 0%4 '4I '. -4 '0 . 0 (4 C.0cC.) 0 N.) uY) mA CA C0 ' - CV) -Y C) mA M CYA Cn
CA C CA CA CA CA CA 0* CA CA 0' C ')
0D 0l 0 0l a 0) 0 0D 0 0 0 0) 0D 0 0oN C4 0Y CA 0a 0N CA 0n mA 0 0 NA 0 CV) It
c; CA c; '4c; C
B-32

Table B-14. Ultimate Resistance Calculations for(eum)min = a2
= a3 =a 4 a 5 = 0.120
Coefficient of Coefficient of Coefficient ofx' y' zi Internal Work,* External Work,-,h ° Ultimate Resistance, '-,'
alW aEW aru
0.20 0.311 12.784 1.184 10.797
0.25 0.311 12.371 1.174 10.537
0.35 0.30 0.311 12.159 1.164 10.446
0.35 0.311 12.106 1.153 10.500
0.40 0.311 12.228 1.143 10.698
0.20 0.311 12.594 1.174 10.727
0.25 0.311 12.172 1.164 10.457
0.40 0.30 0.311 11.949 1.153 10.363
!0.35 0.311 11.884 1.143 10.397
0.40 0.311 11.989 1.133 10.582
0.20 0.311 12.541 1.163 10.783
0.25 0.311 12.107 1.153 10.500
0.45 0.30 0.311 11.872 1.143 10.387
0.35 0.311 11.793 1.133 10.409
0.40 0.311 11.881 1.122 10.589
*From Table B-13.
*--From Table B-9.
aiW r u
ru GEW me/L2
e
B-33
, ,-, -. " . .i . - . -.- -. . . . . . - -" -. . , = " ".,. - ,- - -.-- ,'.. %' . .

S Syex 4 4y
s~ ~L-- 'm2 my 2
S SS cx 2T cY 2-
x
s /2 Sc srr s
lo mx bi1K mx ex.4 M. ~ 8 m4
M -3 -9m 5 in1 9
mn4 M8 T- -m 4- - -19
;i- M 19in3 I
2- M
m M- t MII j I
L/2 1 4L
Figure B-i. Unit moment distribution for 3 x 4 flat slab.

y
yz a, -C , CyU
U
r 7
0 p qequivalen
d eN
11 2 al-Lal
Figure B-2. Yield-line mechanism for a 3 x 4 flat slab.
B- 35

I = InteriorLS - Long side
S8 - ShmtsdeC - CONI
00
Figure B-3. Panel designations for 3 x 4 flat slab.
B-36
17111~ 'Y I

L/2 LC C121
I "L
Figure B-4. Rotating sectors for internal work calculations for 3 x 4~flat slab.
B-37

11.0
S10.5
10.0O -- O x'= 0.35
Q--Dx'=0.40
0.20 0.30 0.40
Figure B-5. Minimum r ucurves ('=0.311).
B- 38

Appendix C
EFFECTIVE UNIT MASS FOR FLAT SLAB
INTRODUCTION
The effective unit mass of a flat slab is given by:
mef = K m (C-I)
where: m = actual unit mass (lb-sec 2/in. )*2 3
mef = effective unit mass (lb-sec /in. 3 )
KI = load-mass factor
Because of the complexity and wide choice of parameter values for flat
slab structures, it becomes imperative to develop a general procedure
for determining the effective plastic unit mass for any flat slab configu-
ration. Also, adding to the complexity is the possible presence of drop
panels and soil cover. Both of these conditions are addressed in this
Appendix. The key to this or any general procedure is in the development
of a simple, but efficient, method which can be used for any flat slab.
This Appendix contains the recommended procedure, which has been program-
med on an HP-41CV.
The procedure is illustrated for the 3 x 4 flat slab structure
(Figure 11) previously analyzed in Appendixes A and B. Parameter studies
are also made for other configurations.
ACTUAL UNIT MASS
For a flat slab without drop panels, the actual unit mass equals:
m = mslab + mob = Pslab tslab + Pob tob (C-2)
C-i
pe N% N

where: mslab = actual unit mass of slab
mob= actual unit mass of soil overburden
Pslab = mass density of slab
tslab = thickness of slab
Dob = mass density of soil overburden
tob = thickness of soil overburden
For a flat slab with drop panels, the actual unit mass is obtained from
this expression:
m= (C-3)AT
where: NT = total mass (slab + soil overburden + drop panel)
AT = total slab area
Note that these quantities represent that portion of the structure whichrotates (deflects). Therefore, the mass/area inside of the equivalent
square capital and outside of the perimeter yield line (haunch) is
excluded in the calculations. Now,
MT = (m ob + m slab ) AT + Mdp Adp (C-4)
or
MT = (Pob tob + Pslab tslab) AT + Pdp tdp Adp (C-5)
where: mdp = actual unit mass of drop panel
Adp = area of drop panel (minus area of capital)
Pdp = mass density of drop panel
tdp = thickness of drop panel
Substituting Equation C-5 into Equation C-3 yields:
M=P t +P tA dp (C-6)= ob tob + Pslab lab + Pdp tdp AT
C-2

PLASTIC LOAD-MASS FACTOR
As shown in the main text, the plastic load-mass factor for flat
slabs without drop panels and with or without a uniform soil overburden
equals
I
K 1' (C-7)ILM 1 A
where, for each sector:
I = area moment of inertia about the axis of rotation
c = distance from the resultant applied load to the axis ofrotation
LI = total length of sector normal to axis of rotation
A = total area of sector
For a flat slab with drop panels and with or without soil overburden the
load-mass factor equals:
I' ' cL 1Um
KLM 1 1 I (C-8)
where: I = mass moment of inertia about the axis of rotationm
M = total mass of sector
To determine the numerators of Equations C-7 and C-8, the flat slab
is divided into the same rotating sectors used for the external work
calculations. Figure C-1 is a reproduction of Figure B-4, which is for
the 3 x 4 flat slab example. For a flat slab with drop panels, the
additional rotating sectors are shown in Figure C-2 as the dotted areas.
The numerator of Equation C-7 then becomes:
C-3

at) i short)(fla)-L- (corner) + -(interior) + cL sd
-lslab cL 1 cL 1 U side
+ -(- long) (C-9)
The numerator of Equation C-8 becomes:
I/flat I m I m I /short)
__ I-slab - 1 (corner) +- (interior) +-lIside
I (Iong\+ -- _side/ (C-1)
Each of the four terms on the RHS of Equation C-1O contains mass contri-
butions from the slab, soil overburden, and drop panel. If the drop
panel contributions are separated, then Equation C-1O can be rewritten
Pas:
' (flat I flatcL 1 s l ab) Pob tob + Pslab lab E -L1slab /
+p p - ( drop (C-11)+ dp tdp .cL l~panel (C)1
Since YI/cL (flat slab) was already calculated in Equation C-9, only
the additional effects of the drop panel have to be considered. There-
fore, the amount of calculations has been reduced.
To determine the denominators of Equations C-7 and C-8, it is not
necessary to individually determine the area or mass of each rotating
sector. Since the total area or mass is independent of the yield-line
locations, it is easier to determine the total area or mass by using the
overall slab dimension and then subtracting the area of the nonrotating
column capitals and wall haunches. The total mass for a flat slab with
drop panels is given by Equation C-5. That is,
M = (P ob t ob + Pslab tslab) AT + Pdp tdp Adp
C-4

-- -. -. - - -- -
Finally, after substituting Equations C-11 and C-5 into Equation C-8:
(P t + + ) (flat) + tp II (drop_
(Pobob slab tslab) cl Islab + Pdp panel/
LM ~(Pob tob +Pslab tslab) AT + Pdp tdp Adp
. . . . . (C-12)
Figure C-3 shows the I/cL values for triangular and rectangular
rotating sectors. Each value consists of the quantity b d times coeffi-
cient alM, where b is the length of the sector side parallel to the axis
of rotation, and d is the length of the sector side perpendicular to the
axis of rotation. Therefore, the I/cL I values for any rotating quadra-
lateral sector equals:
cL d[ b)rectangle + LM triangle (C-13)
EXAMPLE PROBLEM
Calculations were made in this section to determine the effective
plastic unit mass for the 3 x 4 flat slab structure (Figure 11). Both
configurations with and without drop panels are considered.
The load-mass parameters for the flat slab without drop panels are
listed in Table C-1. The I/cL1 expressions are then listed in Table C-2.
Programs were written for an HP-31CV to calculate these values for each
panel type (corner, short side, interior, long side); these program
listings are shown in Table C-3. These programs make use of some of the
storage registers assigned earlier in the yield-line analysis; they are
reproduced in Table C-4. The result of the yield-line analysis of
Appendix B is as follows:
x'= 0.40
y'= 0.30
z'= 0.311
C-5

That is, according to Table B-11, the minimum ultimate resistance of the
flat slab occurs for the above yield-line locations. Therefore, it is
only necessary to calculate K for this yield-line pattern. The denomi-
nator (TA) of Equation C-7 is calculated as follows:
I A = (.5L)(2S) - c 12 - 2 (2S) 2 5L) +
= L Lwhere: S = - 1. (C-15)1.25
c = 0.89 a L = (0.89)(0.20) L = 0.178 L (C-16)cap
Substitution yields,
I A = 2.0845 L2 (C-17)
The calculated I/cL1 values for the six panel types are listed in Table C-5.
The total 7I/cL (flat slab) value equals 1.4352 L 2 . Therefore, substi-tuting into Equation C-7 yields:
K 1.4352 L2 = 0.689LM 2.0845 L2
The actual unit mass is given by Equation C-2. Assume that the followingconditions exist:
tslab = 16 in.
tob = 12 in. = 0.75 tslab
Pslab = 0.000217 lb-sec 2/in.4
= 0.000150 ib-sec2 /in. 4 = 0.69Pob Pslab
Substitution into Equation (C-2) yields:
m = (Pslab)(tslab) + (0.69 pslab)(0.75 tslab)
1.518 pslab tslab
= 0.00527 lb-sec 2/in.3
c-6
p.;

For the flat slab with drop panels (assume Ldp = 0.4 L and
S dp= 0.4 L), Equation C-12 must be used to determine K L. The first
terms of the numerator and denominator which represent the slab and
overburden, only, are already known. That is,
Pob tob + Pslab tslab = 1.518 pslab tslab
AT = 2 A = 2.0845 L2
I (flat 1.4352L 2
cl, 1 slab/
Table C-6 lists the parameters (d, b, aLM) needed to determine the
second terms (drop panel contribution). Because the drop panel is
square (i.e., Ld = Sdp), all 12 sectors are identical. Therefore,
IL (drnel) = 12[.-(j(0 2 L + - ( 2 L (C-18)
(0.2 L c
=12 [(!-)(0O.18 L) (0.2 L - 0.178 L)
+ 30.2L - 0.178 L )(0.2 L - 0.178 L)
= 0.1346 L2
The drop panel area, Adp, equals:
Adp 1.5 [(0.4 (0.4 - c2 ] = 0.1925 L2 (C-19)
Substitution into Equation (C-12) yields:
K - [N(1.518 pslab tslab)(1.4352 L2 ) + Pdp td (0.1346 L2)
(1.518 p slab tslab)(2.0845 L2 ) + Pdp tdp (0.1925 L
2)
. . . (C-20)
C-7

I
Assume that the following conditions exist: Itslab = 16 in.
t dp= 6 in. = 0.375 tslab
Pslab = pdp = 0.000217 lb-sec 2/in.4
Substituting into Equation C-20 yields:
[(1.518 pslab t )(1.4352 L ) + (P )(0.375 t )(0"1346 L 2 )slbslab slab slab
K =
[1.518 pslab t slab)(2.0845 L 2 ) + (Pslab)(0.375 tslab)(0.1925 L 2)]
22.229 pslab tslab L
2 = 0.6893.236 pslab L
Thus, there is no change in the K value. The actual mass is given byLMI
Equation C-6. That is,
Ap
M = o P t + P t Adpob ob slab slab Pdp tdp AT
Substituting yields:
(0 .19 2 5 L 2
m = 1.518 pslab tslab + (1.0 Pslab)(0.375 tslab) (2.0845 L2
= 1.553 pslab tslab
= 0.00539 lb-sec 2/in.3
Therefore, there is only a 2.3% increase in the unit mass because of the
drop panels. For practical purposes this can be neglected during the
design process.
C-8

PARAMIETER STUDIES
For comparitive purposes, K was calculated for the 15 iterativeLM
values of x' and y' employed in the yield-line analysis of Appendix B.
These results, listed in Table C-5, indicate the relative insensitivity
of K LMto yield-line locations. That is, K LMvaries slightly from 0.679
to 0.698.
Another comparative sensitivity study was made for different values
of 0 (i.e., 1.00 < P< 2.00). The location of the yield lines were
assumed as follows:
x'= 0.4
y= 0.375/p
The calculated values of K LMfor five values are listed in Table C-7.
These results again indicate the relative insensitivity of K M*That
is, K LMvaries from 0.682 to 0.691.
CONCLUSION
This Appendix outlines a procedure for determining the effective
unit mass for flat slabs with and without drop panels. The plastic
load-mass factor , K was shown to be unaffected by the introduction ofLM'
normal sized drop panels. Therefore, Equation C-7 can be used for flat
slabs with or without drop panels. The actual unit mass was shown to
increase only slightly (2.3%) upon the introduction of normal sized drop
panels. Therefore, Equation C-2 can be used to determine the actual
unit mass for flat slabs with or without drop panels.
C-9
I.

Table C-1. Load-Mass Parameters
Rectangle* TrianglePanel Sector d
b b OLl
C-1 L - c - x c/2 S - c - y 3/8
Corner C-2 x S - (c/2) - y y 1/4
(C) C-3 S - c - y c/2 L - c - x 3/8
C-4 y L - (c/2) - x x 1/4
I/A - I z c/2 (L -c)/2 3/8
Interior I/A - 2 (L - c)/2 c/2 z 3/8
(I/A;I/B) I/B - 1 - c - z c/2 (L - c)/2 3/8
I/B - 2 (L - c)/2 c/2 S - z - c 3/8
SS - I (L - c)/2 c/2 S - c - y 3/8
Short Side SS - 2 S - c - y c/2 (L - c)/2 3/8
(SS)
SS - 3 y L/2 -
LS/A - I z c/2 L- c- x 3/8
LS/A - 2 L- c -x c/2 z 3/8
Long Side LS/A - 3 x z + (c/2) - -
[ . (LS/A;LS/B)L LLS/B- 1 S- c -z c/2 L- c- x 3/8
LS/B -2 L- c -x c/2 S- z -c 3/8
LS/B -3 x S- z- (c/2)
*For rectangular sectors: =LM 2/3.
C:-10

u 1 N
_ I I
N r+. +
(,I IIcN~I4.
.9- +
+ +
N +.ul N >-
00 + u N + N x4) 1. .- . C4 I
+ -x I +.
C u U
U INI
I, --u __ U- -0.
04 n I+ CA I-n
NJ J
H~~ Cii I.I-I4.-n+ N N---
w w~
4-1 0)1-4 $ 0 0) 0)
m 0 u =cn 0 1
C:- I I

Table C-3. Program Listings for I/cL Calculations
a. Corner (C) b. Interior (I/A) c. Interior (I/B)
01*LBL "CC" 01*LBL "IA" 01*LBL "IB"02 RCL 06 02 RCL 06 02 RCL 0603 3 03 3 03 304 / 04 / 04 /05 RCL 12 05 RCL 20 05 RCL 2006 3 06 3 06 307* 07 * 07*08 8 08 8 08 809 / 09 / 09 /10 + 10 + 10+11 RCL 10 11 RCL 02 11 RCL 1412* 12 * 12*13 RCL 13 13 RCL 06 13 RCL 0614 2 14 3 14 315 * 15 / 15 /16 3 16 RCL 02 16 RCL 1417 / 17 3 17 318 RCL O1 18 * 18*19 4 19 8 19 820 / 20 / 20 /21 + 21 + 21 +22 RCL 00 22 RCL 20 22 RCL 2023 23 * 23 *24 + 24 + 24 +25 RCL 06 25 END 25 END26 327 /28 RCL 1029 330 *31 832 /33 +34 RCL 1235 *
36 +37 RCL 1138 239 *
40 341 /42 RCL 0043 4
44 /45 +46 RCL 0147 *
48 +49 END
(continued)C-12
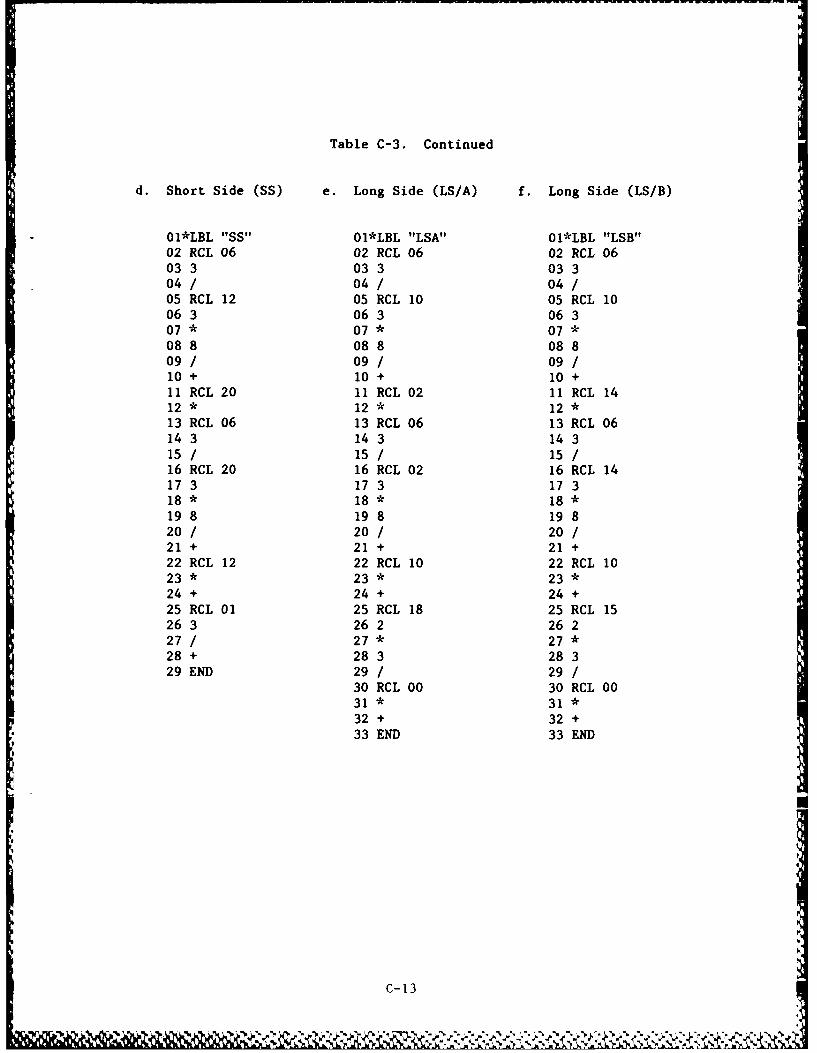
Table C-3. Continued
d. Short Side (SS) e. Long Side (LS/A) f. Long Side (LS/B)
01*LBL "SS" 01*LBL "LSA" 01*LBL "LSB"02 RCL 06 02 RCL 06 02 RCL 0603 3 03 3 03 304 / 04 / 04 /05 RCL 12 05 RCL 10 05 RCL 1006 3 06 3 06 307* 07 * 07*08 8 08 8 08 809 / 09 / 09 /10 + 10 + 10 +11 RCL 20 11 RCL 02 11 RCL 1412* 12 * 12 *13 RCL 06 13 RCL 06 13 RCL 0614 3 14 3 14 315 / i5 / 15 /16 RCL 20 16 RCL 02 16 RCL 1417 3 17 3 17 318* 18 * 18*19 8 19 8 19 820 / 20 / 20 /21 + 21 + 21 +22 RCL 12 22 RCL 10 22 RCL 1023* 23 * 23 *24 + 24 + 24 +25 RCL 01 25 RCL 18 25 RCL 1526 3 26 2 26 227 / 27 * 27 *28 + 28 3 28 329 END 29 / 29 /
30 RCL 00 30 RCL 0031* 31 *32 + 32 +33 END 33 END
C-13
" " "'', " * ' "'--. Y " ,'* d- ' " ' - , . ,

Table C-4. HP-31CV Storage for Flat Slab Yield-Line Analysis
a. Input Parameters
Absolute Dimensionless RegisterValue Value
x X1 00
y y' 01
z z' 02
1I/S 03
d* a 04cap
c= 0.89 d
(continued)
C-14
.~~~~~~~~~~~~~~~~~~~~ I '_ ' ,,,, , .. ' e 'e "-, ,, .4

Table C-4. Continued
b. Calculated Parameters
Absolute Dimensionless Value RegisterValue
S 1/0 05
c 0.89 a cp06
c/2 0.445 fap0
L-c 1 - 0.89 a 08cap
S-c (/)- 0.89 oap 09
L- c -x I -0.89o ap -x1 10
L - (c/2) -x 1 - 0.445 oap - 11
S - c - y (1/p) - 0.89 a cp- yf12
S - (c/2) - y (i)- 0.445 oap - y13
S - c - z (/)- 0.89 a cp- ZI14
S - (c/2) - z 01/0 - 0.445 a cp- z? 15
x + (c/2) x' + 0.445o ap 16
y + (c/2) Y'- 0.445 oap 17
z + (c/2) z' + 0.445 oap 18
L -(S/2) 1 -(1/20) 19
(L -c)/2 (0 0.89 oap )/2 20
C-15

00 U, N w0 U, U, NO'. U, N N m% U, N 0%
1-4 ~ ON 'n 0 0 '1000a N -r %D. co 00 r- i'- r-(U '- -* 00 '4 w, w0 0 N U, w0 .- N U,) 00 1-4 441h.4 U, I 4(1 N I V) 14N N *( M N -40 u 4 - 4T 4t 4T 41 It 4* 41 IT
-0) 4 N4 N4 04 N 4 N 4 04 N4 04 -l N4 04 N4 04
(n
4j0U H0% ON as m% 0% .0 '%0 %D0 '0 .0 m1 m1 m1 m m
4-40 0n % h m% 0% m 0000000000 r'- r~- r- r- r-
T 6a0c w 040 N N NI 04 N1 C.4 04 0 N C4 04 CN N04 0i- 0
-4 1
uo W .-4" N% 0% 0 0 m% N. '0 '0 '0 m'. -0 m'( ( ( v
41 4V2CI C44 CI C1 N N1 C1 N1 N N1 N4 N4 N4 N N N
0 004
o .1 o 0 0 00 00 0o00 c 00 00 00 00mr u -4 -
C33 N __'_'__C; C C
41 0) "" '04 N4 1-4 - '04 1" r-4 0 4 .0 N .to NIC 414( 4 4 4( 4 4 4(
m 0' 0' 0; 0 0 0 0 0 0 0 0 0
O4 NO I-4 %0r.0 r - It m I4.3 M N) N - N " - 4 1 -
(.3 0 0 C ' 0
(U U )- 4 r-4 14 r-v4 .4 v4 v v 4
4 r-4 v-4 v4 r-40
~ 0 00 0 00 0 0 0 0 00 0 0 0 0 00 00)-. v4 C4 v-4 M4 M- M4 v'T .4J 4 v-I M- v
4 T-
10 o. o 6 CJC;C4
(U~~L 0- 0 0 0 0 0 0 0 0 0
C-41

Table C-6. Load-Mass Parameters for Drop Panel
Rectangle* TrianglePanel Sector d
b b L
C - 1 0.2L - (c/2) c/2 0.2L - (c/2) 3/8Corner(C) C - 3 0.2L - (c/2) c/2 0.2L - (c/2) 3/8
I/A - I 0.2L - (c/2) c/2 0.2L - (c/2) 3/8
I/A - 2 0.2L, - (c/2) c/2 0.2L - (c/2) 3/8Interior(I/A; I/B) I/B - 1 0.2L - (c/2) c/2 0.2L - (c/2) 3/8
I/B - 2 0.2L - (c/2) c/2 0.2L - (c/2) 3/8
55 - 1 0.2L - (c/2) c/2 0.2L - (c/2) 3/8Short Side(SS) SS - 2 0.2L - (c/2) c/2 0.21, - (c/2) 3/8
LS/A - 1 0.2L - (c/2) c/2 0.2L - (c/2) 3/8
LS/A - 2 0.21. - (c/2) c/2 0.2L - (c/2) 3/8Long Side(LS/A; LS/B - 1 0.2L - (c/2) c/2 0.2L - (c/2) 3/8LS/B)
LS/B - 2 0.2L - (c/2) c/2 0.2L - (c/2) 3/8
*For rectangle: orL= 2/3
C-17

o 00 %Q IT C1ON 00 00 00 00
11O %0 %D 10 '0
o N LA - -
0 4 C% VI 04 f L 0to 004 4 0'4 00co -
0
.- ' 00 '.D fl.. ClA N,cn0 1 00 LA LA
1- 4T 0 Ir' LAW cfl CYA cm N -4 r-O
0- 0D 0 0 0 0
0 -4 T r _
-4 4
0 (n 00C1 LA) %0U3 -4 It 0P mL
41 U 00 C 4 N -4 1"
,4 0U30 0
o4 u- E- w A -u.. v0 -4I r4 M' '. o0 mA
-4~~C 4) .$4 -% 0
0 4C 0 0 000
(A 0
0, ~ LA r- N1 c0 %D.0 LA i 00 4S 10 CA
m $4 4C fr M -4 C% 00 4)-4 - -1
0 J0-
1-4. cl 0- 0n r n r
00
u 0o LA co as 00*-m ' L 00 0 m0 CA
10 C-4 eq -4 -6 0
o . - .-4 'T 0 0-
4i1 . n C4 0
'.d 0 0 0 i0n
0CM ci0 -. r '
~' CA C-4 18 r- C

L/2 L uj
c/2
7
I/B-2
NI
Figure C-i. Rotating sectors for load-mass factor calculations for
3 x 4 flat slab.
C-19

fL
P/31 LS/B-2
eI/A-1 LS/A-1
edge ofdrop panel
Figure C-2. Rotating sectors for load-mass factor calculations for3 x 4 flat slab with drop panels.
C-20

b I b d 3 / 3 2 bi-I~ ci =~ d/2 2 ~)d
(a) Rectangle.
I bd 3/12 =-hbd
.1- d+ Jc d/3 ci
b
(b) Triangle rotating about side.
b
T+ 7 1 bd 3 4- b =-d
d 1 c =2/3 d cL 1 (.-L() 8
(c) Triangle rotating about corner.
Figure C-3. Expressions for I/cL for typical sections.
C-21

Appendix D
COLUMN DESIGN
INTRODUCTION
The columns are designed in accordance with the criteria presented
in the ACI Code. They must be designed to resist the axial load and
unbalanced moment resulting from the flat slab blast load and the struc-
ture dead load, P dl The axial load and moment at the top of the column
(the critical section is at the bottom of the capital) are obtained from
the flat slab shear forces, Pi, acting on the perimeter of the column
capital plus the load, P cap' on the equivalent square capital (Figure D-1).
The determination of these design loads are illustrated for the
lower right-hand column of the 3 x 4 flat slab structure (Figure 11).
The actual column design is not shown, but it can be obtained from any
reinforced concrete design textbook.
CALCULATE TOTAL DYNAMIC COLUMN LOADS
The previously determined yield-line pattern for the flat slab is
shown in Figure D-2 along with the loading parameters for the lower
column. The required dynamic ultimate unit resistance, rud, equals
10.72 psi. (See Step 18 of main text.) The column loads are determined
as follows:
Capital: Pcap = (53.3)(53.3)(10.72) = 30,450 lb
Area 1: P, = -L (93.3)(123.3)(10.72) = 61,660 lb
P = (93.3)(53.4)(10.72) = 53,410 lb
= (93.3)(126.6)(10.72) = 63,310 lb
1 1P1 = 1 P1 = 178,380 lb
D-1

= -26.7 - 123.3 = 67.8 in.lx 3
ell = 0.0 in.I)x
el = 26.7 + 126.6 68.9 in.lx 3
IP 1 elIxex - IP 1 - [(61,660) (-67.8) + (53,410) (0)
+ (63,310) (68.9)1/178,380
= + 1.02 in.
ely = + 26.7 in.
1
Area 2: P -1 (123.3)(93.3)(10.72) = 61,660 lb
Pi = (123.3)(53.4)(10.72) = 70,580 lb2
p,-2T(123.3)(96.6)(10.72) = 63,840 lb
P2 = I P2 = 196,080 lb
93.3ei = 26.7 + = 57.8 in.y 3
e" = 0.0 in.2y
evi = -26.7 -966 = -58.9 in.2y 3
P2 e2y [(61,660) (57.8) + (70,580) (0)
+ (63,840) (-58.9)1/196,080
= -1.00 in.
e2x = -26.7 in.
Area 3: P = +±(126.6)(93.3)(10.72) = 63,310 lb
Pit = (126.6)(53.4)(10.72) - 72,470 lb
3
D- 2

II
= 1-(126.6)(96.6)(10.72) - 65,550 lb
P3 = I P3 = 201,330 lb
e; = 57.8 in.3y
e3y = 0.0 in.
i1 = -58.9 in.3y
e3 y 1P e~y-(240 0e YP3 [ = (63,310)(57.8) + (72,470)(0)
e3y I P 3
+ (65,550)(-58.9)1/201,330
= -1.00 in.
e3x = 26.7 in.
Area 4: p -= -(96.6)(123.3)(10.72) 63,840 lb
P = (96.6)(53.4)(10.72) = 55,290 lb
P4 = -- (96.6)(126.6)(10.72) = 65,550 lb
P4 = 1P 4 = 184,690 lb
e = -67.8 in.
e" = 0.0 in.4x
e" = 68.9 in.4x
IP 4 e 4xe4x I P4 [ [(63,840) (-67.8) + (55,290) (0)
4x 1P 4
+ (65,550) (68.9)1/184,690
= 1.02 in.
e = -26.7 in.D-
Ij D-3

Design Loads:
M = Y P. e. = (178,380)(26.7) + (196,080)(-1.00) (D-1)
+ (201,330) (-1.00) + (184,690) (-26.7)
= -565,890 in.-lb
M = I P. e. = (178,380)(1.02) + (196,080)(-26.7) (D-2)y 1 iX
+ (201,330)(26.7) + (184,690)(1.02)
= 510,510 in.-lb
2 = x5580 + (510,510)2 762,130 in.-lbx y
. . . (D-3)
P = 7 P. + P = 790,930 lb (D-4)1 cap
e = = 762,130 1.0 in. (D-5)e - P 790,930
This load is assumed to be a suddenly applied constant load with a
limited duration equal to the time (tm = 93.3 msec) calculated for the
slab to reach its maximum response (from Step 18).
CALCULATE NATURAL PERIOD
Column Mass
The mass of the column includes the column, capital, drop panel,
and that portion of the roof slab and soil overburden within the
boundaries of the drop panel; see Figure D-3. Therefore,
Column: H = (30)2 (119)(0.000217) = 18.25 lb-sec2 /in.
Capital: M = -(15) (30)2 + (60)2
+ (14-) (30)(60)1 (0.000217)
= 5.37 lb-sec 2/in.D-4

Drop Panel: M = (120) 2 (6)(0.000217) = 18.75 lb-sec 2/in.
Roof Slab: M = (120) 2 (16)(0.000217) = 50.00 lb-sec 2/in.
Overburden: M = (120) 2 (12)(0.000150) = 25.92 lb-sec 2/in.
NTotal = 118.29 lb-sec 2/in.
Column Stiffness (Axial)
E A (3.64 x 10⁶) 7T (30)2K - c 1 21.62 x 10 6 Wbin. (D-6)
L 119
Natural PeriodLMI M (
Tn=2n KM (D-7)
where KLM = 1.0. Therefore,
V(1.0) (118.29)
T = 2n 6 = 0.0147 secn21.62 x 106
ELASTIC-PLASTIC SDOF RESPONSE
The required dynamic strength of the column, Pd' (considering only
the blast loading) is obtained from the SDOF maximum response chart,
Figure 5.25, in Reference 18. That is, for an allowable design ductility,
Xm/XE , of 3.0:
td 93.3 6.35 C 1.20
T 14.7 R
P = CR P = (1.20) (790,930) = 949,120 lb (D-8)
This value is converted to an equivalent static column strength by dividingby DIF. That is,
D-5

P - dF (D-9)
For concrete compression, DIF equals 1.25. Therefore,
_ 949,120 - 759,300 lbs 1.25
TOTAL COLUMN LOAD
The total factored axial load, Pu, consists of the previously
determined equivalent static load, P , plus the structure dead load,
Pdl' within the boundaries of the yield lines shown in Figure D-1. The
dead load calculations are as follows:
Capital: P = (15) (30)2 + (60)2
+n (30)(60 145 = 2,076 lb
+-3)(0 1 ,7 28)
Drop Panel: P = (120)2 (6) (\145 = 7,250 lb, 728 1 =
Roof Slab: P = (303.3)(243.3)(16) i15 = 99,074 lb1,728)
Soil Overburden: P = (303.3)(243.3)(12) 1, 728) 51,245 lb
P = I P = 159,645 lb
Therefore, the total factored axial load equals:
Pu = Ps + Pdl = 759,300 + 159,645 = 918,945 lb (D-1O)
The design eccentricity remains at 1.0 in.
D-6
% -

Pi= r, Ai
P P~cap =ru c2
yield lines
(a) Roof plan.
P2 caP P3
(b) Column elevation.
Figure D-1. Typical column loads.
D- 7

y
1 2 . n j . n 126.6 i m
dOP
- 0
16 ON
Figure D-2. Column loads for 3 x 4 flat slab.
D-8

soil overburden
% 0
- 030 In0
00 0o0: o00 o 000 0 o 0 0 ,
0< 000
00 ~ ~ ~ ~ ~ ~ - 710 1 0 0 0 0
0 .
- D-9
%0

DISTRIBUTION LIST
AMMO HAZARDS REVIEW BD Chrmn. NAVSAFECEN (Code 43) Norfolk. VAARMY - CERL CERL-ZN. Champaign. ILARMY CORPS OF ENGINEERS Library. Seattle. WAARMY ENG WATERWAYS EXP STA Library. Vicksburg MS; WES-SS (Kiger), Vicksburg, MSARMY-BELVOIR R&D (TR STRBE-BLORE. Ft Belvoir. VAARMY-DEPOT SYS COMMAND DRSDS-AI, Chambersburg, PACBC Code 156. Port Hueneme. CA; Dir. CESO. Port Hueneme. CA: PWO (Code 8l). Port Hueneme. CACNO Code NOP.964. Washington. DC; Code OP 441F. Washington. DCCOMFEWSG DET Security Off. Washington. DCCOMNAVAIRSYSCOM Code PMA 258. Washington. DCDOD Explos Safety Brd (Lib). Washington, DC, Explos Safety Brd, Washington, DCDTIC Alexandria, VADTNSRDC DET, Code 4120, Annapolis. MDGSA Code FAIA, Washington. DCLIBRARY OF CONGRESS Sci & Tech Div, Washington. DCMARINE CORPS HQTRS Code LFF-2. Washington DCNATL RESEARCH COUNCIL Naval Studies Board. Washington. DCNAVCOASTSYSCEN Tech Library. Panama City, FLNAVEODTECHCEN Tech Library. Indian Head. MDNAVFACENGCOM Code 03. Alexandria. VA: Code 13T (Essoglou). Alexandria. VA; Code (4M. Alexandria,
VA: Code 09M124 (Tech Lib). Alexandria, VA: Code 1(9). Alexandria. VA; Code 1113. Alexandria, VANAVFACENGCOM - CHES DIV. Code 101. Washington, DC; Code 102 (A Lee), Washington. DC: Code
FPO-IPL, Washington, DCNAVFACENGCOM - LANT DIV. Code 1112. Norfolk. VA: Library. Norfolk, VANAVFACENGCOM - NORTH DIV. Code 04AL. Philadelphia. PANAVFACENGCOM - PAC DIV. (Kyi) Code 101. Pearl Harbor. HI: Code 09P. Pearl Harbor, HI; Code 402,
RDT&E. Pearl Harbor, HI Library. Pearl Harbor, HINAVFACENGCOM - SOUTH DIV. Code 09 (Watts) Charleston, SC; Code 1112. Charleston. SC: Code 416,
Charleston. SC: Library. Charleston. SCNAVFACENGCOM - WEST DIV. Code (B, San Bruno, CA: Code 04DI, San Bruno, CA: Library (Code
04A2.2), San Bruno, CANAVOCEANSYSCEN Code 9642B (Bayside Library). San Diego. CANAVSEASYSCOM Code 05GI3. Washington, DC: Code 06H4. Washington, DC: Code 56W44, Washington.
DC: Code 62C1, Washington. DCNAVSHIPYD Code 440, Portsmouth. NHNAVSUPSYSCOM Code XBI. Washington, DCNAVSURFWPNCEN Code E211 (C. Rouse). Dahlgren. VA: DET. PWO, White Oak, Silver Spring. MD:
PWO, Dahlgren. VANAVWPNCEN Code 2636. China Lake, CA; Code 3276, China Lake. CANAVWPNSTA Code 09, Concord. CA: Code 092, Concord CA: Engrg Div, PWD, Yorktown, VA; PWO,
Charleston, SC: PWO. Seal Beach. CANAVWPNSTA PWO. Yorktown. VANAVWPNSTA Safcty Br. Concord. CA: Security Mgr (('ode 1(1B). Concord. CA: Supr Gen Engr, PWD, Seal
Beach. CANAVWPNSUPPCEN Code 09, Crane. INCOMDT COGARD Code 2511 (Civil Engrg). Washington. DCNTSB Chairman. Washington. DCPWC Code 101 (Library). Oakland. CA; Code 123-C. San Diego. CA: Code 420. Great Lakes. IL: Library
(Code 134). Pearl Harbor. HI: Library. Guam, Mariana Islands: Library. Norfolk, VA: Library, Pensacola.FL: library. Yokosuka JA; Tech Library. Subic Bay. RP
COLORADO STATE UNIVERSITY CE Dept (W Charlie). Fort Collins. MDMIT Engrg Lib, Cambridge, MA: Lib. Tech Reports. Cambridge. MAPURDUE UNIVERSITY Engrg Lib. Lafayette. INSOUTHWEST RSCH INST J tlokanson. San Antonio. TXUNIVERSITY OF DELAWARE CE Dept. Ocean Engrg (Dalrymple). Newark. I)EUNIVERSITY OF ILLINOIS Library, Urbana, ILAMMAN & WHITNEY CONSULT ENGRS N Dobbs New York, NYASSOC AMER RR Bur of Explosives (Miller) Washington. DCNUSC DET Library (Code 4533) Newport, RIMCDONNELL AIRCRAFT CO. Navy Tech Rep. St Louis. MO: R Carson. St. Louis. MOWOODWARD-CLYDE CONSULTANTS R Dominguez. Houston, TXR.F. BESIER CE. Old Saybrook. CT

. a. = .r - . _: .. r .a,7x . .az::i .M . . -J .r - . -- .. . - . -,-r , r,:: .. ;.. rU W.,. MU ,*- i.J.p., MS M,;.. l j ,1% ,r w ,,. . •,Ukb b . -
INSTRUCTIONS
The Naval Civil Engineering Laboratory has revised its primary distribution lists. The bottom ofthe mailing label has several numbers listed. These numbers correspond to numbers assigned to the list ofSubject Categories. Numbers on the label corresponding to those on the list indicate the subject category andtype of documents you are presently receiving. If you are satisfied, throw this card away (or file it for laterreference).
If you want to change what you are presently receiving:
, Delete - mark off number on bottom of label.
44j 0 Add -. circle number on list.
0 Remove my name from all your lists - check box on list.
" Change my address - line out incorrect line and write in correction (ATTACH MAILING LABEL).
* Number of copies should be entered after the title of the subject categories you select.
Fold on line below and drop in the mail.
Note: Numbers on label but not listed on questionnaire are for NCEL use only, please ignore them.
Fold on line and staple.
DEPARTMENT OF THE NAVYPOSTAGE AND FEES PAID
NAVAL CIVIL ENGINEERING LABORATORY DEPARTMENT OF THE NAVY DPORT HUENEME, CALIFORNIA 93043 DOD-310 ULSLMAIL
, OFFICIAL BUSINESSPENAL.TY FOR PRIVATE USE. $200
I INMDNCEL.2700/4 (REV. 12-73)
~-0-0.L.7 0-0044
,, Commanding OfficerCode L14Naval Civil Engineering LaboratoryPort Hueneme, California 93043
Y,.,

DISTRIBUTION QUESTIONNAIREThe Naval Civil Engineering Laboratory is revising its primary distribution lists.
SUBJECT CATEGORIES 2S ENERGY/POWER GENERATION29 Thermal conservation (thermal engineering of buildings. HVAC
I SHORE FACIUTIES systems, energy Ioss measurement, power generation)2 Construction methods and materials (including corrosion 30 Controls and electrical conservation (electrical systems,
control, coatings) energy monitoring and control systems)3 Waterfront structures (maintenance/deterioration control) 31 Fuel flexibility (liquid fueis, coal utilization, energy
- 4 Utilities (including power conditioning) from solid waste)5 Explosives safety 32 Alternate energy source (geothermal power, photovoltaic6 Construction equipment and machinery power systems, solar systems, wind systems, energy storage7 Fire prevention and control systems)8 Antenna technology 33 Site data and systems integration lenergy resource date, energy9 Structural analysis and design (including numerical and consumption data, integrating energy systems)
computer techniques) 34 ENVIRONMENTAL PROTECTION10 Protective construction (including hardened shelters, 35 Solid waste management
shock and vibration studies) 36 Hazardous/toxic materials management11 Soil/rock mechanics 37 Wastewater management and sanitary engineering13 SEQ 38 Oil pollution removal and recovery14 Airfields and pavements 39 Air pollutionIS ADVANCED BASE AND AMPHIBIOUS FACILITIES 40 Noise abatement16 Base facilities (including shelters, power generation, water supplies) 44 OCEAN ENGINEERING17 Expedient roads/airfields/bridges 45 Seafloor soils and foundations18 Amphibious operations (including breakwaters, wave forces) 46 Seafloor construction systems and operations (including19 Over-the-Beech operations (including containerization, diver and manipulator tools)
i'. %materiel transfer, lighterage and cranes) 47 Undersea structures and materials
20 POL storage, transfer and distribution 48 Anchors and moorings24 POLAR ENGINEERING 49 Undersea power systems, electromechanical cables.24 Same as Advanced Base and Amphibious Facilities, and connectors
except limited to cold-region environments 50 Pressure vessel facilities51 Physical environment (including site surveying)52 Ocean-based concrete structures53 Hyperbaric chambers54 Undersea cable dynamics
TYPES OF DOCUMENTS85 Techdaua Sheets 86 Technical Reports and Technical Note% 82 NCEL Guide & Updates 0) None-
83 Table of Contents & Index to TDS 91 Physical Security remove my name
% %:' %
Se.5
'..h
,. .

~1~~~~~~~
-, ~
V ~ -~