N&. 01 • 2102 e Reform of Business Property Tax in Ontario ... · e Reform of Business Property...
30
e Reform of Business Property Tax in Ontario: An Evaluation Michael Smart Department of Economics, University of Toronto IMFG P M F G N. •
-
Upload
trinhtuyen -
Category
Documents
-
view
215 -
download
0
Transcript of N&. 01 • 2102 e Reform of Business Property Tax in Ontario ... · e Reform of Business Property...
�e Reform of Business Property Tax in Ontario: An Evaluation
Michael Smart Department of Economics, University of Toronto
IMFG Papers on Municipal Finance and Governance No. 10 • 2012

The Reform of Business Property Tax in Ontario:
An Evaluation
ByMichael Smart
Department of Economics, University of Toronto
IMFG Papers on Mun ic ipa l F inance and Governance

Institute on Municipal Finance & GovernanceMunk School of Global AffairsUniversity of Toronto1 Devonshire PlaceToronto, Ontario, Canada M5S 3K7e-mail contact: [email protected]://www.utoronto.ca/mcis/imfg/
Series editor: Philippa Campsie
© Copyright held by authors, 2012
ISBN 978-0-7727-0883-0ISSN 1927-1921
The Institute on Municipal Finance and Governance (IMFG) at the Munk School of Global Affairs at the University of Toronto focuses on developing solutions to the fiscal and governanceproblems facing large cities and city-regions. IMFG conducts original research on Canadiancities and other cities around the world; promotes high-level discussion among Canada’s government, academic, corporate, and community leaders through conferences and roundtables;and supports graduate and post-graduate students to build Canada’s cadre of municipal financeand governance experts. It is the only institute in Canada that focuses solely on municipal finance issues and large cities and city-regions. IMFG is funded by the Province of Ontario, theCity of Toronto, Avana Capital, and TD Bank.
The IMFG Papers on Municipal Finance and Governance are designed to disseminate research that is being undertaken in academic circles in Canada and abroad on municipal finance and governance issues. The series, which includes papers by local as well as internationalscholars, is intended to inform the debate on important issues in large cities and city-regions.
Michael Smart is Professor of Economics at the University of Toronto and Fellow of the Oxford Centre for Business Taxation and the C.D. Howe Institute in Toronto. He has publishedwidely on topics related to the economic analysis of tax policy, federalism, and the politicaleconomics of government policy. He has served as a Co-Editor of the Canadian Journal of Economics and as a special adviser to the federal Department of Finance. Professor Smart received his PhD from Stanford University in 1995.
Thanks to Dwayne Benjamin, Almos Tassonyi, and Enid Slack for comments, and to JoshMurphy for research assistance.
Papers on Municipal Finance and Governance
1. Are There Trends in Local Finance? A Cautionary Note on Comparative Studies and Normative Models of Local Government Finance, by Richard M. Bird, 2011.
ISBN 978-0-7727-0865-6
2. The Property Tax—in Theory and Practice, by Enid Slack, 2011. ISBN 978-0-7727-0867-0
3. Financing Large Cities and Metropolitan Areas, by Enid Slack, 2011. ISBN978-0-7727-0869-4
4. Coping with Change: The Need to Restructure Urban Governance and Finance in India,by M. Govinda Rao and Richard M. Bird, 2011. ISBN 978-0-7727-0871-7
5. Revenue Diversification in Large U.S. Cities, by Howard Chernick, Adam Langley, andAndrew Reschovsky, 2011.ISBN 978-0-7727-0873-1
6. Subnational Taxation in Large Emerging Countries: BRIC Plus One, by Richard M. Bird,2012.
ISBN 978-0-7727-0875-5
7. You Get What You Pay For: How Nordic Cities are Financed, by Jorgen Lotz, 2012. ISBN 978-0-7727-0877-9
8. Property Tax Reform in Vietnam: A Work in Progress, by Hong-Loan Trinh and William J. McCluskey, 2012.
ISBN 978-0-7727-0879-3
9. IMFG Graduate Student Papers. Development Charges across Canada: An UnderutilizedGrowth Management Tool? by Mia Baumeister; Preparing for the Costs of ExtremeWeather in Canadian Cities: Issues, Tools, Ideas by Cayley Burgess, 2012.
ISBN 978-0-7727-0881-6
– 1 –
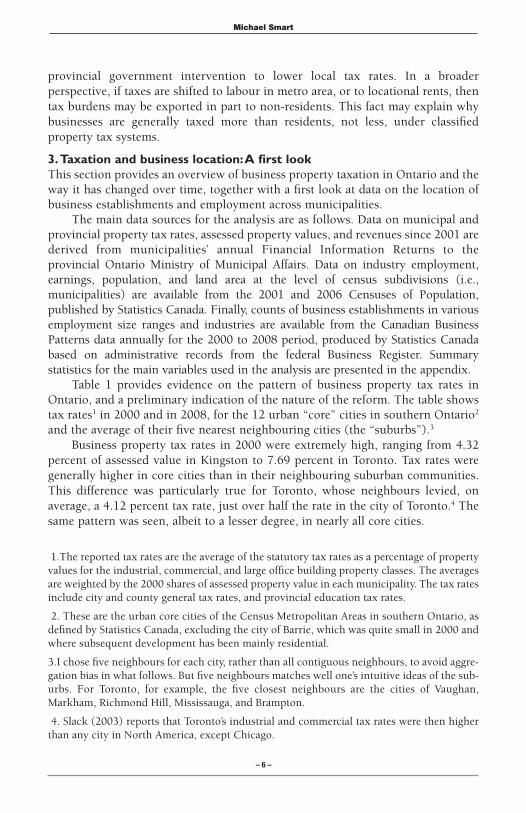
AbstractBusiness property taxes in Ontario have fallen dramatically in the past decade, dueto a series of reforms mandated by the provincial government. In this paper, Idiscuss the likely impacts of the reforms on business location, wages, and landvalues, and the economic welfare of provincial residents. I use the reforms toestimate the responsiveness of business location and employment to local taxdifferentials. The reforms have caused a large shift in legal tax burdens frombusinesses to residents, particularly in Toronto and a few other cities. Based on myanalysis, I conclude that the tax reform has had a small positive impact onemployment in cities and on business productivity in Ontario.
Key words: business taxes, business location, intermunicipal competition JEL codes: H25, R33
The reform of business propertytax in Ontario: An evaluation
Michael Smart

Michael Smart
– 2 –
1. IntroductionIn the past decade, the province of Ontario has been engaged in a substantialreform of business property taxation. By a conservative estimate, explained below,the reform has reduced taxes paid on commercial and industrial properties byabout $2 billion per year. Arguably, the reform has caused a large shift in taxburdens from business to residential ratepayers, and it has contributed to thecurrent fiscal pressures facing Toronto and other Ontario municipal governments.In spite of the magnitude and importance of the reform, it has not (to myknowledge) been subject to a cost-benefit evaluation. This paper takes some firststeps in that direction.
As the tax reductions since 2001 have been large, so the initial tax ratesprevailing in 2001 were high. Moreover, tax rates at the time differed substantiallybetween neighbouring jurisdictions. As a notorious example, taxes on industrialproperties in the City of Toronto were levied in 2001 at 9.9 percent of assessedvalue, compared to 4.8 percent in the neighbouring City of Mississauga. Thispattern, repeated elsewhere in core and suburban cities and for commercial as wellas industrial properties, has given rise to concerns that taxes are discouraginginvestment in non-residential structures, and affecting business location andemployment decisions. Tax differentials between core cities and suburbs arethought to be one factor contributing to the “suburbanization of employment” inmetropolitan areas (Heisz and LaRochelle-Côté 2005), the loss of large industrialemployers in central cities (Slack 2003), and the observed preference of the marketfor residential over new office developments in the City of Toronto in particular(Canadian Urban Institute 2011).
The economic effects of the business property tax depend on its economicincidence: that is, whether the tax is ultimately paid by businesses occupying landin high-tax cities, or whether it is shifted through price changes to workers, ownersof land, or other factors of production. In the standard economic views of theproperty tax, it is ultimately either a tax on capital employed in residential andnon-residential structures, or it is a tax on local land values. These are known asthe “capital tax view” and “benefit tax view” of the property tax, respectively.
If the former view is correct, then property taxes (particularly those onbusiness properties) create high economic costs by discouraging investment,distorting location, and reducing productivity, and there is a strong case for reformsto reduce business taxes to the same rates as for residential properties, or even tolower rates. If the latter view is correct, then the property tax is an efficient meansof raising revenue for local governments, and high rates of business taxation are nocause for concern—even if rates differ between neighbouring locations. While theempirical evidence on property tax incidence is mixed, there is evidence that aconsiderable proportion of the property tax is capitalized into local land values.
The Reform of Business Property Tax in Ontario: An Evaluation
The Reform of Business Property Tax in Ontario: An Evaluation
– 3 –
In this paper, I review these arguments in detail and survey previous economicresearch on business property taxation. I then evaluate the effects of businessproperty taxes in Ontario, based on information on the location of businessestablishments and employment and how it has changed since the tax reformsbegan a decade ago. Provincial policies since 2001 have mandated a shift in taxburdens from business to residential properties. Important for my empirical approach,the mandate applies in municipalities and property classes with relative business taxburdens (“tax ratios”) above the provincial average, but not in those with tax ratiosbelow the average. The reform therefore has tended to reduce tax differentials amongneighbouring municipalities, as well as reducing taxes overall, and it has done so in away that is independent of other factors that may simultaneously be influencingeconomic development and tax policies at the local level.
In brief, I find that the reform has induced a small but significant shift inbusiness location and employment to the capped municipalities, with the gainscoming mainly at the expense of neighbouring, uncapped municipalities. Based onmy results, I draw conclusions about the mobility of businesses; the effects of localtaxes on productivity, wages, and local land values; and the desirability of theprovincial tax reforms more generally.
The plan of the paper is as follows. Section 2 reviews the previous literatureon the economic effects of local property taxes. Section 3 describes local businesstax policies in Ontario, the reforms that have taken place since 2001, and thepatterns of employment and business location over the same period. Section 4presents the main empirical analysis, which uses the provincial reform to estimatethe responsiveness of business location, employment, and earnings to local taxdifferentials. Section 5 concludes the paper.
2.The economic incidence of the property tax Business property taxes in Ontario are high and vary widely between locations,even within metropolitan areas. Provincially mandated reforms of the past decadehave, however, resulted in large-scale reductions in taxes. Evaluating the effects ofthese tax changes requires an understanding of the economic incidence of propertytaxes. The property tax is a particularly complicated tax to analyze, because itapplies to both land and structures (two factors of production that areeconomically very different), and because tax rates vary at the local level, andeconomies of neighbouring cities are economically interconnected.
Two standard views of property tax incidence are advanced in the economicliterature: the “capital tax view” and the “benefit tax view.” Proponents of the“capital tax view” see the local property tax as primarily a tax on capitalinvestments that distorts investment in structures and the location decisions ofboth residents and businesses. When a single community raises its property tax,investment in structures declines, and capital and employment move to otherjurisdictions. In the simplest version of the theory (Zodrow and Mieszkowski1986), the outflow of capital causes a decline in local land values and (in the caseof the business property tax) a decline in local wages, which are roughly offset by

Michael Smart
– 4 –
increases in land values and wages in other jurisdictions. The capital tax view seesthe property tax as a tax on structures, and it largely ignores land.
In contrast, Hamilton (1975) promulgated the “benefit tax view,” arguing thatmunicipalities can effectively use zoning restrictions (such as minimum lot sizesfor houses) to limit the distortionary effects of property taxes on housinginvestment. With binding zoning restrictions, residents cannot respond to theproperty tax by reducing investment. In the absence of an investment effect,property tax increases should be capitalized into the market value of land in thetaxing municipality, resulting in an efficient lump-sum tax on land.
Extending this logic, Fischel (1976) noted that rigid zoning of municipal landinto areas for commercial, industrial, and residential uses likewise causes thebusiness property tax to be capitalized into land values. With full capitalization,city residents cannot use the business property tax to shift tax burdens tooutsiders, and competition between municipalities should drive business tax ratesdown to a level that equals to cost of supplying local public services to business(plus the costs of congestion and nuisances caused by business to residents). Theproperty tax therefore acts as a user fee, or benefit tax, for local public services. Ifproperty taxes are benefit taxes, then they are a “price of entry” that does notdistort business location decisions, even in the presence of substantial taxdifferentials among municipalities.
In short, the capital tax view sees the property tax as a tax mainly borne bycapital. Since capital is mobile, tax differentials (that are not offset by servicedifferentials) cause changes in the location that reduce productivity. The benefittax view sees property tax and service differentials as capitalized into local landvalues. Since land is immobile, the tax is not distortionary. On the other hand,since capitalization effects are borne by local landowners, municipal governmentswill not choose rates of business property taxation in excess of the marginal costof providing public services to business.
2.1 Empirical studiesThe stark contrasts between the capital tax and benefit tax views have led empiricalresearchers to investigate the sensitivity of business locations to taxes on the onehand, and the degree of capitalization into land values on the other. The empiricalliterature is large and diverse, and it is difficult to draw definitive conclusions.
Numerous studies since Oates (1969) have found persuasive evidence that taxand public service differentials are largely capitalized into land values. But, asZodrow (2007) and others have observed, the implications of this finding areunclear. Capitalization can still occur in the presence of distortionary effects oninvestment, and so capitalization is not inconsistent per se with the capital taxview. Conversely, a strict reading of the benefit tax view suggests tax differencesshould not be reflected in private tax values in equilibrium, because they will beoffset by differences in local public services.
The literature on business location and property taxes is comparatively sparse.Much of the earlier work, summarized for example by Bartik (1991), uses state-

The Reform of Business Property Tax in Ontario: An Evaluation
– 5 –
level data and state-level differences in business income and average propertytaxes. (Bartik’s own earlier [1985] research on plant location at the state levelfound no effects of property taxes.) Oates and Schwab (1997) examined a propertytax reform in Pittsburgh that shifted the statutory tax burden from structures toland, and did find effects on local investment, but inferring the effects of a combinedtax on land and structures is difficult. Haughwout et al. (2004) examined theresponse of revenues to changes in local taxes on property, employment, income, andsales, for four large U.S. cities. They found relatively large tax base elasticities ingeneral. Lee and Wheaton (2010) found significant but “gradual” employmenteffects following increases in local business property tax rates in Massachusettsbetween 1980 and 2000. Working at a very fine level of geographic detail, Durantonet al. (2011) found a significant impact of local tax differences in the UnitedKingdom on the location of employment, but not of firms.
2.2 Tax competition and tax exportingThe two canonical views differ on tax incidence, but both have similar, and stark,predictions about the levels of business property taxation we should observe in adecentralized system of tax-setting. Zodrow and Mieszkowski (1986) emphasizedthat, under the capital tax view, competition between local governments shoulddrive down property tax rates, as residents seek to avoid the deleterious effects ofoutmigration of capital.
Wilson (1985) was among the first to study a classified property tax in thiscontext; his theory predicts that cities will set business tax rates lower thanresidential tax rates, because capital used in the production of traded goods is moreresponsive to tax differentials than capital used in the production of housing. Asnoted, under the benefit tax view, competition between municipalities should drivebusiness tax rates down to the level of a user fee for public services consumed bybusiness, leaving no room for fiscal burdens to be transferred from local residentsthrough the tax system. Since the cost of public services to residents almostcertainly exceeds the cost of public services to business, the prediction is thatbusiness taxes will be set at lower rates than residential taxes.
A broader perspective recognizes that local taxes may be shifted onto factorsof production other than capital and land, so this dichotomy of views is somewhatartificial. Certain locations have natural advantages for production that are notcapitalized into land values, so certain businesses may earn locational rents thataccrue as pure profits. Likewise, local agglomeration economies can generate rents,which may bear some of the burden of elevated property tax rates. Finally, labourmay be relatively immobile between metropolitan areas, but mobile between cityand suburb within a single metropolis, as suburban residents commute to jobs inthe core city. Thus business taxes may be borne by labour in the form of depressedwages, and part of the elevated tax burden in core cities may be “exported” to non-resident commuter-workers.
In short, neither canonical view can explain the high rates of business taxprevailing in Ontario’s classified system, and neither provides a rationale for
Michael Smart
– 6 –
provincial government intervention to lower local tax rates. In a broaderperspective, if taxes are shifted to labour in metro area, or to locational rents, thentax burdens may be exported in part to non-residents. This fact may explain whybusinesses are generally taxed more than residents, not less, under classifiedproperty tax systems.
3.Taxation and business location: A first look This section provides an overview of business property taxation in Ontario and theway it has changed over time, together with a first look at data on the location ofbusiness establishments and employment across municipalities.
The main data sources for the analysis are as follows. Data on municipal andprovincial property tax rates, assessed property values, and revenues since 2001 arederived from municipalities’ annual Financial Information Returns to theprovincial Ontario Ministry of Municipal Affairs. Data on industry employment,earnings, population, and land area at the level of census subdivisions (i.e.,municipalities) are available from the 2001 and 2006 Censuses of Population,published by Statistics Canada. Finally, counts of business establishments in variousemployment size ranges and industries are available from the Canadian BusinessPatterns data annually for the 2000 to 2008 period, produced by Statistics Canadabased on administrative records from the federal Business Register. Summarystatistics for the main variables used in the analysis are presented in the appendix.
Table 1 provides evidence on the pattern of business property tax rates inOntario, and a preliminary indication of the nature of the reform. The table showstax rates1 in 2000 and in 2008, for the 12 urban “core” cities in southern Ontario2
and the average of their five nearest neighbouring cities (the “suburbs”).3
Business property tax rates in 2000 were extremely high, ranging from 4.32percent of assessed value in Kingston to 7.69 percent in Toronto. Tax rates weregenerally higher in core cities than in their neighbouring suburban communities.This difference was particularly true for Toronto, whose neighbours levied, onaverage, a 4.12 percent tax rate, just over half the rate in the city of Toronto.4 Thesame pattern was seen, albeit to a lesser degree, in nearly all core cities.
1.The reported tax rates are the average of the statutory tax rates as a percentage of propertyvalues for the industrial, commercial, and large office building property classes. The averagesare weighted by the 2000 shares of assessed property value in each municipality. The tax ratesinclude city and county general tax rates, and provincial education tax rates.
2. These are the urban core cities of the Census Metropolitan Areas in southern Ontario, asdefined by Statistics Canada, excluding the city of Barrie, which was quite small in 2000 andwhere subsequent development has been mainly residential.
3.I chose five neighbours for each city, rather than all contiguous neighbours, to avoid aggre-gation bias in what follows. But five neighbours matches well one’s intuitive ideas of the sub-urbs. For Toronto, for example, the five closest neighbours are the cities of Vaughan,Markham, Richmond Hill, Mississauga, and Brampton.
4. Slack (2003) reports that Toronto’s industrial and commercial tax rates were then higherthan any city in North America, except Chicago.
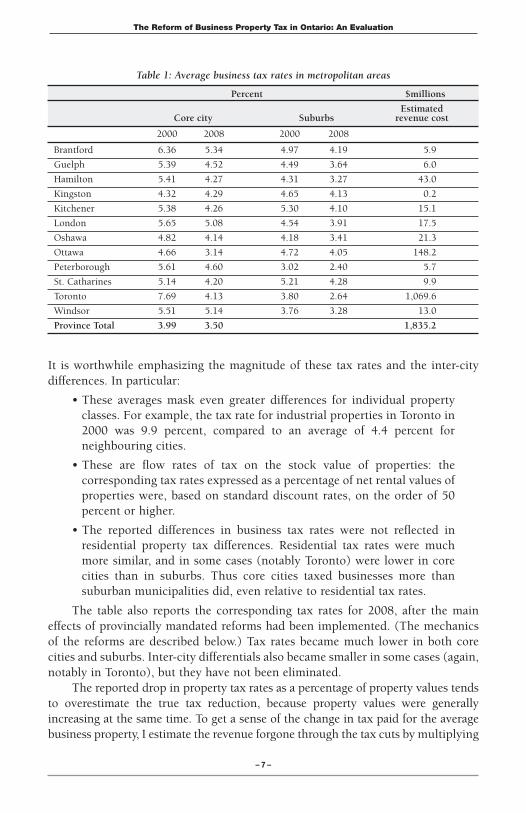
Table 1: Average business tax rates in metropolitan areas
Percent $millions
EstimatedCore city Suburbs revenue cost
2000 2008 2000 2008
Brantford 6.36 5.34 4.97 4.19 5.9
Guelph 5.39 4.52 4.49 3.64 6.0
Hamilton 5.41 4.27 4.31 3.27 43.0
Kingston 4.32 4.29 4.65 4.13 0.2
Kitchener 5.38 4.26 5.30 4.10 15.1
London 5.65 5.08 4.54 3.91 17.5
Oshawa 4.82 4.14 4.18 3.41 21.3
Ottawa 4.66 3.14 4.72 4.05 148.2
Peterborough 5.61 4.60 3.02 2.40 5.7
St. Catharines 5.14 4.20 5.21 4.28 9.9
Toronto 7.69 4.13 3.80 2.64 1,069.6
Windsor 5.51 5.14 3.76 3.28 13.0
Province Total 3.99 3.50 1,835.2
The Reform of Business Property Tax in Ontario: An Evaluation
– 7 –
It is worthwhile emphasizing the magnitude of these tax rates and the inter-citydifferences. In particular:
• These averages mask even greater differences for individual propertyclasses. For example, the tax rate for industrial properties in Toronto in2000 was 9.9 percent, compared to an average of 4.4 percent forneighbouring cities.
• These are flow rates of tax on the stock value of properties: thecorresponding tax rates expressed as a percentage of net rental values ofproperties were, based on standard discount rates, on the order of 50percent or higher.
• The reported differences in business tax rates were not reflected inresidential property tax differences. Residential tax rates were muchmore similar, and in some cases (notably Toronto) were lower in corecities than in suburbs. Thus core cities taxed businesses more thansuburban municipalities did, even relative to residential tax rates.
The table also reports the corresponding tax rates for 2008, after the maineffects of provincially mandated reforms had been implemented. (The mechanicsof the reforms are described below.) Tax rates became much lower in both corecities and suburbs. Inter-city differentials also became smaller in some cases (again,notably in Toronto), but they have not been eliminated.
The reported drop in property tax rates as a percentage of property values tendsto overestimate the true tax reduction, because property values were generallyincreasing at the same time. To get a sense of the change in tax paid for the averagebusiness property, I estimate the revenue forgone through the tax cuts by multiplying
Michael Smart
– 8 –
the change in each tax rate during 2000–2008 by the city’s taxable assessment in eachproperty class, and then summing over classes to get a city-level aggregate estimate.This is a “static” measure of revenue cost, which implicitly assumes that, if the taxreduction had not occurred, then the assessed tax base would have remained thesame in real terms. It is almost certainly a conservative measure: property values haveincreased substantially in real terms in most core cities, even for residentialproperties that were unaffected by the reforms. Moreover, my estimate ignores theeffect of new business property developments that increased the assessed tax base,which may have occurred for reasons unrelated to the tax reform.
The estimates are presented for the core cities, and the aggregate of all cities, inthe final column of Table 1. (To avoid double counting, I report estimates only forcore cities, and not their neighbours.) Revenues declined in all cities, but they areconcentrated (in per-capita terms) in the traditional urban core cities of Toronto,Ottawa, Oshawa, Hamilton, and Windsor. In Toronto alone, the estimated revenueforgone is $1.1 billion or about $430 per resident. The aggregate for the province wasover $1.8 billion. Note that these amounts include reductions in provincial educationtaxes, which occurred in all municipalities but were also concentrated in core cities.5
The forgone municipal tax revenues is about half the total.It is evident that revenue forgone does not equal the true economic cost of the
reform to the residents of these cities. Rather, it is a transfer from government tothe private sector that may have increased the net incomes of landowners, workers,or business owners. Assessing the effects of business tax reductions on economicwelfare requires understanding the economic incidence of the tax. If businessrevenue forgone is offset by increases in land values, wages, or employment incities, then the true loss in city incomes and potential government revenues ismuch smaller, and perhaps even negative. Nevertheless, it is clear that businessplays a substantially smaller role in financing municipal government today than in2000. There is little doubt that city managers balancing annual budgets—and cityresidents contemplating their own property tax bills—are facing the consequencesof the business tax reductions.
3.1 Property tax reform I now turn to a description of the reforms in business property taxation since 1998,when a province-wide uniform system of market value property assessment wasintroduced, replacing an earlier system of assessments based on historical values.6
Because the previous assessment base was generally closer to market values forbusiness than residential properties, uniform reassessment would have resulted inlarge shifts of tax burdens from business to residential properties. To prevent sucha shift, the provincial government authorized municipalities to adopt a classified
5. It is interesting to note that the provincial government has not reduced business tax ratios foreducation as quickly as it has required municipalities to reduce their own business tax ratios.
6. The property tax system is described in detail in Bird et al. (2012), upon which this sum-mary relies heavily.

The Reform of Business Property Tax in Ontario: An Evaluation
– 9 –
property tax system, which applied different rates to residential, commercial,industrial, and other property classes. Municipalities were given the option, whichmost exercised, to set the tax rates on each class in order to hold constant theshares of tax revenues paid by each class prior to reassessment. The result was theinterclass tax rate differentials described above.
These differences were regarded as transitional, and the provincialgovernment undertook further reforms in subsequent years to reduce business-to-residential tax differences. In particular:
• From 1998 to 2004: Where the ratio of the tax rate in a businessproperty class to the residential tax rate exceeded 110 percent, themunicipality was not permitted to increase the tax ratio.7 In such cases,the business tax rate could increase at most in proportion to the changein the residential tax rate.8 This restriction was binding for more than90 percent of the tax classes and municipalities in my sample in allyears 2000–2004, as described below.
• From 2001 to 2004: Where the tax ratio in a business class exceeded the2001 average for the province,9 no increase was permitted in the totaltax levy (defined as the tax rate times the total assessed value) paid bythe class—a policy known as the “hard cap.” This restriction was morestringent than the previous constraint on tax ratios, and implied thatthe percentage tax rate on business classes would fall wherever theaggregate assessment for the class was increasing in nominal terms.Where this cap was binding, the tax paid by a property with the averagerate of assessment growth in the class remained constant in nominalterms. Since the cap did not apply to the residential class, this policyinduced an increase in the property tax share of residential properties inany municipality where aggregate property tax revenues wereincreasing due to budgetary cost increases.
• From 2004 on: The hard cap was relaxed in municipalities above thethreshold. The total levy paid by a business class could now increase atup to one-half the rate of increase in the total residential levy. In thesecases, business tax bills could now increase, but at a strictly lower ratethan for residential properties in the municipality.
7. For “lower-tier” municipalities that share some tax revenue and spending responsibilitieswith “upper-tier” (or county) governments, tax ratios are required to be uniform among alllower-tier municipalities within the county, but each lower-tier municipality is free to choosetax rates that maintain the upper-tier tax ratio.
8. These and other constraints applied to properties zoned multi-residential (apartment build-ings), in addition to commercial and industrial properties. I ignore the multi-residential classin what follows.
9. The threshold ratio of business to residential tax rates was 1.98:1 for commercial and 2.63:1for industrial classes.

Michael Smart
– 10 –
In summary, provincial policies have mandated a reduction in business taxrates since 2001. These mandates affect all municipalities, but particularly thosewith tax rates above the 2001 averages, which were the subject to the cap on levies.Other, uncapped municipalities could increase their business property taxes, butonly to the extent that they kept the ratio of business to residential tax ratesconstant.10 Thus the provincial reforms induced exogenous variation in municipalbusiness tax rates, which I explore in the empirical analysis below.
As a preliminary check on the importance of the provincial reforms, Figure 1shows business tax rates in 2000 and 2006, before and after imposition of the “hardcap.” Observe that while tax rates fell virtually everywhere, the reductions were farlarger in municipalities and tax classes subject to the cap. As a result, the averagedifference in tax rates between neighbouring cities fell substantially with thereform. (Conditional on initial tax rates, this variation is driven by the provincialpolicy, and not by the choices of a municipality or contemporaneous developmentsthere.)
3.2 Business location and the suburbanization of employment Local tax differences between core and suburbs are thought to be one factor con-tributing to the “suburbanization of employment” in metropolitan areas of Canada.In general, while population is still spread more widely across metropolitan areasthan employment, employment has been suburbanizing faster than population.Heisz and LaRochelle-Côté (2005) studied suburbanization of employment inCanada using data from the 1996 and 2001 Censuses, and found that areas locatedwithin 5 kilometres of the city centre decreased their shares of employment in most CMAs. However, CMAs still exhibit a marked concentration of jobs in theurban core.
This pattern could, in principle, be caused both by changes in the industrialmakeup of core cities, and also by a renewed taste of some households for urbanliving. To the extent that it reflects relative tastes and other sources of comparativeadvantage, the suburbanization of employment is not in itself of policy concern.However, the phenomenon could contribute to excessive commuting inmetropolitan areas, which entails external costs, and could contribute to a “spatialmismatch” between the location of jobs and people that is harming employmentprospects for some residents of central cities, particularly low-skilled workers.Furthermore, to the extent that it reflects excessive business tax rates in core cities,and in particular the relative tax advantage enjoyed there by residential overbusiness land uses, then the suburbanization of employment indicates a loss inproductivity and economic welfare.
10. In addition to the tax rate description described here, various other provincial regulationslimited the rate at which taxes on individual properties could increase due to reassessments(“phase-in” and “capping” provisions). These policies were designed so that they did notaffect the rate of increase for the average property in each property class; I therefore ignorethem in what follows. For details, see Bird et al. (2012).

The Reform of Business Property Tax in Ontario: An Evaluation
To provide some preliminary evidence on the suburbanization of employmentin my data, I present some descriptive statistics on employment and businesslocation in core cities and their suburbs. I measure the pattern of industrialspecialization by an index of employment intensity by city.
Let sij be the city j’s share of provincial employment in industry i in the 2001Census, and nj its share of provincial population. The employment intensity index is:
Sij = sij nj
The index measures employment as a share of residential population relativeto the provincial average. A city with Sij of greater than 1.0 is relatively specializedin industry i. When the index is computed for the aggregate of all industries, say Sj = sj /nj , it is a measure of aggregate employment intensity at a location. A citywith Sj greater than 1.0 is an “employment centre” that tends to import labour fromneighbouring places, whereas one with Sj less than 1.0 is a “bedroom community”that tends to export labour.
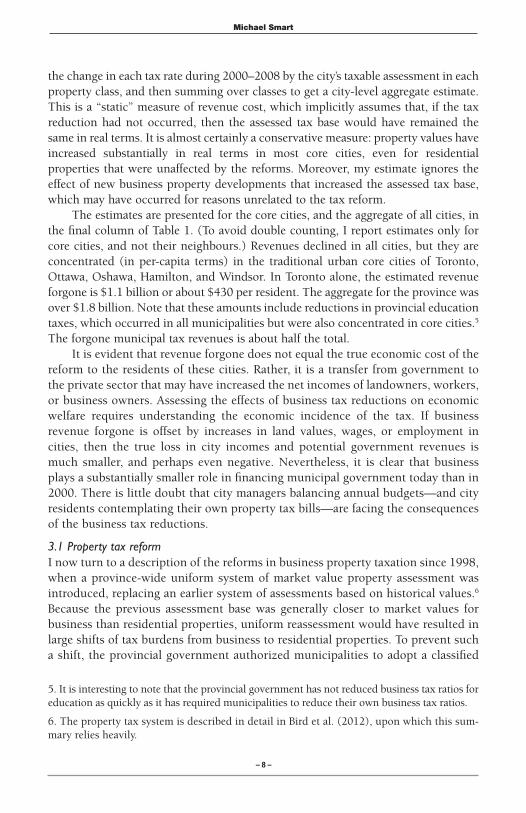
Table 2 reports employment intensity indexes in the southern Ontario CMAsfor the industry groupings used in the subsequent analysis. The data are from a 20percent sample of the 2001 Census, which reports the usual place of work for eachrespondent. For each CMA, the index is computed separately for the urban core
– 11 –
Figure 1: The change in business tax rates
Tax rate in 2000
Tax
rate
in 2
006
Other municipalities45–degree line
Capped municipalities
2
24
68
10
4 6 8 10
Michael Smart
– 12 –
city (“Core”), and for the core city’s five closest neighbours (“Suburb”). For the ag-gregate of all industries, the core city indexes range from 0.90 to 1.08, indicatingthat some core cities remain employment centres relative to the provincial average,but many are not. In 7 of the 12 CMAs, the aggregate index is lower in the core citythan the neighbouring suburbs, indicating considerable suburbanization of employ-ment. This list includes the largest cities and traditional manufacturing centres, suchas Toronto, Ottawa, Hamilton, and Windsor.
The indexes for industry groupings reveal patterns of industry specialization. Iuse the following industry aggregates: Manufacturing (NAICS codes 31–33), Whole-sale and Retail Trade and Transport (NAICS codes 41–48), and Services, includingFinance, Insurance and Real Estate, and other industries with a high proportion ofemployment in professional occupations (NAICS codes 51–56).11 Several core citiesremain specialized in manufacturing, including Brantford, Guelph, Kitchener, andWindsor, but this is a regional phenomenon, with neighbouring communities show-ing similar patterns. Not surprisingly, Ottawa and Toronto are specialized in services,and to a much greater extent than surrounding communities.
The strong correlation between intensity indexes for core city and suburbssuggests that the suburbanization of employment is not a simple phenomenon.While cities may be “competing for jobs” with their neighbours, region-widefactors clearly play a role. One possible explanation is agglomeration economies atthe regional level, or other positive spillovers across communities. This point hasbeen made for the United States by Haughwout and Inman (2002), among others.But the cross-sectional data may simply reflect region-wide common factors, suchas access to markets or to key production inputs, which would also explain why
11. I exclude from this classification primary industries, and tertiary industries that manyproduce non-tradables (such as accommodation) or are in the broader public sector (such aseducation and health care). These industries are likely to be least responsive to tax differentialsin their location choices.
Table 2: Employment intensity by industry and city, 2001
All industries Manufacturing Trade Services
Core Suburbs Core Suburbs Core Suburbs Core Suburbs
Brantford 0.98 1.03 1.59 1.69 0.90 1.01 0.66 0.68Guelph 1.08 1.04 1.64 1.58 0.90 1.05 0.78 0.75Hamilton 0.95 1.03 1.12 1.12 0.94 1.10 0.72 1.16Kingston 0.88 0.82 0.37 0.68 0.80 0.81 0.68 0.52Kitchener 1.07 1.04 1.66 1.48 1.03 0.95 0.87 0.91London 1.01 1.00 0.85 1.26 0.99 0.95 0.95 0.66Oshawa 1.00 1.01 1.22 0.91 1.06 1.04 0.76 1.17Ottawa 0.90 1.03 0.51 0.94 0.80 0.97 1.24 0.96Peterborough 0.90 0.99 0.67 0.85 0.87 0.93 0.64 0.63St. Catharines 0.95 0.94 0.95 1.01 1.01 0.92 0.69 0.65Toronto 1.00 1.04 0.85 1.06 0.90 1.27 1.41 1.25Windsor 0.95 1.01 1.57 1.73 0.78 0.86 0.56 0.57
The Reform of Business Property Tax in Ontario: An Evaluation
– 13 –
employment specialization is similar in core and suburban cities. The data for the 2001 cross-section also do not show how employment patterns are changingover time.
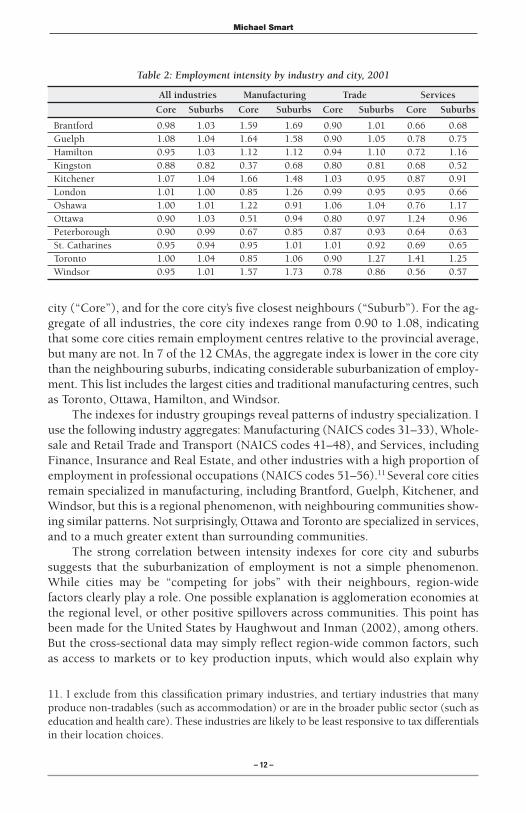
The first panel of Figure 2 provides evidence on employment growth betweenthe 2001 and 2006 Censuses, for core cities and their suburbs. The data showessentially no relationship, positive or negative, between core and suburbangrowth, as indicated by the line of best fit that is nearly flat. My data, aggregated to
Growth in employment: Suburbs
Gro
wth
in e
mpl
oym
ent:
Cor
e ci
ties
ManufacturingProfessional
TradeFitted values
0 .02 .04 .06 .08
-.2
-.1
0.1
.2
Growth in establishments : Suburbs
Gro
wth
in e
stab
lishm
ents
: Cor
e ci
ties
ManufacturingProfessional
TradeFitted values
-.05 0 .05 .1
-.2
0.2
.4.6
Figure 2: Growth in employment and establishments, core cities, 2001-2006
Michael Smart
– 14 –
the municipality (census subdivision) level, are coarser than those used by Heiszand LaRochelle-Côté (2005) and others who have found evidence forsuburbanization, which may explain the lack of effect.
The second panel of Figure 2 shows the same relationship, but for a measureof business location rather than employment. I use counts of establishments with10 or more employees in each municipality, from the annual Canadian BusinessPatterns data, which again I divide by population and normalize by dividing by theprovincial average to arrive at the intensity index. The establishment data doesshow a small negative correlation between establishment growth in core cities andtheir suburbs, but the estimated relationship is insignificant.
This analysis of correlations is necessarily inconclusive. Core cities and theirsuburbs tend to be affected by common economic shocks that cause theireconomies to grow together over time, and that may therefore mask evidence ofsuburbanization of employment. In what follows, I turn to a more reliable way ofestimating the trade-offs between economic activity in core and suburbs, based onthe Ontario property tax reform.
The theoretical literature suggests that city residents may prefer high rates ofproperty taxation to the extent that the taxes are “exported” to non-residentworkers in the form of lower wages. As a preliminary check on the validity of thistax exporting view, I present in Figure 3 evidence on the pattern of taxes prevailingprior to the reform. The dependent variable is the percentage tax rate applied tocommercial, industrial, or office properties relative to the municipality’s residentialtax rate; the mean of the tax ratio for each industry and region of the province hasbeen subtracted, to render the observations comparable. The mean tax ratio foreach observation is graphed against the corresponding employment intensity ratiofor manufacturing, trade, and services in the municipality, from the 2001 Census.
Tax ratios are generally increasing in employment intensity, and the slope ofthe line of best fit is 0.595 (σ = 0.106). As suggested by the tax exporting view,municipalities with high employment intensity in an industry, which tend to“import” labour from neighbouring jurisdictions, also levy the highest relative taxrates. In the figure, observations for the 12 core cities are highlighted, and (in theinterests of legibility) the observations for manufacturing are labelled with thecity’s name. Core city tax rates are higher than would be predicted by theiremployment intensity alone. This finding is consistent with the idea that cities thatare fully built-out, and where taxes are most likely to be capitalized into landvalues, are those that tax business properties at the highest rates.
4.Property tax reform: An evaluation The preceding discussion suggests that it is important to evaluate the effects of thebusiness property tax reductions on business location and employment, and, moregenerally, to understand the sensitivity of business location decisions to propertytax differentials. In this section, I use regression methods to provide some answersto these questions. The following discussion is therefore necessarily somewhat
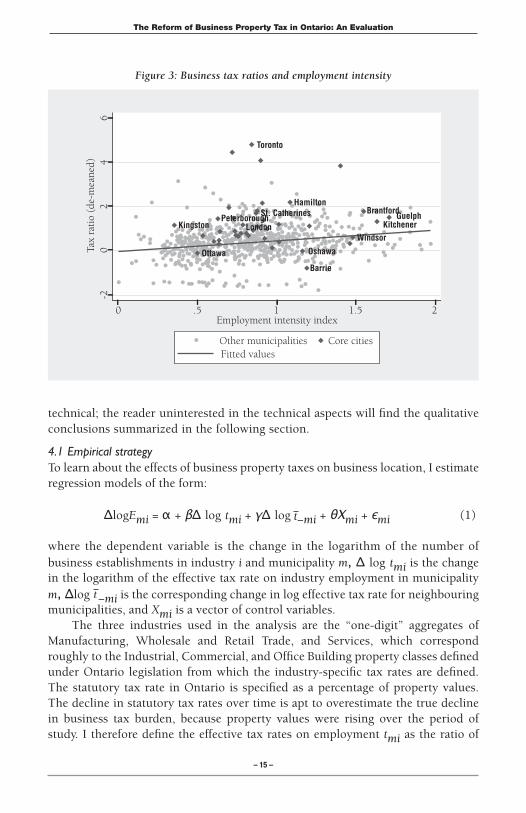
Figure 3: Business tax ratios and employment intensity
The Reform of Business Property Tax in Ontario: An Evaluation
– 15 –
technical; the reader uninterested in the technical aspects will find the qualitativeconclusions summarized in the following section.
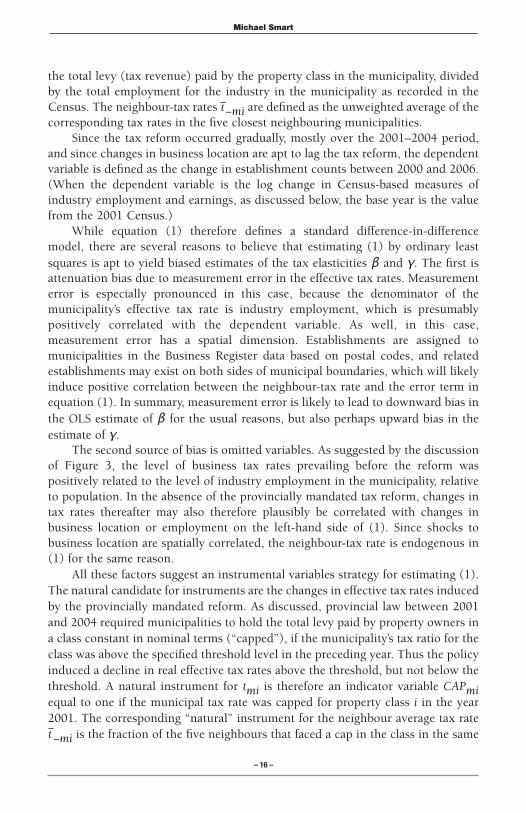
4.1 Empirical strategyTo learn about the effects of business property taxes on business location, I estimateregression models of the form:
ΔlogEmi = α + βΔ log tmi + γΔ log −mi + θXmi + єmi (1)
where the dependent variable is the change in the logarithm of the number of business establishments in industry i and municipality m, Δ log tmi is the changein the logarithm of the effective tax rate on industry employment in municipality m, Δlog −mi is the corresponding change in log effective tax rate for neighbouringmunicipalities, and Xmi is a vector of control variables.
The three industries used in the analysis are the “one-digit” aggregates ofManufacturing, Wholesale and Retail Trade, and Services, which correspondroughly to the Industrial, Commercial, and Office Building property classes definedunder Ontario legislation from which the industry-specific tax rates are defined.The statutory tax rate in Ontario is specified as a percentage of property values.The decline in statutory tax rates over time is apt to overestimate the true declinein business tax burden, because property values were rising over the period ofstudy. I therefore define the effective tax rates on employment tmi as the ratio of
6
0 .5 1 1.5 2
-20
24
Employment intensity index
Tax
rati
o (d
e-m
eane
d)
Other municipalitiesFitted values
Core cities
Toronto
HamiltonSt. CatherinesPeterborough
LondonKingston
Ottawa
GuelphKitchener
Oshawa
Barrie
Windsor
Brantford
Michael Smart
– 16 –
the total levy (tax revenue) paid by the property class in the municipality, dividedby the total employment for the industry in the municipality as recorded in theCensus. The neighbour-tax rates −mi are defined as the unweighted average of thecorresponding tax rates in the five closest neighbouring municipalities.
Since the tax reform occurred gradually, mostly over the 2001–2004 period,and since changes in business location are apt to lag the tax reform, the dependentvariable is defined as the change in establishment counts between 2000 and 2006.(When the dependent variable is the log change in Census-based measures ofindustry employment and earnings, as discussed below, the base year is the valuefrom the 2001 Census.)
While equation (1) therefore defines a standard difference-in-differencemodel, there are several reasons to believe that estimating (1) by ordinary leastsquares is apt to yield biased estimates of the tax elasticities β and γ. The first isattenuation bias due to measurement error in the effective tax rates. Measurementerror is especially pronounced in this case, because the denominator of themunicipality’s effective tax rate is industry employment, which is presumablypositively correlated with the dependent variable. As well, in this case,measurement error has a spatial dimension. Establishments are assigned tomunicipalities in the Business Register data based on postal codes, and relatedestablishments may exist on both sides of municipal boundaries, which will likelyinduce positive correlation between the neighbour-tax rate and the error term inequation (1). In summary, measurement error is likely to lead to downward bias inthe OLS estimate of β for the usual reasons, but also perhaps upward bias in theestimate of γ.
The second source of bias is omitted variables. As suggested by the discussionof Figure 3, the level of business tax rates prevailing before the reform waspositively related to the level of industry employment in the municipality, relativeto population. In the absence of the provincially mandated tax reform, changes intax rates thereafter may also therefore plausibly be correlated with changes inbusiness location or employment on the left-hand side of (1). Since shocks tobusiness location are spatially correlated, the neighbour-tax rate is endogenous in(1) for the same reason.
All these factors suggest an instrumental variables strategy for estimating (1).The natural candidate for instruments are the changes in effective tax rates inducedby the provincially mandated reform. As discussed, provincial law between 2001and 2004 required municipalities to hold the total levy paid by property owners ina class constant in nominal terms (“capped”), if the municipality’s tax ratio for theclass was above the specified threshold level in the preceding year. Thus the policyinduced a decline in real effective tax rates above the threshold, but not below thethreshold. A natural instrument for tmi is therefore an indicator variable CAPmiequal to one if the municipal tax rate was capped for property class i in the year2001. The corresponding “natural” instrument for the neighbour average tax rate
−mi is the fraction of the five neighbours that faced a cap in the class in the same
The Reform of Business Property Tax in Ontario: An Evaluation
– 17 –
year (NBCAPmi). Since the effects of the reform on business location are apt todiffer if a municipality and its neighbours are both reducing taxes simultaneously,the interaction of these two variables is also excluded as an instrument for taxrates. (Including the interaction term has the additional advantage of over-identifying (1).)
The control variables in (1) include the change in log municipal population,the change in the municipal residential tax rate, and fixed effects for industry andeach of three regions of the province, which allow for the possibility of differentsectoral and regional trends that are correlated with the instruments. To control fortransitory effects, the equation includes the log number of establishments in thebase year (with corresponding base-year controls for the other dependent variablesreported below). As well, CAP is by construction correlated with the base yeareffective tax rate, which could exert lagged effects on the change in the dependentvariable between the base year and 2006. The log of the effective tax rate in thebase year is therefore also included as a control variable in all specifications. Insome cases, establishment counts in some municipalities and industries are zero.To avoid excluding these observations and dealing with the resulting selectionbiases, I defined the dependent variable as the logarithm of the establishmentcount, and included an indicator variable for observations in which the 2006establishment count is zero.
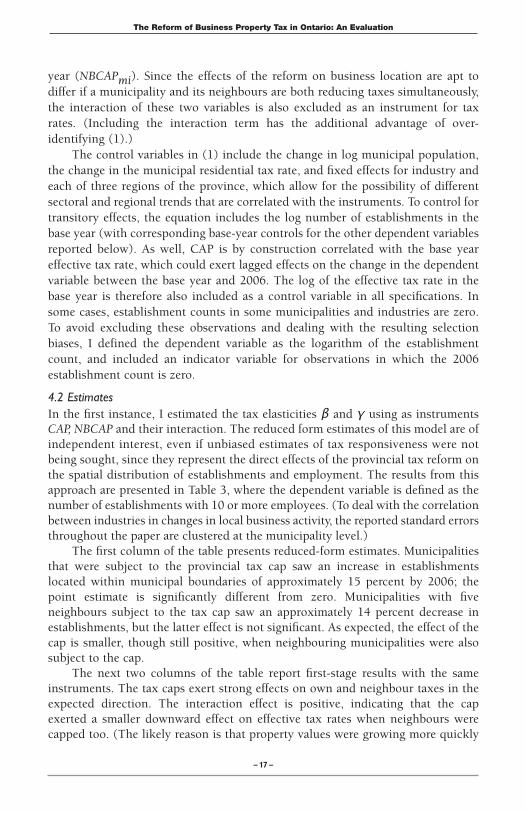
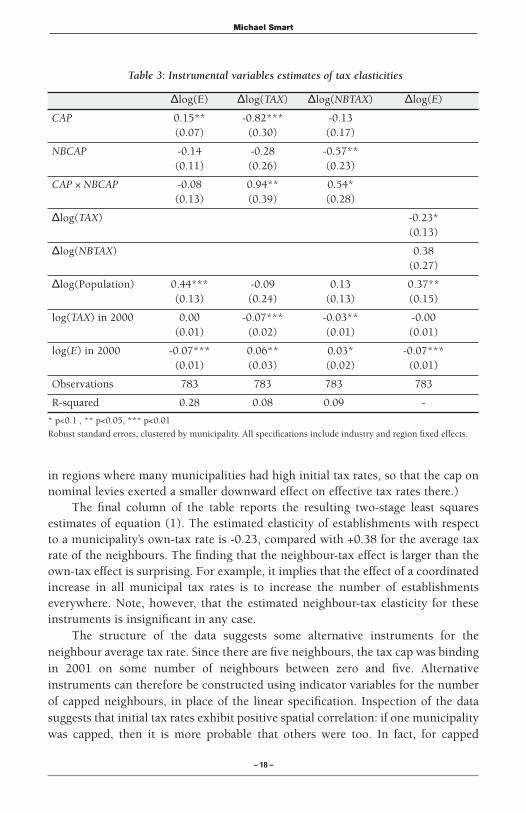
4.2 EstimatesIn the first instance, I estimated the tax elasticities β and γ using as instrumentsCAP, NBCAP and their interaction. The reduced form estimates of this model are ofindependent interest, even if unbiased estimates of tax responsiveness were notbeing sought, since they represent the direct effects of the provincial tax reform onthe spatial distribution of establishments and employment. The results from thisapproach are presented in Table 3, where the dependent variable is defined as thenumber of establishments with 10 or more employees. (To deal with the correlationbetween industries in changes in local business activity, the reported standard errorsthroughout the paper are clustered at the municipality level.)
The first column of the table presents reduced-form estimates. Municipalitiesthat were subject to the provincial tax cap saw an increase in establishmentslocated within municipal boundaries of approximately 15 percent by 2006; thepoint estimate is significantly different from zero. Municipalities with fiveneighbours subject to the tax cap saw an approximately 14 percent decrease inestablishments, but the latter effect is not significant. As expected, the effect of thecap is smaller, though still positive, when neighbouring municipalities were alsosubject to the cap.
The next two columns of the table report first-stage results with the sameinstruments. The tax caps exert strong effects on own and neighbour taxes in theexpected direction. The interaction effect is positive, indicating that the capexerted a smaller downward effect on effective tax rates when neighbours werecapped too. (The likely reason is that property values were growing more quickly
Michael Smart
– 18 –
in regions where many municipalities had high initial tax rates, so that the cap onnominal levies exerted a smaller downward effect on effective tax rates there.)
The final column of the table reports the resulting two-stage least squaresestimates of equation (1). The estimated elasticity of establishments with respectto a municipality’s own-tax rate is -0.23, compared with +0.38 for the average taxrate of the neighbours. The finding that the neighbour-tax effect is larger than theown-tax effect is surprising. For example, it implies that the effect of a coordinatedincrease in all municipal tax rates is to increase the number of establishmentseverywhere. Note, however, that the estimated neighbour-tax elasticity for theseinstruments is insignificant in any case.
The structure of the data suggests some alternative instruments for theneighbour average tax rate. Since there are five neighbours, the tax cap was bindingin 2001 on some number of neighbours between zero and five. Alternativeinstruments can therefore be constructed using indicator variables for the numberof capped neighbours, in place of the linear specification. Inspection of the datasuggests that initial tax rates exhibit positive spatial correlation: if one municipalitywas capped, then it is more probable that others were too. In fact, for capped
Table 3: Instrumental variables estimates of tax elasticities
� Δlog(E) Δlog(TAX) Δlog(NBTAX) Δlog(E)
CAP 0.15** -0.82*** -0.13 (0.07) (0.30) (0.17)
NBCAP -0.14 -0.28 -0.57** (0.11) (0.26) (0.23)
CAP × NBCAP -0.08 0.94** 0.54* (0.13) (0.39) (0.28)
Δlog(TAX) -0.23* (0.13)
Δlog(NBTAX) 0.38 (0.27)
Δlog(Population) 0.44*** -0.09 0.13 0.37** (0.13) (0.24) (0.13) (0.15)
log(TAX) in 2000 0.00 -0.07*** -0.03** -0.00 (0.01) (0.02) (0.01) (0.01)
log(E) in 2000 -0.07*** 0.06** 0.03* -0.07*** (0.01) (0.03) (0.02) (0.01)
Observations 783 783 783 783
R-squared 0.28 0.08 0.09 -
* p<0.1 , ** p<0.05, *** p<0.01
Robust standard errors, clustered by municipality. All specifications include industry and region fixed effects.
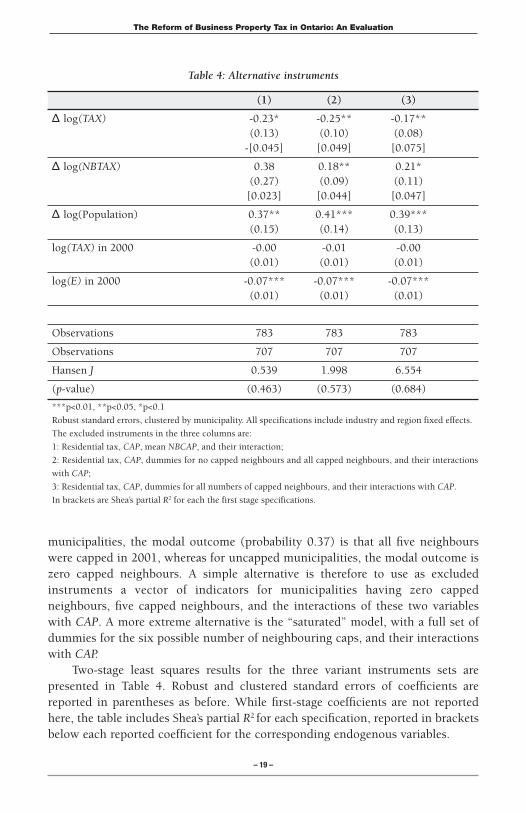
Table 4: Alternative instruments
The Reform of Business Property Tax in Ontario: An Evaluation
– 19 –
municipalities, the modal outcome (probability 0.37) is that all five neighbourswere capped in 2001, whereas for uncapped municipalities, the modal outcome iszero capped neighbours. A simple alternative is therefore to use as excludedinstruments a vector of indicators for municipalities having zero cappedneighbours, five capped neighbours, and the interactions of these two variableswith CAP. A more extreme alternative is the “saturated” model, with a full set ofdummies for the six possible number of neighbouring caps, and their interactionswith CAP.
Two-stage least squares results for the three variant instruments sets arepresented in Table 4. Robust and clustered standard errors of coefficients arereported in parentheses as before. While first-stage coefficients are not reportedhere, the table includes Shea’s partial R2 for each specification, reported in bracketsbelow each reported coefficient for the corresponding endogenous variables.
(1) (2) (3)
Δ log(TAX) -0.23* -0.25** -0.17**(0.13) (0.10) (0.08)-[0.045] [0.049] [0.075]
Δ log(NBTAX) 0.38 0.18** 0.21*(0.27) (0.09) (0.11)[0.023] [0.044] [0.047]
Δ log(Population) 0.37** 0.41*** 0.39***(0.15) (0.14) (0.13)
log(TAX) in 2000 -0.00 -0.01 -0.00(0.01) (0.01) (0.01)
log(E) in 2000 -0.07*** -0.07*** -0.07***(0.01) (0.01) (0.01)
Observations 783 783 783
Observations 707 707 707
Hansen J 0.539 1.998 6.554
(p-value) (0.463) (0.573) (0.684)
***p<0.01, **p<0.05, *p<0.1
Robust standard errors, clustered by municipality. All specifications include industry and region fixed effects.
The excluded instruments in the three columns are:
1: Residential tax, CAP, mean NBCAP, and their interaction;
2: Residential tax, CAP, dummies for no capped neighbours and all capped neighbours, and their interactions
with CAP;
3: Residential tax, CAP, dummies for all numbers of capped neighbours, and their interactions with CAP.
In brackets are Shea’s partial R2 for each the first stage specifications.
Michael Smart
– 20 –
The estimated tax elasticities in all three specifications are quite similar,although point estimates are somewhat smaller and the precision is greater forspecifications (2) and (3) than for the “simple” instruments of specification (1). Thepartial R2 results suggest that the excluded instruments in specifications (2) and (3)have considerably more power in explaining variation in the neighbour average taxrate, so that the potential for bias in the two-stage least squares estimates should besmaller in this case. On the other hand, the number of excluded instruments in the“saturated” specification (3) is 13, which tends to exacerbate bias in the presence ofweak instruments. Taking all these considerations into account, it seems thatspecification (2)—with indicators for “no capped neighbours” and “all cappedneighbours” and the interactions—is the preferred one. Note also that, on the basisof the standard over-identification test statistic, we cannot reject excludinginstruments from the second stage in any of the three cases.
In specification (2), the estimated own-tax elasticity is –0.25, and theestimated neighbour-tax elasticity is +0.18. The neighbour-tax effect is(reassuringly) smaller than the own-tax effect, but the two are very similar, andstatistically indistinguishable. This finding suggests that tax reductions in onemunicipality increase business location over time, largely at the expense of itsneighbours. According to the estimates, the effect of a coordinated tax reductionby all municipalities is extremely small. Indeed, the estimated –0.25 elasticitysuggests that even the effect of uncoordinated own-tax reductions is rather small:a tax rate reduction of 40 percent—about what has occurred among themunicipalities with the highest initial tax rates—causes an increase in businesslocation of just 10 percent, according to this estimate. As discussed in Section 2,under the canonical “capital tax view” of the property tax, businesses should behighly mobile across local boundaries in response to tax differentials. Theestimates reported here are instead consistent either with a rather small degree ofbusiness mobility, or else with the possibility that local tax differentials arecapitalized into local land price differentials or into wages.
Table 5, the final table of results, explores these possibilities further, usingother dependent variables in place of the change in establishments with ten ormore employees. In the first column, the dependent variable is the change in logmunicipal employment in the industry between the 2001 and 2006 Censuses. Theown-tax effect is smaller in this case and insignificant, but still similar to thatobtained for establishments. The neighbour-tax effect is somewhat larger, but againsimilar. One possible explanation for the smaller own-tax effect on employment isthat large establishments are less tax-sensitive than smaller ones. As evidence ofthis possibility, column reports results for equation (1) using as the dependentvariable the log change in the number of establishments with 100 or moreemployees. The estimated own-tax elasticity, at –0.20, is indeed somewhat smallerin this case than that for all establishments, but not much.
In the final column of Table 5, the dependent variable is the change in the logof average employment income of full-time, full-year employed men residing in themunicipality, as reported in the 2001 and 2006 Censuses. As discussed in Section 2,

The Reform of Business Property Tax in Ontario: An Evaluation
– 21 –
if business property taxes reduce labour productivity in a municipality, and iflabour is less than perfectly mobile between economic regions, then taxes may bepartially capitalized into lower wages for workers. Moreover, if workers are lessmobile than firms across municipal boundaries within a region or metropolitanarea, then wage capitalization as well as land price capitalization will tend toreduce the mobility of business and employment in response to tax differentials.
While individual wages are not available in the profiles of census subdivisionspublished from Census data, average employment income is available, and it maybe a proxy for wages and labour productivity. (Since employment income ispublished only for the aggregate of all industries, the sample size falls, and Isomewhat arbitrarily associate the data with the tax rates for the Office Buildingclass, on the grounds that Services is the largest employer of the three industryaggregates in the data.) The results for employment income may be of independentinterest anyway, to the extent that they speak to whether “good jobs” are movingin response to the tax changes. However, the results are largely inconclusive onthese questions. The estimated elasticities for employment income have theexpected signs, but the estimated own-tax elasticity is small and statisticallyinsignificant. The neighbour-tax elasticity is positive and significant, though againsmall. While these results are suggestive of some capitalization of tax differencesinto local wages, they are less than definitive.
5.Concluding remarks Business property taxes in Ontario have fallen substantially in the past decade,largely because of a series of reforms mandated by the provincial government.According to a (conservative) “static” estimate, the reform has reduced taxes paidon commercial and industrial properties by about $2 billion per year, with more
Table 5: Alternative dependent variables
Employment Large establishments Earnings
Δ log(TAX) -0.10 -0.20** -0.03 (0.07) (0.10) (0.04)
Δ log(NBTAX) 0.26** 0.19** 0.05** (0.11) (0.09) (0.03)
Δ log(Population) 0.37** 0.41*** 0.39***(0.15) (0.14) (0.13)
Observations 782 783 260
Hansen J 2.060 7.061 3.817
(p-value) (0.560) (0.070) (0.282)
* p<0.1, ** p<0.05, *** p<0.01,
Robust standard errors, clustered by municipality. All specifications include industry and region fixed effects
and controls for the change in log population and the base year values of the log tax rate and the dependent
variable.
Michael Smart
– 22 –
than half the forgone revenue accounted for by municipal and education propertytaxes in the City of Toronto. Arguably, the reform has caused a large shift in taxburdens from business to residential ratepayers, and contributed to the fiscalpressures currently facing Toronto and other Ontario municipal governments.
Whether these revenue reductions are desirable or not depends on whetherthe tax is ultimately paid by businesses occupying land in high-tax cities, or shiftedthrough price changes to workers, owners of land, or other factors of production.In the standard economic views of the property tax, it is ultimately either a tax oncapital employed in residential and non-residential structures, or it is a tax on localland values. If the former view is correct, then property taxes (particularly thoseon business properties) create high economic costs by discouraging investment,distorting location, and reducing productivity, and there is a strong case for reformsto reduce business taxes to the same rates as those for residential properties, oreven below. If the latter view is correct, then the property tax is an efficient meansof raising revenue for local governments, and high rates of business taxation are nocause for concern—even if rates differ between neighbouring locations.
The quantitative analysis in this paper goes some way towards a fullerunderstanding of the economic effects of the local business property tax, and afuller evaluation of the effects of the reform in Ontario. The analysis investigatesthe links between business location and employment decisions and property taxes.As well as illustrating the effects of the provincial reform, the approach in thispaper permits us to learn more about the tax responsiveness of business locationmore generally, because it exploits changes in property taxes induced by provincialpolicy since 2001. These changes are separate from other factors driving“voluntary” local tax changes that may be correlated with unobservabledeterminants of local economic activity, which would otherwise lead to biasedestimates of tax responsiveness.
In the preferred empirical specification, the estimate of municipal propertytaxes on business location is statistically significant, but economically small.According to my estimates, a 40 percent tax rate reduction by the averagemunicipality would cause an increase in the number of business establishmentslocating there of about 10 percent. On the other hand, a 40 percent tax ratereduction by the municipality’s closest neighbours would cause an offsettingdecrease in business establishments of about 7 percent. Similar results are obtainedfor the sensitivity to local tax differentials of both large employers and totalindustry employment in the municipality.
These results have strong implications for the standard economic theories ofthe property tax. Under the canonical “capital tax view” of the property tax,businesses should be highly mobile across local boundaries in response to taxdifferentials. The estimates reported here instead suggest that businesses arerelatively immobile in response to changes in local tax differentials, even over aperiod of several years. More elaborate theories suggest a number of reasons whythis may be the case. Moving is costly, and the full effects of the tax reform may notbe realized until much later, after the natural process of exit and entry causes

The Reform of Business Property Tax in Ontario: An Evaluation
– 23 –
business activity to shift fully in response to the tax reform. As well, the low degreeof observed mobility may reflect the capitalization of local tax differentials intolocal land price differentials, or into wages at the municipal and regional level. Inthis sense, my results are more consistent with an extended “benefit tax view” thanthe “capital tax view” of property taxation.
In more practical terms, the results allow us to draw some conclusions aboutthe desirability of the Ontario reforms. The small estimated elasticities of businesslocation to tax differentials imply that the gains in productivity from greater taxharmonization are comparatively small. On the other hand, while the revenue costof the reform was comparatively large, the revenue forgone does not represent atrue economic cost to the residents of the cities experiencing tax reductions.Rather, it is a transfer from government to the private sector, that may increase thenet incomes of landowners, workers, or business owners.
Assessing the effects of business tax reductions on economic welfare requiresfurther understanding of the economic incidence of the tax. If business revenueforgone is offset by increases in land values, wages, or employment in cities, thenthe true loss in city incomes and potential government revenues is much smaller,and perhaps even negative.
Works CitedBartik, T.J. 1985. Business location decisions in the United States: Estimates of the effectsof unionization, taxes, and other characteristics of states. Journal of Business & EconomicStatistics 3(1), 14–22.
Bartik, T.J. 1991. Who Benefits from State and Local Economic Development Policies?Kalamazoo, Mich.: W.E. Upjohn Institute for Employment Research.
Bird, R., E. Slack, and A. Tassonyi. 2012. A Tale of Two Taxes: Property Tax Reform in Ontario, Cambridge, Mass.: Lincoln Institute of Land Policy.
Canadian Urban Institute. 2011. The New Geography of Office Location and the Consequences of Business as Usual in the GTA. Toronto: Canadian Urban Institute.
Duranton, G., L. Gobillon, and H.G. Overman. 2011. Assessing the effects of local taxation using microgeographic data. The Economic Journal 121(555), 1017–1046.
Fischel, W.A. 1976. An evaluation of proposals for metropolitan sharing of commercialand industrial property tax base. Journal of Urban Economics 3(3), 253–263.
Hamilton, B.W. 1975. Zoning and property taxation in a system of local governments.Urban Studies 12(2), 205–211.
Haughwout, A. and R.P. Inman. 2002. Should suburbs help their central city? Brookings-Wharton Papers on Urban Affairs 2002 (1), 45–94.
Haughwout, A., R. Inman, S. Craig, and T. Luce. 2004. Local revenue hills: Evidencefrom four US cities. Review of Economics and Statistics 86(2), 570–585.
Heisz, A. and S. LaRochelle-Côté. 2005. Work and Commuting in Census MetropolitanAreas, 1996-2001. Technical Report. Ottawa: Statistics Canada.

Michael Smart
– 24 –
Lee, N. and W. Wheaton. 2010. Property Taxes Under “Classification”: Why Do Firms PayMore? Technical Report. Cambridge Mass.: MIT Center for Real Estate.
Oates, W.E. 1969. The effects of property taxes and local public spending on propertyvalues: An empirical study of tax capitalization and the Tiebout hypothesis. Journal ofPolitical Economy 77(6), 957–961.
Oates, W.E. and R.M. Schwab. 1997. The impact of urban land taxation: The Pittsburghexperience. National Tax Journal 50, 1–21.
Slack, E. 2003. Are Ontario Cities at a Competitive Disadvantage Compared to U.S. Cities?Toronto: Institute for Competitiveness and Prosperity.
Wilson, J.D. 1985. Optimal property taxation in the presence of interregional capital mobility. Journal of Urban Economics 18(1), 73–89.
Zodrow, G. 2006. Who pays the property tax? Land Lines (18)2.
Zodrow, G.R. and P. Mieszkowski. 1986. Pigou, Tiebout, property taxation, and the underprovision of local public goods. Journal of Urban Economics 19(3), 356–370.
Appendix: Summary Statistics
(1) (2)
Variables Mean SD
Establishments by Sector 76.9 415.6
Employment by Sector (thousands) 4.4 20.1
Average earnings ($ thousands) 53.8 12.6
Effective tax rate in 2000 ($ per employee) 716.8 989.9
Population (thousands) 44.6 184.1

ISBN 978-0-7727-0883-0ISSN 1927-1921