Mystery Shopping Study JobLink Career Centers · Mystery Shopping Study JobLink Career Centers...
25
Mystery Shopping Study JobLink Career Centers February, 2012 The North Carolina Commission on Workforce Development “Preparing North Carolina’s Workforce and Businesses for the Global Economy”
-
Upload
hoangtuyen -
Category
Documents
-
view
215 -
download
2
Transcript of Mystery Shopping Study JobLink Career Centers · Mystery Shopping Study JobLink Career Centers...
Mystery Shopping Study
JobLink Career Centers
February, 2012
The North Carolina Commission
on Workforce Development
“Preparing North Carolina’s Workforce and Businesses
for the Global Economy”
The North Carolina Commission on Workforce Development
procured the services of the following organizations
to conduct this research:
“Preparing North Carolina’s Workforce and Businesses
for the Global Economy”
This report is a product of the North Carolina Commission on
Workforce Development, under the direction of the
Operations Committee, chaired by Ms. Martha Matthews
Special thanks to:
Ms. Jane Edwards-Hall
Vice President, Ipos Mystery Shopping IPSOS Loyalty
www.Ipsos.com\Loyalty
pg. 1
Table of Contents
Background and Objectives ............................................................................................................ 2
Approach and Methodology ........................................................................................................... 2
Executive Overview ......................................................................................................................... 3
Detailed Findings: Job Seekers……………………………………………………………………………………………………5
Website Evaluations: Jobseekers .................................................................................................... 6
Telephone Evaluations: Jobseekers ................................................................................................ 7
In-person Evaluations: Jobseekers .................................................................................................. 9
Detailed Findings: Employers ........................................................................................................ 13
Website Evaluations: Employers................................................................................................... 14
Telephone Evaluations: Employers ............................................................................................... 15
Conclusions and Future Action-Planning Recommendations....................................................... 17
Additional Anaylsis: Results by Tier and Minority Evaluator ........................................................ 19
Additional Analysis: What Does Good Look Like? ........................................................................ 20
Executive Evaluations ................................................................................................................... 21
pg. 2
Background and Objectives The North Carolina Commission on Workforce Development (Commission) is designated as the State’s
Workforce Investment Board under the federal Workforce Investment Act (WIA) of 1998.
The number one objective of the Commission is to ensure that the workforce of North Carolina has
access to and the required skills to be able to compete effectively in the current and future global
economy.
One of the key strategic plans in this initiative is to create a seamless and holistic system that is also
“one-stop”:
In order to benchmark and monitor the current conditions of the JobLink Career Centers with regards to
the performance of initiatives and front-line delivery (both service and systems), a Mystery Shopping
Research approach was commissioned in 2011. Ipsos (formerly Synovate)* conducted this program on
behalf of NC DWS during 2011. Mystery Shopping was considered to be the most appropriate research
methodology to understand delivery of services as experienced in reality by a real “potential” job-seeker
and employer wishing to utilize the services and resources of the network.
The beauty of this approach over and above other research methodologies is that it provides a neutral
and objective understanding of what is really happening at the front-line touch-point (whether this be
an in-person, phone or website touch-point).
This report describes in detail the findings of the Mystery Shopping program and, furthermore, provides
consultation on action-planning for future strategy alignment.
*Synovate was acquired by Ipsos in October 2011. All new branding was effective January 1, 2012.
Approach and Methodology
Fieldwork for the mystery shopping program took place between May and November 2011, after an
initial pilot to determine the operational workability of the approach.
One hundred and twenty-four job-seeker and 116 employer scenarios respectively were conducted. Two
deep-dive job-seeker evaluations were conducted which were followed by an in-depth interview with
each evaluator. Eight executive telephone job-seeker mystery shops were also conducted by members
of the research team at Ipsos.
“The Commission is charged with creating a single, effective, coherent
and comprehensive workforce system from the numerous workforce
programs administered through various state and local agencies.”
pg. 3
The JobLink Career Centers were sampled so as to be proportionally representative of the State-wide
network of centers across North Carolina and as such three tiers were created for analysis of results. A
small sample of both Hispanic and disability shops were also conducted.
The sample configuration was as follows:
Job-seekers – Profile:
• Tier 1 (counties with population over 250,000) = 33 completed shops
• Tier 2 (counties with population over 75,000 and up to 250,000) = 43 completed shops
• Tier 3 (counties with population 75,000 or less) = 48 completed shops
• Shops conducted by Hispanic shoppers = 8 completed shops
• Shops conducted by persons with disabilities = 7 completed shops
Employers – Profile:
• Tier 1 (counties with population over 250,000) = 30 completed shops
• Tier 2 (counties with population over 75,000 and up to 250,000) = 42 completed shops
• Tier 3 (counties with population 75,000 or less) = 44 completed shops
Furthermore, locations were selected according to selection within unemployment bands (using the
February 2011 unemployment data).
The profiles applied to the job-seeker scenarios were as follows:
• Profile 1: Blue Collar – Recently unemployed = 20 completed shops
• Profile 2: White Collar – Recently unemployed = 16 completed shops
• Profile 3: Blue Collar – Company making layoffs = 16 completed shops
• Profile 4: White Collar – Company making layoffs = 16 completed shops
• Profile 5: Blue Collar – Moving to area = 17 completed shops
• Profile 6: White Collar – Moving to area = 18 completed shops
• Profile 7: Long-term unemployed = 13 completed shops
• Profile 8: Never been employed = 8 completed shops
Executive Overview
Key Insights
Overall the experience for both job-seekers and employers was seen to be average to good; the
evaluators deployed on the program gave good ratings for overall impressions and likelihood to use
again or recommend the services of the centers.
The center staff was seen to be friendly, polite and efficient.
The website was rated at being very/fairly informative.
pg. 4
A deeper analysis of individual ratings revealed, nevertheless, weaker links in the service delivery chain
that need attention in the short and longer term if the centers are to become efficient and consistent in
the provision of an ideal customer experience. The key overarching findings in this respect are as
follows:
• Inconsistencies across centers and within single experiences
• Lack of proactivity and customized experiences
• Even some operational standards not met – such as customer feedback cards and swipe
cards being provided
• Leaving and Closing needs attention
• Specific information on website mostly “fairly” easy to find – what would it take to get
this experience to the next level of “very” easy to find?
• Telephone experience weak: 27% of job-seekers going through to an Interactive Voice
Response (IVR) system never received a “live” person on the phone
In general, the employer experience was much weaker overall than that of the job-seeker. It should be
noted that the employer scenario did not include an in-person assessment, only web and telephone.
Since the overall telephone experience for job-seekers was weaker than the in-person experience, this
could partially explain the reason for the overall lower score attributed to the employer scenario.
Nevertheless, the key challenge for the employer service delivery appears to be a need for very specific
and detailed information and, Ipsos would suggest, a separate approach to handling inquiries by
potential employer customers. A succinct yet detailed dissemination of information is required in a
business-to-business context.
The overarching conclusion from this research is that service delivery is good in terms of “getting the
basics right” and providing for a friendly and pleasant experience; nevertheless, there is a distinct lack of
“raising the bar” on the experience delivered in very few cases; in the majority of instances the service
was seen to be only just above average with most overall scores hovering around 50%. There were not
many exceptional service experiences witnessed.
There is a need for more detailed inquiry during the in-person assessment and also over the phone.
Indeed, the telephone experience is far below what should be expected as even some basic details such
as the center opening times and location details and address are not provided spontaneously. It would
appear that there is a certain level of passion and good levels of hospitality portrayed by center staff
and, so, there is an indication that staff is willing and able to provide high levels of service delivery. It
would, seem that there is a need to communicate the need for a more proactive and customized
approach to their tasks and roles within the organization. This highlights a need for systematic and
enterprise-wide training. The inherent inconsistencies in the results also point to this fact.
As mentioned, the results for “overall impressions” and “recommendation” and “return” were inclined
to be more positive. A deeper analysis of this revealed that the evaluators were impressed by the wealth
of resources and services available through the JobLink centers and so this is a major driver in these
positive scores. This implies that “real” customers would use and recommend the services of the centers
pg. 5
and would have relatively high levels of satisfaction with the resources available. Nevertheless, the
bigger challenge is creating that initial impression (particularly through the website and telephone) so
that customers do get beyond the initial interaction to witnessing for themselves what resources are
available to them. In other words, based on the results of this mystery shopping benchmark study, it
could be hypothesized that real customers may be less inclined to come into the centers based on the
information and experience received via telephone or website navigation.
Detailed Findings: Job-Seekers
Overall Scores: Job-Seekers
The overall evaluation score across all participating centers was at 53%. Based on Ipsos experience, this
is an average to low score for a benchmark study of this type. In-person and web evaluation scores were
at 57% and 58% respectively, and the telephone score at 43% was well below par.
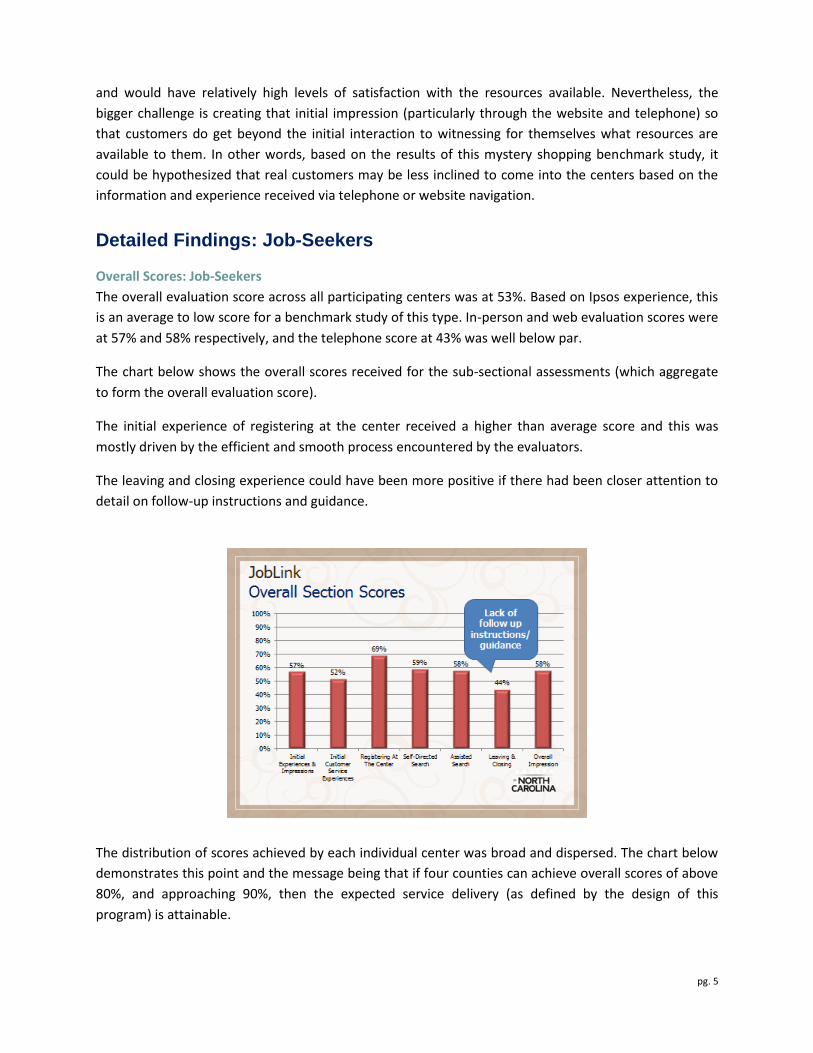
The chart below shows the overall scores received for the sub-sectional assessments (which aggregate
to form the overall evaluation score).
The initial experience of registering at the center received a higher than average score and this was
mostly driven by the efficient and smooth process encountered by the evaluators.
The leaving and closing experience could have been more positive if there had been closer attention to
detail on follow-up instructions and guidance.
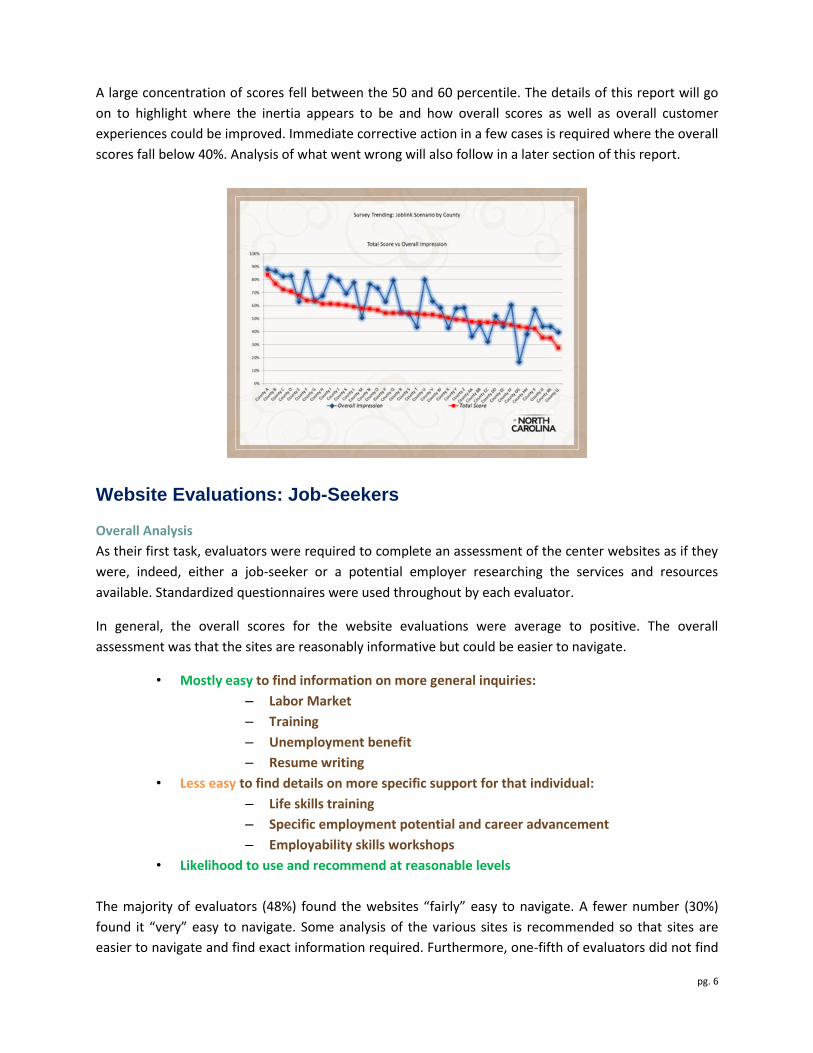
The distribution of scores achieved by each individual center was broad and dispersed. The chart below
demonstrates this point and the message being that if four counties can achieve overall scores of above
80%, and approaching 90%, then the expected service delivery (as defined by the design of this
program) is attainable.
pg. 6
A large concentration of scores fell between the 50 and 60 percentile. The details of this report will go
on to highlight where the inertia appears to be and how overall scores as well as overall customer
experiences could be improved. Immediate corrective action in a few cases is required where the overall
scores fall below 40%. Analysis of what went wrong will also follow in a later section of this report.
Website Evaluations: Job-Seekers
Overall Analysis
As their first task, evaluators were required to complete an assessment of the center websites as if they
were, indeed, either a job-seeker or a potential employer researching the services and resources
available. Standardized questionnaires were used throughout by each evaluator.
In general, the overall scores for the website evaluations were average to positive. The overall
assessment was that the sites are reasonably informative but could be easier to navigate.
• Mostly easy to find information on more general inquiries:
– Labor Market
– Training
– Unemployment benefit
– Resume writing
• Less easy to find details on more specific support for that individual:
– Life skills training
– Specific employment potential and career advancement
– Employability skills workshops
• Likelihood to use and recommend at reasonable levels
The majority of evaluators (48%) found the websites “fairly” easy to navigate. A fewer number (30%)
found it “very” easy to navigate. Some analysis of the various sites is recommended so that sites are
easier to navigate and find exact information required. Furthermore, one-fifth of evaluators did not find
pg. 7
their assigned site “very easy” to navigate and this is a relatively high number of assessments. It should
be remembered that Mystery Shopping is a prescribed research solution and, as such, our evaluators are
required to continue their research and analysis of a given website. In the case of real customers, it is
quite possible that they may “give up” their navigation of the site after a shorter period of time.
Likelihood to Use
For questions of this type, a ten point scale was employed so as to provide a sensitive reading. Forty-
nine percent of the evaluations received a 10 or a 9 score with regards to likelihood to use the center’s
services based on the initial website experience (if the evaluators were a real job-seeker). This result is
positive, although the distribution of scores for the remaining evaluations suggests, once more, an
inherent inconsistency of experience.
Likelihood to Recommend
A similar result was witnessed for the “Likelihood to Recommend” category. Fifty-two percent of the
evaluations received a 10 or 9 score. Again there was relatively high fragmentation of scores between 1
and score 7.
Telephone Evaluations: Job-Seekers
Overall Analysis
As their second task, evaluators were required to phone centers and make inquiries as to the services
available for their specific scenario as if they were, indeed, either a job-seeker or a potential employer
researching the services and resources available. Standardized questionnaires were used throughout by
each evaluator.
In general, the overall score for the telephone scenario was poor at 43%. This seems to be due to a lack
of reactiveness on the part of the staff member picking up the phone. Very little inquiry occurred. State-
wide training, communication and messaging would be a quick fix to this inherent weakness. Script
sheets could be drawn up fairly swiftly and disseminated through a cascade training approach across the
individual centers.
Getting Through
It would seem that an IVR system exists for most centers. If this is not a State-wide process and service
delivery then this would be recommended. In other words, one IVR software system would be
recommended to be used by all centers. Consistency in approach, messaging and process would be
advised.
Furthermore, in terms of the number of evaluators never getting through to a “live” person when they
called and then the ease of understanding the IVR system:
• In 61% of cases when the phone was picked up by a “live” person
– Of the 39% who were taken to an IVR 27% never got through to a live
person
– 23% of those taken to an IVR said it “was not easy to understand”
pg. 8
First Impressions and Information Provided
There was a general inconsistency in the level of detailed information provided spontaneously. In 23% of
cases, no information was offered up spontaneously at all, and this included information regarding the
center address, opening hours and so on. This would normally be considered basic information.
Evaluators were required to prompt and probe more for specific information regarding their inquiry.
Specific mentions of individual types of services were not consistent even after prompting. For example,
in 57% of cases no information was offered up as to any specific labor market information being
available to customers.
References were made to information on training programs, job-seeking skills training, life skills,
employability workshops, advice on career advancement, unemployment benefits, job referrals, resume
preparation, referrals to support services and partners outside the agency. However, there was no
consistent pattern witnessed in mentioning services. Some services, such as unemployment benefits and
labor market information, should have been mentioned 100% of the time, especially after prompting. In
other words, a training approach that makes it mandatory for core services to always be mentioned
spontaneously over the phone would be advisable.
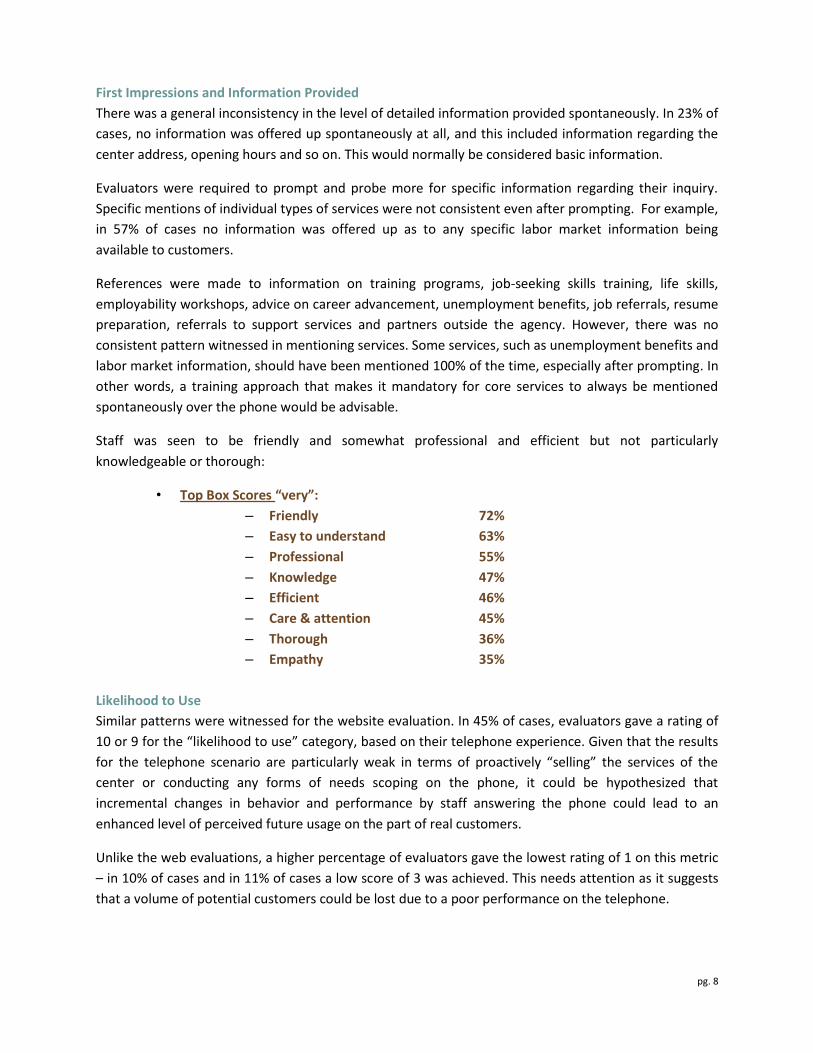
Staff was seen to be friendly and somewhat professional and efficient but not particularly
knowledgeable or thorough:
• Top Box Scores “very”:
– Friendly 72%
– Easy to understand 63%
– Professional 55%
– Knowledge 47%
– Efficient 46%
– Care & attention 45%
– Thorough 36%
– Empathy 35%
Likelihood to Use
Similar patterns were witnessed for the website evaluation. In 45% of cases, evaluators gave a rating of
10 or 9 for the “likelihood to use” category, based on their telephone experience. Given that the results
for the telephone scenario are particularly weak in terms of proactively “selling” the services of the
center or conducting any forms of needs scoping on the phone, it could be hypothesized that
incremental changes in behavior and performance by staff answering the phone could lead to an
enhanced level of perceived future usage on the part of real customers.
Unlike the web evaluations, a higher percentage of evaluators gave the lowest rating of 1 on this metric
– in 10% of cases and in 11% of cases a low score of 3 was achieved. This needs attention as it suggests
that a volume of potential customers could be lost due to a poor performance on the telephone.
pg. 9
Likelihood to Recommend
Similar patterns were witnessed in response to the question of “Likelihood to Recommend”. Forty-five
percent gave high scores of 9 or 10; however, 13% gave the lowest score of 1. This inconsistency needs
rapid attention for the reasons stated above.
In-Person Evaluations: Job-Seekers
Overall Analysis
For the job-seekers scenario, evaluators were required to visit an actual center (the same center they
had conducted the evaluation for the websites and the phone calls). Around half of the evaluations were
a “self-directed” scenario whereby the visitor conducted their own investigation of the resources
available on-line and registered on-line at the center. The remaining half of evaluations was “assisted
search” evaluations whereby visitors asked if someone could explain the resources and services
available.
Levels of efficiency and ease-of-use are positive throughout the in-person evaluation. Evaluators were
seen quickly, and they found the registration process easy and efficient.
For the most part, staff members are rated as friendly and professional; nevertheless, there is a distinct
need to encourage and enhance an approach that is one of more proactive engagement. This is true for
the greeters/receptionists and the assisted search staff members.
The self-assisted scenarios uncovered an inconsistent experience in terms of ease of finding specific
information as well as levels of establishing needs and being “informative” in the case of the assisted
search evaluation. In general, however, both experiences were seen to be relatively positive.
There is a suggestion that with the correct guidance and training as to how to create a customized
experience for customers and how to be proactive in engagement there would be significant
improvements in the service delivery. The overall “experience” is positive, simply lacking in that
“something extra” to make it an ideal experience.
This fact is further demonstrated when considering that 4 in 10 evaluators claimed that: “No, I did not
feel that my inquiry was handled adequately, I did not feel that I received enough information to take
me to the next step”.
Ease of Finding and Initial Experiences
The JobLink centers were reasonably easy to find, although road signage could be improved in a couple
of cases.
There was adequate parking and disability access overall.
The official JobLink logo and signage was found on the outside of the center building in 82% of cases.
On arrival at the center most of the evaluators were attended to immediately with just 18% having to
wait more than 2 minutes to be assisted.
pg. 10
In the majority of instances between 0 and 5 staff members were seen upon arrival. The Commission is
best able to judge if this is an adequate level of staffing; nevertheless, in busier centers, this may not be
a sufficient level of resources for a proactive and customized approach to each case.
With regards to registering at the center, 79% were able to register immediately with 67% registering on
via computer. Of these, 71% found it to be a “very” easy process.
In general, the first impressions on arriving at the center were positive. The process seems to be easy
and efficient.
The Greeter and First Impressions
In 84% of cases, it was the greeter/receptionist who assisted the evaluators when they first entered the
center.
Although the greeters/receptionists were found to be friendly and mostly professional, there is room for
a little more proactive engagement, as only 23% introduced themselves and gave their name. Only one-
third gave a written orientation sheet about the center and just 50% gave a verbal overview of the
center and its resources.
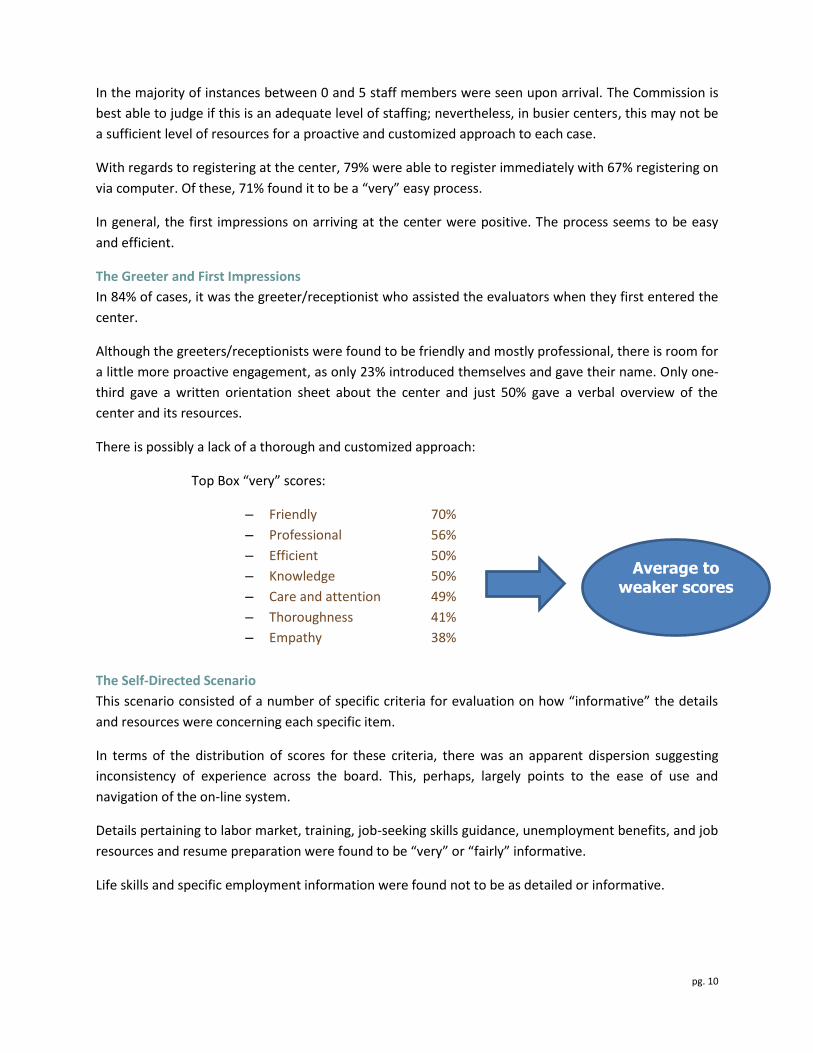
There is possibly a lack of a thorough and customized approach:
Top Box “very” scores:
– Friendly 70%
– Professional 56%
– Efficient 50%
– Knowledge 50%
– Care and attention 49%
– Thoroughness 41%
– Empathy 38%
The Self-Directed Scenario
This scenario consisted of a number of specific criteria for evaluation on how “informative” the details
and resources were concerning each specific item.
In terms of the distribution of scores for these criteria, there was an apparent dispersion suggesting
inconsistency of experience across the board. This, perhaps, largely points to the ease of use and
navigation of the on-line system.
Details pertaining to labor market, training, job-seeking skills guidance, unemployment benefits, and job
resources and resume preparation were found to be “very” or “fairly” informative.
Life skills and specific employment information were found not to be as detailed or informative.
Average to weaker scores
pg. 11
Across all the key criteria under evaluation, there were significant numbers of evaluators who found the
system not to be “at all” informative. This ranges from 14% in the case of job referrals information to
30% in the case of life skills. This again suggests a true inconsistency in experience.
There should be a way to provide more customized navigation from page to page for specific
information in the on-line system so that visitors could easily build their own suite of services according
to their needs. This could be similar to a “shopping cart” approach on commercial websites.
The Assisted Search Scenario
In the case of the assisted search scenario, evaluators were required to assess the process in terms of
how well the staff member established their individual needs against the same key criteria and then
how informative the description of services were for each criterion as described by the staff member.
The distribution of scores once again proves an inconsistent experience:
• Scores were “very” and “fairly” for job referral information and resume preparation
guidance scores were above average at 68% for both metrics
• Most metrics received average scores hovering around 50% - labor market information,
training, job-seeking skills training, employability skills workshops, unemployment
benefits, referrals to other support services and outside partners
• It seems that establishing needs for specific employment searches and life skills training
was less evident at 47% and 38% respectively
Again, across all criteria (to a greater or lesser degree) there were not insignificant numbers of
evaluators who rated “not at all well” for establishing needs. This again indicates a polarized experience
as even those criteria that were rated well by the majority were also rated poorly by a fair number of
evaluators. For example, 28% claimed that needs were not at all established for “life skills” services
while 19% said the same for “your specific employment potential and advice on career advancement”.
Even in the case of a higher scoring criterion, such as, “job referrals” 12% felt that their needs had not
been established at all well. The distribution of scores even for higher rated criteria suggests an
inconsistency in service delivery.
With regards to how informative the details and conversation was pertaining to each criteria, this
largely mirrored how effective each staff member had been at establishing needs for each
resource/service.
A process of customized needs scoping should, perhaps, be considered. This would require a closer look
into current practices, refresher training for a new approach and systematic monitoring and feedback.
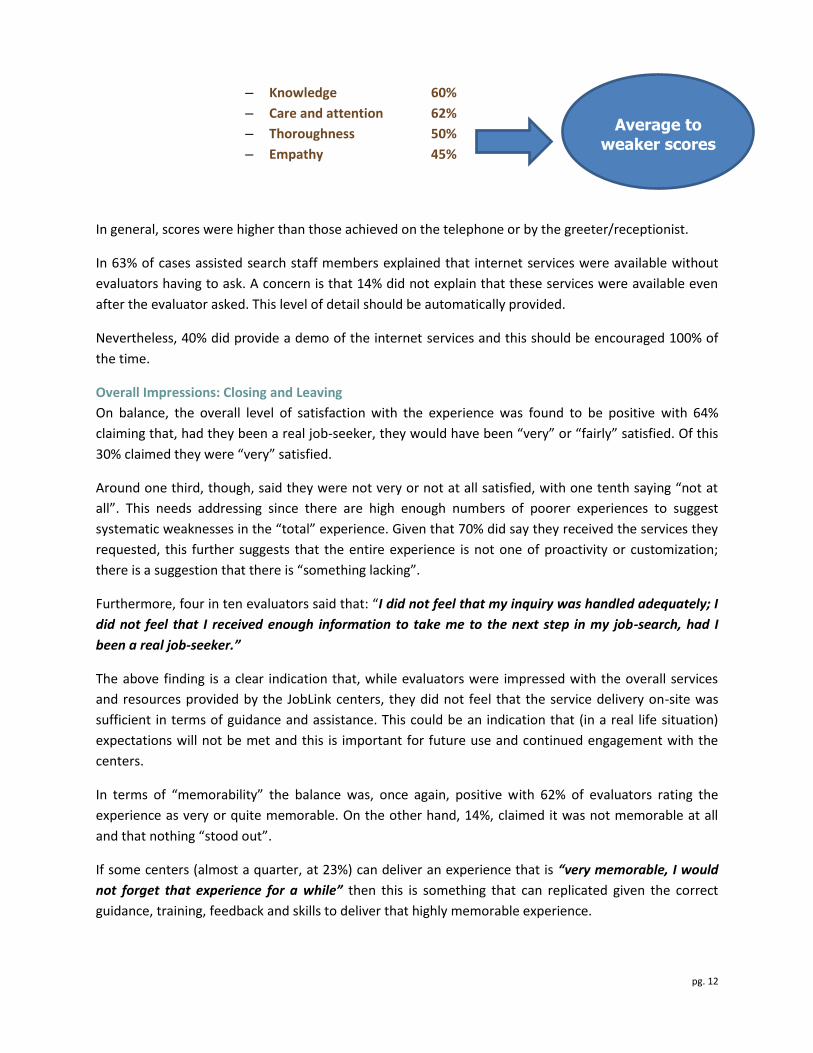
Similar to the greeters/receptionist staff, assisted search staff members were friendly and mostly
professional; but they possibly lack a customized approach:
– Friendly 82%
– Professional 73%
– Efficient 62%
pg. 12
– Knowledge 60%
– Care and attention 62%
– Thoroughness 50%
– Empathy 45%
In general, scores were higher than those achieved on the telephone or by the greeter/receptionist.
In 63% of cases assisted search staff members explained that internet services were available without
evaluators having to ask. A concern is that 14% did not explain that these services were available even
after the evaluator asked. This level of detail should be automatically provided.
Nevertheless, 40% did provide a demo of the internet services and this should be encouraged 100% of
the time.
Overall Impressions: Closing and Leaving
On balance, the overall level of satisfaction with the experience was found to be positive with 64%
claiming that, had they been a real job-seeker, they would have been “very” or “fairly” satisfied. Of this
30% claimed they were “very” satisfied.
Around one third, though, said they were not very or not at all satisfied, with one tenth saying “not at
all”. This needs addressing since there are high enough numbers of poorer experiences to suggest
systematic weaknesses in the “total” experience. Given that 70% did say they received the services they
requested, this further suggests that the entire experience is not one of proactivity or customization;
there is a suggestion that there is “something lacking”.
Furthermore, four in ten evaluators said that: “I did not feel that my inquiry was handled adequately; I
did not feel that I received enough information to take me to the next step in my job-search, had I
been a real job-seeker.”
The above finding is a clear indication that, while evaluators were impressed with the overall services
and resources provided by the JobLink centers, they did not feel that the service delivery on-site was
sufficient in terms of guidance and assistance. This could be an indication that (in a real life situation)
expectations will not be met and this is important for future use and continued engagement with the
centers.
In terms of “memorability” the balance was, once again, positive with 62% of evaluators rating the
experience as very or quite memorable. On the other hand, 14%, claimed it was not memorable at all
and that nothing “stood out”.
If some centers (almost a quarter, at 23%) can deliver an experience that is “very memorable, I would
not forget that experience for a while” then this is something that can replicated given the correct
guidance, training, feedback and skills to deliver that highly memorable experience.
Average to
weaker scores
pg. 13
Likelihood to Use
Similar to the web and telephone assessments, the “Likelihood to Use” again in the future (if the
evaluator was a real job-seeker) responses were generally positive with 47% giving a rating of 10 or 9.
Once more, a percentage of evaluators gave a rating of 1 (7%), although at levels slightly lower than for
web and telephone assessments. The distribution of scores across the ten point scale suggests, again, a
random and inconsistent experience.
Likelihood to Recommend
As perhaps expected, similar results were encountered for the “Likelihood to Recommend” category.
Forty-seven percent gave a rating of 10 or 9, while 9% gave the lowest rating of 1.
While results are on the positive, there is still some relative distribution of scores across the ten point
scale which suggests, again, there is inconsistency in the experience delivered. Concentrating on the
weaker points of service delivery highlighted in this report would improve and impact the real levels of
further usage and recommendation by existing and future customers of the JobLink centers.
Detailed Findings: Employers
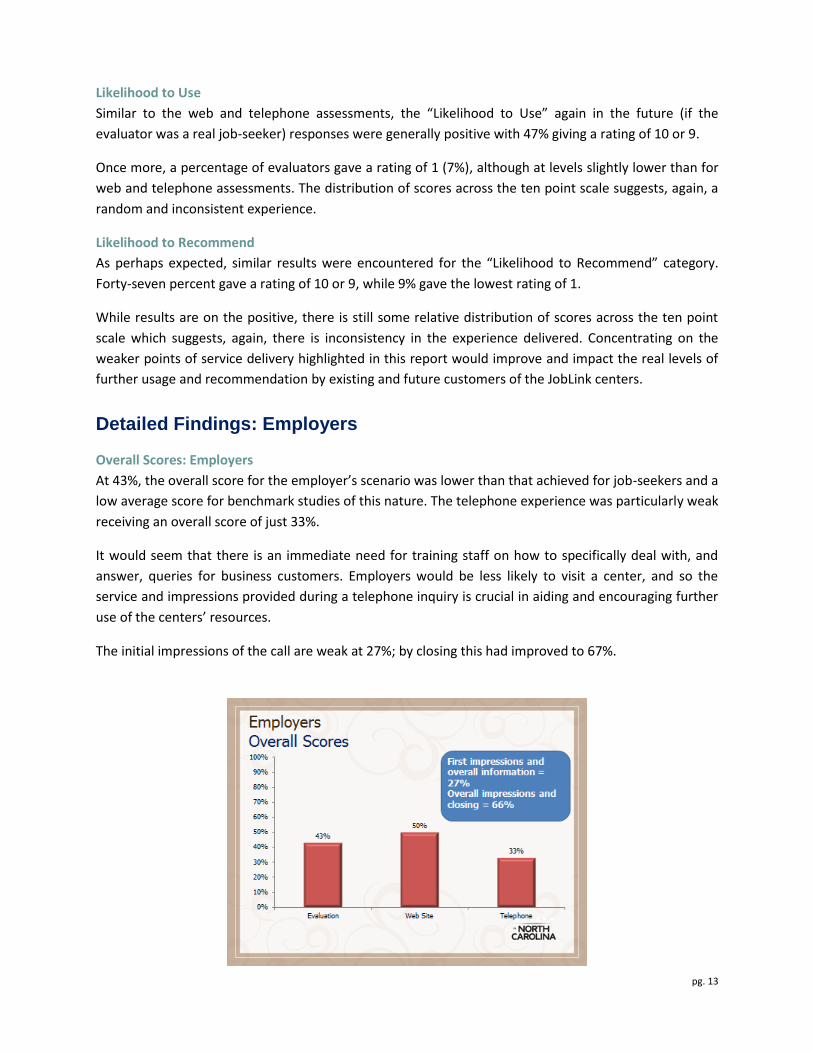
Overall Scores: Employers
At 43%, the overall score for the employer’s scenario was lower than that achieved for job-seekers and a
low average score for benchmark studies of this nature. The telephone experience was particularly weak
receiving an overall score of just 33%.
It would seem that there is an immediate need for training staff on how to specifically deal with, and
answer, queries for business customers. Employers would be less likely to visit a center, and so the
service and impressions provided during a telephone inquiry is crucial in aiding and encouraging further
use of the centers’ resources.
The initial impressions of the call are weak at 27%; by closing this had improved to 67%.
pg. 14
Website Evaluations: Employers
Overall Analysis
As their first task, evaluators were required to complete an assessment of the center websites as if they
were, indeed, either a job-seeker or a potential employer researching the services and resources
available. Standardized questionnaires were used throughout by each evaluator.
Overall, the websites were found to be “very/fairly” easy to navigate at 67%. Those rating the website as
“very” easy to navigate were 29%. There is, perhaps, a need to do some work on ease of navigation so
that it is “very” rather than “fairly easy”. It should be noted once more that the evaluators engaged in
this program were required to spend time navigating and searching for information. In a real-life
situation a potential business customer may only navigate for a couple of minutes and, if the site is not
found to be terribly intuitive or user-friendly, then they may leave.
In terms of being “informative”, 35% found it to be “very” and 45% “fairly” informative.
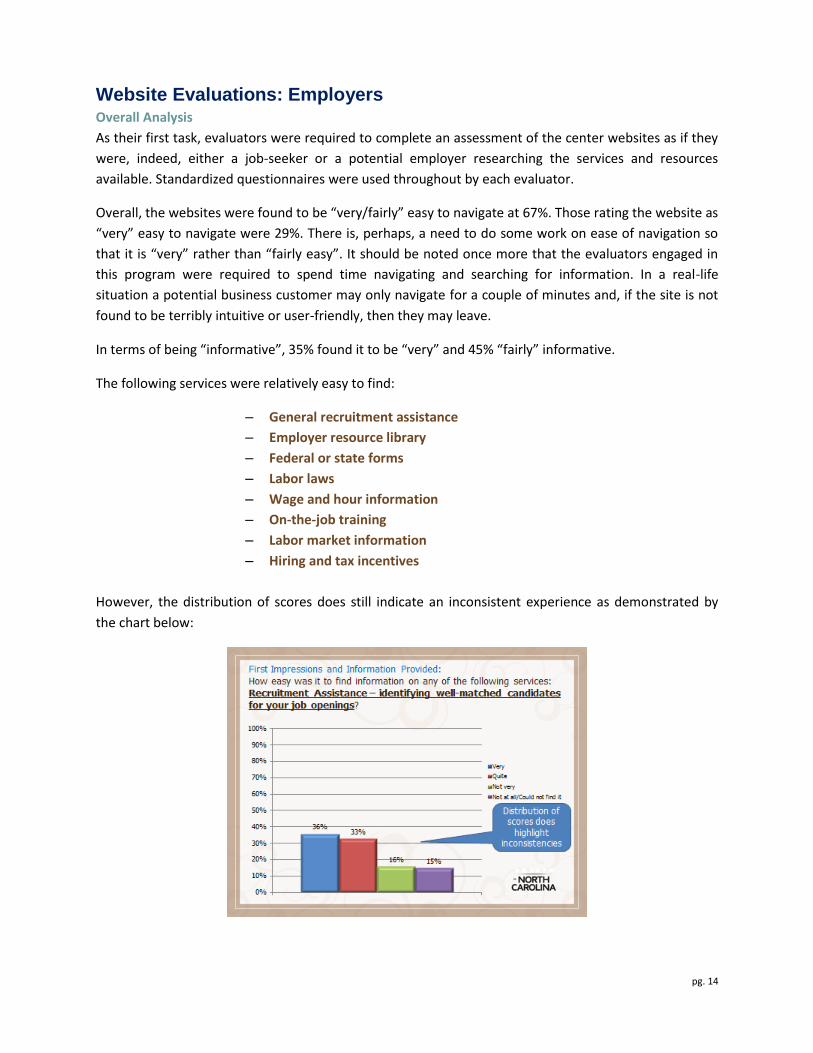
The following services were relatively easy to find:
– General recruitment assistance
– Employer resource library
– Federal or state forms
– Labor laws
– Wage and hour information
– On-the-job training
– Labor market information
– Hiring and tax incentives
However, the distribution of scores does still indicate an inconsistent experience as demonstrated by
the chart below:
pg. 15
The following services were not particularly easy to find:
– Federal bonding
– Job orders
– Retention strategies
– Incumbent worker services
– Customized training
– Recruitment services
In this scenario, evaluators were required to send an email to the centers as one of their evaluation
tasks. Thirty-five percent did not receive a reply to their email within 4 days. This needs immediate
attention.
Likelihood to Use and Recommend
Ratings given for “Likelihood to Use” were not as favorable as had been witnessed in the case of the job-
seeker scenarios. A rating of 25% was given for the top rating of 10 and 19% for the 9 rating. In the case
of job-seekers the scores achieved were 35% and 14% respectively.
In the case of “Likelihood to Recommend”, 26% gave a rating of 10 and 16% gave a rating of 9;
compared to 38% and 14% respectively in the case of job-seekers evaluating the websites.
This suggests that the sites are not seen as a valuable resource for employers to the same extent as job-
seekers.
Telephone Evaluations: Employers
Overall Analysis
As their second task, evaluators were required to phone centers and make inquiries as to the services
available for their specific scenario as if they were potential employers researching the services and
resources available. Standardized questionnaires were used throughout by each evaluator.
The telephone experience was particularly weak as far as the employer scenarios were concerned.
Basic details about how the center operates and the resources available were not forthcoming, and very
generic responses were given as far as the services available were concerned.
Getting Through
In 66% of cases the phone was picked up by a “live” person. Of the 34% who were taken to an IVR, 7%
never got through to a “live” person. Of those taken through to the IVR, 12% said it was “not easy to
understand”.
Of those taken through to an IVR and finally assisted by a “live” person, 25% had to wait between 31
and 45 seconds.
pg. 16
As with the job-seekers scenario, attention to a consistent State-wide approach would be
recommended. If it is not possible for a “live” individual to always answer the phone, particularly in
busier centers, then a voice-mail and call back service should be provided.
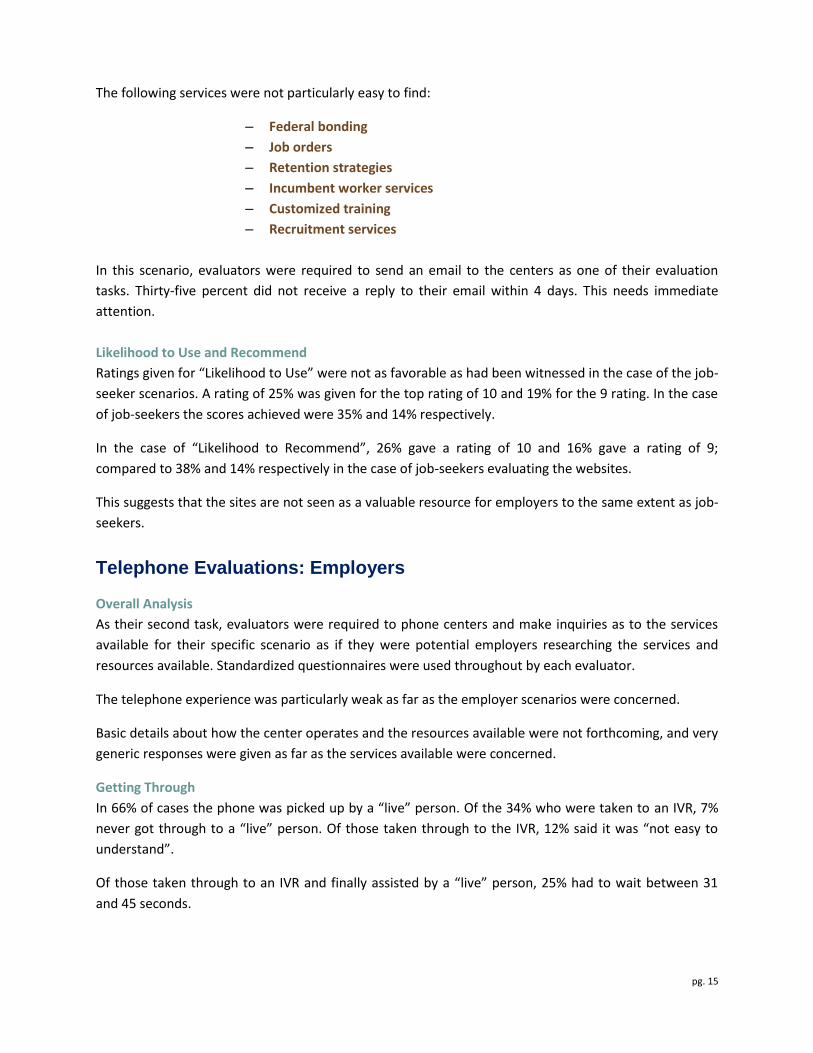
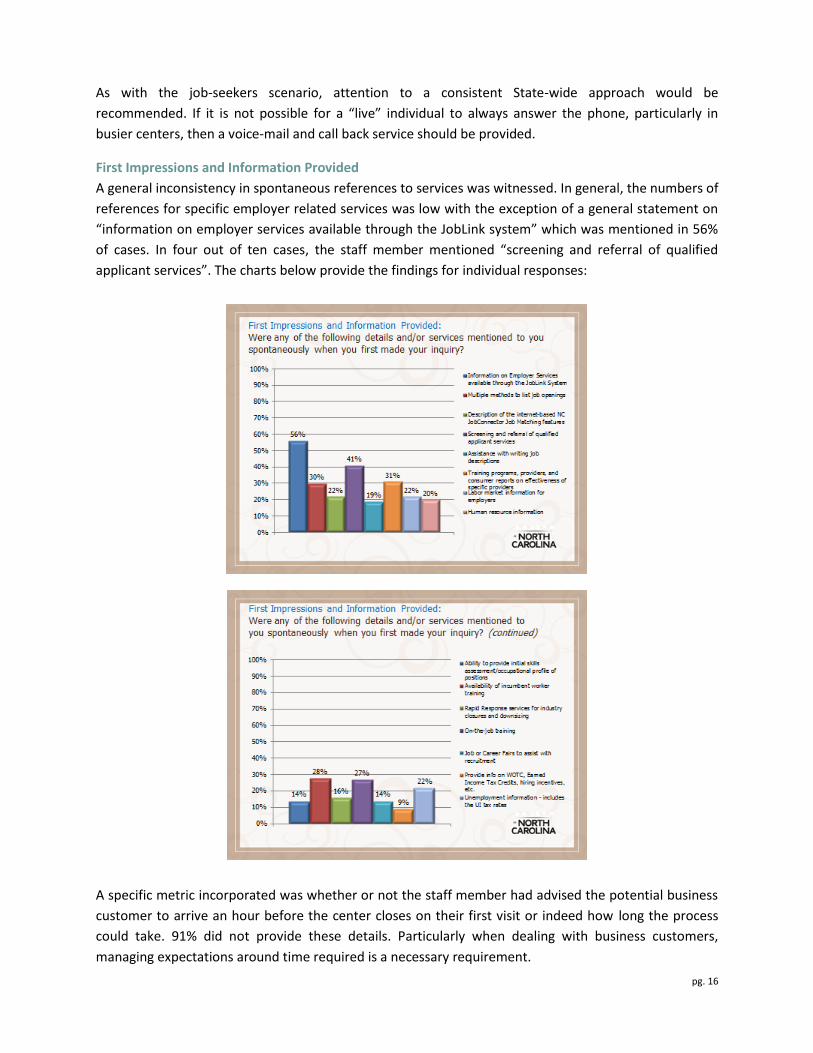
First Impressions and Information Provided
A general inconsistency in spontaneous references to services was witnessed. In general, the numbers of
references for specific employer related services was low with the exception of a general statement on
“information on employer services available through the JobLink system” which was mentioned in 56%
of cases. In four out of ten cases, the staff member mentioned “screening and referral of qualified
applicant services”. The charts below provide the findings for individual responses:
A specific metric incorporated was whether or not the staff member had advised the potential business
customer to arrive an hour before the center closes on their first visit or indeed how long the process
could take. 91% did not provide these details. Particularly when dealing with business customers,
managing expectations around time required is a necessary requirement.
pg. 17
Staff was also rated as being friendly and somewhat professional and efficient, but not particularly
knowledgeable or thorough:
• Top Box Scores “very”:
– Easy to understand 60%
– Friendly 61%
– Professional 55%
– Care and attention 46%
– Efficient 42%
– Knowledge 35%
– Thorough 33%
Likelihood to Use and Recommend
Reasonable levels of usage and recommendation (if the evaluator were an actual business customer)
were achieved with 43% giving a rating of either 10 or 9 for both usage and recommendation.
There was a higher level of lowest score (rating 1) given, though, in the case of the employer telephone
scenario as 16% gave a low, 1, rating.
Conclusions and Future Action-Planning Recommendations The current strong points in service delivery are:
• Friendly/personable staff
• Plentiful resources
• Informative – includes website
Weaker points have been determined as follows:
• Not tailored or customized
• Inconsistent experiences
• Lack of proactivity
• Need for closure and follow-through
It would appear that there is a level of surprise and delight witnessed at the level and scope of resources
available at the JobLink centers (also witnessed by the in-depth interviews conducted with two
evaluators working on the program). There is a need to leverage this and create more awareness of the
resources available through a more active engagement with potential customers from the out-set.
Quick Wins
The following provides a list of some the possible “quick win” solutions and initiatives that could be
deployed fairly swiftly with a focused approach:
• Provide blinded and aggregated overview of results of benchmark study to all center
managers and discuss positive and negative points
pg. 18
• Correct issues with getting through on phone – adopt a State-wide approach and/or
system and process
• Staff “quick” training on need for more informative dialogue on phone – particularly for
employers
• Staff “quick” training on requirement for more “needs scoping” during assisted
assessment sessions; thus providing a more focused and customized approach
• Insist on customer feedback cards being provided each time
• Insist on a “leaving and closing” procedure with guidelines for a follow-up for as many
new customers as possible
• Provide guidance on how to treat employer customers differently and with a more
customized business-to-business approach
In the longer term, an overhaul of training (for new staff) procedures should be examined. The skills and
“passion” for the organization are evident in both the ratings for friendliness and professionalism and
also in the verbatim comments provided by evaluators. If almost perfect scores can be achieved by some
centers then, equipped with the right skills, all centers should be able to deliver the same, consistent
level of “ideal” customer experiences.
Some examples of longer term initiatives could include:
• Systematic and comprehensive training on the need for a more customized/proactive
service
• Specific, deeper training on how to service employer clients
• Distance learning training modules on-line for new staff and as refresher courses
• Website – create a more customizable navigation of services available – but not so as to
overwhelm visitors
• Create “initial orientation and information” packs for job-seekers and employers with
DVDs and brochures that they can take home with them – provide something tangible
over and above the website resources
Suggestions for Future Systematic Feedback Mechanisms
Performance improvement and behavior change is only really manageable through a systematic
approach to continuous insight generation through market research and investigation of external and
internal data. There is a need for constant feedback, through various forms of research and internal
analysis, to play an integral role in coaching and repetition of the right behaviors for the organization.
Real improvement is only achieved through constant training and deliberate practice and this is realized
with the help of continuous research and insight.
pg. 19
Ipsos would recommend the following:
• Creation of a systematic suite of metrics that will provide holistic strategic and granular
feedback:
– Intensive qualitative benchmark research (through focus groups and one-
on-one in-depth interviews with both customers and staff members) and
workshops based on the findings of the research: this will uncover
motivators and barriers to new initiatives and the way forward
– Make direct customer feedback more systematic (and mandatory) and
bring on-line rather than pen and paper data collection
– Mystery Shopping – adopted as a regular, systematic tool:
• Telephone program as stage one
• On-site quarterly/semi-annual program across all centers
(targeted design)
– Internal audits – ongoing and systematic
Data from various sources should be integrated so as to provide a holistic view. There could be a
possibility to create a “Service Delivery Index” through integration of various data sources. This could be
an index based on the data available and scores achieved for various external research inputs for each
center individually and an overall average across the State. Creating an index based on various data
sources would enable trending and an overall monitoring of performance improvement.
Performance results and detailed feedback should be provided to all centers through a transparent
effort. Coaching and feedback sessions based on insights and performance ratings should be undertaken
bi-annually at a minimum. Centers should be held accountable for their action-planning initiatives with
regular feedback provided to the Commission.
Training information and tools could also be provided on-line to all current and new center staff through
creation of a distance-learning portal with live examples, peer-to-peer anecdotal examples, a knowledge
library, best practice video uploads and so on.
Additional Analysis: Results by Tier and Minority Evaluator The JobLink Centers were sampled so as to be proportionally representative of the State-wide network
of centers across North Carolina, and as such, three tiers were created for analysis of results. A small
sample of Hispanic and Persons with Disabilities shops was also conducted.
Job-seekers – Profile:
• Tier 1 (counties with population over 250,000) = 33 completed shops
• Tier 2 (counties with population over 75,000 and up to 250,000) = 43 completed shops
• Tier 3 (counties with population 75,000 or less) = 48 completed shops
• Shops conducted by Hispanic shoppers = 8 completed shops
• Shops conducted by persons with disabilities = 7 completed shops
pg. 20
Employers Profile:
• Tier 1 (counties with population over 250,000) = 30 completed shops
• Tier 2 (counties with population over 75,000 and up to 250,000) = 42 completed shops
• Tier 3 (counties with population 75,000 or less) = 44 completed shops
With regards to the job-seeker scenario, tier three (the tier in more rural areas and with, potentially,
higher traffic flow, as unemployment figures were also overlaid to derive the sampling frame) received a
higher overall score for performance. The assumption would be that these are the smaller centers in
more rural/semi-urban areas and, perhaps, the overall traffic volume is lower:
• Overall Average = 53%
– Tier One = 49%
– Tier Two = 54%
– Tier Three = 56%
The insight with respect to Hispanic evaluators and those with disabilities is indicative only as these
were qualitative mystery shops (much smaller base size); nevertheless, the Hispanic overall result is
significantly weaker than the average score across all centers. This needs a deeper inspection and
corrective action.
• Overall Average = 53%
– Persons with Disabilities = 58%
– Hispanic = 33%
Additional Analysis: What Does Good Look Like? In further analyzing the results from the top 5 performing centers, it became evident that an experience
approaching “ideal” is one where the staff member is more proactive and takes time to consider the
customer’s needs. There is also a suggestion that there is a proactive attempt to “close” the
conversation as customers leave and remind them of what to do next. There is also an element of
empathy evident in the approach and engagement in a couple of instances. The following are actual
comments from the evaluators:
“I was able to navigate through the website with no problem.”
“I found it very interesting that the service linked you to other services in the county,
Social Service, Community colleges, services for the blind and several more.”
“The associate told me that she understood my situation and would be glad to help me.
She then told me that she would show me how to look for other jobs in the area.”
“She greeted me and took the time to listen to my concerns without interrupting me.”
“She said that they could help the person 're-invent' themselves.”
“He was willing to sit on the phone with me for as long as I needed him to, as long as all
my answers were taken care of.”
“She took the time to help me. She took the time to determine what I needed.”
“The associate took the time to go over the information with me.”
pg. 21
“After speaking with the employee and on my way out he reminded me to call back and
speak with the person that can send me to the local community college for courses that
would help me in my job search.”
“She also thanked me for coming by and told me to call with any questions I may have.”
“When I was ready to leave the staff member that assisted me with the search walked
me to the front where she gave me an ESC Claimant Information brochure, forms for
unemployment and the weekly form to complete.”
“The person I spoke with led me out and told me to have a good day.”
“They were engaged in the process. They genuinely were concerned with me finding
employment.”
“She was so professional and treated everyone with respect and dignity.”
Executive Evaluations Two job-seeker in-person and 6 job-seeker telephone evaluations were conducted towards the end of
the fieldwork period. These evaluations reconfirmed the finding that experiences are not consistent
from center to center. There is an overwhelming wealth of resources and information available to
customers, but this does not always seem apparent when making inquiry phone calls into the centers.
Furthermore, the level of guidance and support given by staff in the centers during an in-person visit
also varies.
In terms of the telephone inquiries some staff answering the phone gave full details of what is available
at the center, opening times, how to find the center and even details on how much time they should
expect to be at the center for a full and useful first visit. In other cases potential customers phoning in
were simply advised to come in and see what is available. In some instances opening hours and
directions to the center were not even offered up spontaneously.

“Preparing North Carolina’s Workforce and Businesses
for the Global Economy”
Equal Opportunity Employer.
Program Auxiliary aids and services available upon request to individuals with disabilities.
North Carolina Commission on Workforce Development
313 Chapanoke Road, Suite 120
4316 Mail Service Center
Raleigh, NC 27699-4316
Tel.: 919-329-5230 Fax: 919-329-5585
Email: [email protected]
www.nccommerce.com/workforce