Myc stimulates B lymphocyte differentiation and amplifi es ...
15
THE JOURNAL OF CELL BIOLOGY JCB: ARTICLE © The Rockefeller University Press $30.00 The Journal of Cell Biology, Vol. 179, No. 4, November 19, 2007 717–731 http://www.jcb.org/cgi/doi/10.1083/jcb.200704173 JCB 717 Introduction Members of the Myc family of nuclear protooncogenes are known to stimulate cell division and transformation. However, the roles of Myc in cell differentiation have been difficult to as- sess, in part because of the early embryonic lethality of N-myc– (Charron et al., 1992) and c-myc (Davis et al., 1993)–null mice and the difficulties in experimentally distinguishing proliferation from differentiation using in vitro approaches. In this study, we used B cell–specific deletion or overexpression of c- and/or N-myc to explore the roles of Myc in B lymphocyte development and lymphoma formation. B cell development in the bone marrow (BM) and fetal liver are marked by a series of cell fate decisions, which are controlled by checkpoints that ensure that all mature B lymphocytes are capable of producing functional antibodies (for review see Hendriks and Middendorp, 2004). Pluripotent hematopoietic progenitors initially become committed to the B lineage in response to growth factors and stromal cell inter- actions. The least mature committed B cell progenitors, called pro–B cells, have their Ig heavy chain (HC) and light chain (LC) genes in germline (GL) configuration. The Ig HC genes rearrange before the Ig LCs, and with successful in-frame D H -J H and then V H -D H -J H juxtaposition, the Ig HCμ appears at the cell surface along with the signal-transducing proteins Igα and Igβ and the surrogate LC λ5 and Vpre-B1 and 2 as a complex called the pre– B cell receptor (BCR; termed large pre–B cells). The pre-BCR then signals large pre–B cells to proliferate, mature to the small pre–B cell stage, extinguish rearrangement of the other allele of the Ig HC (a process called allelic exclusion), and initiate Ig LC transcription and rearrangement (Vκ and Vλ). Successful in-frame Ig V L -J L rearrangement allows the Ig HC and LC pro- teins to pair and form IgM molecules on the surface of immature B cells, at which point they migrate from the BM to the peri- phery, where development continues. Formation of the pre-BCR represents a critical checkpoint for ensuring that maturing B cells have in-frame V H -D H -J H gene rearrangements. Signaling is induced by pre-BCR aggregation in lipid rafts, resulting in activation of the Src family protein Myc stimulates B lymphocyte differentiation and amplifies calcium signaling Tania Habib, 1 Heon Park, 1 Mark Tsang, 1 Ignacio Moreno de Alborán, 2 Andrea Nicks, 1 Leslie Wilson, 1 Paul S. Knoepfler, 4 Sarah Andrews, 3 David J. Rawlings, 3 Robert N. Eisenman, 4 and Brian M. Iritani 1,4 1 Department of Comparative Medicine, University of Washington, Seattle, WA 98195 2 Department of Immunology and Oncology, Centro Nacional de Biotecnología, Universidad Autonoma de Madrid, Cantoblanco, Madrid 28049, Spain 3 Immunology Clinic, Children’s Hospital and Regional Medical Center, Seattle, WA 98104 4 Division of Basic Sciences, Fred Hutchinson Cancer Research Center, Seattle, WA 98109 D eregulated expression of the Myc family of tran- scription factors (c-, N-, and L-myc) contributes to the development of many cancers by a mechanism believed to involve the stimulation of cell proliferation and inhibition of differentiation. However, using B cell–specific c-/N-myc double-knockout mice and Eμ-myc trans- genic mice bred onto genetic backgrounds (recombinase- activating gene 2 −/− and Btk −/− Tec −/− ) whereby B cell development is arrested, we show that Myc is necessary to stimulate both proliferation and differentiation in primary B cells. Moreover, Myc expression results in sustained increases in intracellular Ca 2+ ([Ca 2+ ] i ), which is required for Myc to stimulate B cell proliferation and differentiation. The increase in [Ca 2+ ] i correlates with constitutive nuclear factor of activated T cells (NFAT) nuclear translocation, reduced Ca 2+ efflux, and decreased expression of the plasma membrane Ca 2+ –adenosine triphosphatase (PMCA) efflux pump. Our findings demonstrate a revised model whereby Myc promotes both proliferation and differentia- tion, in part by a remarkable mechanism whereby Myc amplifies Ca 2+ signals, thereby enabling the concurrent expression of Myc- and Ca 2+ -regulated target genes. Correspondence to Brian M. Iritani: [email protected] Abbreviations used in this paper: BCR, B cell receptor; BM, bone marrow; CFA, complete Freund’s adjuvant; CFSE, 5-carboxyfluorescein diacetate succinimidyl ester; ChIP, chromatin immunoprecipitation; Cn, calcineurin; CsA, cyclosporine A; GL, germline; HC, heavy chain; HSA, heat-stable antigen; IRES, internal ribo- somal entry site; KLH, keyhole limpet hemocyanin; LC, light chain; MSCV, mu- rine stem cell virus; MZ, marginal zone; NFAT, nuclear factor of activated T cells; NF-κB, nuclear factor κB; PE, phycoerythrin; PI3K, phosphatidylinositol 3-kinase; PMCA, plasma membrane Ca 2+ -ATPase; PTK, protein tyrosine kinase; qPCR, quantitative PCR; RAG2, recombinase-activating gene 2; SERCA, sarcoplasmic ER Ca 2+ ATPase; Tg, transgene; Wt, wild type. The online version of this article contains supplemental material. Downloaded from http://rupress.org/jcb/article-pdf/179/4/717/1334152/jcb_200704173.pdf by guest on 01 December 2021
Transcript of Myc stimulates B lymphocyte differentiation and amplifi es ...
TH
EJ
OU
RN
AL
OF
CE
LL
BIO
LO
GY
JCB: ARTICLE
© The Rockefeller University Press $30.00The Journal of Cell Biology, Vol. 179, No. 4, November 19, 2007 717–731http://www.jcb.org/cgi/doi/10.1083/jcb.200704173
JCB 717
IntroductionMembers of the Myc family of nuclear protooncogenes are
known to stimulate cell division and transformation. However,
the roles of Myc in cell differentiation have been diffi cult to as-
sess, in part because of the early embryonic lethality of N-myc–
(Charron et al., 1992) and c-myc (Davis et al., 1993)–null mice
and the diffi culties in experimentally distinguishing proliferation
from differentiation using in vitro approaches. In this study, we
used B cell–specifi c deletion or overexpression of c- and/or
N-myc to explore the roles of Myc in B lymphocyte development
and lymphoma formation. B cell development in the bone marrow
(BM) and fetal liver are marked by a series of cell fate decisions,
which are controlled by checkpoints that ensure that all mature
B lymphocytes are capable of producing functional antibodies
(for review see Hendriks and Middendorp, 2004). Pluripotent
hematopoietic progenitors initially become committed to the
B lineage in response to growth factors and stromal cell inter-
actions. The least mature committed B cell progenitors, called
pro–B cells, have their Ig heavy chain (HC) and light chain (LC)
genes in germline (GL) confi guration. The Ig HC genes rearrange
before the Ig LCs, and with successful in-frame DH-JH and then
VH-DH-JH juxtaposition, the Ig HCμ appears at the cell surface
along with the signal-transducing proteins Igα and Igβ and the
surrogate LC λ5 and Vpre-B1 and 2 as a complex called the pre–
B cell receptor (BCR; termed large pre–B cells). The pre-BCR
then signals large pre–B cells to proliferate, mature to the small
pre–B cell stage, extinguish rearrangement of the other allele
of the Ig HC (a process called allelic exclusion), and initiate
Ig LC transcription and rearrangement (Vκ and Vλ). Successful
in-frame Ig VL-JL rearrangement allows the Ig HC and LC pro-
teins to pair and form IgM molecules on the surface of immature
B cells, at which point they migrate from the BM to the peri-
phery, where development continues.
Formation of the pre-BCR represents a critical checkpoint
for ensuring that maturing B cells have in-frame VH-DH-JH gene
rearrangements. Signaling is induced by pre-BCR aggregation
in lipid rafts, resulting in activation of the Src family protein
Myc stimulates B lymphocyte differentiation and amplifi es calcium signaling
Tania Habib,1 Heon Park,1 Mark Tsang,1 Ignacio Moreno de Alborán,2 Andrea Nicks,1 Leslie Wilson,1
Paul S. Knoepfl er,4 Sarah Andrews,3 David J. Rawlings,3 Robert N. Eisenman,4 and Brian M. Iritani1,4
1Department of Comparative Medicine, University of Washington, Seattle, WA 981952Department of Immunology and Oncology, Centro Nacional de Biotecnología, Universidad Autonoma de Madrid, Cantoblanco, Madrid 28049, Spain3Immunology Clinic, Children’s Hospital and Regional Medical Center, Seattle, WA 981044Division of Basic Sciences, Fred Hutchinson Cancer Research Center, Seattle, WA 98109
Deregulated expression of the Myc family of tran-
scription factors (c-, N-, and L-myc) contributes to
the development of many cancers by a mechanism
believed to involve the stimulation of cell proliferation and
inhibition of differentiation. However, using B cell–specifi c
c-/N-myc double-knockout mice and Eμ-myc trans-
genic mice bred onto genetic backgrounds (recombinase-
activating gene 2−/− and Btk−/− Tec−/−) whereby B cell
development is arrested, we show that Myc is necessary to
stimulate both proliferation and differentiation in primary
B cells. Moreover, Myc expression results in sustained
increases in intracellular Ca2+ ([Ca2+]i), which is required
for Myc to stimulate B cell proliferation and differentiation.
The increase in [Ca2+]i correlates with constitutive nuclear
factor of activated T cells (NFAT) nuclear translocation,
reduced Ca2+ effl ux, and decreased expression of the
plasma membrane Ca2+–adenosine triphosphatase (PMCA)
effl ux pump. Our fi ndings demonstrate a revised model
whereby Myc promotes both proliferation and differentia-
tion, in part by a remarkable mechanism whereby Myc
amplifi es Ca2+ signals, thereby enabling the concurrent
expression of Myc- and Ca2+-regulated target genes.
Correspondence to Brian M. Iritani: [email protected]
Abbreviations used in this paper: BCR, B cell receptor; BM, bone marrow; CFA, complete Freund’s adjuvant; CFSE, 5-carboxyfl uorescein diacetate succinimidyl ester; ChIP, chromatin immunoprecipitation; Cn, calcineurin; CsA, cyclosporine A; GL, germline; HC, heavy chain; HSA, heat-stable antigen; IRES, internal ribo-somal entry site; KLH, keyhole limpet hemocyanin; LC, light chain; MSCV, mu-rine stem cell virus; MZ, marginal zone; NFAT, nuclear factor of activated T cells; NF-κB, nuclear factor κB; PE, phycoerythrin; PI3K, phosphatidylinositol 3-kinase; PMCA, plasma membrane Ca2+-ATPase; PTK, protein tyrosine kinase; qPCR, quantitative PCR; RAG2, recombinase-activating gene 2; SERCA, sarcoplasmic ER Ca2+ ATPase; Tg, transgene; Wt, wild type.
The online version of this article contains supplemental material.
Dow
nloaded from http://rupress.org/jcb/article-pdf/179/4/717/1334152/jcb_200704173.pdf by guest on 01 D
ecember 2021
JCB • VOLUME 179 • NUMBER 4 • 2007 718
tyrosine kinases (PTKs) Blk, Lyn, and Fyn, which then phos-
phorylate tyrosine residues within Igα and Igβ. This results in
recruitment and activation of the Syk PTK (and to a lesser ex-
tent ZAP70) and the adaptor SLP-65 (also known as BASH or
BLNK). Phosphorylation of SLP-65 by Syk further activates
multiple signaling pathways, including the Ras–Raf and phos-
phatidylinositol 3-kinase (PI3K) pathways, as well as the Tec
family PTKs Btk and Tec, which, together with Syk, activate
PLCγ, resulting in Ca2+ mobilization (see Fig. 8; for review
see Hendriks and Middendorp, 2004). Altogether, these events
result in expression and/or activation of a set of transcrip-
tion factors including extracellular regulated kinase, nuclear
factor of activated T cells (NFAT), nuclear factor κB (NF-κB),
and Myc.
Targeted deletion studies in mice have revealed essential
roles for the majority of the described surface and cytoplas-
mic molecules in the development of pre–B cells (for review
see Hendriks and Middendorp, 2004). However, the roles
of nuclear factors such as Myc in B cell development remain
unclear, in part because of genetic redundancy by related tran-
scription family members or lethality after tissue-wide dele-
tion. The Myc family of basic helix-loop-helix transcription
factors bind DNA sequences called E boxes (CACGTG) as a
heterodimer with the related basic helix-loop-helix factor Max
(for review see Eisenman, 2001). This results in initiation of
transcription, although transcriptional repression by Myc has
been noted, probably through inhibition of the Miz-1 transcrip-
tion factor (Li et al., 1994; Staller et al., 2001). Of the three
mammalian myc family members, only c- and N-myc are ex-
pressed in B lymphocytes. c-myc is initially expressed during
the pro–B cell stage in response to cytokines, including IL-7
(Morrow et al., 1992; Dillon and Schlissel, 2002). After pre-
BCR expression in large pre–B cells, both c- and N-myc are
expressed during the maturation and expansion to small pre–B
cells (Zimmerman and Alt, 1990). Thereafter, only c-myc is ex-
pressed in immature and mature B cells after B cell activation.
In this study, we took a unique genetic approach in mice to
show that Myc stimulates B cell differentiation and expansion
downstream of the pre-BCR and Tec PTKs. Moreover, we un-
cover a novel feature of Myc in amplifying [Ca2+]i as a mecha-
nism to concurrently stimulate the expression of both Myc and
Ca2+-regulated genes, which are essential for both cell division
and differentiation.
ResultsMice defi cient in Myc have impaired pre–B cell developmentTo examine the roles of Myc in early B cell development and
to overcome potential functional redundancy between c- and
N-myc, we generated mice defi cient in both N- and c-myc
genes selectively in B cells using the Cre-loxP system (Sauer,
2002). c-mycfl /fl mice (de Alboran et al., 2001) were bred to
N-mycfl/fl mice (Knoepfl er et al., 2002), which also carried
the CD19cre transgene (Tg), to generate N-mycfl/fl c-mycfl/fl
CD19cre+ mice. The CD19 promoter drives expression of the Cre
recombinase only in B lineage cells throughout their development
(Rickert et al., 1997). Semi-quantitative PCR (qPCR) analysis
of sorted B220+CD43+ and B220+CD43− B cell progenitors in
the BM revealed �75/90% deletion of c-myc and �70/95% dele-
tion of N-myc genes, res pectively, in the presence of CD19cre
(Fig. S1 A, available at http://www.jcb.org/cgi/content/full/
jcb.200704173/DC1).
Total BM cells were isolated from mice defi cient in
c- and/or N-myc selectively in B cells, and B cell development
was analyzed using fl ow cytometry (see Fig. 3 A; Hardy and
Hayakawa, 2001). Decreasing c-myc expression alone (c-mycfl /fl
CD19cre+) impairs the generation of B220+CD43− pre–B cells,
whereas decreasing N-myc expression alone (N-mycfl /fl CD19cre+)
does not consistently have any effect (unpublished data). How-
ever, depletion of total myc expression in N-mycfl/fl c-mycfl/fl
CD19cre+ mice results in maximal decreases in the percentage
(Fig. 1 A) and number (Fig. 1 B) of B220+CD43−, B220+IAb+
pre–B cells, immature B cells (B220loIgM+), and mature B cells
(B220hiIgM+) relative to CD19cre− mice. These results suggest
that Myc is required for pro–B to pre–B cell maturation.
In mice, pre–B cells proliferate in response to cytokines
such as IL-7 produced by BM stromal cells (Fleming and
Paige, 2002). Because IL-7 signaling is known to stimulate the
expression of c-myc, we examined the ability of B cell pro-
genitors to divide in response to IL-7. Total BM cells from
N-mycfl /fl c-mycfl /fl CD19cre+ or CD19cre− mice were labeled
with 5-carboxyfl uorescein diacetate succinimidyl ester (CFSE)
and cultured in the presence or absence of IL-7 for 36 h, and
the cell division profi le of B cell progenitors was examined.
As shown in Fig. 1 C, the majority of B cell progenitors from
either N-mycfl /fl c-mycfl /fl CD19cre− or CD19cre+ mice do not
divide in the absence of IL-7. However, in response to IL-7,
pre–B cells from CD19cre− mice undergo an average of four
divisions, whereas cells from CD19cre+ mice either do not di-
vide at all or undergo several divisions, likely as a result of the
loss of cells that contain the deleted c-myc alleles (Fig. S1 B;
de Alboran et al., 2001).
To determine whether the reduction in myc levels affects
the development of peripheral B cells, we purifi ed splenocytes
from N-mycfl /fl c-mycfl /fl CD19cre+ and CD19cre− mice and charac-
terized B cell subsets by fl ow cytometry. Splenic B cells are
subdivided into additional stages of maturation and function,
including transitional 1 and 2 (T1 and T2), follicular mature,
and marginal zone (MZ; Hardy and Hayakawa, 2001). As shown
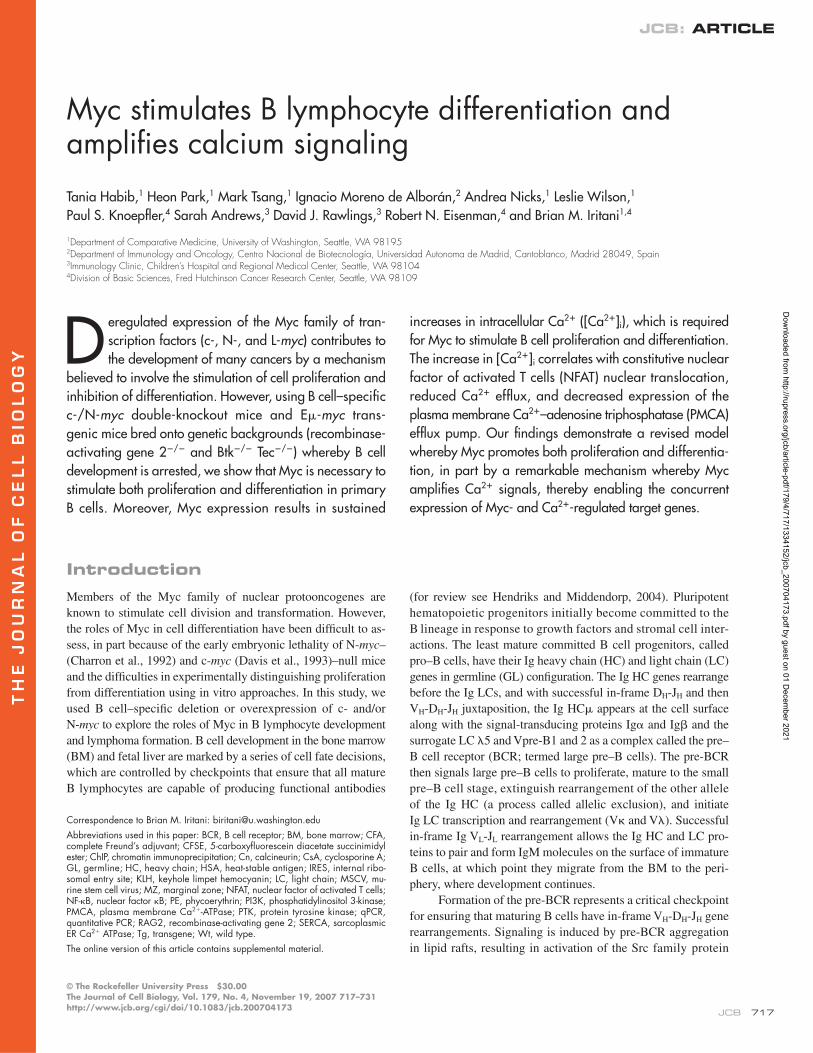
in Fig. 2 A, CD19cre+ mice exhibit a signifi cant reduction in the
number of all B cell subsets. This correlates with reduced serum
IgM, IgG2a, and IgG1 in CD19cre+ compared with CD19cre−
mice after immunization with keyhole limpet hemocyanin (KLH;
Fig. 2 C). These results suggest that Myc regulates fi nal B cell
numbers in part by regulating pre–B cell development and,
potentially, peripheral B cell differentiation.
Peripheral B cells can be further classifi ed as B2 conven-
tional B cells, which reside in lymphoid tissues such as the
spleen, and as B1 B cells, which represent the majority of B cells
found in peritoneal and pleural cavities and are IgMhi, CD5+/−,
and CD23−. As shown in Fig. 2 B, deletion of c- and N-myc
together results in a decrease in both CD5loIgMhi peritoneal B1
B cells and CD5−IgMhi B2 B cells. These results suggest that
Dow
nloaded from http://rupress.org/jcb/article-pdf/179/4/717/1334152/jcb_200704173.pdf by guest on 01 D
ecember 2021

MYC MODULATES CALCIUM AND B CELL DEVELOPMENT • HABIB ET AL. 719
Myc is essential for the development of both B2 and B1 B cells
and for establishing fi nal B cell numbers.
E𝛍-myc Tg stimulates the maturation and expansion of RAG2-null pro–B cellsIt is unclear from the gene-targeting strategy whether the effects
of Myc are exclusively in modulating the expansion of a popu-
lation of cells that have already differentiated to the pre–B cell
stage or whether Myc may also stimulate the differentiation of
pre-BCR+ cells. To address this question, we took a classical
genetic approach to determine whether Myc could rescue B cell
differentiation in the absence of upstream signaling molecules
known to be required for both myc expression and pre–B cell
differentiation. In pre–B cells, myc genes are expressed, in part,
by a pathway involving pre-BCR formation; the activation of
Tec kinases, PLCγ, and PKC; and NF-κB translocation to the
myc promoter (see Fig. 8; Grumont et al., 2002). First, we deter-
mined whether Myc could rescue B cell differentiation in the
absence of pre-BCR formation by breeding Eμ-myc transgenic
mice (Harris et al., 1988), which express c-myc exclusively in
B lineage cells throughout development, to mice defi cient in
recombinase-activating gene 2 (RAG2; Shinkai et al., 1992), a
gene required for the initiation of V(D)J recombination. RAG2−/−
mice lack pre-BCR expression, resulting in a complete block
in B cell development at the B220+CD43+CD25− pro–B cell
stage (Fig. 3 A, Hardy fraction C). We fi nd that c-myc Tg is
suffi cient to stimulate the differentiation of RAG2-defi cient
pro–B cells based on the acquisition of pre–B cell character-
istics, including the down-regulation of CD43 and the up-
regulation of CD25, IAb, CD22, and heat-stable antigen (HSA;
Fig. 3, A–C). This translates to a rescue in the relative number
of pre–B-like cells to a level equivalent to that of wild-type
(Wt) mice based on an increase in the number and ratio of
B220+CD43− cells to B220+CD43+ cells in BM from Eμ-myc/
RAG2−/− as compared with RAG2−/− mice (unpublished data).
c-Myc also stimulates GL transcription of the Igκ LC in puri-
fi ed B cell progenitors from Eμ-myc/RAG2−/− as compared
with RAG2−/− mice (Fig. 3, A and D). Myc does not appear
to induce allelic exclusion of the Ig HC (Fig. S2 C, available
at http://www.jcb.org/cgi/content/full/jcb.200704173/DC1), sug-
gesting that Myc Tg is not suffi cient to mediate all of the signals
from the pre-BCR.
Figure 1. Deletion of c-and N-myc in B lineage cells results in impaired pre–B cell development. (A) Deletion of c-and N-myc in B lineage cells leads to a reduction in the pre–B, immature B, and mature B cell compartments in the BM. Flow cytometric analysis of BM cells stained with αB220, αCD43, αIgM, and αIAb. Numbers indicate the percentage of cells in each region. (B) Total BM cells were stained with αB220, αCD43, and αIgM and analyzed by fl ow cytometry. Relative numbers of each population were determined as described in Materials and methods. Bars represent the mean ± SEM (error bars) ob-tained from three CD19cre− and four CD19cre+ animals. *, P < 0.005. (C) Deletion of c-and N-myc results in impaired pre–B cell proliferation. BM cells from mice of the indicated genotypes were labeled with CFSE and cultured in the absence (left) or presence (right) of IL-7 for 36 h. Cultures were stained with αB220 and αCD43 and analyzed by fl ow cytometry. Panels represent the number of B220+CD43− cell divisions after MODFIT analysis of CFSE histo-grams. Bars represent the percentage of total cells in each generation relative to parental (Pt) cells. Results are representative of four separate experiments.
Dow
nloaded from http://rupress.org/jcb/article-pdf/179/4/717/1334152/jcb_200704173.pdf by guest on 01 D
ecember 2021
JCB • VOLUME 179 • NUMBER 4 • 2007 720
To further examine the proliferative capacity of Eμ-myc/
RAG2−/− versus RAG2−/− B cell progenitors, we labeled BM
cells with BrdU, which is incorporated into DNA during cell
division, and with CFSE. The percentage of B220+BrdU+ cells
is higher in Eμ-myc/RAG2−/− compared with RAG2−/− mice
(Fig. S2 A), and B cells from Eμ-myc/RAG2−/− mice undergo
considerably more cell divisions than B cells from RAG2−/−
mice in response to IL-7 stimulation (Fig. 3 E). In contrast,
we do not see any difference in the number of apoptotic B220+
cells between Eμ-myc/RAG2−/− compared with RAG2−/− mice
based on the acquisition of the apoptotic marker annexin V
(Fig. S2 B).
E𝛍-myc Tg rescues B cell maturation in mice defi cient in Btk and Tec kinasesTo further characterize the upstream signaling pathway involved
in Myc-dependent differentiation, we determined whether Myc
could rescue B cell differentiation in the absence of the Tec
family PTKs, which mediate proliferation and differentiation
downstream of the pre-BCR and BCR (see Fig. 8). We bred
Eμ-myc mice to mice doubly defi cient in expression of the Tec
family PTKs Btk and Tec (Ellmeier et al., 2000). In humans,
loss of function mutations in the btk gene lead to X-linked
agammaglobulinemia, an immunological disease whereby Ca2+
signaling is impaired (Fluckiger et al., 1998; for review see
Rawlings, 1999) and the generation of pre–B cells is blocked.
In mice, pre–B cell development is only partially inhibited in
btk-defi cient mice and proceeds normally in tec-defi cient mice
but is essentially completely inhibited in btk/tec double-null
mice. Thus, we asked whether Myc could rescue B cell develop-
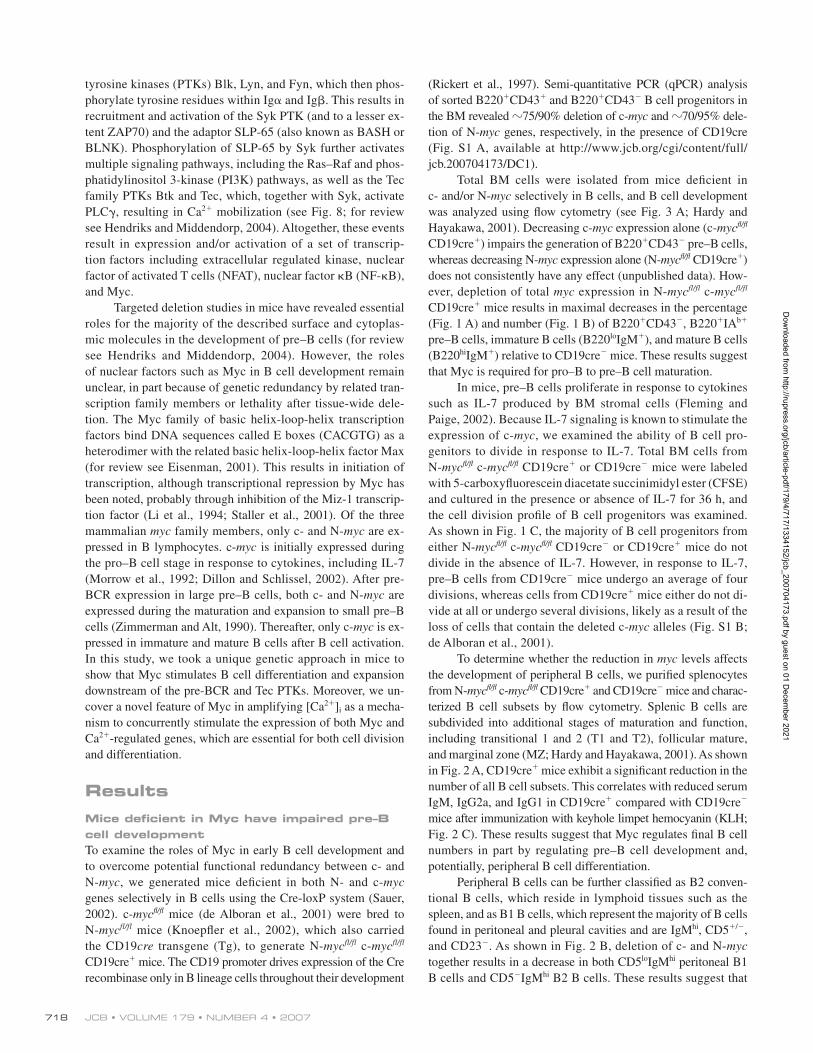
ment when Tec family signaling is ablated. As shown in Fig. 4 A,
btk−/−tec−/− mice are defi cient in their ability to generate pre–B
cells based on a reduction in B220+CD43− B cell progenitors
compared with Wt mice. However, when c-myc is expressed in
btk−/−tec−/− B cell progenitors, both the percentage (Fig. 4 A)
and total number (not depicted) of B220+CD43−, B220+CD22+,
and B220+IAb+ pre–B cells and B220+IgM+ immature B cells
are completely rescued. These results provide additional genetic
evidence that Myc stimulates B cell development downstream
of the pre-BCR and Tec family PTKs.
Figure 2. Deletion of c- and N-myc results in impaired B1 and B2 B cell development. (A) Splenic B cells from mice of the indicated genotypes (10–11 wk) were stained with antibodies to B220, IgM, and IgD. Relative numbers of total B cells (B220+IgM+), follicular mature (IgMloIgDhi), T2 (IgMhiIgDhi), and T1/MZ (IgMhiIgDlo) B cells were determined as described in Materials and methods. Bars represent the mean ± SEM (error bars) obtained from six CD19cre− and four CD19cre+ mice. (B) Impaired B1 cell development in c-/N-myc–defi cient mice. Peritoneal cells were stained with antibodies to B220, IgM, and CD5 and analyzed by fl ow cytometry. Numbers in dot plots indicate the percentage of CD5+IgM−, CD5loIgMhi (B1 B), and CD5−IgMhi (B2 B) populations. Data are representative of three separate experiments. (C) Decreased antibody production in myc-defi cient mice. Mice were immunized with KLH-CFA, and the KLH-specifi c serum antibody concentrations were determined by ELISA. Bars represent the mean ± SEM of four Wt and seven CD19cre+ c-mycfl /fl N-mycfl /fl mice. Serum dilutions are shown. dKO, double knockout.
Dow
nloaded from http://rupress.org/jcb/article-pdf/179/4/717/1334152/jcb_200704173.pdf by guest on 01 D
ecember 2021

MYC MODULATES CALCIUM AND B CELL DEVELOPMENT • HABIB ET AL. 721
Loss of Btk and Tec increases the tumor frequency in E𝛍-myc transgenic miceBecause Tec kinases have been reported to both induce and
suppress tumor formation (Hendriks and Kersseboom, 2005),
we investigated how the transformation capacity of Eμ-myc Tg
is altered by the loss of Btk and Tec. We find that the hetero-
zygosity of btk and tec is suffi cient to increase the tumor fre-
quency in Eμ-myc mice, with the 50% tumor incidence being
reduced from 100 d for Eμ-myc mice to 60 d for Eμ-myc/btk−/+
tec−/+ (Fig. 4 B). The percent tumor-free incidence was de-
creased further as additional alleles of btk or tec were deleted.
These results suggest that deregulated c-myc synergizes with
the loss of Tec signaling during B cell lymphoma formation.
Interestingly, �75% of the tumors that develop in Eμ-myc/btk−/−tec−/+ or Eμ-myc/btk−/−tec−/− mice express surface IgM
(unpublished data), indicating that they have an immature
B cell phenotype relative to the majority of tumors derived from
Eμ-myc Tg mice, of which >80% are IgM− pre–B cell tumors
(Harris et al., 1988).
c-Myc–expressing B cells exhibit elevated Ca2+ levels and NFAT nuclear translocationCa2+ signaling is induced by the pre-BCR and is modulated
by Btk (for review see Rawlings, 1999), and, in T lymphocytes
(Aifantis et al., 2001) as well as in many other cell types, is
required for the induction of differentiation. Because Myc
rescues B cell differentiation in the absence of the pre-BCR and
Btk, we investigated whether Myc can bypass requirements for
normal Ca2+ signaling or whether Myc amplifi es Ca2+ signaling
in the absence of the pre-BCR or Btk. In B cells, the sustained
Ca2+ fl ux after BCR cross-linking is thought to be caused by
the concurrent activation of PI3K, which leads to the produc-
tion of membrane-associated PI-3,4,5-P3 and to the recruitment
and phosphorylation of Btk. Btk activation results in full and
Figure 3. c-Myc stimulates B cell development, proliferation, and GL Ig𝛋 transcription in RAG2-null mice. (A) A model of B cell development based on the expression of B220, CD43, HSA, CD22, CD25, IAb, and Igκ (modifi ed from Hardy and Hayakawa, 2001). (B) c-Myc stimulates pre–B cell–like differentia-tion in RAG2-null mice. BM cells were stained with αB220, αCD43, αCD22, αCD25, and αIAb. Representative fl ow dot plots (of 10 experiments) corresponding to mice of the indicated genotypes are shown. (C) BM cells from RAG2−/− or Eμ-myc/RAG2−/− mice were stained for the expression of B220, CD43, and HSA. Representative histogram overlays of HSA expression on gated B220+ cells (top), B220+CD43+ cells (middle), or B220+CD43− cells (bottom) are shown. (D) Real-time qPCR analysis of c-myc and Igκ GL message from FACS-sorted B220+ Eμ-myc/RAG2−/− and RAG2−/− B cell progenitors. The fold expression ratio (MycRAG2−/−/RAG2−/−) of c-myc and Igκ GL mRNA is shown. Bars represent the mean ratio ± SEM (error bars). (E) Eμ-myc/RAG2−/− B220+ B cell progenitors exhibit increased proliferative capacity compared with RAG2−/− B cells as assessed by CFSE dilution after 72-h culture in IL-7 as described in Fig. 1 C. Results are representative of three separate experiments.
Dow
nloaded from http://rupress.org/jcb/article-pdf/179/4/717/1334152/jcb_200704173.pdf by guest on 01 D
ecember 2021
JCB • VOLUME 179 • NUMBER 4 • 2007 722
sustained PLCγ activation, peak IP3 production, and maximal
release of [Ca2+]i (see Fig. 8; for reviews see Rawlings, 1999;
Hendriks and Middendorp, 2004).
To investigate whether Ca2+ signaling is affected during
Myc-dependent differentiation, we labeled total BM cells from
Eμ-myc Tg and Wt mice as well as Eμ-myc/RAG2−/− and
RAG2−/− mice with the Ca2+-binding dye indo-1 (June and
Rabinovitch, 1990) and fl uorescent-conjugated antibodies against
B cell markers and measured the ability of B cell progenitors to
fl ux Ca2+ after stimulation with the Ca2+ ionophore ionomycin
or anti-IgM. Surprisingly, we fi nd that B cell progenitors from
both Eμ-myc Tg and Eμ-myc/RAG2−/− mice exhibit elevated
basal [Ca2+]i and prolonged duration of Ca2+ fl ux compared
with Wt and RAG2−/− mice, respectively (Fig. 5 A and not
depicted). Remarkably, Eμ-myc Tg also rescues peak and sus-
tained [Ca2+]i in B cells (before and after anti-μ stimulation) in
the absence of Btk and Tec kinases (Eμ-myc Tg/btk−/−/tec−/−),
which are the major mediators of sustained Ca2+ signaling
downstream of the pre-BCR (Fig. 5 B). These results suggest
that Myc amplifi es [Ca2+]i signaling in B cells downstream of
the pre-BCR and Tec kinases.
We next determined whether the elevated Ca2+ fl ux we
observe in Myc-expressing B cells results in changes in known
nuclear mediators of Ca2+ signaling. In normal T and B cells,
Figure 4. Increased B cell maturation and tumor frequency in E𝛍-myc mice defi cient in btk/tec kinases. (A) Eμ-myc Tg rescues B cell maturation in btk−/−tec−/− mice. BM cells isolated from mice of the indicated genotypes (4–6 wk) were analyzed by fl ow cytometry for the expression of developmentally regulated surface markers. Cells falling in the live lymphocyte gate are shown. (B) Absence of Btk/Tec kinases accelerates tumor formation in Eμ-myc transgenic mice. Kaplan-Meier tumor-free estimates for mice of the indicated genotypes. Tumor-free survival in Eμ-myc btk−/−/tec+/− and Eμ-myc btk−/−/tec−/− mice was signifi cantly reduced as compared with Eμ-myc mice.
Dow
nloaded from http://rupress.org/jcb/article-pdf/179/4/717/1334152/jcb_200704173.pdf by guest on 01 D
ecember 2021

MYC MODULATES CALCIUM AND B CELL DEVELOPMENT • HABIB ET AL. 723
Ca2+ infl ux activates the phosphatase calcineurin (Cn), which
dephosphorylates the NFAT family of transcription factors
(NFATc1–4), allowing them to translocate from the cytoplasm to
the nucleus and activate transcription of target genes (for reviews
see Crabtree, 2001; Im and Rao, 2004). We examined the trans-
location of NFAT in purifi ed splenic B cells from Eμ-myc Tg
and normal Wt littermates both before and after BCR cross- linking.
Purifi ed B cells from Wt littermates require 15 min of anti-IgM
stimulation to achieve the maximal translocation of NFATc1
(Fig. 5 C and Fig. S5 C, available at http://www.jcb.org/cgi/ content/
full/jcb.200704173/DC1) and NFATc2 (Figs. 5 D and S5 D)
to the nucleus. In contrast, B cells from Eμ-myc Tg mice have
the majority of both NFATc1 and c2 in the nucleus, even before
stimulation with anti-IgM. These effects are not the result of
Figure 5. E𝛍-myc B cells exhibit elevated Ca2+ fl ux and enhanced NFATc nuclear translocation. (A) BM cells from Wt, RAG2−/−, or Eμ-myc/RAG2−/− mice were loaded with indo-1 dye and stained with αB220. Flow kinetics profi les are shown comparing the mean indo-1 ratio (violet/blue) of B220+ (top) and B220− (bottom) cells as a function of time before and after stimulation with ionomycin. (B) Eμ-myc Tg rescues Ca2+ fl ux in Btk/Tec-null B cell progenitors. BM cells from mice of the indicated genotypes were loaded with indo-1 and stained with αB220 and αCD43. Kinetics profi les comparing the indo-1 fl uorescence ratio of B220+ cells as a function of time before and after stimulation with anti-μ are shown. (C–F) B cells from Eμ-myc, Eμ-myc/RAG2−/−, and Eμ-myc/btk−/−tec+/− mice exhibit enhanced nuclear localization of NFATc. Cytoplasmic and nuclear extracts were prepared from splenic B cells stimulated with anti-μ for the indicated times (C, D, and F) or unstimulated purifi ed B cell progenitors (E) and were size fractionated by SDS-PAGE. Western blot analysis was performed with αNFATc1 (C, E, and F) or αNFATc2 (D) or with loading controls β-actin (C–F), α-lamin (C–E), or α-Max (F). Adjacent panels depicted in D or E are from the same gel. White lines indicate that intervening lanes have been spliced out. R−/−, RAG2−/−; M/R−/−, Eμ-myc/RAG2−/−. NFAT isoforms are indicated by brackets or arrowheads.
Dow
nloaded from http://rupress.org/jcb/article-pdf/179/4/717/1334152/jcb_200704173.pdf by guest on 01 D
ecember 2021

JCB • VOLUME 179 • NUMBER 4 • 2007 724
increased NFAT expression in Eμ-myc B cells, as NFATc mRNA
(Fig. S4 A) and protein levels (Fig. S5, A and B) are reduced or
unchanged relative to Wt B cells. Myc expression also results
in substantially increased nuclear NFATc1 translocation in un-
stimulated B cell progenitors from Eμ-myc/RAG2−/− compared
with RAG2−/− mice (Figs. 5 E and S5 E) and rescues NFAT
translocation in splenic B cells from Eμ-myc/btk−/−tec−/+ as
compared with btk−/−tec−/+ mice (Figs. 5 F and S5 F). Trans-
fection of Myc-null fi broblasts (HO.15 cells) with c-Myc (Shiio
et al., 2002) results in greatly enhanced NFAT activity based on
increased activation of an NFAT-luciferase reporter construct
(Fig. S3 E), demonstrating that Myc also increases NFAT activity.
These results suggest that the sustained increase in [Ca2+]i sig-
naling in Myc-expressing B cells has a major infl uence on key
Ca2+-regulated nuclear events.
To assess whether the elevated Ca2+ fl ux in Myc-expressing
B cell progenitors may contribute to the abilities of Myc to
stimulate maturation and proliferation, we fi rst determined how
[Ca2+]i levels in these mice correlate with differentiation, prolif-
eration, and survival status. We fi nd that Ca2+ levels positively
correlate with maturation and proliferation in Eμ-myc/RAG2−/−
mice based on the down-regulation of CD43 on B220+ cells and
dilution of CFSE. B cell progenitors with the most mature
phenotype (B220+CD43−) and highest proliferative capacity
have the highest levels of Ca2+ fl ux, whereas the cells with the
least mature phenotype (B220+CD43hi–mid) and lowest prolifer-
ative capacity have the lowest levels of Ca2+ fl ux (Fig. S3, A–C).
The observed increase in [Ca2+]i is not the result of differ-
ences in cell cycle status because gated G0/G1 cells from
Eμ-myc Tg have consistently elevated [Ca2+]i relative to G0/G1
cells from normal littermates (Fig. S3 D). These results suggest
that there is a correlation between amplifi ed Ca2+ signaling
and the ability of Myc-expressing B cells to undergo differenti-
ation and division.
We next examined whether normal Ca2+ signaling is re-
quired for maturation and division of Wt and Myc Tg pre–B
cells. First, we determined whether impairing endogenous Myc
expression results in impaired Ca2+ fl ux. Total BM cells from
N-mycfl /fl c-mycfl /fl CD19cre− or CD19cre+ mice were stimulated
in vitro with anti-μ for 2 h to induce myc expression followed
by ionomycin stimulation to induce Ca2+ fl ux. As shown in
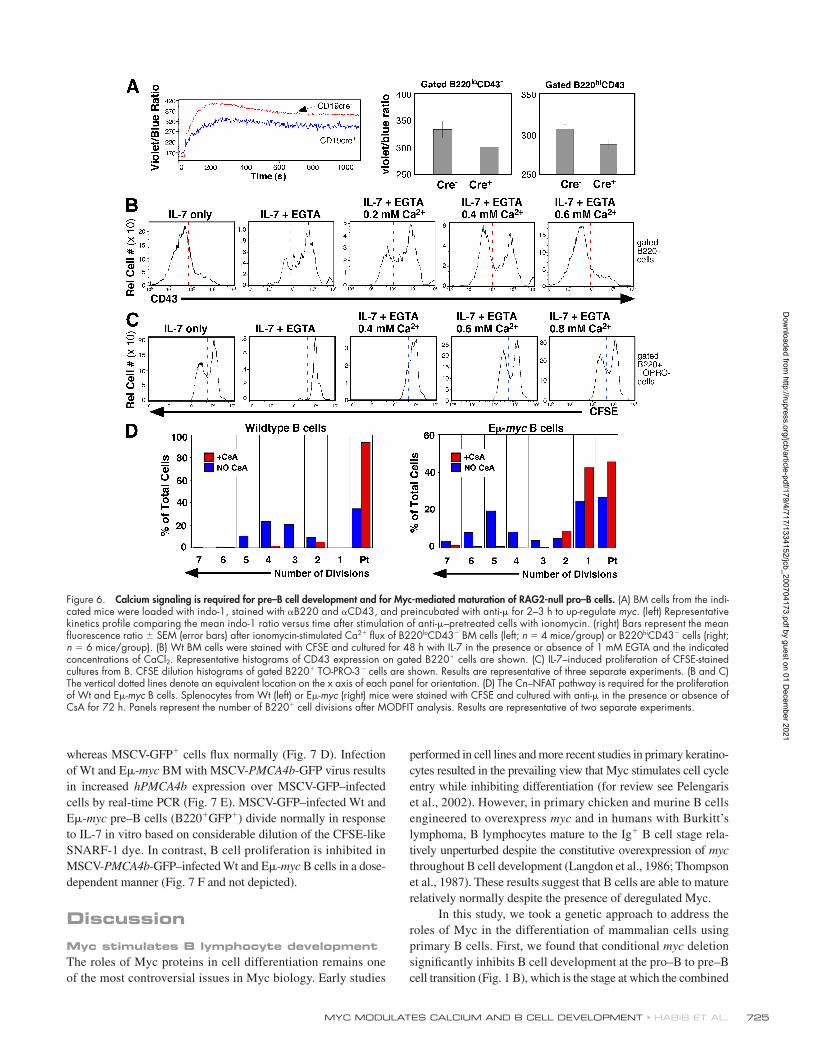
Fig. 6 A, both pre–B/immature B and mature B cell populations
from N-mycfl /fl c-mycfl /fl CD19cre+ mice exhibit reduced peak
and sustained Ca2+ levels relative to CD19cre− mice. To deter-
mine whether a reduction of Ca2+ levels affects the ability of both
Wt and Eμ-myc cells to proliferate and mature, we cultured
total BM cells from Wt and Myc Tg mice in EGTA to limit the
amount of available extracellular Ca2+ and assessed maturation
and proliferative capacity after the addition of increasing doses
of extracellular Ca2+. As shown in Fig. S4 (B and C), chelation
of Ca2+ with EGTA results in the impairment in Ca2+ fl ux and
proliferative capacity after ionomycin stimulation. EGTA also
blocks the ability of Wt B cell progenitors to mature from the
B220+CD43+ stage to the B220+CD43− stage (Fig. 6 B, fi rst
and second panels), which is rescued by the addition of extra-
cellular Ca2+ (Fig. 6 B, third to fi fth panels). B cell progenitors
were unable to divide in low Ca2+ conditions based on limited
CFSE dilution of live (TO-PRO-3) cells (Fig. 6 C, fi rst and second
panels), which is also rescued by the addition of extracellular
Ca2+ (Fig. 6 C, third to fi fth panels). Progenitors from Eμ-myc/
RAG2−/− mice were also unable to mature (Fig. S4 D) or divide
effi ciently (not depicted) under low Ca2+ conditions.
As Eμ-myc B cells exhibit increased NFAT nuclear trans-
location, we also determined whether the Cn–NFAT pathway is
required for the division of Wt and Eμ-myc B cells. Purifi ed B
cells from Wt and Eμ-myc mice were stimulated with anti-μ for
72 h in the presence or absence of cyclosporine A (CsA), a specifi c
inhibitor of Cn. As shown in Fig. 6 D, Wt B cells undergo an aver-
age of four divisions (Fig. 6 D, left), and Eμ-myc B cells undergo
an average of fi ve divisions (Fig. 6 D, right) in response to anti-μ,
whereas cell division is completely inhibited by CsA. Collec-
tively, these results suggest that normal Ca2+ signaling is required
for pre-BCR–mediated pre–B cell proliferation and maturation
and for Myc to stimulate the differentiation of B cell progenitors.
Myc regulates Ca2+ effl uxThe increase in [Ca2+]i that occurs in response to stimuli such as
BCR ligation is transient, in part because Ca2+ is resequestered
into the endoplasmic reticulum by the sarcoplasmic ER Ca2+
ATPase (SERCA) or is extruded from the cell by plasma mem-
brane Ca2+-ATPase (PMCA) pumps. Because Myc amplifi es
[Ca2+]i in B cells in the absence of Btk and Tec (which regulate
infl ux), we hypothesized that Myc could be altering the extent
of Ca2+ effl ux. First, we measured the relative expression of
PMCA1, PMCA4, and SERCA3, the respective pumps expressed
in B lineage cells (Chen et al., 2004). Although we did not fi nd
consistent differences in the expression of PMCA1 and serca3
in mature B cells from Eμ-myc mice relative to Wt mice (un-
published data), levels of PMCA4 mRNA are signifi cantly
decreased in Eμ-myc mature B and Eμ-myc/RAG2−/− pro–B
cells (Fig. 7 A), whereas PMCA4 mRNA is increased in sorted
pro–B cells from N-mycfl /fl c-mycfl /fl CD19cre+ versus CD19cre−
mice (Fig. S4 E). The decrease in PMCA4 expression correlates
with a decrease in total PMCA protein (Fig. 7 B) and export
of Ca2+ across the plasma membrane in purifi ed B cells from
Eμ-myc mice relative to Wt mice in response to anti-μ (Fig. 7 C),
as measured by fl uorometric analysis of extracellular media
containing a membrane-impermeable version of the Ca2+-binding
Indo-1 dye. These results suggest that Myc negatively regulates
Ca2+ extrusion in B cells and are consistent with a recent report
that Myc interacts with the human PMCA4b promoter, resulting
in decreased PMCA4b expression (Zeller et al., 2006). Indeed,
we also fi nd using chromatin immunoprecipitation (ChIP) that
Myc interacts within the homologous region in the mouse PMCA4
promoter (Fig. S4 F).
To determine whether reduced PMCA4b expression in
Myc-expressing cells is important for Myc-induced prolifera-
tion, we infected BM cells from Wt or Eμ-myc mice with murine
stem cell virus (MSCV) retroviruses containing internal ribo-
somal entry site (IRES)–GFP and human PMCA4b cDNA (MSCV-
PMCA4b-GFP) or vector alone (MSCV-GFP). Analysis of the
Phoenix retroviral packaging cell line indicates that MSCV-PM-CA4b-GFP+ cells exhibit a substantially decreased baseline and
peak [Ca2+]i after ionomycin stimulation relative to GFP− cells,
Dow
nloaded from http://rupress.org/jcb/article-pdf/179/4/717/1334152/jcb_200704173.pdf by guest on 01 D
ecember 2021
MYC MODULATES CALCIUM AND B CELL DEVELOPMENT • HABIB ET AL. 725
whereas MSCV-GFP+ cells fl ux normally (Fig. 7 D). Infection
of Wt and Eμ-myc BM with MSCV-PMCA4b-GFP virus results
in increased hPMCA4b expression over MSCV-GFP–infected
cells by real-time PCR (Fig. 7 E). MSCV-GFP–infected Wt and
Eμ-myc pre–B cells (B220+GFP+) divide normally in response
to IL-7 in vitro based on considerable dilution of the CFSE-like
SNARF-1 dye. In contrast, B cell proliferation is inhibited in
MSCV-PMCA4b-GFP–infected Wt and Eμ-myc B cells in a dose-
dependent manner (Fig. 7 F and not depicted).
DiscussionMyc stimulates B lymphocyte developmentThe roles of Myc proteins in cell differentiation remains one
of the most controversial issues in Myc biology. Early studies
performed in cell lines and more recent studies in primary keratino-
cytes resulted in the prevailing view that Myc stimulates cell cycle
entry while inhibiting differentiation (for review see Pelengaris
et al., 2002). However, in primary chicken and murine B cells
engineered to overexpress myc and in humans with Burkitt’s
lymphoma, B lymphocytes mature to the Ig+ B cell stage rela-
tively unperturbed despite the constitutive overexpression of myc
throughout B cell development (Langdon et al., 1986; Thompson
et al., 1987). These results suggest that B cells are able to mature
relatively normally despite the presence of deregulated Myc.
In this study, we took a genetic approach to address the
roles of Myc in the differentiation of mammalian cells using
primary B cells. First, we found that conditional myc deletion
signifi cantly inhibits B cell development at the pro–B to pre–B
cell transition (Fig. 1 B), which is the stage at which the combined
Figure 6. Calcium signaling is required for pre–B cell development and for Myc-mediated maturation of RAG2-null pro–B cells. (A) BM cells from the indi-cated mice were loaded with indo-1, stained with αB220 and αCD43, and preincubated with anti-μ for 2–3 h to up-regulate myc. (left) Representative kinetics profi le comparing the mean indo-1 ratio versus time after stimulation of anti-μ–pretreated cells with ionomycin. (right) Bars represent the mean fl uorescence ratio ± SEM (error bars) after ionomycin-stimulated Ca2+ fl ux of B220loCD43− BM cells (left; n = 4 mice/group) or B220hiCD43− cells (right; n = 6 mice/group). (B) Wt BM cells were stained with CFSE and cultured for 48 h with IL-7 in the presence or absence of 1 mM EGTA and the indicated concentrations of CaCl2. Representative histograms of CD43 expression on gated B220+ cells are shown. (C) IL-7–induced proliferation of CFSE-stained cultures from B. CFSE dilution histograms of gated B220+ TO-PRO-3− cells are shown. Results are representative of three separate experiments. (B and C) The vertical dotted lines denote an equivalent location on the x axis of each panel for orientation. (D) The Cn–NFAT pathway is required for the proliferation of Wt and Eμ-myc B cells. Splenocytes from Wt (left) or Eμ-myc (right) mice were stained with CFSE and cultured with anti-μ in the presence or absence of CsA for 72 h. Panels represent the number of B220+ cell divisions after MODFIT analysis. Results are representative of two separate experiments.
Dow
nloaded from http://rupress.org/jcb/article-pdf/179/4/717/1334152/jcb_200704173.pdf by guest on 01 D
ecember 2021

JCB • VOLUME 179 • NUMBER 4 • 2007 726
signaling from the pre-BCR and IL-7 normally induce c- and
N-myc expression. Second, to distinguish the ability of Myc to
drive the proliferation of postdifferentiated cells from its ability
to initiate a differentiation program, we asked whether Myc could
rescue differentiation on two genetic backgrounds (RAG2−/− and
btk−/−/tec−/−) whereby B cell development is blocked just before
the stages at which c- and N-myc are normally expressed. We found
that the Eμ-myc Tg effi ciently stimulated the differentiation
and expansion of pre–B-like cells from pro–B cells in the ab-
sence of pre-BCR formation (in RAG2−/− mice). Additionally,
Figure 7. Reduced PMCA expression in E𝛍-myc B cells correlates with decreased Ca2+ effl ux and increased proliferation. (A) Real-time PCR analysis of c-myc and PMCA4 message from purifi ed splenic B cells (top) or pro–/pre–B-like cells (bottom). The fold expression ratio (Eμ-myc/Wt or Eμ-myc–RAG2−/−/RAG2−/−) of c-myc and PMCA4 message is shown. Values represent the mean ± SEM obtained from three (top) or two experiments (bottom). (B) Reduced PMCA protein in unstimulated and anti-μ–treated Eμ-myc splenic B cells correlates with decreased cytoplasmic NFATc1 (increased NFATc1 nuclear translocation) as compared with Wt littermate controls. Cytoplasmic extracts were analyzed by immunoblotting. (C) Ca2+ effl ux from splenic B cells purifi ed from Eμ-myc and Wt mice measured before and after stimulation with anti-μ (arrow). A representative kinetics profi le (Ca2+ extrusion rate) comparing the extracellular indo-1 fl uorescence ratio as a function of time is shown. (D) The enforced expression of PMCA4b results in impaired Ca2+ fl ux. MSCV-GFP and MSCV-PMCA4b-GFP–transfected Phoenix cells were loaded with indo-1 after collecting viral supernatants for the infection of BM cultures depicted in F. Flow cytometric kinetics profi les of MSCV-GFP control (top) and MSCV-PMCA4b-GFP (bottom) cells comparing Ca2+ mobilization of GFP− versus GFP+ cells as a function of time before and after stimulation with ionomycin. (E) RT-PCR analysis confi rming the specifi c expression of human PMCA4 message from MSCV-PMCA4b-GFP–infected Wt and Eμ-myc BM depicted in F. hprt was amplifi ed as a loading control. (F) The enforced expression of PMCA4b inhibits the proliferation of Wt and Eμ-myc BM B cells. BM cells infected with MSCV-GFP or MSCV-PMCA4b-GFP were labeled with SNARF-1 and cultured in the presence of IL-7 for 48 h. Cultures were stained with αB220 and analyzed by fl ow cytometry. Single-parameter SNARF-1 dilution histograms of gated B220+GFP+ cells are shown. Results are representative of two separate experiments.
Dow
nloaded from http://rupress.org/jcb/article-pdf/179/4/717/1334152/jcb_200704173.pdf by guest on 01 D
ecember 2021

MYC MODULATES CALCIUM AND B CELL DEVELOPMENT • HABIB ET AL. 727
we found that Myc can rescue B cell development to the IgM+
immature B cell stage in the context of a btk−/−/tec−/− back-
ground, whereby B cell development is nearly completely
blocked at the large pre–B cell stage. These results collectively
provide genetic evidence that Myc acts downstream of the
pre-BCR and Btk/Tec to stimulate pre–B cell development
and are consistent with previous studies suggesting that the pre-
BCR is required for myc induction and pre–B cell development
(Zimmerman and Alt, 1990; for review see Hendriks and
Middendorp, 2004).
The notion that Myc may initiate differentiation was fi rst
proposed by Gandarillas and Watt (1997) in keratinocytes
in vitro. Recent studies have suggested roles for Myc in inducing
the differentiation of hematopoietic and epidermal stem cells, in
part by regulating the expression of adhesion molecules, thus
releasing them from a differentiation-inhibiting niche (Murphy
et al., 2005). In this study, we show that constitutive Myc can
act in a cell-autonomous manner to rescue differentiation in
lineage-committed progenitor cells. These results collectively
suggest that the phenotypic consequences of Myc during devel-
opment may depend on the differentiation status of the cell: Myc
expression in stem cells and lineage-committed progenitors
results in differentiation, whereas Myc expression in mature
postmitotic cells results in reentry into the cell cycle and in-
hibition of terminal differentiation.
Deregulated Myc synergizes with the loss of Tec kinase function during lymphoma formationAlthough btk-null or btk/tec double-null mice do not sponta-
neously develop pre–B cell tumors, the absence of both btk
and SLP-65 signifi cantly enhances the incidence of pre–B cell
leukemia as compared with SLP-65–null mice (Hendriks and
Kersseboom, 2005). Although the exact mechanism of tumor
suppression by Tec family PTKs is not known, the loss of Btk and/
or SLP-65 in B cells results in sustained IL-7 receptor (IL-7R)
expression and an increased proliferative and/or survival response
to IL-7. Here, we show that loss of Btk/Tec signifi cantly accel-
erates B cell tumor formation in Eμ-myc mice (Fig. 4 B). In addi-
tion, we fi nd that Eμ-myc Tg substantially increases the proliferative
potential of B cell progenitors in response to IL-7, whereas
decreasing myc expression inhibits IL-7–mediated prolifera-
tion. Thus, sustained IL-7R expression in tec/btk-null mice, in
cooperation with constitutive Myc activity as occurs in Burkitt’s
lymphoma, substantially increases the pool of dividing cells
that is capable of acquiring epigenetic alterations that promote
tumorigenesis. We conclude that Tec PTKs act as tumor sup-
pressors that attenuate deregulated c-myc and that IL-7 syner-
gizes with Myc to increase the pool of dividing B cell progenitors.
The ability of Myc to drive differentiation to the IgM-positive
stage in Btk−/−/Tec−/− mice while having accelerated trans-
formation further suggests that it is not the inhibition of matu-
ration itself but rather the degree of growth factor responsiveness
that determines tumor susceptibility. Consistent with the latter
notion, loss of Jak3 kinase, an essential IL-7 signaling molecule,
reduces the transforming potential of the Eμ-myc Tg (Dillon
and Schlissel, 2002).
Myc regulates Ca2+ signaling and NFAT translocation during B cell developmentBecause Ca2+ signaling is important for virtually all aspects of
embryogenesis (for review see Webb and Miller, 2003) and
pre-BCR and Btk stimulate Ca2+ signaling pathways, we were
prompted to investigate how Ca2+ signals were affected during
Myc-dependent B cell development. Surprisingly, we found
that both basal [Ca2+]i levels and the duration of Ca2+ fl ux are
elevated in B cells from Eμ-myc Tg and Eμ-myc/RAG2−/−
mice. Furthermore, an increase in the relative level of [Ca2+]i in
Eμ-myc/RAG2−/− Tg mice positively correlates with increased
proliferation and differentiation and is required for Myc to
stimulate B cell development and proliferation. The increase in
[Ca2+]i level may occur by down-regulation of the Ca2+ effl ux
pump PMCA4b because Myc interacts with the PMCA4b
promoter, and both PMCA4b expression and Ca2+ effl ux are
decreased in Eμ-myc B cells. Moreover, enforced PMCA4b
expression inhibits Myc-induced cell proliferation. These results
are consistent with a study in developing T lymphocytes in the
thymus, which depend on Ca2+ signaling during the maturation
and expansion of CD4−CD8− pre–T cells after rearrangement
of the T cell receptor β chain and formation of the pre–T cell
receptor (Aifantis et al., 2001). In addition, gene-targeted muta-
tions in other genes involved in Ca2+ signaling, including the
Src family PTKs Lyn/Fyn/Blk, Syk, SLP-65, LAT (linker for
activation of T cells), Btk/Tec, the p85 subunit of PI3K (Fruman
et al., 1999), and PLCγ1/2 (Wen et al., 2004), also result in
impaired B cell development at the pre–B cell stage. Altogether,
these results strongly support a role for Myc and Ca2+ signaling
in the maturation of pre–B cells.
A study in primary B lymphocytes indicates that the
amplitude and duration of Ca2+ signals have profound infl uences
on the type of transcriptional response (Dolmetsch et al., 1997).
For example, NF-κB and JNK are selectively activated by a large
transient [Ca2+]i rise, whereas NFAT is activated by lower but
sustained [Ca2+]i levels. We also fi nd that B cells from Eμ-myc
Tg mice, which exhibit elevated, sustained [Ca2+]i levels, also
exhibit increased NFAT translocation even in the absence of
upstream signals from the pre-BCR and BCR. In addition, B cell
nuclear fractions from Myc Tg mice appear to contain mostly
the short isoform of NFATc1 (NFATc1A; Fig. 5), which, in con-
trast to the other NFATc1 isoforms (NFATc1B and c1C), does
not promote apoptosis in lymphocytes (Chuvpilo et al., 2002).
These results suggest that the elevated [Ca2+]i in Myc-expressing
B cells has profound infl uences on transcriptional and biological
responses as well. Indeed, we fi nd that anti-IgM–induced B cell
proliferation of both Wt and Myc Tg B cells is completely ab-
rogated by treatment of cells with CsA, and a recent study indi-
cates that the B cell–specifi c deletion of Cn results in defects in
B cell proliferation and function (Winslow et al., 2006).
Implications of Myc-regulated Ca2+ signalingOne common feature of many types of cancers is their reduced
dependence on external growth factors, and Myc-induced tumors
share this property. Indeed, Myc activates at least three genetic
programs that are normally growth factor dependent, including
cyclin E/Cdk2 kinase, E2F-dependent transcription, and protein
Dow
nloaded from http://rupress.org/jcb/article-pdf/179/4/717/1334152/jcb_200704173.pdf by guest on 01 D
ecember 2021
JCB • VOLUME 179 • NUMBER 4 • 2007 728
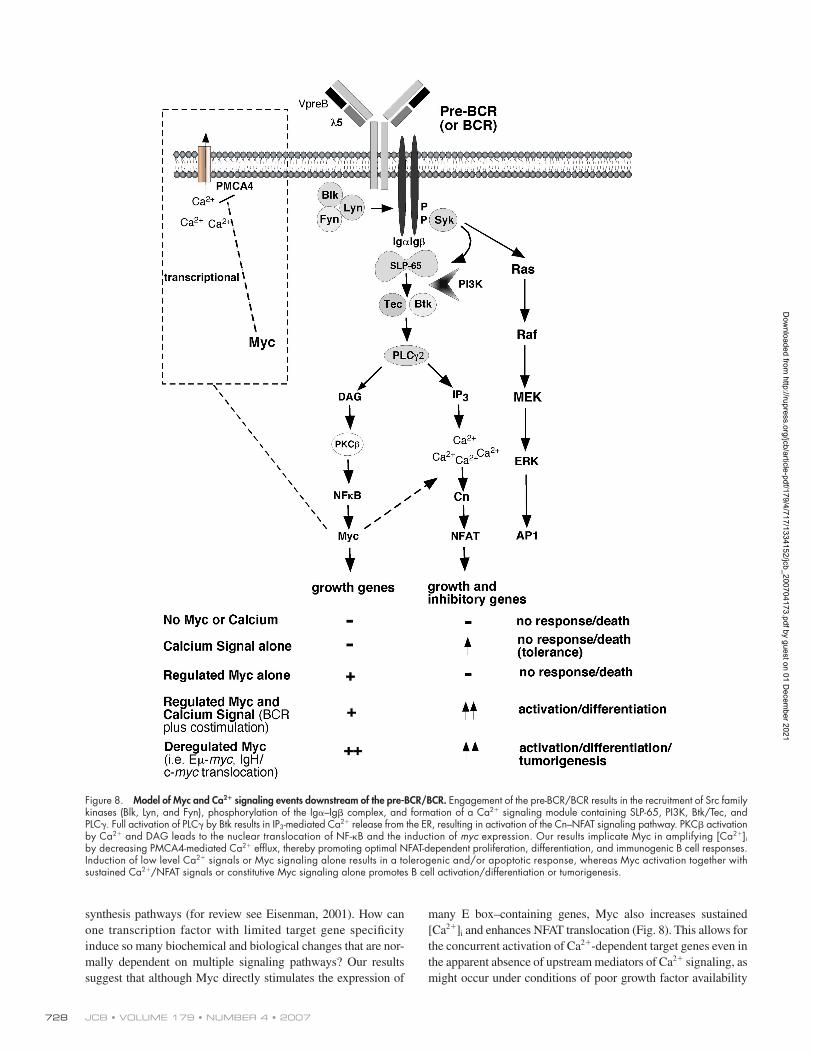
synthesis pathways (for review see Eisenman, 2001). How can
one transcription factor with limited target gene specifi city
induce so many biochemical and biological changes that are nor-
mally dependent on multiple signaling pathways? Our results
suggest that although Myc directly stimulates the expression of
many E box–containing genes, Myc also increases sustained
[Ca2+]i and enhances NFAT translocation (Fig. 8). This allows for
the concurrent activation of Ca2+-dependent target genes even in
the apparent absence of upstream mediators of Ca2+ signaling, as
might occur under conditions of poor growth factor availability
Figure 8. Model of Myc and Ca2+ signaling events downstream of the pre-BCR/BCR. Engagement of the pre-BCR/BCR results in the recruitment of Src family kinases (Blk, Lyn, and Fyn), phosphorylation of the Igα–Igβ complex, and formation of a Ca2+ signaling module containing SLP-65, PI3K, Btk/Tec, and PLCγ. Full activation of PLCγ by Btk results in IP3-mediated Ca2+ release from the ER, resulting in activation of the Cn–NFAT signaling pathway. PKCβ activation by Ca2+ and DAG leads to the nuclear translocation of NF-κB and the induction of myc expression. Our results implicate Myc in amplifying [Ca2+]i by decreasing PMCA4-mediated Ca2+ effl ux, thereby promoting optimal NFAT-dependent proliferation, differentiation, and immunogenic B cell responses. Induction of low level Ca2+ signals or Myc signaling alone results in a tolerogenic and/or apoptotic response, whereas Myc activation together with sustained Ca2+/NFAT signals or constitutive Myc signaling alone promotes B cell activation/differentiation or tumorigenesis.
Dow
nloaded from http://rupress.org/jcb/article-pdf/179/4/717/1334152/jcb_200704173.pdf by guest on 01 D
ecember 2021

MYC MODULATES CALCIUM AND B CELL DEVELOPMENT • HABIB ET AL. 729
or limited extracellular Ca2+. The synergy between Myc and [Ca2+]i
to stimulate B cell development and proliferation are strik-
ingly similar to the signaling requirements underlying immuno-
genic versus tolerogenic responses to antigen in B lymphocytes.
Although activation of Myc alone or a low level Ca2+ signal alone
provokes apoptosis or anergy (tolerance; Glynne et al., 2000),
Myc expression in conjunction with a sustained Ca2+/NFAT signal
results in a mitogenic response and immunity. Here, we fi nd that
Myc amplifi es [Ca2+]i, thus tuning levels into the range required
for optimal NFAT activation and translocation. The unique func-
tion of Myc to amplify Ca2+ signaling may help explain why
transformed cells are relatively resistant to low growth factor and
Ca2+ conditions (Whitfi eld, 1992) despite known requirements
for Ca2+ signaling during G1→S transition.
Materials and methodsMiceC57BL/6 Eμ-myc transgenic mice were obtained from Jackson Immuno-Research Laboratories and were genotyped by PCR according to instructions from the supplier. To generate mice carrying conditionally inactivated c- and N-myc genes, mice carrying a fl oxed c-myc allele (c-mycfl /fl ; de Alboran et al., 2001) were bred to N-mycfl /fl mice (Knoepfl er et al., 2002) expressing the cre recombinase Tg under the control of the CD19 promoter (Rickert et al., 1997). btk/tec-defi cient mice have been described previously (Ellmeier et al., 2000). Mice were housed under specifi c pathogen-free conditions. All mouse procedures were approved by the University of Washington Institutional Animal Care and Use Committee.
Cell cultureFor cell division experiments, cells were stained with CFSE according to the manufacturers’ instructions (Invitrogen). CFSE-labeled cells were cultured in complete RPMI + 10% FBS (Hyclone) in the presence or absence of 10 ng/ml murine recombinant IL-7 (R&D Systems) or 5 μg/ml anti-μ (F(ab’)2 fragment; Thermo Fisher Scientifi c) for the indicated times at 37°C and 5% CO2. In some experiments, EGTA was added at a fi nal concentration of 0.5, 0.75, or 1 mM to IL-7–driven cultures in the presence or absence of 0.2, 0.4, or 0.6 mM CaCl2, and cyclosporine was added at a fi nal con-centration of 100 ng/ml to anti-μ–driven cultures. Thereafter, the cells were stained with the indicated antibodies for analysis by FACS or harvested for measurement of [Ca2+]i (see section Measurement of intracellular calcium and DNA content). The vital dye TO-PRO-3 (Invitrogen) was added to the indicated samples (1-nM fi nal concentration) before acquisition to distin-guish live and apoptotic cells. The number of discrete CFSE peaks was determined using MODFIT software (Verity Software House).
The Myc-null and Myc-expressing fi broblast cell lines HO.15 and HO.15 + c-Myc, respectively, and the Phoenix packaging cell line were grown in DME supplemented with 10% FCS, glutamine, penicillin, strepto-mycin, and essential amino acids. For retroviral gene transfer into primary BM cells, human PMCA4b cDNA was subcloned into the HpaI site of the modifi ed MSCV MIG vector upstream of the EGFP gene and IRES. The MSCV vector carrying only the IRES-EGFP cassette was used as a control. The cDNA of human PMCA4b was provided by M. Husain (Department of Physiology, University of Toronto, Toronto, Canada; Heim et al., 1992). Ecotropic viral stocks were generated by Ca2+ phosphate–mediated trans-fection of subconfl uent Phoenix cells in the presence of chloroquine. Viral supernatant was collected and fi ltered after 3 d. For infection of Wt or Myc Tg BM, �15 × 106 cells were plated per well of a six-well plate and in-fected 48 h later with 4 ml of fresh viral supernatant and 4 μg/ml poly-brene by spinoculation. Two rounds of infection were performed, and cells were then labeled with 1 μM SNARF-1 (S-22801; Invitrogen) for 15 min at room temperature. Cells were washed twice with complete RPMI + 10% FCS and cultured in fresh medium containing 10 ng/ml IL-7 for an addi-tional 48 h. Thereafter, the cells were stained with αB220-phycoerythrin (PE) for analysis of B220+ GFP+ cell division by FACS.
Flow cytometric analysisSingle-cell suspensions were prepared and analyzed by fl ow cytometry as previously described (Iritani et al., 1997). The majority of antibodies used in this study are referenced in Iritani et al. (1997). Additional antibody conjugates
used in this study include B220-PE-Cy-5.5 (eBioscience), FITC anti–mouse CD21, biotin anti–mouse CD22.2, biotin anti–mouse IAb (BD Biosciences), FITC–annexin V (Invitrogen), IgM-PE-Cy7 (SouthernBiotech), and IgD-FITC (BD Biosciences). Cytometry was performed on FACScan and LSR fl ow cyto meters (BD Biosciences). Data were analyzed using CellQuest (Becton Dickinson) and FlowJo (version 6.3.2; Tree Star, Inc.) softwares. To determine relative numbers of B lineage cells in each population (Fig. 1 B), percentages from fl ow cytometry were multiplied by the total BM cellularity to obtain absolute numbers of pro–B cells (B220+CD43+), pre–B cells (B220+CD43−), im-mature B cells (B220loIgM+), and mature B cells (B220hiIgM+). To deter-mine relative numbers of peripheral B2 B cells in each population (Fig. 2 A), percentages from fl ow cytometry were multiplied by the total spleen cellularity to obtain absolute numbers of total B cells (B220+IgM+), follicular mature (IgMloIgDhi), T2 (IgMhiIgDhi), and T1/MZ (IgMhiIgDlo) B cells.
Measurement of intracellular Ca2+ and DNA contentFor measurement of [Ca2+]i, cells were washed and resuspended in 0.5 ml HBSS containing 3% FBS at 106–107 cells/ml (for harvested BM cultures) or 5 × 10⁷–8 × 10⁷ cells/ml (for freshly isolated BM). EGTA-treated cell cultures were resuspended in Ca2+-free HBSS/3% FBS. Indo-1–acetoxymethyl (penta-acetoxymethyl ester; Sigma-Aldrich) was added at a fi nal concentration of 10–20 μM, and incubation was performed for 30 min at 37°C. The indo-1 fl uorescence ratio (400:530 nm) of the cells was acquired as a function of time using a fl ow cytometer (BD-LSR I; Becton Dickinson). For each experi-ment, collection of a 30-s baseline measurement was followed by stimulation with either 25 μg/ml anti-μ or 1 μg/ml ionomycin (EMD) as indicated. For pre-BCR cross-linking of c- and N-myc–defi cient or Wt BM, indo-1–loaded cells were fi rst preincubated with 25 μg/ml anti-μ for 2–3 h at 37°C.
For simultaneous analyses of Ca2+ fl ux and DNA content, fl uo-4 Ca2+-binding dye (Invitrogen) was added at a fi nal concentration of 1 μM in place of indo-1–acetoxymethyl. The cells were washed twice with HBSS/3% FBS and stained with the indicated antibody conjugates at room tempera-ture for 45 min followed by Hoescht (Invitrogen) for 45 min at 37°C. There-after, the cells were washed twice, resuspended in a 1–2-ml fi nal volume, and maintained at 37°C for 5 min before and during analysis of [Ca2+]i.
Measurement of extracellular Ca2+ [Ca2+]oCa2+ effl ux was measured with a cell-impermeable form of indo-1 (5-μM fi nal concentration; Invitrogen). 107 purifi ed splenic B cells were washed twice with Na+-free/Ca2+-free effl ux buffer (modifi ed from Chen et al., 2004) and resuspended in 2 ml effl ux buffer (10 mM Hepes, pH 7.4, 1 mM MgCl2, 5 mM KCl, 135 mM choline chloride, 10 mM glucose, and 0.1% BSA). Fluorescence of cell suspensions was detected with a Fluorescence Master Series fl uorometer (Photon Technology International) at an excitation wave-length of 350 nm and emission wavelengths of 400 and 485 nm. Collection of a baseline measurement was followed by stimulation with 10 μg/ml anti-μ (F(ab’)2 fragment), and ratiometric Ca2+ values (400:485 nm) were plotted as a function of time.
Reporter gene assaysFor NFAT-luciferase assays, HO.15 (Myc null) or HO.15 + c-Myc fi broblasts were plated in 24-well tissue culture dishes at 90% confl uence and, 24 h later, were transfected in triplicate with pNFAT-luciferase plasmid or pCIS-CK negative control plasmid containing the luciferase reporter gene with-out any cis-acting elements (Stratagene) and the pRL Renilla luciferase control reporter vector (Promega) using LipofectAMINE (Invitrogen) according to the manufacturer’s instructions. Treatment with 60 ng/ml PMA + 1 μg/ml ionomycin or PMA/ionomycin + 100 ng/ml CsA was performed 18 h after transfection. After 6 h, luciferase assays were performed with a lumi-nometer (Monolight 1500; Analytical Luminescence Laboratories) and the Dual Luciferase Reporter assay system (Promega). Firefl y luciferase values for each transfection were normalized to Renilla luciferase activity (pRL), and data were expressed as relative luciferase activity versus that obtained with the pCIS-CK negative control plasmid. Mean values of a representa-tive experiment of three performed are displayed ± SEM.
In vivo BrdU labelingMice were given water containing 0.8 mg/ml BrdU (Sigma-Aldrich) for 2 d. BM was harvested, surface stained for B220, and fi xed, permeabilized, and treated with 30 μg DNase I (Sigma-Aldrich). Incorporation of BrdU into DNA was measured by fl ow cytometry using anti–BrdU-FITC (BD Bio-sciences) according to the manufacturer’s protocol.
B cell purifi cationSingle-cell suspensions of total splenocytes and BM cells were isolated as previously described (Iritani et al., 1997). B lymphocytes were enriched by
Dow
nloaded from http://rupress.org/jcb/article-pdf/179/4/717/1334152/jcb_200704173.pdf by guest on 01 D
ecember 2021
JCB • VOLUME 179 • NUMBER 4 • 2007 730
negative selection on magnetic microbeads coupled to rat anti–mouse CD43 (Miltenyi Biotec) or using the mouse B cell Negative Isolation kit (Invitrogen) according to protocols provided by the manufacturers. The re-covered splenic B cells were rested in RPMI 1640 medium before stimula-tion for biochemical analyses or were washed into effl ux buffer for Ca2+ effl ux assays. B lineage cells were enriched from total BM by positive selec-tion on magnetic beads coupled to CD45R/B220 (Invitrogen) or CD19 (Miltenyi Biotec) according to the manufacturers’ instructions or by cell sort-ing on a FACSaria (BD Biosciences).
Western blot analysisPurifi ed splenic B cells were stimulated with 25 μg/ml anti-μ (F(ab’)2 fragment) in serum-free RPMI medium. At the indicated time points, the cells were washed twice in ice-cold PBS and resuspended in hypotonic buf-fer containing protease inhibitors. Cytoplasmic and nuclear extracts were prepared by the method of Dolmetsch et al. (1997). SDS-PAGE and Western blotting were performed using standard techniques. Anti-NFATc1, anti-NFATc2, anti–β-actin, anti-Max, and donkey anti–goat IgG-HRP were purchased from Santa Cruz Biotechnology, Inc. Rabbit anti–mouse IgG HRP secondary antibody was purchased from Invitrogen. Goat anti–rabbit IgG HRP secondary antibody was purchased from Bio-Rad Labora-tories. Anti-PMCA monoclonal antibody (clone 5F10) was purchased from Millipore. Anti–lamin A/C antibody was purchased from Cell Signal-ing Technology. Anti–α-tubulin monoclonal antibody was purchased from Sigma-Aldrich.
ChIPPurifi ed splenic B cells from Myc Tg mice were cross-linked with 1% formal-dehyde for 10 min at 37°C. ChIP was performed with the ChIP assay kit (Millipore) according to the manufacturer’s instructions using anti–c-Myc (N-262; Santa Cruz Biotechnology, Inc.) or control rabbit IgG (rIgG; Santa Cruz Biotechnology, Inc.) antibodies. After reversal of cross-links, DNA was precipitated and detected by qPCR with pairs of primers (underlined) specifi c to the mouse PMCA4b promoter (189-bp region beginning at –2,872 relative to the putative transcription start site and –4,285 relative to the translation start site: 5′-T A G G A G C A A G C T C A G C A G T T A G C A A G C-G C T C A C G T T C T A G A A A C T T G T G T G T C C C T C A G T G C A G C A G G A C T T T A-G T G G A T T C C T G A A A C T G G A G G T C T C C A T C A C A C G C T G T T A C T T G A A C A G G-T A T A T G T C T C T G A T T C T C C C G G A G C A G T T C T G T A G C G C T C T A C C T T C T A A-T C T T C T G T G C C G G C T -3′) and the APEX1 promoter as a positive E-box control (APEX forward, 5′-T A C C A C G A A C A A C C C A G A A C C -3′; APEX re-verse, 5′-G T A C C T G A C C T C C C A A C G A A G -3′). Real-time qPCR was used to quantify the fold enrichment relative to background detected with rabbit IgG for each primer set. The irrelevant gene 45S was amplifi ed to normal-ize samples (45S forward, 5′-T G A A T T G T G G C C C T G A G T G A T A G G -3′; 45S reverse, 5′-G A G T G G T G T T T G T G T G T G T G T T G G -3′).
Genomic PCR and RT-PCRFor PCR analysis of c-and N-myc alleles, single-cell suspensions of total BM from control or mutant mice were stained with anti-B220 and anti-CD43 antibodies, and cell sorting was performed on a FACSaria; alternatively, cells were magnetically labeled with CD19 microbeads and positively selected with an autoMACS Separator (Miltenyi Biotec). The FACS-sorted B220+CD43− and B220+CD43+ populations were directly lysed in PCR lysis buffer (Iritani et al., 1999). Purifi ed CD19+ B lineage cells were cul-tured with 10 ng/ml IL-7 for 0, 15, or 22 h before lysis with PCR lysis buf-fer. The resulting DNA was used directly for PCR at 10,000 genomes/μl. Primers used to amplify the fl oxed undeleted and deleted c-and N-myc alleles have been described previously (de Alboran et al., 2001; Knoepfl er et al., 2002). Deletion of c-myc was quantifi ed by real-time PCR measure-ments of the c-mycfl /fl PCR product in the presence or absence of CD19cre. PCR analysis for D-J and V-D-J rearrangement of the Ig HC was performed as previously described (Iritani et al., 1999).
Real-time quantitative RT-PCRRNA from purifi ed Wt and Eμ-c-myc splenic B cells, Wt and Eμ-c-myc total BM, or FACS-sorted B220+ Eμ-c-myc/RAG2−/−, RAG2−/−, and CD-19cre c-mycfl /fl N-mycfl /fl B cell progenitors was extracted using the RNAqueous-4PCR kit (Ambion). cDNA was generated using Superscript II Reverse Transcriptase (Invitrogen). Samples were normalized using β-actin (β-actin forward [5′-T C C T T C G T T G C C G G T C C A C -3′] and β-actin reverse [5′-A C C A G C G C A G C G A T A T C G T C -3′]) or eif1α (eif1α forward [5′-A G T G A G C A C T G T T A A G A G A C T G C C -3′] and eif1α reverse [5′-C G C-A G C C A G A T G A C T A G A G T A C A A -3′]). c-myc levels were determined using the following primers: c-myc forward (5′-A C C A A C A G G A A C T A T G A C C T C -3′)
and c-myc reverse (5′-A A G G C A G T A G C G A C C G C A A C -3′). The following primers were used for murine PMCA4: mPMCA4 forward (5′-T C G T G A C A-G C C T T C A A T G A C T G G A -3′), mPMCA4 reverse (5′-A G G T C A C C G T A T T T G-A T C T G G G C A -3′), and human PMCA4 (hPMCA4 forward [5′-ATGACCC-A C C C T G A A T T C G C C A T A -3′] and hPMCA4 reverse [5′-T G G T T G C A A T C C-A C C G C A T T G T -3′]).
Primers specific for the various isoforms of murine NFATc1 and NFATc2 have been described previously (Asagiri et al., 2005): NFATc1A forward (5′-G G T A A C T C T G T C T T T C T A A C C T T A A G C T C -3′), NFATc1A reverse (5′-G T G A T G A C C C C A G C A T G C A C C A G T C A C A G -3′), NFATc1B forward (5′-C C C A T C C G C C A G G C T A C A G C C G C A G T A A -3′), NFATc1B reverse (5′-T T C G G T A A G T T G G G A T T T C T G A G T G G T A C C -3′), NFATc1C forward (5′-C C C A T C C G C C A G G C T A C A G C C G C A G T A A -3′), NFATc1C reverse (5′-T G A G T G G T A C C A G A T G T G G G T C C A G T T T A T -3′), NFATc2 forward (5′-C A C G C C T T C T A C C A A G T A C A C A G G A T -3′), and NFATc2 reverse (5′-A C A-G T C G A T G G T G G C T C T C A T G T T -3′). Primers used to amplify hypoxanthine-guanine phosphoribosyl transferase (hprt) were as follows: hprt forward (5′-G T T G G A T A C A G G C C A G A C T T T G T T G -3′) and hprt reverse (5′-G A G G-G T A G G C T G G C C T A T A G G C T -3′).
Primers used to amplify GL Igκ transcripts have been described pre-viously (Hayashi et al., 2003). Quantitative deletion analysis of fl oxed c-myc alleles was performed using genomic DNA from FACS-sorted CD-19cre− or cre+ c-mycfl /fl N-mycfl /fl pro– and pre–B cells and primers specifi c for the fl oxed c-myc allele (de Alboran et al., 2001) using 45S measure-ments to normalize. Experiments were performed using a real-time PCR system sequence detector (model 7300; Applied Biosystems) and a PCR system (Mx4000; Stratagene).
KLH immunizationMice were immunized with KLH protein (Calbiochem) emulsifi ed in com-plete Freund’s adjuvant (CFA; 1:1 vol/vol mixture of 1 mg/ml of sterile protein solution–CFA) by subcutaneous injection at the base of the tail. Two injection sites were administered with 50 μl of the mixture. Mice were killed after 7 d. KLH-specifi c antibody production was measured with a KLH-coated ELISA system. For IgM, IgG1, and IgG2a measurements, serums were diluted 1:200, 1:135, and 1:135, respectively.
Statistical analysisOne-tailed t test was used for all analyses except the Kaplan-Meier ana-lyses, in which we used Prism software (version 4; Graph Pad) to generate two-tailed p-values.
Image acquisition and manipulationDeveloped fi lms were scanned using Photoshop (version 8.0; Adobe), and adjustments of contrast and brightness were performed with Photoshop software. Scanned images were imported into Canvas (version 9.0.2; ACD Systems of America) for fi gure preparation. In reference to Fig. 5, the nu-clear α-lamin control Western blots shown in Fig. 5 (C and E) and the β-actin control Western blot shown in Fig. 5 F were obtained by probing a separate gel. For evaluation of c- and N-myc deletion by densitometry (Fig. S1), band intensities representing the ratio of deleted to fl oxed alleles (with back-ground subtracted) are shown below each lane and were quantifi ed by densitometry on an imaging system (AlphaImager 3400; Alpha Innotech).
Online supplemental materialFig. S1 shows the specifi c deletion of c- and N-myc in B lineage cells. Fig. S2 shows that the Eμ-myc Tg stimulates proliferation but not apoptosis of RAG2−/− B cell progenitors or Ig HC exclusion in Wt B cell progenitors. Fig. S3 shows that the elevated Ca2+ fl ux of Eμ-myc B cell progenitors correlates with increased maturation and proliferation and increased NFAT activity. Fig. S4 shows that chelation of Ca2+ impairs Ca2+ fl ux, matura-tion, and proliferation of Wt and Eμ-myc B cell progenitors in vitro, that Myc interacts with the mouse PMCA4 promoter in Eμ-myc B cells, and real-time PCR analyses of NFATc message from purifi ed splenic B cells and PMCA4 message from c- and N-myc–deleted pro–B cells. Fig. S5 shows total levels of NFAT protein in whole cell lysates from Wt and Eμ-myc B cells and fractionation controls for the separation of cytoplasmic and nuclear frac-tions depicted in Fig. 5 (C–F). Online supplemental material is available at http://www.jcb.org/cgi/content/full/jcb.200704173/DC1.
We thank Alyson Fryer for her technical assistance and Dr. Mansoor Husain for the hPMCA4 cDNA.
This study was supported by National Institutes of Health grant RO1AI0535468 and Royalty Research Fund 2773 to B.M. Iritani and Na-tional Cancer Institute grant R01CA20525 to R.N. Eisenman. R.N. Eisenman is an American Cancer Society Research Professor.
Dow
nloaded from http://rupress.org/jcb/article-pdf/179/4/717/1334152/jcb_200704173.pdf by guest on 01 D
ecember 2021
MYC MODULATES CALCIUM AND B CELL DEVELOPMENT • HABIB ET AL. 731
Submitted: 30 April 2007Accepted: 22 October 2007
ReferencesAifantis, I., F. Gounari, L. Scorrano, C. Borowski, and H. von Boehmer. 2001.
Constitutive pre-TCR signaling promotes differentiation through Ca2+ mobi-lization and activation of NF-kappaB and NFAT. Nat. Immunol. 2:403–409.
Asagiri M., K. Sato, T. Usami, S. Ochi, H. Nishina, H. Yoshida, I. Morita, E.F. Wagner, Mak, T.W., E. Serfl ing, and H. Takayanagi. 2005. Autoamplifi cation of NFATc1 expression determines its essential role in bone homeostasis. J. Exp. Med. 202:1261–1269.
Charron, J., B.A. Malynn, P. Fisher, V. Stewart, L. Jeannotte, S.P. Goff, E.J. Robertson, and F.W. Alt. 1992. Embryonic lethality in mice homozygous for a targeted disruption of the N-myc gene. Genes Dev. 6:2248–2257.
Chen, J., P.A. McLean, B.G. Neel, G. Okunade, G.E. Shull, and H.H. Wortis. 2004. CD22 attenuates calcium signaling by potentiating plasma mem-brane calcium-ATPase activity. Nat. Immunol. 5:651–657.
Chuvpilo, S., E. Jankevics, D. Tyrsin, A. Akimzhanov, D. Moroz, M.K. Jha, J. Schulze-Luehrmann, B. Santner-Nanan, E. Feoktistova, T. Konig, et al. 2002. Autoregulation of NFATc1/A expression facilitates effector T cells to escape from rapid apoptosis. Immunity. 16:881–895.
Crabtree, G.R. 2001. Calcium, calcineurin, and the control of transcription. J. Biol. Chem. 276:2313–2316.
Davis, A.C., M. Wims, G.D. Spotts, S.R. Hann, and A. Bradley. 1993. A null c-myc mutation causes lethality before 10.5 days of gestation in homozygotes and reduced fertility in heterozygous female mice. Genes Dev. 7:671–682.
de Alboran, I.M., R.C. O’Hagan, F. Gartner, B. Malynn, L. Davidson, R. Rickert, K. Rajewsky, R.A. DePinho, and F.W. Alt. 2001. Analysis of C-MYC function in normal cells via conditional gene-targeted mutation. Immunity. 14:45–55.
Dillon, S.R., and M.S. Schlissel. 2002. Partial restoration of B cell development in Jak-3(−/−) mice achieved by co-expression of IgH and Eμ-myc trans-genes. Int. Immunol. 14:893–904.
Dolmetsch, R.E., R.S. Lewis, C.C. Goodnow, and J.I. Healy. 1997. Differential activation of transcription factors induced by Ca2+ response amplitude and duration. Nature. 386:855–858.
Eisenman, R.N. 2001. Deconstructing myc. Genes Dev. 15:2023–2030.
Ellmeier, W., S. Jung, M.J. Sunshine, F. Hatam, Y. Xu, D. Baltimore, H. Mano, and D.R. Littman. 2000. Severe B cell defi ciency in mice lacking the tec kinase family members Tec and Btk. J. Exp. Med. 192:1611–1624.
Fleming, H.E., and C.J. Paige. 2002. Cooperation between IL-7 and the pre-B cell receptor: a key to B cell selection. Semin. Immunol. 14:423–430.
Fluckiger, A.C., Z. Li, R.M. Kato, M.I. Wahl, H.D. Ochs, R. Longnecker, J.P. Kinet, O.N. Witte, A.M. Scharenberg, and D.J. Rawlings. 1998. Btk/Tec kinases regulate sustained increases in intracellular Ca2+ following B-cell receptor activation. EMBO J. 17:1973–1985.
Fruman, D.A., S.B. Snapper, C.M. Yballe, F.W. Alt, and L.C. Cantley. 1999. Phosphoinositide 3-kinase knockout mice: role of p85alpha in B cell development and proliferation. Biochem. Soc. Trans. 27:624–629.
Gandarillas, A., and F.M. Watt. 1997. c-Myc promotes differentiation of human epidermal stem cells. Genes Dev. 11:2869–2882.
Glynne, R., S. Akkaraju, J.I. Healy, J. Rayner, C.C. Goodnow, and D.H. Mack. 2000. How self-tolerance and the immunosuppressive drug FK506 prevent B-cell mitogenesis. Nature. 403:672–676.
Grumont, R.J., A. Strasser, and S. Gerondakis. 2002. B cell growth is controlled by phosphatidylinositol 3-kinase-dependent induction of Rel/NF-kappaB regulated c-myc transcription. Mol. Cell. 10:1283–1294.
Hardy, R.R., and K. Hayakawa. 2001. B cell development pathways. Annu. Rev. Immunol. 19:595–621.
Harris, A.W., C.A. Pinkert, M. Crawford, W.Y. Langdon, R.L. Brinster, and J.M. Adams. 1988. The Eμ-myc transgenic mouse. A model for high-incidence spontaneous lymphoma and leukemia of early B cells. J. Exp. Med. 167:353–371.
Hayashi, K., M. Yamamoto, T. Nojima, R. Goitsuka, and D. Kitamura. 2003. Distinct signaling requirements for Dmu selection, IgH allelic exclusion, pre-B cell transition, and tumor suppression in B cell progenitors. Immunity. 18:825–836.
Heim, R., T. Iwata, E. Zvaritch, H.P. Adamo, B. Rutishauser, E.E. Strehler, D. Guerini, and E. Carafoli. 1992. Expression, purifi cation, and properties of the plasma membrane Ca2+ pump and of its N-terminally truncated 105-kDa fragment. J. Biol. Chem. 267:24476–24484.
Hendriks, R.W., and R. Kersseboom. 2005. Involvement of SLP-65 and Btk in tumor suppression and malignant transformation of pre-B cells. Semin. Immunol. 18:67–76.
Hendriks, R.W., and S. Middendorp. 2004. The pre-BCR checkpoint as a cell-autonomous proliferation switch. Trends Immunol. 25:249–256.
Im, S.H., and A. Rao. 2004. Activation and deactivation of gene expression by Ca2+/calcineurin-NFAT-mediated signaling. Mol. Cells. 18:1–9.
Iritani, B.M., K.A. Forbush, M.A. Farrar, and R.M. Perlmutter. 1997. Control of B cell development by Ras-mediated activation of Raf. EMBO J. 16:7019–7031.
Iritani, B.M., J. Alberola-Ila, K.A. Forbush, and R.M. Perimutter. 1999. Distinct signals mediate maturation and allelic exclusion in lymphocyte progenitors. Immunity. 10:713–722.
June, C.H., and P.S. Rabinovitch. 1990. Flow cytometric measurement of intra-cellular ionized calcium in single cells with indo-1 and fl uo-3. Methods Cell Biol. 33:37–58.
Knoepfl er, P.S., P.F. Cheng, and R.N. Eisenman. 2002. N-myc is essential during neurogenesis for the rapid expansion of progenitor cell populations and the inhibition of neuronal differentiation. Genes Dev. 16:2699–2712.
Langdon, W.Y., A.W. Harris, S. Cory, and J.M. Adams. 1986. The c-myc onco-gene perturbs B lymphocyte development in E-mu-myc transgenic mice. Cell. 47:11–18.
Li, L.H., C. Nerlov, G. Prendergast, D. MacGregor, and E.B. Ziff. 1994. c-Myc represses transcription in vivo by a novel mechanism dependent on the initiator element and Myc box II. EMBO J. 13:4070–4079.
Morrow, M.A., G. Lee, S. Gillis, G.D. Yancopoulos, and F.W. Alt. 1992. Interleukin-7 induces N-myc and c-myc expression in normal precursor B lymphocytes. Genes Dev. 6:61–70.
Murphy, M.J., A. Wilson, and A. Trumpp. 2005. More than just proliferation: Myc function in stem cells. Trends Cell Biol. 15:128–137.
Pelengaris, S., M. Khan, and G. Evan. 2002. c-MYC: more than just a matter of life and death. Nat. Rev. Cancer. 2:764–776.
Rawlings, D.J. 1999. Bruton’s tyrosine kinase controls a sustained calcium sig-nal essential for B lineage development and function. Clin. Immunol. 91:243–253.
Rickert, R.C., J. Roes, and K. Rajewsky. 1997. B lymphocyte-specifi c, Cre-mediated mutagenesis in mice. Nucleic Acids Res. 25:1317–1318.
Sauer, B. 2002. Cre/lox: one more step in the taming of the genome. Endocrine. 19:221–228.
Shiio, Y., S. Donohoe, E.C. Yi, D.R. Goodlett, R. Aebersold, and R.N. Eisenman. 2002. Quantitative proteomic analysis of Myc oncoprotein function. EMBO J. 21:5088–5096.
Shinkai, Y., G. Rathbun, K.P. Lam, E.M. Oltz, V. Stewart, M. Mendelsohn, J. Charron, M. Datta, F. Young, A.M. Stall, et al. 1992. RAG-2-defi cient mice lack mature lymphocytes owing to inability to initiate V(D)J re-arrangement. Cell. 68:855–867.
Staller, P., K. Peukert, A. Kiermaier, J. Seoane, J. Lukas, H. Karsunky, T. Moroy, J. Bartek, J. Massague, F. Hanel, and M. Eilers. 2001. Repression of p15INK4b expression by Myc through association with Miz-1. Nat. Cell Biol. 3:392–399.
Thompson, C.B., E.H. Humphries, L.M. Carlson, C.L. Chen, and P.E. Neiman. 1987. The effect of alterations in myc gene expression on B cell develop-ment in the bursa of Fabricius. Cell. 51:371–381.
Webb, S.E., and A.L. Miller. 2003. Calcium signalling during embryonic devel-opment. Nat. Rev. Mol. Cell Biol. 4:539–551.
Wen, R., Y. Chen, J. Schuman, G. Fu, S. Yang, W. Zhang, D.K. Newman, and D. Wang. 2004. An important role of phospholipase Cgamma1 in pre-B-cell development and allelic exclusion. EMBO J. 23:4007–4017.
Whitfi eld, J.F. 1992. Calcium signals and cancer. Crit. Rev. Oncog. 3:55–90.
Winslow, M.M., E.M. Gallo, J.R. Neilson, and G.R. Crabtree. 2006. The calci-neurin phosphatase complex modulates immunogenic B cell responses. Immunity. 24:141–152.
Zeller, K.I., X. Zhao, C.W. Lee, K.P. Chiu, F. Yao, J.T. Yustein, H.S. Ooi, Y.L. Orlov, A. Shahab, H.C. Yong, et al. 2006. Global mapping of c-Myc bind-ing sites and target gene networks in human B cells. Proc. Natl. Acad. Sci. USA. 103:17834–17839.
Zimmerman, K., and F.W. Alt. 1990. Expression and function of myc family genes. Crit. Rev. Oncog. 2:75–95.
Dow
nloaded from http://rupress.org/jcb/article-pdf/179/4/717/1334152/jcb_200704173.pdf by guest on 01 D
ecember 2021