
My Portfolio
15
P O R T F O L I O F O R T R A N S P O R T P L A N N E R J O B Road Safety Audits and Inspection for HDBRTS Professional Work at EMBARQ Road Safety audit is a systematic method of checking the safety aspects of new road projects in order to detect potential safety hazards before the road is opened to traffic. Road safety inspection is defined as a systematic review of an existing road with the intention to identifying conditions of potential hazard to road users. Purpose: To carry out a systematic road safety audit of a section of the Hubli Dharwad BRT corridor to identify issues of potential hazard for all road users. The kerbs at the edge of the BRT lanes terminate before the pedestrian crossings. The junction is not uniform and misaligned which can lead to safety issues. Lack of uniform carriageway will promote overtaking maneuvers at the junction by smaller vehicles. Problem Recommendations Install a small refuge with bollards to protect pedestrians waiting to cross. BRT lane should be aligned in a uniform manner. It is also recommended to provide a uniform carriage- way. The width of the BRT kerb is reduced from one-meter to 0.3-meter The kerbs at the edge of the BRT lanes terminate before the pedestrian crossings. Lack of uniform carriageway will promote overtaking maneuvers at the junction by smaller vehicles. Problem Recommendations Continue a one-meter BRT kerb upto pedestrian crossing Install a small refuge with bollards to protect pedestrians waiting to cross. It is also recommended to provide a uniform carriage- way. My Role in this Project: Conducted a road safety audits for Hubli Dharwad BRT corridor (about 22 km). Prepared conceptual diagrams as showed some of pictures below.
-
Upload
naresh-kuruba -
Category
Documents
-
view
18 -
download
0
Transcript of My Portfolio

P
O
R
T
F
O
L
I
O
F
O
R
T
R
A
N
S
P
O
R
T
P
L
A
N
N
E
R
J
O
B
Road Safety Audits and Inspection for HDBRTS Professional Work at
EMBARQ
Road Safety audit is a systematic method of checking the safety aspects of new
road projects in order to detect potential safety hazards before the road is opened to
traffic.
Road safety inspection is defined as a systematic review of an existing road with
the intention to identifying conditions of potential hazard to road users.
Purpose:
To carry out a systematic road safety audit of a section of the Hubli Dharwad BRT
corridor to identify issues of potential hazard for all road users.
The kerbs at the edge of the
BRT lanes terminate before
the pedestrian crossings.
The junction is not uniform and
misaligned which can lead to
safety issues.
Lack of uniform carriageway
will promote overtaking
maneuvers at the junction by
smaller vehicles.
Problem
Recommendations
Install a small refuge with
bollards to protect pedestrians
waiting to cross.
BRT lane should be aligned in
a uniform manner.
It is also recommended to
provide a uniform carriage-
way.
The width of the BRT kerb is
reduced from one-meter to
0.3-meter
The kerbs at the edge of the
BRT lanes terminate before
the pedestrian crossings.
Lack of uniform carriageway
will promote overtaking
maneuvers at the junction by
smaller vehicles.
Problem
Recommendations
Continue a one-meter BRT
kerb upto pedestrian crossing
Install a small refuge with
bollards to protect pedestrians
waiting to cross.
It is also recommended to
provide a uniform carriage-
way.
My Role in this Project:
Conducted a road safety audits for Hubli Dharwad BRT corridor (about 22 km).
Prepared conceptual diagrams as showed some of pictures below.

P
O
R
T
F
O
L
I
O
F
O
R
T
R
A
N
S
P
O
R
T
P
L
A
N
N
E
R
J
O
B
PLANNING FOR EQUAL STREETS Professional Work at
EMBARQ
Aim: Equal Streets is a sustained community movement, in order to provision of
better and safer walking and cycling infrastructure in our city.
My Role in this Project:
Prepared base map for Equal Streets
Conducted several site-visits
Conducted detailed road inventory survey
Proposed traffic and transit re-routing plans
Ensured access for emergency vehicles
Proposed parking management plan
Prepared a proposed signage map for in and around the vicinity of equal streets
loop.
Prepared numerous conceptual maps to engage various stakeholders
Conducted several meetings with various stakeholders to get implemented
Identifying new stakeholders
Prepared permanent street design solution for Equal Streets
Prepared visuals for proposed design
Participating in weekly Equal Streets group meetings
Preparing plans for Equal Streets expansion
Conducting site-visits for Equal Streets Expansion
Etc….
Objectives:
To organize a weekly program, every Sunday morning, where a section of public
roads are closed for motorized transport, and open to all forms of non-motorized
transport and community social-recreational activities
To use this program as a platform to build community & government engagement
to address the urgent transportation concerns for our city, such as road safety,
deteriorating air quality, traffic congestion, physical inactivity & sedentary
lifestyles, (especially for our children), lack of public space
To translate this support into positive change on the ground, by partnering with
civic authorities on the implementation of demonstrable projects
Location Map
Conceptual Design
Traffic Management Plan
Norm
al S
un
days
Equ
al S
tre
ets
Su
nd
ays
Public Space

P
O
R
T
F
O
L
I
O
F
O
R
T
R
A
N
S
P
O
R
T
P
L
A
N
N
E
R
J
O
B
EQUAL STREETS DESIGNProfessional Work at
EMBARQ

P
O
R
T
F
O
L
I
O
F
O
R
T
R
A
N
S
P
O
R
T
P
L
A
N
N
E
R
J
O
B
EQUAL STREETS DESIGN VIEWSProfessional Work at
EMBARQ
Creative cul-de-sacs at junction Mid-block parking
Street view at mid-block
P
O
R
T
F
O
L
I
O
F
O
R
T
R
A
N
S
P
O
R
T
P
L
A
N
N
E
R
J
O
B
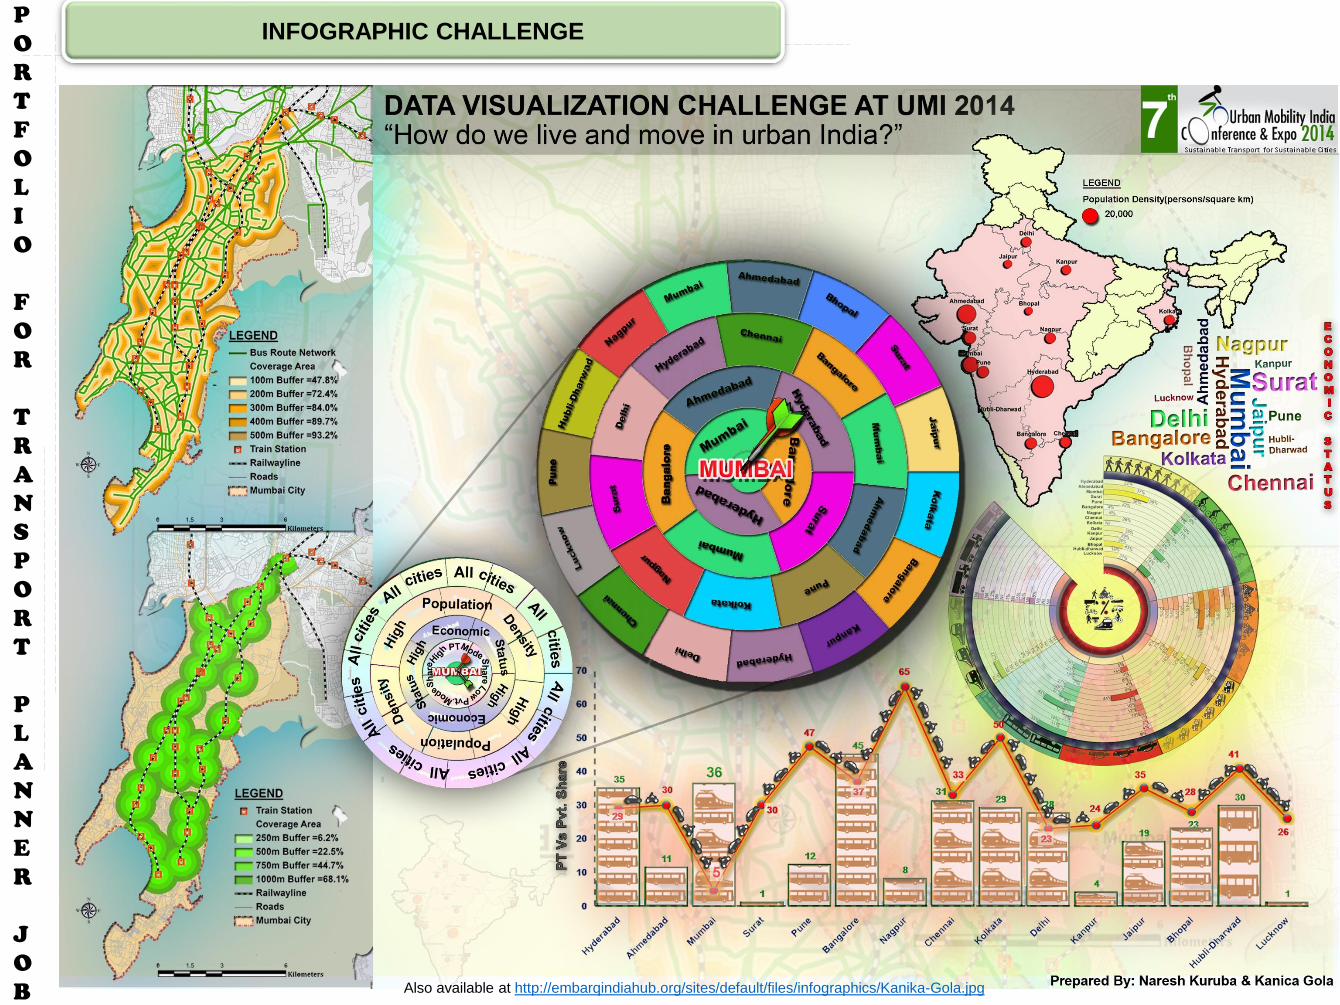
INFOGRAPHIC CHALLENGE
Also available at http://embarqindiahub.org/sites/default/files/infographics/Kanika-Gola.jpg

P
O
R
T
F
O
L
I
O
F
O
R
T
R
A
N
S
P
O
R
T
P
L
A
N
N
E
R
J
O
B
INFOGRAPHIC CHALLENGE
Also available at http://embarqindiahub.org/sites/default/files/infographics/Naresh-Kuruba.jpg

P
O
R
T
F
O
L
I
O
F
O
R
T
R
A
N
S
P
O
R
T
P
L
A
N
N
E
R
J
O
B
Space for buses to turn around
Space for buses to park
Circulation to ensure that buses
move and park quickly and safely
Study Area: Location Map
Relationship between “Road
hierarchy and Bus route”
(conceptual diagram)
Bus Terminal Study for BEST
Aim: To understand the effects of infrastructure on bus operations and
services, this study focuses on terminal infrastructure in Mumbai city.
Objectives:
To identify the existing bus route network and assess route
coverage and service frequencies;
To determine the gaps in the terminal network, using planning tools
such as Geographic Information Systems (GIS) mapping and to identify
potential locations for terminals; and
To estimate the impact of a terminal on bus operations and services.
Study Methodology
93% of the Island area is
covered within walkable
distance, i.e. 500m
75% of the area is covered
with high frequency bus
service, i.e. <=10 min
# Depots: 7
# Terminals: 52
Fleet size: 960
# Routes: 135
Avg. passengers per
day: 8.5 lakh
Professional Work at
EMBARQ
Identifying Bus Route Network Study Highlights Route Coverage
Service
Frequencies
At A Glance
AnalysisTerminal Influences
Dadar- Parel belt is
identified as a serious need
of terminal infrastructure
Nine potential locations
were identified based on
terminal gaps and where
many routes merge/diverge
Route number: 63
Route span: 15.5 kms
# of stations: 34
Running time: 90 min
Journey speed:11.3 km/hr
Total # of Boardings/
Alightings: 236
High # of alightings are
at Lower Parel Station
Potential Terminals Transit Demand
Design Considerations
Terminal Design Impact on operations
Impact for passengersImpact on operations:
If the route-63 is broken up into two
shorter routes, it would save 690 vehicle
kilometers per day, while maintaining the
same headway, # trips and fleet size.
Impact for passengers
The splitting the route can improve
frequency from 13 mins to 7 mins (Route
A-C) and 6 mins (Route C-B). This
increase in frequency can be operated by
maintaining the same vehicle utilization
and fleet size

P
O
R
T
F
O
L
I
O
F
O
R
T
R
A
N
S
P
O
R
T
P
L
A
N
N
E
R
J
O
B
Survey location
Fact
ors
aff
ect
ing u
se o
f bic
ycl
e
Bike & Ride (B&R): Integrating Bicycles and Public
Transport
Aim: applicability and acceptability of B&R services in
case of Ahmedabad city.
Com
ponents
of
inte
gra
tion
Objectives:
To review the various components of integration
To identify the factors affecting use of bicycle
To identify the potential demand (B&R) services
To identify the cost efficiency of the “B&R” system.
Research Methodology
61% of trips are within walkable egress distance
Economical travel distance is >4 kms
Effective catchment area is upto 1.25 kms
Travel distance wise acceptance
Mode shift due to B&R System
Cost efficiency (EIRR) of the system within period of 20 years is 20.1%
Masters Research Work
Criteria for study area
selection
Station typology
Residential land use
Population density
Working pop. density
Student pop. Density
Income
Bicycle ownership

P
O
R
T
F
O
L
I
O
F
O
R
T
R
A
N
S
P
O
R
T
P
L
A
N
N
E
R
J
O
B
Travel Demand Modelling
Aim: to recommend the most suitable solution to both private (auto)
and public transport based on travel demand for the city of XYZ.
Base year: 2013 Future year: 2018
Study area at a glance
Name of the city: XYZ
Area: 584. 29 sq. kms
No. of zones: 5
Internal TAZ’s: 140
External TAZ’s: 14
Network type: Radial
Road length: 32695.71 km
PT service type: Destination based
No. of routes: 127
Parameters for comparison
Auto Assignment
Vehicle kms.
Vehicle hrs.
Volume capacity (V/C) ratio
Length of links (>1 V/C ratio) in kms
Transit Assignment
Passenger kms.
Passenger hrs.
Load factors
Boarding, alighting and transfers
Building Scenario
1. Do nothing
2. Given transit lines
3. Do something
4. Do maximum
Given transit lines
Public transport measures:
Added transit lines
Do minimum
Auto measures:
I. Road widening
II. Missing links
Public transport measure:
I. Added transit stops
II. Changed headway based on max.
volume and bus capacity
Do something
Auto measures
I. Missing links
II. Road widening
Transit measures
I. Express high capacity bus system
II. Deleted parallel routes
Land Use Map
Road NetworkR
esu
lts
Future Travel Demand
Auto Demand Transit Demand
Auto Measures Volume Capacity Ratio
Transit Measures Facility Design Identification
Transit demand
• Passenger kms: 1,23,445.9
• Passenger hrs: 6,960.1
Auto demand
• Vehicle kms: 16,95,259
• Vehicle hrs: 68,426.91
Base Year Transit demand
• Passenger kms: 2,05,010.1
• Passenger hrs: 11,435.1
Auto demand
• Vehicle kms: 19,12,142
• Vehicle hrs: 85,142.4
Future Year
Giv
en
transi
t lines Passenger kms: -
20,828.4
Passenger hrs: 99.1
Do
min
imum Passenger kms: 843.3
Passenger hrs: 955.2
Vehicle kms: 485
Vehicle hrs: 3,536.11
Do
som
eth
ing Passenger kms: -
1,583.3
Passenger hrs: 1,364.8
Vehicle kms: 42,538
Vehicle hrs: 9,236.99
M. Plan (III Sem) Work
Transit Network

P
O
R
T
F
O
L
I
O
F
O
R
T
R
A
N
S
P
O
R
T
P
L
A
N
N
E
R
J
O
B
M. Plan (I Sem) WorkJunction Design of Vijay Cross Roads, Navaragpura, Ahmedabad

P
O
R
T
F
O
L
I
O
F
O
R
T
R
A
N
S
P
O
R
T
P
L
A
N
N
E
R
J
O
B
Area Planning Lab M. Plan (I Sem) Work

P
O
R
T
F
O
L
I
O
F
O
R
T
R
A
N
S
P
O
R
T
P
L
A
N
N
E
R
J
O
B
INTERNSHIPProject name: Revision of Master Plan for Rajahmundry Municipal Corporation
limits with 5KM Vicinity.
Client : Commissioner; Rajahmundry Municipal Corporation
Rajahmundry Town at a Glance:
Extent of Corporation area : 44.5 Sq. kms
Vicinity : 5 kms (12 villages)
Total Extent : 88.5 Sq. kms
Population (2011 Provisional) : 3,43,903
Density :17,288/km2
No. of Households : 94,994
No. of Wards : 50
Project Period
Start : Date / Month / Year :01/01/11
Completion Date :Ongoing
My Role in the Project:
Preparation of broad land use map of Rajahmundry with area of 88.5 sq. Kms.
On site Supervision for conducting diff. surveys, these surveys are
i. Land use survey
ii. Household survey
iii. Road inventory survey
Updating Land use of Rajahmundry Master Plan
Data Verification and Analysis of Rajahmundry H.H Survey Sheets received from
Field Enumerators
In-corporation of approved GTPs in Rajahmundry Master Plan
In-corporation of Approved Layout Plans in Rajahmundry Base map
Collecting of GTPs Maps from DTCP, Hyderabad.
Existing land use Map
B. Plan Work

P
O
R
T
F
O
L
I
O
F
O
R
T
R
A
N
S
P
O
R
T
P
L
A
N
N
E
R
J
O
B
DISSERTATION
Increased journey times due to increased traffic density and in adequate road capacity.
In adequate parking and terminal facilities resulting in reduced accessibility.
Increase in the trip level cost and maintenance.
NEED FOR STUDY Desktop Study
Traffic Management Plan for Core area of Hindupur Town
Objectives
To study the existing scenario of traffic in Hindupur
To identify the most congested area of the town
To identify the traffic problems and deficiencies in the area
To suggest the improvements in Hindupur study area
Introduction:
Madurai is the second largest City in Tamilnadu State, having a very old
history of about two thousand six hundred years and is often referred to
as the Athens of East.
It has three National Highways namely NH-7, NH-45B, NH-49 and state
highways passing through it.
Forecasting the traffic
The traffic volume for the year 2002 and future year 2007 are forecasted
with respect to the 1997 traffic volume taken from the CTTS Report (CTTS
Report, 1997), vehicle growth rate and the sample survey conducted at
different locations.
Diversion of traffic
The old A.V.Bridge and the newly constructed bridge over the old
Kalpalam causeway play a major role in handling the traffic.
The old Kalpalam causeway was closed after the construction of the new
bridge
As a TSM measure, it is decided to divert some of the traffic movement
through the old causeway.
Level of Services
Before Taking TSM Measures After Taking TSM MeasuresCO
NVERTIO
N O
F O
NE W
AY
STREETS
Methodology
B. Plan Work

P
O
R
T
F
O
L
I
O
F
O
R
T
R
A
N
S
P
O
R
T
P
L
A
N
N
E
R
J
O
B
DISSERTATION
CASE STUDY:
Traffic Management Plan for Core area of Hindupur Town
Introduction
Hindupur is the second biggest town and
Mandal headquarters located in
Anantapur district in Andhra Pradesh,
India.
The border between Andhra Pradesh and
Karnataka state passes through
Hindupur and Koratagere taluk in
Karnataka.
Location Map
District Anantapur
Name of the ULB Hindupur
Grade Special Grade
Area (Sq. Kms.) 38.16 Sq.KM.
Population 151835
Males 76,625
Females 75,210
Density 3979
Total no. of households (2011) 32,002
No. Of municipal wards 38
General profile
Register Vehicle Data
Level of Service
6 major intersections have been identified
in the study area, These intersections are
having major movement of traffic
Ambedkar Circle
Proposed Map
B. Plan Work

P
O
R
T
F
O
L
I
O
F
O
R
T
R
A
N
S
P
O
R
T
P
L
A
N
N
E
R
J
O
B
Planning ColloquiumPublic Mass Transit Systems- (7th Sem)
The population in HMDA 9 million. (Source: HMDA Extended Master
Plan 2030.)
. The average speed is 12km/hr in the core. (Source: Hyd, CDP.)
A further growth will only worsen mobility issues.
In Hyderabad,
The average travel distance is 9.2km.
44 out of every 100 commuters travel by public transit systems.
Introduction
A comparison of BRT and MRT in a multi-
professional perspective
Parameters for comparison:
•Ridership.
•Design.
•Economics of transit.
•Mobility.
•Ease of access.
•The Visual Element
•Environmental Impact
BRTS MRTS
YearDaily
System Pax
Corridor I
pphpd
Daily
System Pax
Corridor I
pphpd
2008 8,54,001 14,441 6,53,862 11,057
2011 9,05,221 15,307 6,93,093 11,720
2021 10,76,042 18,195 8,73,298 14,767
Estimated Ridership
Source: ITDP, 2005
The capital costs include:
• Land Acquisition.
• Infrastructure costs.
• Construction costs.
• VGF (Viability Gap Funding).
Capital cost MRTS BRTS
Company's own estimate 4204 _
ITDP estimate 5170 408
Capital cost/km
Company's capital cost/km estimate 110 _
ITDP capital cost/km estimate 135 17
Year Cost/km Revenue/km Loss/km
1996-97 11.19 10.53 0.64
1997-98 12.19 11.49 0.7
1998-99 12.63 11.58 1.07
1999-00 13.19 12.48 0.71
2000-01 14.62 13.47 1.15
2001-02 15.35 13.18 2.17
Operating Characteristics of APSRTC in Hyderabad
Type Min Max
General Bus 4 22
Metro Express Bus 6 24
AC Bus 10 45
Metro Rail- AC 8 18
Min. & Max. Fares
MRTS BRTS
Speed
(km/h)
Distan
ce
(km)
Minute
s
Speed
(km/h)
Distan
ce
(km)
Minute
s
Walking 4 0.5 7.5 4 0.25 3.8
Waiting _ _ 3 _ _ 2
Riding 34 9.2 16 26 9.2 21
Walking 4 0.5 7.5 4 0.25 3.8
Total time 34 31
Speed BRTS MRTS
Dedicated 3.5m
lane.
Lesser space
available for
pvt. Vehicles.
More ongestion.
Push factor from
pvt. modes of
transport.
Column
requiring 2m
road width.
Better from the
pvt. Vehicles
point of view.
Force of push is
lower.
Flexible Lane
Separators.
Fixed Built
Structures.
Impact on Private Vehicles
Zones Noise level standards BRT MRT
Silence 50 db(D), 40db(N) 55db (D), 40db(N) 60db(D&N)
Commercial 65db(D), 60db(N) 70db (D), 65(N) 75db(D&N)
Industrial 75db(D) , 70db(N) 80db (D) , 70db(N) 85db (D), 75db (N)
Residential 55db(D) & 45db(N) 60db (D), 55db(N) 65db(D&N)
Environmental Impacts
B. Plan Work