My Company Learning Day November 2004. HSE Performance – Accident Pyramid OSHA Recordables – 12...
23
My Company Learning Day November 2004
-
Upload
samantha-davis -
Category
Documents
-
view
214 -
download
0
Transcript of My Company Learning Day November 2004. HSE Performance – Accident Pyramid OSHA Recordables – 12...

My Company Learning DayNovember 2004

HSE Performance – Accident
Pyramid
OSHA Recordables – 12First Aid - 44
HIPOS – 4
Fat.-1
DAFWCS – 2
Near misses - 124
ASA’s (3,133)Saf. Obs. (51,149)Training hrs. (70,058)Manhours (4,976,908)Vehicle Mil. (3,210,234 km)
YTD-2004
3
YTD
-200
3
4
2389
412
0
E&P MCTT Rank
FAR –
12 mth
0.02 0.15 1
DAFW – 12 mth
0.0595 0.0595 11
DAFW – 3 mth
0.0633 0.1185 7
RIF –
12 mth
0.51 0.65 7
Fatalities
DAFWs(43)
Total Recordables(388)
First Aids
(3531)
Unsafe Acts and Conditions
(2,046,977)
Near Hits
(7887)
E&P YTD
(3)

Incident analysis: 2002 - 2004
048
12162024283236
Lifting O
ps
Energ
y Isola
tion
Vehic
le
Wokin
g a
t H
eig
hts
Helic
opte
r O
pera
tion
Marine O
pera
tion
Slip
, Trips &
Falls
Caught in
, under or
betw
een
Struck b
y/a
gain
st
Dro
pped O
bje
cts
Use o
f Tools
/
Equip
ment
Manual H
andlin
g
Fly
ing p
artic
les/D
ust
Hot
Substa
nces/S
urfaces
Chem
ical Liq
uid
/
Fum
e / G
as / V
apour
Fre
quency
2002 2003 2004
0
20
40
60
80
100
120
140
160
180
200
J F M A M J J A S O N D J F M A M J J A S O N D J F M A M J J A S
months
Monthly PISI Top six Contribution to Total YTD PISI 12 mth Rolling PISI
Severi
ty In
dex
2003 High risk Intervention areas2003 High risk Intervention areas
’02 YTD
’03 YTD
’04 YTD
’04 TAR
HIPO 22 3 3 3
DAFWCDAFWCfDAFWcf - 12mth Roll.
110.370.31
40.120.30
20.080.05
0.10
RIRRTVAR
0. 892.58
0.780.95
0.561.25
0.630.59

HSSE 5-Year Analysis
0
5
10
15
20
25
30
35
40
0
0.2
0.4
0.6
0.8
1
1.2
1.4
1.6
1.8
2
Fatality 8 6 0 2 0 1
HiPo 22 19 22 3 3
DAFWC 11 6 4 11 4 2
Total Recordables 34 24 18 23 27 14
DAFWCf 0.58 0.31 0.16 0.37 0.12 0.08
Total RIIR 1.8 1.26 0.73 0.77 0.78 0.56
1999 2000 2001 2002 2003 2004

Skin
0
Skin
0Eyes
1(3)
Eyes
1(3)
Arm/Elbow
1(6)
Arm/Elbow
1(6)
Hip
0
Hip
0
Foot/Ankle
1(3)
Foot/Ankle
1(3)
Leg / Knee
1(8)
Leg / Knee
1(8)
Fatality
1
Fatality
1Needs Data
0
Needs Data
0Respiratory Tract
0
Respiratory Tract
0Mouth/Teeth
0(1)
Mouth/Teeth
0(1)
Hand/Fingers/Wrist
2(26)
Hand/Fingers/Wrist
2(26)
Groin
0
Groin
0
Torso/Abdomen
(1)
Torso/Abdomen
(1)
Back / Shoulder
(8)
Back / Shoulder
(8)
Neck
0
Neck
0
Head/ Face
1(5)
Head/ Face
1(5)Chest
0
Chest
0
Injury?
REC
REC
REC
REC
REC
REC
( ) Cumulative figures
DAFWCREC
REC
REC
REC
DAFWC
REC
REC

Who?
Where?– 6 Developments PU 4%– 37 Production PU 34%– 6 CEO/COO 21%– 4 Infrastructure 36%– 1 Exploration 2%
– 1 Marketing Development 3%
– 8 My Company
– 8 Contractor A
– 7 Contractor B
– 4 Contractor C
– 3 Contractor D
– 3 Contractor E
Who?(52 were Contractors, 8 MC employees)
60 people hurt from January – September 2004
Man-hours
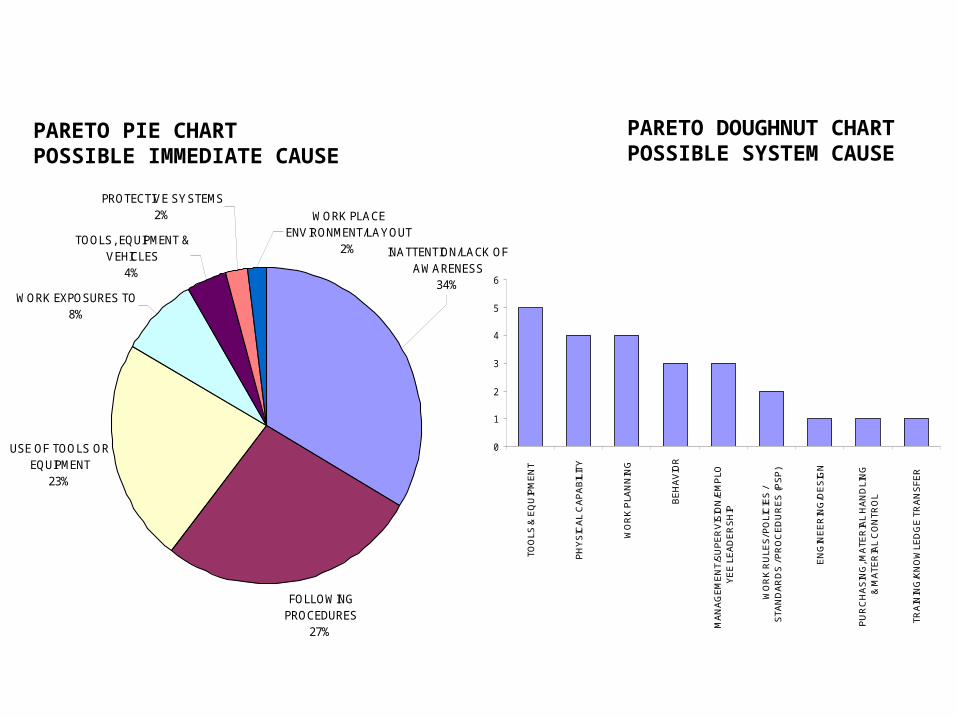
Possible Incident CausesPARETO PIE CHARTPOSSIBLE IMMEDIATE CAUSE
PARETO DOUGHNUT CHARTPOSSIBLE SYSTEM CAUSE
0
1
2
3
4
5
6
TOO
LS &
EQ
UIP
ME
NT
PH
YS
ICA
L C
AP
AB
ILIT
Y
WO
RK
PLA
NN
ING
BE
HA
VIO
R
MA
NA
GE
ME
NT/
SU
PE
RV
ISIO
N/E
MP
LOY
EE
LE
AD
ER
SH
IP
WO
RK
RU
LES
/ PO
LIC
IES
/S
TAN
DA
RD
S /
PR
OC
ED
UR
ES
(PS
P)
EN
GIN
EE
RIN
G/D
ES
IGN
PU
RC
HA
SIN
G, M
ATE
RIA
L H
AN
DLI
NG
& M
ATE
RIA
L C
ON
TRO
L
TRA
ININ
G/K
NO
WLE
DG
E T
RA
NS
FER
FOLLOWING PROCEDURES
27%
USE OF TOOLS OR EQUIPMENT
23%
WORK EXPOSURES TO8%
TOOLS, EQUIPMENT & VEHICLES
4%
PROTECTIVE SYSTEMS2%
INATTENTION/LACK OF AWARENESS
34%
WORK PLACE ENVIRONMENT/LAYOUT
2%

STOP Deviations 2003 - 2004
0 2000 4000 6000 8000 10000
Reactions Of People
Personal ProtectiveEquipment
Positions Of People(Possible Injury
Causes)
Tools And Equipment
Procedures AndHouseKeeping
2004
2003

0 500 1000 1500 2000 2500 3000 3500 4000 4500
Procedures Inadequate
Procedures NotKnown/Understood
Procedures Not Followed
Housekeeping BelowAcceptable Standard
Orderliness StandardsInadequate
Orderliness Standards NotKnown /Understood
Orderliness Standards NotFollowed
Personnel Transfer -Basket/Aircraft/Vessel
No Work Permit For TheJ ob
2004
2003
Procedures And HousekeepingSTOP Deviations 2003 - 2004
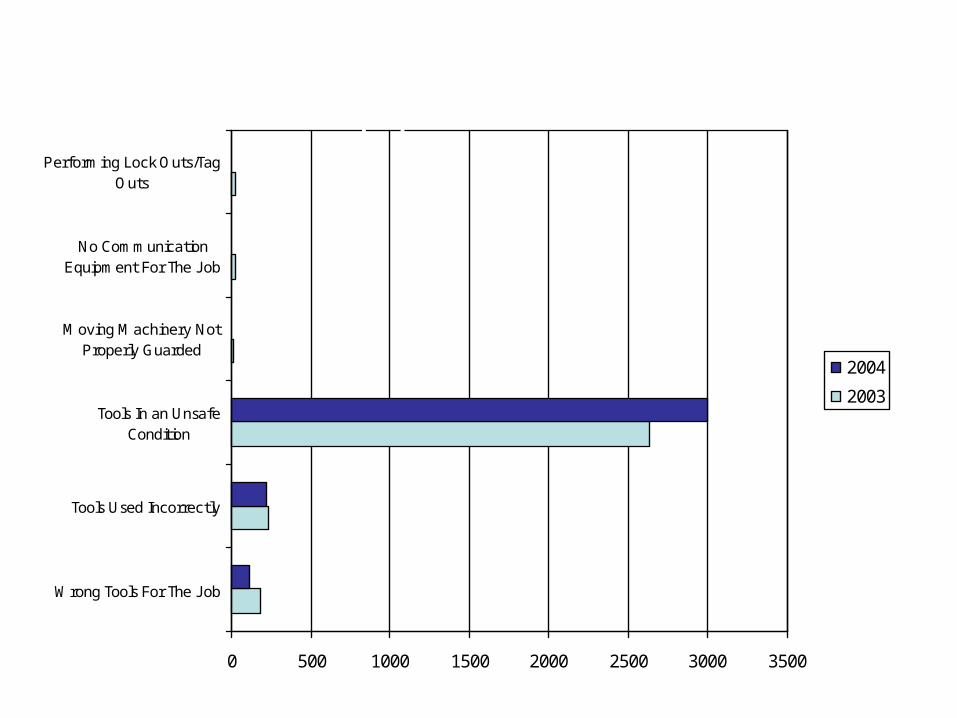
0 500 1000 1500 2000 2500 3000 3500
Wrong Tools For The J ob
Tools Used Incorrectly
Tools In an UnsafeCondition
Moving Machinery NotProperly Guarded
No CommunicationEquipment For The J ob
Performing Lock Outs/TagOuts
2004
2003
Tools And EquipmentSTOP Deviations 2003 - 2004

0 50 100 150 200 250 300 350 400
Striking Against Objects
Struck by Objects
Pinch Points - Caught In OrBetween Objects
Falling - From Height
Slip - Trip - Fall At SameLevel
Contacting Electric Current
Contacting/Exposure ToHazardous Chemical
Proper LiftingTechniques/Overexertion
Personal Awareness
2004
2003
Positions Of People (Possible Injury Causes)STOP Deviations 2003 - 2004

0 100 200 300 400 500 600 700 800
Head Protection
Eyes And Face Protection
Ears/Hearing Protection
Respiratory Protection
Hand And Arm Protection
Fall Protection
Personal Flotation Device
Foot And Leg Protection
Proper Working Cothing
2004
2003
Personal Protective EquipmentSTOP Deviations 2003 - 2004

0 10 20 30 40 50 60
Adjusting PPE
Changing Position
Rearranging J ob
Stopping J ob
Attaching Grounds
Performing LockOuts/Tag Outs
2004
2003
Reactions Of PeopleSTOP Deviations 2003 - 2004

ASA Deviations 2003 - 2004
Permits
67
22
114
46
37
38
148
49
14
82
66
42
31
199
0 50 100 150 200 250
Additional risk assessmentneeded
HSE Mgnt Systemresponsibilities not understood
Incomplete
Preventative and mitigativemeasures
Scope not understood
Thorough emergency responsediscussion
Thorough risk identification
2004
2003

ASA Deviations 2003 - 2004
Orderliness and Tidiness
23
18
29
142
7
181
52
79
12
14
9
125
0
144
24
47
0 20 40 60 80 100 120 140 160 180 200
Absorbing
Benches & toolboxes
Emergency exits
Halls & passageways
Leaners
Material storage
Stairs and platforms
Standards notestablished/understood
2004
2003
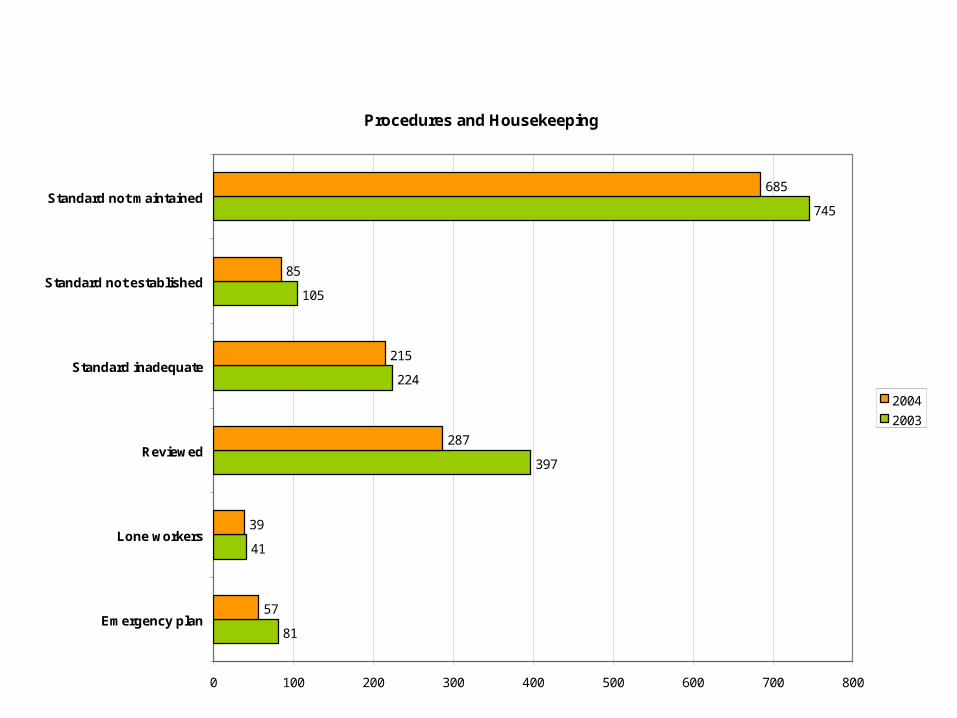
ASA Deviations 2003 - 2004
Procedures and Housekeeping
81
41
397
224
105
745
57
39
287
215
85
685
0 100 200 300 400 500 600 700 800
Emergency plan
Lone workers
Reviewed
Standard inadequate
Standard not established
Standard not maintained
2004
2003

ASA Deviations 2003 - 2004
Tools and Equipment
158
54
323
13
173
113
122
37
235
6
104
74
0 50 100 150 200 250 300 350
Barricades and Warning Lights
Chocks and restraints
In unsafe condition
Seatbelts not used
Used Incorrectly
Wrong for the job
2004
2003

ASA Deviations 2003 - 2004
Personal Protective Equipment
360
173
96
153
311
83
203
93
27
61
192
42
0 50 100 150 200 250 300 350 400
Ears and Eyes
Face and Respiratory
Feet and legs
Fall Protection
Hands and arms
Head
2004
2003200

ASA Deviations 2003 - 2004
Positions of People (Possible Injury Causes)
28
187
24
276
34
53
149
13
112
13
156
18
31
86
0 50 100 150 200 250 300
Absorbing
Caught in, on, or between
Electricity
Falling
Inhaling
Striking against
Struck by
2004
2003

ASA Deviations 2003 - 2004
Reactions of People
106
13
92
12
13
100
125
45
3
68
10
6
28
70
0 20 40 60 80 100 120 140
Adjusting PPE
Applying Lockout
Changing Position
Changing Tools
Hiding and Dodging
Rearranging Job
Stopping Work
2004
2003

0 5 10 15 20
Following Procedures
Use of Tools orEquipment
Use of ProtectiveMethods
Inattention/Lack ofAwareness
Protective Systems
Tools, Equipment &Vehicle
Work Exposure to
Work Place Hazards
2004
2003
Possible Immediate CauseInvestigations 2003 - 2004

0 2 4 6 8 10 12
Mental State
Behaviour
Training/Knowledge Transfer
Contractor Selection and Oversight
Work Planning
Tools and Equipment
Communication
2004
2003
Possible System CauseInvestigations 2003 - 2004

ASA Deviations 2003 - 2004