Mutations in the Pectin Methyltransferase QUASIMODO2 ...
42
1 RESEARCH ARTICLE Mutations in the Pectin Methyltransferase QUASIMODO2 Influence Cellulose Biosynthesis and Wall Integrity in Arabidopsis thaliana Authors: Juan Du 1 , Alex Kirui 2 , Shixin Huang 3,4 , Lianglei Wang 1 , William J. Barnes 3,5,a , Sarah N. Kiemle 3,5,b , Yunzhen Zheng 3 , Yue Rui 5,c , Mei Ruan 1 , Shiqian Qi 6 , Seong H. Kim 3,4 , Tuo Wang 2 , Daniel J. Cosgrove 3,5 , Charles T. Anderson 3,5, *, and Chaowen Xiao 1, * Author Affiliations: 1 Key Laboratory of Bio-Resource and Eco-Environment of Ministry of Education, College of Life Sciences, Sichuan University, Chengdu 610064, P. R. China 2 Department of Chemistry, Louisiana State University, Baton Rouge, LA 70803, USA 3 Center for Lignocellulose Structure and Formation, The Pennsylvania State University, University Park, PA 16802, USA 4 Department of Chemical Engineering, The Pennsylvania State University, University Park, PA 16802, USA 5 Department of Biology, The Pennsylvania State University, University Park, PA 16802, USA 6 Department of Urology, State Key Laboratory of Biotherapy, West China Hospital, Sichuan University and National Collaborative Innovation Center, Chengdu 610041, P. R. China * Corresponding authors: Charles T. Anderson ([email protected]) and Chaowen Xiao ([email protected]) Short title: Pectin and cellulose in wall integrity Footnotes: a Present address: Complex Carbohydrate Research Center, University of Georgia, 315 Riverbend Road, Athens, GA 30602, USA b Present address: Science Center, Mount Holyoke College, South Hadley, MA 01075 USA c Present address: Department of Biology, Stanford University, Stanford, CA 94305, USA One sentence summary: Physical and functional interactions between pectin and cellulose are required for normal wall assembly and plant growth, as revealed in analyses of mutants for a pectin methyltransferase. The authors responsible for distribution of materials integral to the findings presented in this article in accordance with the policy described in the Instructions for Authors (www.plantcell.org) are: Chaowen Xiao ([email protected]) and Charles T. Anderson ([email protected]). ABSTRACT Pectins are abundant in the cell walls of dicotyledonous plants, but how they interact with other wall polymers and influence wall integrity and cell growth has remained mysterious. Here, we verified that QUASIMODO2 (QUA2) is a pectin methyltransferase and determined that QUA2 is required for normal pectin biosynthesis. To gain further insight into how pectin affects wall assembly and integrity maintenance, we investigated cellulose biosynthesis, cellulose organization, cortical microtubules, and wall integrity signaling in two mutant alleles of Arabidopsis thaliana QUA2, qua2 and tsd2. In both mutants, crystalline cellulose content is reduced, cellulose synthase particles move more slowly, and cellulose organization is aberrant. NMR analysis shows higher mobility of cellulose and matrix polysaccharides in the mutants. Microtubules in mutant hypocotyls have aberrant organization, and depolymerize more readily upon treatment with oryzalin or external force. The expression of genes related to wall integrity, wall biosynthesis, and microtubule stability is dis-regulated in both mutants. These data provide insights into how homogalacturonan is methylesterified upon its synthesis, the mechanisms by which pectin functionally interacts with cellulose, and how these interactions are translated into intracellular regulation to maintain the structural integrity of the cell wall during plant growth and development. KEYWORDS: Arabidopsis thaliana, cellulose, cell wall integrity, homogalacturonan methyltransferase, microtubule cytoskeleton, pectin Plant Cell Advance Publication. Published on September 3, 2020, doi:10.1105/tpc.20.00252 ©2020 American Society of Plant Biologists. All Rights Reserved
Transcript of Mutations in the Pectin Methyltransferase QUASIMODO2 ...
1
RESEARCH ARTICLE
Mutations in the Pectin Methyltransferase QUASIMODO2 Influence Cellulose Biosynthesis and Wall Integrity in Arabidopsis thaliana
Authors: Juan Du1, Alex Kirui2, Shixin Huang3,4, Lianglei Wang1, William J. Barnes3,5,a, Sarah N. Kiemle3,5,b, Yunzhen Zheng3, Yue Rui5,c, Mei Ruan1, Shiqian Qi6, Seong H. Kim3,4, Tuo Wang2, Daniel J. Cosgrove3,5, Charles T. Anderson3,5,*, and Chaowen Xiao1,*
Author Affiliations: 1Key Laboratory of Bio-Resource and Eco-Environment of Ministry of Education, College of Life Sciences, Sichuan University, Chengdu 610064, P. R. China 2Department of Chemistry, Louisiana State University, Baton Rouge, LA 70803, USA 3Center for Lignocellulose Structure and Formation, The Pennsylvania State University, University Park, PA 16802, USA 4Department of Chemical Engineering, The Pennsylvania State University, University Park, PA 16802, USA 5Department of Biology, The Pennsylvania State University, University Park, PA 16802, USA6Department of Urology, State Key Laboratory of Biotherapy, West China Hospital, Sichuan University and National Collaborative Innovation Center, Chengdu 610041, P. R. China * Corresponding authors: Charles T. Anderson ([email protected]) and Chaowen Xiao ([email protected])
Short title: Pectin and cellulose in wall integrity
Footnotes: aPresent address: Complex Carbohydrate Research Center, University of Georgia, 315 Riverbend Road, Athens, GA 30602, USA bPresent address: Science Center, Mount Holyoke College, South Hadley, MA 01075 USA cPresent address: Department of Biology, Stanford University, Stanford, CA 94305, USA
One sentence summary: Physical and functional interactions between pectin and cellulose are required for normal wall assembly and plant growth, as revealed in analyses of mutants for a pectin methyltransferase.
The authors responsible for distribution of materials integral to the findings presented in this article in accordance with the policy described in the Instructions for Authors (www.plantcell.org) are: Chaowen Xiao ([email protected]) and Charles T. Anderson ([email protected]).
ABSTRACT
Pectins are abundant in the cell walls of dicotyledonous plants, but how they interact with other wall polymers and influence wall integrity and cell growth has remained mysterious. Here, we verified that QUASIMODO2 (QUA2) is a pectin methyltransferase and determined that QUA2 is required for normal pectin biosynthesis. To gain further insight into how pectin affects wall assembly and integrity maintenance, we investigated cellulose biosynthesis, cellulose organization, cortical microtubules, and wall integrity signaling in two mutant alleles of Arabidopsis thaliana QUA2, qua2 and tsd2. In both mutants, crystalline cellulose content is reduced, cellulose synthase particles move more slowly, and cellulose organization is aberrant. NMR analysis shows higher mobility of cellulose and matrix polysaccharides in the mutants. Microtubules in mutant hypocotyls have aberrant organization, and depolymerize more readily upon treatment with oryzalin or external force. The expression of genes related to wall integrity, wall biosynthesis, and microtubule stability is dis-regulated in both mutants. These data provide insights into how homogalacturonan is methylesterified upon its synthesis, the mechanisms by which pectin functionally interacts with cellulose, and how these interactions are translated into intracellular regulation to maintain the structural integrity of the cell wall during plant growth and development.
KEYWORDS: Arabidopsis thaliana, cellulose, cell wall integrity, homogalacturonan methyltransferase, microtubule cytoskeleton, pectin
Plant Cell Advance Publication. Published on September 3, 2020, doi:10.1105/tpc.20.00252
©2020 American Society of Plant Biologists. All Rights Reserved

2
INTRODUCTION
The primary cell walls of plants are mainly composed of cellulose, hemicelluloses, and pectins, which interact
to form structural networks and tune wall mechanical strength, thus regulating cell shape determination and
organ morphogenesis (Cosgrove, 2005). Cellulose is synthesized by cellulose synthase complexes (CSCs) at
the plasma membrane (Paredez et al., 2006), and its β-1,4-glucan chains are extruded into the apoplast and
coalesce into microfibrils, the patterned deposition of which can be guided by cortical microtubules (Baskin
et al., 2004). Xyloglucan, the major hemicellulose in the primary walls in eudicots, is thought to interact with
cellulose microfibrils at “biomechanical hotspots” that control wall expansibility (Park and Cosgrove, 2012)
and to bind to the surface of cellulose (Zheng et al., 2018). Pectins are complex acidic polysaccharides that
are rich in galacturonic acid (GalA), and include homogalacturonan (HG), rhamnogalacturonan I (RG-I), and
rhamnogalacturonan II (RG-II) domains, as well as xylogalacturonan and apiogalacturonan in some species
(Atmodjo et al., 2013). HG is an unbranched homopolymer of α-1,4-linked D-galacturonic acid (GalA)
(Atmodjo et al., 2013). After synthesis in the Golgi, HG is delivered to the apoplast in a highly methylesterified
form, and is de-methylesterified in the wall by pectin methylesterases (PMEs), releasing protons and methanol
(Driouich et al., 2012). The patterns of this de-methylesterification determine whether HG will form Ca2+-
mediated crosslinks and/or become susceptible to degradation by pectinases. Pectins function to control wall
thickness, cell adhesion and tissue integrity during plant development (Caffall and Mohnen, 2009). Pectin-
modifying genes can thus influence wall and tissue mechanics: for example, Arabidopsis thaliana plants
overexpressing the pectin-degrading gene POLYGALACTURONASE INVOLVED IN EXPANSION2 (PGX2)
or lacking PECTIN METHYL-ESTERASE35 (PME35) have stems with altered mechanical robustness,
supporting a function for pectins in regulating tissue mechanics during development (Hongo et al., 2012; Xiao
et al., 2017).
In Arabidopsis, multiple glycosyltransferases, methyltransferases, and acetyltransferases are required for
pectin biosynthesis (Atmodjo et al., 2013). Several proteins involved in HG biosynthesis have been identified
and characterized. GLUCURONATE 4-EPIMERASE1 (GAE1) functions in pectin biosynthesis by
converting UDP-D-glucuronic acid to UDP-D-galacturonic acid, and also influences cell wall integrity (CWI)
maintenance (Bethke et al., 2016). Arabidopsis GALACTURONOSYLTRANSFERASE1 (GAUT1) displays
HG:GalA transferase activity and can form a complex with the homologous GAUT7 to synthesize high-
molecular-weight polymeric HG via a “two-phase” mechanism (Sterling et al., 2006; Atmodjo et al., 2011;
Amos et al., 2018). In grass and woody dicot plants, GAUT4 possesses HG:GalA transferase activity, and
knockdown of GAUT4 expression promotes plant growth and enhances biomass degradability (Biswal et al.,
2018). GAUT11, another confirmed HG α-1,4 GalA transferase, catalyzes HG elongation and likely functions
in RG-I production in seed mucilage (Voiniciuc et al., 2018). QUASIMODO1 (QUA1/GAUT8) encodes a
putative glycosyltransferase and is likely required for HG biosynthesis, since qua1 mutant plants have reduced

3
uronic acid content in their walls and display cell adhesion defects (Bouton et al., 2002; Orfila et al., 2005;
Durand et al., 2009; Verger et al., 2018). Either during or soon after polymerization, GalA residues in HG can
be acetylated at O2 or O3 positions, and the carboxyl groups of most GalA residues in HG are methylesterified
by methyltransferases (Atmodjo et al., 2013), but the proteins that perform these modifications have not yet
been positively identified.
Several candidate HG methyltransferase genes have been identified in Arabidopsis thaliana. Arabidopsis
QUASIMODO2 (QUA2), also named TUMOROUS SHOOT DEVELOPMENT2 (TSD2), encodes an annotated
pectin methyltransferase, although methyltransferase activity has not previously been biochemically
demonstrated for its gene product (Krupkova et al., 2007; Mouille et al., 2007). HG-derived GalA from
extracted pectin in the qua2 mutant is reduced by 50%, and both qua2 and tsd2 mutant seedlings have shorter
hypocotyls with cell–cell adhesion defects in hypocotyl epidermal cells (Krupkova et al., 2007; Mouille et al.,
2007). Mutants for another allele of QUA2, osu1, are more sensitive to imbalanced C/N conditions, suggesting
that QUA2 is also a key modulator of carbon and nitrogen nutrient balance during plant development (Gao et
al., 2008). In addition, mutants of a rice (Oryza sativa) putative ortholog of AtQUA2 show altered wall
composition and developmental defects (Qu et al., 2016; Xu et al., 2017). OsQUA2 shares high sequence
similarity with AtQUA2, and mutation of OsQUA2 results in reduced HG methylesterification in culm-sieve
element and root cell walls, affecting sucrose transport and root development, respectively (Qu et al., 2016;
Xu et al., 2018). QUASIMODO3 (QUA3), another putative HG methyltransferase, influences pectin
methylesterification and regulates cell wall biosynthesis in Arabidopsis suspension-cultured cells (Miao et al.,
2011). Two more Arabidopsis genes, COTTON GOLGI RELATED 2 (CGR2) and CGR3, encode putative HG
methyltransferases, and cgr2 cgr3 double mutants display cell wall, photosynthesis, and growth defects (Kim
et al., 2015; Weraduwage et al., 2016). Although cgr2 cgr3 double mutants show altered patterns of HG
methylesterification in immunolabeling experiments and overexpression lines for either gene show increased
general methyltransferase activity, these proteins were not shown to have specific HG methyl-transferase
activity (Kim et al., 2015).
HG has long been implicated in cell–cell adhesion in eudicots. For example, the cell adhesion defect in the
Arabidopsis friable1 (frb1) mutant, in which a putative O-fucosyltransferase is mutated, has been attributed
to alterations in pectin structure (Neumetzler et al., 2012). However, a simple model in which HG “glues”
plant cells together is likely incorrect: a suppressor mutation of qua2, named esmeralda1 (esmd1), targets
another putative O-fucosyltransferase and does not rescue the pectin content defect of the qua2 mutation
(Verger et al., 2016). In addition, loss of FRB1 function results in expression changes in wall integrity-related
genes, indicating that FRB1 is required for normal cell wall integrity (Neumetzler et al., 2012). Thus, wall
integrity signaling that includes the sensing of pectin levels, configurations, interactions, or modifications is
likely to influence cell–cell adhesion (Verger et al., 2016; Verger et al., 2018).

4
The above studies on the structure and function of pectins, plus many other analyses of wall polymer
biosynthesis and function, lay a foundation to explore the complex mechanisms and implications of
interactions among the different components of plant cell walls. Studies focusing on interactions between
cellulose microfibrils (CMFs) and xyloglucan have led to a revision of the cellulose–xyloglucan load-bearing
model, called the “biomechanical hotspot” model (Park and Cosgrove, 2012; Wang et al., 2013; Park and
Cosgrove, 2015). An absence of detectable xyloglucan in the Arabidopsis xxt1 xxt2 mutant disrupts cellulose
biosynthesis and cellulose microfibril patterning, supporting the importance of cellulose–xyloglucan
interactions in determining wall structure (Xiao et al., 2016). Pectins are thought to interpenetrate into the
cellulose-xyloglucan network (Somerville et al., 2004). Recent evidence demonstrating that pectins interact
closely with cellulose microfibrils supports a role for pectin–cellulose interactions in maintaining cell wall
integrity. Two- and three-dimensional magic-angle-spinning (MAS) solid-state nuclear magnetic resonance
(NMR) experiments with Arabidopsis have detected extensive close associations between pectins and
cellulose in native primary walls (Dick-Perez et al., 2011; Wang et al., 2015), and experiments in which
bacterial cellulose hydrogels were synthesized in pectin solutions revealed intimate interactions between
subsets of pectins and cellulose microfibrils in vitro (Lopez-Sanchez et al., 2016). Chemical genetic screening
has uncovered a drug, cobtorin, which disrupts cellulose–microtubule coalignment and can be counteracted
by overexpressing pectin-modifying genes or pectinase treatment, implying that pectins might be involved in
the deposition of cellulose microfibrils in alignment with cortical microtubules (Yoneda et al., 2010). Aside
from pectin interactions with cellulose, acidic pectins can also interact with structural glycoproteins such as
the extensins AtEXT3 and AtEXT4 to form pectate–extensin complexes, which might template further orderly
deposition of nascent cell walls during cytokinesis (Cannon et al., 2008). Pectins have also been posited to
crosslink covalently with hemicelluloses (Popper and Fry, 2008; Cornuault et al., 2014). Despite these
advances, the exploration of how pectins affect cellulose biosynthesis and organization during cell wall
assembly is still in its early stages.
In this study, we determined the molecular function of QUA2, which encodes a HG methyltransferase that is
critical for normal HG biosynthesis. Then, we used two allelic Arabidopsis mutants with defects in pectin
biosynthesis, qua2 and tsd2, to investigate the molecular mechanisms that functionally link pectin and
cellulose in the cell wall, and the effects of pectin deficiency on cellulose, the cytoskeleton, and wall and tissue
integrity. The resulting data reveal functional interactions between pectin and cellulose during cell wall
assembly, and provide new evidence at the genetic, molecular and cellular levels of the links between pectins,
cellulose, the microtubule cytoskeleton, and wall integrity sensing during plant cell growth and organ
morphogenesis.

5
RESULTS
Purified QUA2 Shows Methyltransferase Activity on Polygalacturonic Acid In Vitro
Although HG methyltransferase activity has long been detected in crude membrane fractions from plants, no
purified protein has been demonstrated to possess this enzymatic activity in vitro (Goubet and Mohnen, 1999;
Ibar and Orellana, 2007; Miao et al., 2011; Kim et al., 2015). The QUA2 protein is predicted to contain 684
amino acids and to be anchored in the Golgi membrane by a single transmembrane domain near its N-terminus.
Its C-terminus is predicted to reside in the Golgi lumen and harbors a large catalytic region, which contains a
putative S-adenosyl-L-methionine (SAM)-dependent methyltransferase domain (Figure 1A). To determine
the enzymatic activity of QUA2, a sequence including the methyltransferase domain of QUA2 without the
transmembrane domain (amino acids 150–684) was cloned and expressed in E. coli. After amylose affinity
chromatography and size exclusion chromatography, a truncated QUA2 protein fused with maltose binding
protein (MBP) and a His tag (MBP-QUA2) was purified to homogeneity as verified by SDS-PAGE (Figure
1B) and immunodetection with an anti-His antibody (Figure 1C).
In general, SAM-dependent methyltransferases use SAM as a methyl donor and DNA, proteins, or other
molecules as methyl acceptors to generate S-adenosylhomocysteine (SAH) and methylated products
(Fontecave et al., 2004). In HG methylation, methyl groups from donor SAM molecules are thought to be
transferred to C-6 carboxyls of GalA residues, resulting in accumulation of SAH. Therefore, the concentration
of SAH produced will be proportional to methyltransferase activity. Purified MBP or MBP-QUA2 were
incubated with SAM and polygalacturonic acid (PGA, the fully de-methylated form of HG) for 2 h. After the
completion of the reactions, the generated SAH was converted into ADP, which was subsequently converted
into ATP and measured by luciferase activity (Hsiao et al., 2016). In comparison with the MBP-only control,
the reaction including both MBP-QUA2 and PGA yielded significant methyltransferase activity (Figure 1D).
When PGA was omitted, accumulated SAH remained at background levels (Figure 1D). The
methyltransferase assay was also performed for varying durations or supplied with different concentration of
MBP-QUA2 or PGA. The generated SAH increased with increasing incubation time or concentration of
reaction components (Figure 1E, F and G), indicating that the methyltransferase activity of QUA2 is time-
and concentration- dependent. The substrate specificity of MBP-QUA2 was investigated using the
polysaccharides PGA, alginate, and starch. As shown in Figure 1H, PGA supported significantly higher
methyltransferase activity than the other two polysaccharides. To further investigate whether PGA acts as the
methyl acceptor during the reaction, reaction products using different polysaccharides as substrates were
recovered after varying incubation times and used for immunoblotting with JIM5 (recognizing low-
methylesterified HG) and JIM7 (recognizing methylesterified HG) antibodies. The products using PGA as
substrate showed binding with JIM5 and JIM7, although binding intensity with JIM7 was weaker than with
JIM5. JIM5 binding to the PGA reaction products diminished slightly with increasing reaction time (Figure
1I). Taken together, these results demonstrate that QUA2 is a functional HG methyltransferase in vitro.
6
Shorter Hypocotyls and Cell–cell Adhesion Defects Are Evident in qua2 and tsd2 Mutants
To investigate the biological function of QUA2, we examined the phenotypes of two QUA2 mutants. qua2
and tsd2 mutants contain point mutations in the QUASIMODO2 (At1g78240) gene that result in stop codons
(Supplemental Figure 1). Both mutants have independently been shown to have shorter hypocotyls and cell
adhesion defects in epidermal cells of hypocotyls (Krupkova et al., 2007; Mouille et al., 2007). To confirm
these hypocotyl phenotypes simultaneously, seeds of Arabidopsis thaliana Columbia-0 (wild type, Col)
ecotype controls and qua2 and tsd2 mutants were sown on Murashige and Skoog (MS) plates without sucrose
and grown in the dark. qua2 and tsd2 etiolated seedlings had shorter hypocotyls than Col controls from 2 to 6
days of growth, and tsd2 hypocotyls were slightly shorter than qua2 hypocotyls (Figure 2A and 2B). Six-day-
old etiolated Col seedlings had an average hypocotyl length of 1.59 ± 0.17 cm, whereas 6-day-old etiolated
qua2 and tsd2 mutants had average hypocotyl lengths of 0.59 ± 0.12 cm and 0.51 ± 0.09 cm, respectively (SD,
n ≥30 seedlings per genotype) (Figure 2A and 2B). Similar to previous reports (Krupkova et al., 2007; Mouille
et al., 2007), epidermal cells in 3-day-old etiolated qua2 and tsd2 hypocotyls were often detached from other
cells (Figure 2C); in addition, pairs of guard cells in 6-day-old light-grown cotyledons were also sometimes
separated from one another as observed after propidium iodide (PI) staining (Figure 2D), although these
defects were less evident in true leaves. Abnormal cell separation was not observed in Col controls (Figure
2C and 2D). These data indicate that cell adhesion defects occur in at least two tissues of qua2 and tsd2 mutant
plants.
Mutations in QUA2 Limit Adult Plant Growth
After investigating seedling phenotypes, we next observed the phenotypes of adult plants. Three-week-old
qua2 and tsd2 plants had smaller rosettes and shorter petioles compared with Col controls when grown in a
light regime of 16 h light/8 h dark: average rosette diameter in qua2 and tsd2 plants was 3.74 ± 0.56 cm and
3.07 ± 0.96 cm, respectively, whereas it was 5.41 ± 0.66 cm in Col (SD, n = 16 rosettes per genotype)
(Supplemental Figure 2A and 2B), and petiole length and leaf area in both mutants were smaller than Col wild
type (Supplemental Figure 2C and 2D). Mature qua2 and tsd2 plants grown for 8 weeks had shorter stems
with respective average heights of 28.12 ± 2.64 cm and 23.94 ± 2.54 cm, whereas average stem height was
40.00 ± 3.06 cm in Col controls (SD, n = 16 plants per genotype) (Supplemental Figure 2E and 2F). Both
rosette diameter and stem length were significantly smaller in tsd2 plants than in qua2 plants (Supplemental
Figure 2B and 2F). These data indicate that pectin deficiency impairs growth in the mutant plants, and that
the tsd2 mutation, which disrupts the first exon of QUA2/TSD2, causes more severe effects on plant growth
than the qua2 mutation, which occurs in the seventh exon (Supplemental Figure 1). Together, these results
indicate the involvement of QUA2 in cell elongation to maintain plant growth, even though cell adhesion
defects were not as evident during adult growth in the mutants.
7
QUA2 Is Expressed in Multiple Tissues
Microarray data indicate that QUA2 is highly expressed in most tissues except mature pollen (Winter et al.,
2007). To provide more detailed information about the spatiotemporal patterning of QUA2 expression, we
generated multiple transformant lines of Col plants expressing a construct in which the β-GLUCURONIDASE
(GUS) gene was fused to 2.5 kb of the promoter region of QUA2 and performed GUS staining experiments
across multiple developmental stages and tissues. In young seedlings grown either in light or in dark, GUS
staining was evident in cotyledons, roots, and hypocotyls (Supplemental Figure 3A, 3B and 3C). In adult
plants, GUS staining was detected in expanding rosette leaves (Supplemental Figure 3D), distal and proximal
ends of developing siliques (Supplemental Figure 3E), flowers (Supplemental Figure 3F and 3G), and xylem,
phloem, and parenchyma cells of stems (Supplemental Figure 3H). Together, these data indicate that QUA2
is expressed across a wide range of tissues, and might function in the growth of multiple organs during plant
development.
Uronic Acid Levels Are Reduced, but Degree of HG Methylesterification Is Not, in qua2 and tsd2
Mutants
As the above results show, QUA2 is a HG methyltransferase that is expected to function during the
biosynthesis of pectic homogalacturonan (HG). However, previous studies reported a ~50% reduction in
extractable HG, rather than total HG, in the qua2 mutant (Mouille et al., 2007), and no significant reduction
in total uronic acid in the tsd2 mutant (Krupkova et al., 2007), with no significant reduction in the degree of
HG methylesterification in either mutant. To simultaneously compare both qua2 and tsd2 mutants to Col
controls in the same set of experiments, we measured total uronic acid content and monosaccharide
composition in 6-day-old etiolated seedlings. Total uronic acid content in qua2 and tsd2 mutants was
significantly lower than in Col controls on a mass fractional basis (Figure 3A). To estimate the degree of
pectin methylesterification, we measured methanol release upon saponification from cell walls of 6-day-old
dark-grown seedlings. The amounts of released methanol did not differ significantly in qua2 or tsd2 samples
from that released from Col samples (Figure 3B). Normalizing by the amount of HG in the mutants, the degree
of HG methylesterification did not differ significantly from Col controls (Figure 3C). The lower uronic acid
content in qua2 and tsd2 plants is consistent with results from sugar monosaccharide composition analysis, in
which cell wall material from both mutants displayed significantly less GalA on a molar % basis, with
arabinose content being significantly higher in the mutants (Figure 3D). Together, these results suggest that
mutations in QUA2 might result in the synthesis of an unstable or incomplete form of HG that is rapidly
degraded, resulting in lower HG levels in the wall, but that QUA2 is not solely responsible for HG
methylesterification.

8
Cellulose Biosynthesis Is Inhibited in qua2 and tsd2 Mutants
To investigate whether pectin deficiency in qua2 and tsd2 mutants affects cellulose biosynthesis, we first
measured crystalline cellulose content according to the Updegraff method (Updegraff, 1969) from alcohol
insoluble residue (AIR) of 6-day-old etiolated seedlings. Average cellulose content was 139 ± 4 µg/mg AIR
in Col, whereas it was roughly 100 µg/mg AIR in both qua2 and tsd2 mutants, representing a reduction in
cellulose content of ~30% (Figure 3E). Cellulose content was also decreased by ~10% in rosettes leaves of 4-
week-old qua2 and tsd2 plants relative to Col controls (Figure 3F). Based on the finding of reduced cellulose
content in qua2 and tsd2 mutants, we next investigated whether cellulose biosynthesis was affected in the
mutants. Transgenic lines expressing GFP-CESA3, a marker for primary wall CSCs (Desprez et al., 2007),
were produced in the qua2 and tsd2 mutant backgrounds, and in the Col background as a control (Xiao et al.,
2016). To monitor CSC dynamics in mutants, time-lapse images of GFP-CESA3 over 5 min at 5-sec intervals
were recorded in epidermal cells at the tops of 3-day-old etiolated hypocotyls, and GFP-CESA3 particle
movement was analyzed and quantified. Fewer linear tracks of CSCs were present in time-averaged
projections in both qua2 and tsd2 mutants compared to the well-organized CSC arrays evident in Col cells,
and the average speed of GFP-CESA3 particles was 223.8 ± 0.4 nm/min (SE, n = 965 particles, 11 cells from
10 seedlings) in qua2 hypocotyls and 224.4 ± 0.3 nm/min (SE, n = 1441 particles, 17 cells from 9 seedlings)
in tsd2 hypocotyls, which was significantly slower than the average speed of 284.9 ± 0.4 nm/min (SE, n =
1016 particles, 14 cells from 7 seedlings) in Col controls (Figure 4A; Supplemental Movie 1). The slower
GFP-CESA3 particles in both mutants were also evident in kymographs, which showed steeper (slower)
slopes and more unidirectional movement from CSC tracks as opposed to shallower (faster) slopes and
bidirectional movement in Col controls (Figure 4B). This finding was confirmed when particle tracking
software was used to calculate particle speeds for many hundreds of GFP-CESA3 particles for each genotype
(Figure 4C). GFP-CESA3 particle density from z-series images in qua2 and tsd2 mutants was 0.82 ± 0.11
particles/µm2 and 0.90 ± 0.12 particles/µm2, respectively, which was not significantly different from a density
of 0.88 ± 0.11 particles/µm2 in Col controls (Figure 4D and 4E). Therefore, disruption of pectin results in both
reduced GFP-CESA3 particle speed and reduced cellulose content in the qua2 and tsd2 mutants, strongly
indicating that cellulose synthesis is defective in the mutants.
Cellulose Organization and Morphology Are Disrupted in qua2 and tsd2 Hypocotyl Cells
The change in cellulose biosynthesis we detected in the qua2 and tsd2 mutants prompted us to further explore
how HG deficiency might affect cellulose microfibril arrangement in mutant walls. As a non-destructive
method, Sum Frequency Generation (SFG) can selectively detect the coherence of crystalline cellulose
without interference from an amorphous polymer matrix (Makarem et al., 2019) and is sensitive to the
mesoscale ordering of cellulose microfibrils over depths of hundreds of nm in plant cell walls (Lee et al., 2014;
Makarem et al., 2017). Given that 6-day-old etiolated seedlings contain most of the deposited cellulose that is

9
produced in etiolated seedlings, we observed SFG spectra in 6-day-old etiolated mutant and Col hypocotyls.
The data displayed similar peak features along the lengths of the hypocotyls (Figure 5A), with sharp CH peaks
centered at 2944 cm–1 and broad OH peaks centered at 3320 cm–1, as well as shoulder peaks at 3450 cm–1.
Peak intensity at 2944 cm–1 can be used to estimate cellulose content (Barnette et al., 2012; Makarem et al.,
2017). Compared with Col controls, SFG spectra from qua2 and tsd2 mutants had reduced CH peak intensities
(Figure 5A), indicating lower cellulose content in the mutants, consistent with the above results from
Updegraff assays. SFG intensity at 2944 cm–1 from middle and basal hypocotyls in all three genotypes was
slightly higher than that from top regions (Figure 5A), suggesting that more cellulose had been deposited in
lower regions, which is consistent with reported measures of wall synthesis and thicknesses in etiolated
hypocotyls of Arabidopsis (Refregier et al., 2004; Derbyshire et al., 2007). The relative orientation of cellulose
microfibrils can be quantified by comparing OH/CH peak area ratio in the experimental geometry, in which
the laser incidence plane is aligned either parallel (longitudinal) or transverse to the hypocotyl elongation axis
(Kafle et al., 2014b; Kafle et al., 2014a; Chen et al., 2017). The lower ratio of (OH/CHtransverse
ratio)/(OH/CHlongitudinal ratio) in qua2 and tsd2 mutants (Figure 5B) indicated that cellulose microfibrils are
aligned in a more random manner in the mutant cell walls than in Col controls.
To further examine cell wall organization in qua2 and tsd2 mutants, we observed wall structure in the
innermost (newly deposited) layers of the wall in epidermal cells from the hypocotyls of 3-day-old etiolated
seedlings by atomic force microscopy (AFM), which detects stiffer wall elements such as cellulose
microfibrils and crosslinked matrix components, as well as by field emission scanning electron microscopy
(FESEM) without or with treatment by pectate lyase to remove some matrix polysaccharides from the
innermost face of the wall (Zhang et al., 2016). Compared with a relatively uniform distribution of fibrils
evident in AFM images of Col controls, AFM images of qua2 mutants showed thicker, kinked fibrils, whereas
fibrils in tsd2 cells showed large bundles of fibrils; in both mutant alleles, fibrils ran almost perpendicular to
the longitudinal axis of the cell (Figure 5C). In FESEM images of Col controls, walls and fibrils also displayed
uniform patterning, whereas walls were more randomly organized with less dense, crooked fibrils in both
mutants, with the differences being more obvious in tsd2 than qua2 mutants (Figure 5D and 5E). Bright
fragments on the wall surface in FESEM images in mutants without pectate lyase treatment (Figure 5D) were
reminiscent of structures of Ca2+-crosslinked matrix polysaccharides in onion (Allium cepa) epidermal walls
(Zhang et al., 2016), implying that these structures might represent fragments of de-methylesterified HG that
are over-represented in qua2 and tsd2 mutants and are not integrated tightly into the wall matrix upon delivery
to the apoplast. Long fibrils that might represent cellulose microfibrils appeared to be more fragmented in
both mutants after pectate lyase treatment (Figure 5E), as depicted in the diagram in Figure 5F. Moreover,
fibrils in FESEM micrographs from mutants were thinner than those in Col controls after treatment with
pectate lyase (Figure 5G). In addition, we observed porous features in tsd2 walls (Figure 5E). The above data
highlight the function of HG in supporting normal cellulose synthesis and orientation, and the assembly of
properly integrated primary walls, in Arabidopsis.
10
Reduced Pectin Deposition in Mutants Promotes the Increased Molecular Mobility of Pectin and
Cellulose
We also detected a substantial change in the molecular mobility of cell wall components in qua2 and tsd2
mutants using solid-state NMR experiments. Mobility is site-specifically monitored by comparing the relative
intensity of a spectrum that only selects mobile molecules with a quantitative spectrum (Figure 6A) (Phyo et
al., 2017). For each peak, the intensity ratio between the two spectra is quantified, which represents the relative
mobility of each carbon site (Figure 6B). Compared with the wild-type sample, both mutants showed higher
mobility for pectin backbones (GalA C1 at 100 ppm and GalAC4/RhaC1 at 69 ppm), pectin side chains (Ara
C1 at 108 ppm), surface cellulose (sC4 at 84 ppm) and interior cellulose (iC4 at 89 ppm). A few exceptions
were evident at carbon sites with special properties; for example, the Rha C6 resonating at 18 ppm remained
highly mobile in all three samples as it is a CH3 group that rotates freely. The qua2 mutant generally had the
highest intensity ratios, indicating that this mutant has the most dynamic molecules among the three samples.
Enhanced pectin mobility should originate from a perturbed backbone and side chain structure and domain
organization, which shortens 13C relaxation and enhances pectin intensity in the 13C direct polarization (DP)
spectrum measured with short recycle delays, but it is unclear why cellulose also showed an increase of 5–
10% in mobility in the qua2 mutant. Since cellulose is typically considered to be rigid, the change in cellulose
intensity might be attributed to the enhanced spin exchange caused by its stronger interactions with more
mobile pectin in the qua2 mutant. The tsd2 mutant displayed mobilities between the wild-type and qua2
samples.
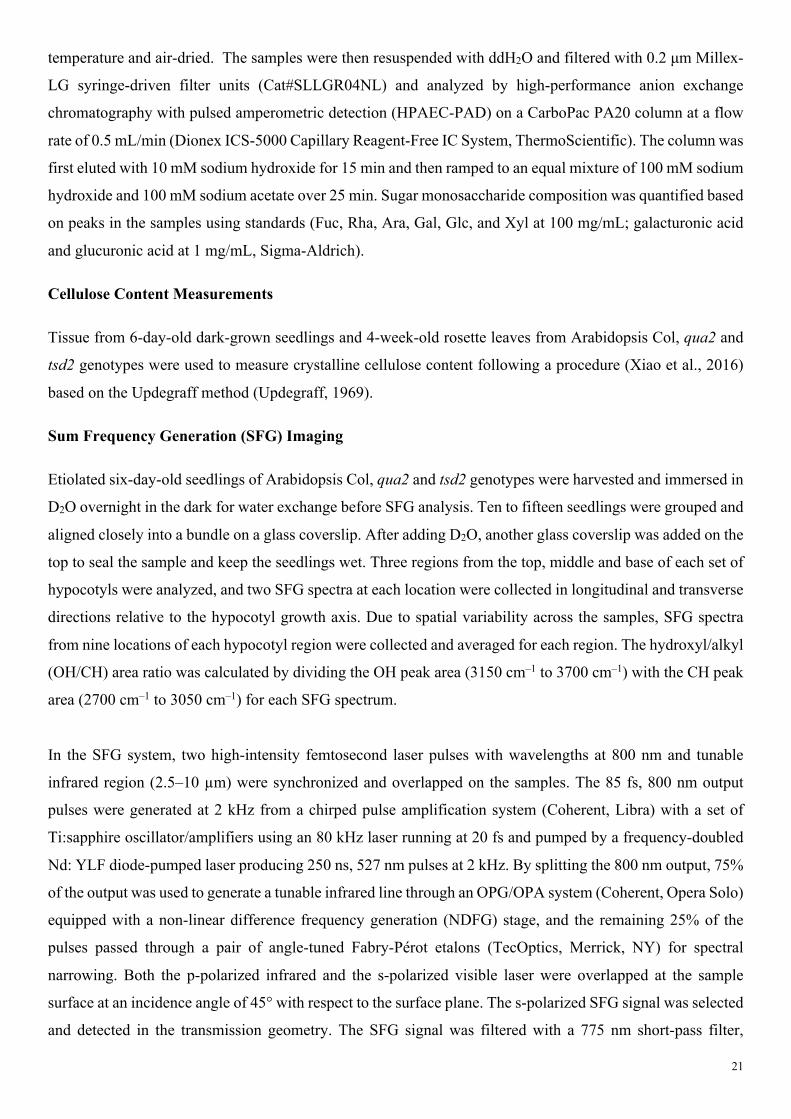
Cortical Microtubule Orientation is Disrupted in the Absence of Normal Wall Structure in qua2 and
tsd2 Hypocotyl Cells
Given the functions of cortical microtubules in tissue mechanics and cellulose deposition, and the alteration
of wall structure in qua2 and tsd2 mutants, we next investigated whether the disruption of wall biosynthesis
in these mutants affects the patterning and dynamics of cortical microtubules. Transgenic lines expressing
GFP-MAP4 (Marc et al., 1998) were generated in the Col, qua2 and tsd2 backgrounds. To observe the
patterning of microtubules, z-stack images were collected from epidermal cells of top, middle and basal
hypocotyls in 3-day-old etiolated seedlings. Relative to the cell elongation axis, microtubules in the tops of
Col hypocotyls were angled mostly from 40° to 70°, whereas microtubules in qua2 and tsd2 hypocotyl tops
were more randomly distributed (Figure 7A and 7B). In comparison to the oblique microtubule angles in the
middle regions of hypocotyls of Col controls that centered around 30° relative to the cell elongation axis,
microtubules in the same regions of qua2 and tsd2 hypocotyls tended to be more transverse, with angles
primarily between 50° and 90° (Figure 7A and 7B). In Col basal hypocotyls, most microtubules were
longitudinal, whereas in qua2 and tsd2 mutants, some microtubules were oblique. We noticed that some

11
microtubules in the qua2 background were wavier than in Col controls (Figure 7A). The aberrant orientation
of microtubules in qua2 and tsd2 mutants implies that disruption of wall biosynthesis and cell adhesion defects
affect cytoskeletal patterning in these genotypes, and/or vice versa.
Microtubules in qua2 and tsd2 Mutants Are Hypersensitive to Oryzalin and Mechanical Stress
To test whether microtubule stability is affected in pectin deficient mutants, we grew Col, qua2, and tsd2
seedlings on MS media containing oryzalin, a microtubule-depolymerizing drug. In treatments with different
oryzalin concentrations, hypocotyls in 6-day-old etiolated qua2 and tsd2 seedlings were significantly shorter
than Col controls (Supplemental Figure 4A and 4B) and were more significantly inhibited in elongation as a
percentage of hypocotyl length without drug treatment than Col seedlings (Supplemental Figure 4C and 4D).
Conversely, qua2 and tsd2 seedlings had wider hypocotyls, both in absolute (Supplemental Figure 4E and 4F)
and relative (Supplemental Figure 4G and 4H) terms. Growth inhibition and more severe cell adhesion defects
were observed in 3-day-old etiolated seedlings of the mutant genotypes when grown in the presence of 200
nM oryzalin (Supplemental Figure 5).
To further test the sensitivity of microtubules to oryzalin in the two mutants, 3-day-old etiolated seedlings
expressing GFP-MAP4 in Col, qua2 and tsd2 backgrounds were incubated with 10 μM oryzalin in the dark
for different time intervals, and z-series images were recorded from epidermal cells of top regions of
hypocotyls. After treatment for 10 min, GFP-MAP4-labeled microtubules began to depolymerize in qua2 and
tsd2 hypocotyls, and were nearly absent after 240 min oryzalin treatment, whereas they remained relatively
intact in Col controls (Figure 7C; Supplemental Figure 6).
Cortical microtubules respond to mechanical stresses to maintain plant organ morphology (Hamant et al.,
2008), and application of external mechanical pressure can result in reorientation of microtubules in growing
Arabidopsis leaves and hypocotyls (Jacques et al., 2013; Robinson and Kuhlemeier, 2018). To monitor the
responses of microtubules to external pressure, we mounted 3-day-old etiolated seedlings of GFP-MAP4-
expressing Col, qua2 and tsd2 genotypes in a chamber with a large cover glass at the bottom, two seedlings
spaced 10 mm apart in 40 µL of water, and a smaller cover glass on top. A balance weight was gently placed
on the top coverslip to apply external pressure to the seedlings for 10 s before imaging. Z-series images from
top, middle, and basal hypocotyl cells of 3-day-old etiolated seedlings were analyzed. With an applied force
of 0.49 N, cells showed fragmented microtubules with a frequency of 61.8% and 60.7% in the top of
hypocotyls, and 52.8% and 71.4% in the middle of hypocotyls of qua2 and tsd2 seedlings, respectively, and
microtubules were fragmented in all basal hypocotyl cells in both mutants, whereas microtubules remained
relatively intact in the top and middle hypocotyl cells, with fewer cells exhibiting microtubule fragmentation
in basal hypocotyls of Col seedlings (Figure 7D; Supplemental Figure 7A). When a force of 0.98 N was
applied, almost all cells in all three regions of qua2 and tsd2 mutants exhibited fragmented microtubules,

12
whereas fewer cells had fragmented microtubules in Col hypocotyls (Supplemental Figure 7B). Together,
these data imply that mutations in QUA2 result in microtubules that are more sensitive to oryzalin treatment
and mechanical stress.
Mutations in QUA2 Result in Altered Expression of Wall Synthesis and Integrity-Sensing Genes
To examine the effects of disruption of cell wall biosynthesis and organization in qua2 and tsd2 mutants at
the transcriptional level, we measured transcript levels of genes related to pectin and cellulose biosynthesis
by quantitative real-time PCR (qPCR) (Table 1). Expression of some pectin biosynthesis genes, including
GAE1, GAUT1, GAUT7 and GAUT12, was significantly downregulated, although GAUT8 and GAUT15
expression did not change, whereas genes encoding two pectin-interacting extensins, EXT3 and EXT4 (Cannon
et al., 2008), were upregulated. FAD-LINKED OXIDOREDUCTASE (FADLOX), a gene involved in stress
response and Ca2+ signaling (Verger et al., 2016), had higher transcript abundance in both mutants. The pectin
modification gene PME35 (Hongo et al., 2012) had decreased expression. All three major CESA genes that
function in primary wall biosynthesis, CESA1, CESA3, and CESA6, along with COBRA and CSI1, were
significantly downregulated. The effects of mutation of QUA2 on transcriptional regulation of microtubule
stability and wall integrity signaling were also investigated using qPCR (Table 1). Several microtubule-related
genes, including MAP70-1, MAP70-5, CLASP, FRAGILE FIBER1 (FRA1) and KATANIN1 (KTN1) (Korolev
et al., 2005; Stoppin-Mellet et al., 2006; Ambrose et al., 2007; Korolev et al., 2007), were significantly
downregulated in both mutants, and MAP20 had lower expression in qua2 but not tsd2. However, the
expression levels of MAP65-1 did not differ significantly among all three genotypes. Receptor kinases,
including FERONIA (FER), HERKULES1 (HERK1), THESEUS (THE1), KINESIN13A (KIN-13A), FEI1
and FEI2 have been termed cell wall sensors (Hematy and Hofte, 2008; Xu et al., 2008; Guo et al., 2009). All
of the above genes were significantly downregulated in both mutants, whereas all five WALL ASSOCIATED
KINASE (WAK) genes (Kohorn and Kohorn, 2012) except WAK3 were downregulated in the tsd2 mutant, but
not in the qua2 mutant (Table 1). These data imply that cells respond to the disruptions in wall structure
induced by mutations in QUA2 by reducing the synthesis of both pectin and cellulose, increasing the
expression of wall-related structural proteins, and dampening wall integrity signaling.
DISCUSSION
Previous studies have determined that pectic HG is methylated in the Golgi apparatus before being secreted
into the cell wall (Goubet and Mohnen, 1999). Methyltransferase activity has been detected in Golgi-enriched
fractions and isolated microsomes, and the catalytic domains of putative methyltransferases face the Golgi
lumen (Goubet and Mohnen, 1999; Ibar and Orellana, 2007; Miao et al., 2011; Kim et al., 2015). A series of
putative methyltransferases have been identified, including QUA2/TSD2, QUA3, CGR2, and CGR3 in
Arabidopsis and their homologs in other species, but none of them has yet been characterized for enzymatic

13
activity in vitro. In this study, we heterologously expressed QUA2 in E.coli and purified it to homogeneity.
The in vitro methyltransferase activity of QUA2 was confirmed using de-methylesterified HG (PGA) as a
substrate and a sensitive and robust method to test for methyltransferase activity (Hsiao et al., 2016). These
data reveal the molecular function of QUA2 as a functional HG methyltransferase in vitro (Figure 1).
We also analyzed two mutant alleles of QUA2, qua2 and tsd2, which result from mutations at different
positions in the QUA2 gene, and found that tsd2 mutants display more severe phenotypes such as shorter
hypocotyls and smaller plants (Figure 2 and Supplemental Figure 2). The tsd2 mutation disrupts the first exon
of QUA2, possibly leading to more severe effects on protein function than the qua2 lesion, which resides in
the seventh exon (Supplemental Figure 1). Previously, it was found that extractable HG-derived GalA from
cell walls of qua2 leaves was 50% lower than in wild type controls (Mouille et al., 2007). Our data confirmed
lower GalA levels in monosaccharide composition analyses and lower total uronic acid content in both mutant
alleles, although the estimated degree of pectin methylesterification did not show significant changes in
etiolated seedlings of qua2 or tsd2 mutants (Figure 3). These data suggest at least three possible scenarios:
first, mutations in QUA2 might inhibit HG biosynthesis without altering HG methylesterification. Second, HG
in qua2 and tsd2 mutants might be secreted with a lower degree of methylesterification and therefore be
subject to faster degradation in the apoplast. Third, given that galacturonosyltransferases (GAUTs) and
putative pectin methyltransferases (PMTs) can coexist in protein complexes, presumably to coordinate the
synthesis of highly methylesterified HG (Atmodjo et al., 2013), loss of active QUA2 from HG-biosynthetic
complexes that normally contain this protein might result in loss-of-function for those complexes, leading to
reduced overall HG synthesis, but unchanged degree of methylesterification in the remaining HG synthesized
by other complexes.
In the plant cell wall, different structural components interact with each other to form a unified, multi-network
architecture. Hence, it is likely that a defect in one constituent will affect the structure and assembly of other
wall components. The extensive interaction of HG with cellulose detected by solid-state NMR highlights the
potential for this interaction to help define the structure and function of plant cell walls (Dick-Perez et al.,
2011), although pectins do not competitively bind to cellulose with as much affinity as xyloglucan in vitro
(Zykwinska et al., 2008). Pectic RG-I has also been shown to interact with cellulose (Zykwinska et al., 2005;
Broxterman and Schols, 2018). Both pectin and cellulose play important roles in the assembly of cell walls
during cell expansion, but it has remained unclear whether and how pectic polysaccharides might influence
cellulose biosynthesis and microfibril deposition. Here, we used the pectin-deficient mutants qua2 and tsd2 to
explore the effects of pectin deficiency on cellulose synthesis and wall organization using different
microscopy techniques including spinning disk confocal microscopy, SFG, AFM, and FESEM. We found that
cellulose synthesis was inhibited with reduced crystalline cellulose content, lower speed of CESA particles in
the plasma membrane, and altered fibril organization in the walls in qua2 and tsd2 mutants compared to Col
controls (Figures 4 and 5, and Supplemental Movie 1). These observations provide evidence to support the
14
idea that pectins influence the deposition of cellulose in the wall, which is also supported by the fact that
CESA-overexpressing plants contain higher cellulose and pectin levels (Hu et al., 2018). Studies of physical
interactions between wall components have largely focused on hemicellulose–cellulose interactions, while
pectin–cellulose interactions have long been under-studied. To help fill in this gap, we investigated wall
dynamics using NMR in qua2 and tsd2 mutants and wild type controls (Figure 6). The results showed that the
partial reduction in pectin might facilitate stronger interactions between pectic polysaccharides and cellulose,
since an increased molecular mobility was detected for both classes of wall polymers in both mutants. Future
experiments investigating the detailed molecular interactions between pectin subtypes and cellulose in wild
type and qua2/tsd2 mutant walls should provide even more information about how pectin influences cellulose
mobility in the wall, and vice versa.
By constituting a shape-constraining and anisotropic extracellular matrix, the cell wall regulates cellular and
tissue mechanics during plant growth and development. Cellulose has been hypothesized to be the
predominant mechanical actor in the cell wall, but matrix polysaccharides are emerging as important
mechanical regulators as well. As the major hemicellulose in eudicot cell walls, xyloglucan has been
demonstrated to influence cell wall mechanics and plant growth and to functionally interact with cellulose
(Miedes et al., 2013; Xiao et al., 2016). Pectins have also been shown to influence plant mechanics during
growth due to their unique physical and chemical properties (Peaucelle et al., 2011; Peaucelle et al., 2015;
Bou Daher et al., 2018). Compared to wild type controls or the highly aligned and bundled fibrils in top
hypocotyl regions of xxt1 xxt2 mutants (Xiao et al., 2016), the apparent structure of the cell wall in qua2 and
tsd2 hypocotyls observed here was very different: fibrils in untreated qua2 walls seem thicker, possibly
representing bundled cellulose, or cellulose coated with remaining pectins (Figure 5C and 5D), and both qua2
and tsd2 mutants displayed thinner, more crooked, and more randomly distributed fibrils after removal of
pectin by pectate lyase treatment (Figure 5E to 5G). We also observed fragmented fibrils after pectate lyase
treatment in qua2 and tsd2 mutants (Figure 5E), suggesting that CMFs in the mutants might be more fragile
and more sensitive to pectin removal. An alternative possibility is that normal cellulose–pectin interactions in
the WT reduce cellulose mobility (Figure 6), and this stabilizing effect is diminished when HG structure is
disrupted in the mutant. Evidence for pectin stabilization of cellulose can be seen in the increases of cellulose
microfibril mobility after treatments that soften HG (Zhang et al., 2019). Porous features in the walls of tsd2
hypocotyls after pectate lyase application (Figure 5E) are in keeping with a posited function of HG in
determining the extent of wall porosity (Baron-Epel et al., 1988). Defective HG in both qua2 and tsd2 also
apparently enhances molecular mobility in the wall and promotes interactions of the remaining pectin with
other wall components such as cellulose in order to maintain wall structural integrity (Figure 5 and Figure 6).
As the results show, tsd2 displays more severe phenotypes in general than qua2, including reduced hypocotyl
length, dwarf adult plants and adhesion defects. However, the NMR data in the qua2 mutant show the highest
molecular mobility, implying strong interactions between pectin and cellulose in this mutant. Given that
cellulose exists as stiff fibrils in the wall, the enhanced mobility of cellulose in the mutants might result from

15
its increased interaction with dynamic pectin molecules. It is evident that mutation of QUA2 leads to reduced
HG and cellulose synthesis, and remodeled polymer interactions. The above evidence underscores the
functional interactions between pectin and cellulose, and the effects of pectin defects on cellulose deposition
and wall assembly.
Previous studies have shown that the defects in cellulose synthesis affect the alignment of cortical
microtubules (Paredez et al., 2008). Additionally, microtubule patterning and stability are aberrant in xxt1 xxt2
hypocotyls that lack detectable xyloglucan (Xiao et al., 2016). Pectin modification might trigger mechanical
and growth symmetry breaking, subsequently resulting in cortical microtubule reorientation (Peaucelle et al.,
2015). On the other hand, tubulin perturbation also affects pectin deposition during cell wall formation
(Swamy et al., 2015). Additionally, cortical MTs respond to mechanical signals concomitant with the
alteration of MT orientation (Hamant et al., 2008). These findings imply close coordination between cell wall
synthesis, wall mechanics, and microtubule behavior. Given reduced pectin and cellulose content in qua2 and
tsd2 plants, we sought to investigate microtubule organization and dynamics in these mutants. In different
regions of qua2 and tsd2 hypocotyls, compared with wild type controls, microtubules display altered
orientation (Figure 7A and 7B). Compared to the more longitudinal microtubules in middle regions in xxt1
xxt2 hypocotyls (Xiao and Anderson, 2016), the microtubules in qua2 and tsd2 hypocotyls were more
transverse relative to the cell elongation axis, which might be due to cell swelling caused by defects in cell
adhesion. Microtubules in qua2 and tsd2 hypocotyl cells were more sensitive to oryzalin treatment (Figure
7C). This suggests either that the drug gets to the microtubules more quickly in the qua2 and tsd2 hypocotyl
cells, or that the microtubule polymerization process itself is perturbed in qua2 and tsd2 mutants (Rajangam
et al., 2008). Microtubules in qua2 and tsd2 hypocotyl cells were also more sensitive to mechanical stress
(Figure 7D), underscoring the role of microtubules in mechanical responsiveness (Hamant et al., 2019).
Accordingly, these data indicate a potential role for QUA2 in microtubule formation. A recent study reported
alteration of tension stress patterns due to mechanical discontinuity of the epidermis in a mutant of QUA1,
which encodes a putative pectin synthetic protein, leading to the disruption of MT alignment with the direction
of maximum tensile stress (Verger et al., 2018). It is possible that the alteration of MT alignment we observed
in qua2 and tsd2 mutants is due to epidermal discontinuity in these mutants, which disrupts the transduction
of tensile stress across the epidermis. However, we cannot rule out other causes of microtubule disruption
triggered by pectin and cellulose deficiency in the mutants.
Plants respond to internal cues such as turgor pressure and growth factors, and external environmental cues
such as light, temperature and pathogen infection through cell wall remodeling under the control of cell wall
integrity signaling pathways. Pectin is involved in maintaining cell wall integrity (Bouton et al., 2002;
Krupkova et al., 2007; Mouille et al., 2007; Neumetzler et al., 2012; Liu et al., 2013). However, it has not yet
been clearly defined how pectin might interface with wall integrity-signaling pathways. To begin to answer
the question of whether wall deficiency in the absence of QUA2/TSD2 function perturbs wall integrity
16
signaling, we investigated the expression of cell wall integrity related genes by qPCR: FER, HERK1, FEI1,
FEI2, KIN13A, and THE1 had lower expression levels in qua2 and tsd2 mutants (Table 1). FER is thought to
sense cell wall integrity and mechanical stress on the plasma membrane (Cheung and Wu, 2011; Lindner et
al., 2012). The extracellular domain of FER has been shown to interact with pectin in vitro, suggesting that
pectin might function as a ligand of FER (Feng et al., 2018). Although functional interaction between FER
and pectin in vivo remains to be determined, FER might perceive wall integrity signals through its interaction
with pectin. Arabidopsis WAK receptors can bind to pectin in cell walls, and are required for cell expansion
during plant development (Kohorn and Kohorn, 2012). In tsd2, the expression levels of several WAK genes
(Table 1) were reduced, although there was no significant change in WAK expression in the qua2 mutant. A
previous study showed that mechanical stimuli can induce extensin gene expression (Tire et al., 1994). In our
data, the expression of EXT3 and EXT4 was increased in qua2 and tsd2 mutants, implying a potential alteration
of extensin–pectin interactions (Cannon et al., 2008). Taken together, many genes related to wall integrity
sensing are downregulated in qua2 and tsd2 mutants, indicating that stimuli resulting from changes in wall
structure and mechanics might activate signaling involved in cell wall integrity maintenance, resulting in
feedback-mediated downregulation of the cognate genes.
It has remained elusive why reduction in pectin content sometimes causes cell adhesion defects. In qua2 and
tsd2 mutants, cell adhesion defects might be directly attributable to lower HG levels, whereas another mutant
with cell adhesion defects, friable1, does not display a significant decrease in pectin content, although
mutation of FRIABLE1 affects pectin methylesterification (Neumetzler et al., 2012). However, a reduced
degree of pectin methylesterification has not been reported to cause cell adhesion phenotypes in Arabidopsis
double mutants for the putative methyltransferases CGR2 and CGR3 (Kim et al., 2015). The suppressor
mutation esmeralda1 (esmd1) rescues adhesion defects in qua1, qua2 and frb1, but does not restore pectin
content, suggesting that cell adhesion defects might result from altered pectin-related feedback signaling from
the state of the pectin in the cell wall (Verger et al., 2016). This implies that pectin modulates cell adhesion
via a complicated mechanism potentially involving the physical adhesion between pectin molecules, pectin
interactions with other wall components, pectin metabolism, and/or related signaling pathways. In addition to
pectins, other wall components such as hemicelluloses might also function in cell adhesion (Ordaz-Ortiz et
al., 2009).
Considering different cellular signaling pathways, it is worthwhile to ask whether there is a change in pectin
structure and/or crosslinking in qua2 and tsd2 mutants that triggers calcium-mediated signal transduction.
Calcium (Ca2+) can crosslink de-methylesterified HG molecules into macromolecular networks, increasing
wall stiffness (Vincken et al., 2003), which implies that changes in Ca2+ concentration might disrupt the
integrity of pectin networks to further influence wall mechanical properties. Ca2+ ions can also act as second
messengers, functioning in the response of plants to environmental cues (Riveras et al., 2015; Wilkins et al.,
2016). In qua1 mutants, the concentration of Ca2+ was dramatically increased in the cytosol, indicating the

17
role of QUA1 in regulating cytoplasmic Ca2+ signaling (Zheng et al., 2016). FADLOX expression has been
shown to respond to Ca2+-dependent protein kinases (CDPKs), which are Ca2+ sensors (Boudsocq et al., 2010).
In addition, Ca2+ is involved in the interactions of pectins with cellulose (Lopez-Sanchez et al., 2017). In qua2
and tsd2 mutants, wall synthesis was inhibited and FADLOX expression was induced, suggesting that
alteration in wall structure might activate Ca2+ signaling in response to disruption of wall integrity, although
this idea needs to be explored further.
In summary, we propose a schematic for how pectin deficiency in qua2 and tsd2 mutants might affect pectin
homogalacturonan biosynthesis, cellulose biosynthesis, wall integrity, and microtubule stability (Figure 8). In
qua2 and tsd2 mutants, the absence of a pectin methyltransferase, QUA2, hampers the biosynthesis of pectic
HG in the Golgi and decreases its accumulation in the wall, and the consequent alteration of wall structure
influences the activity of plasma membrane-localized cellulose synthase complexes (CSCs). Loss of wall
integrity destabilizes cortical microtubules (MTs), further decreasing the aligned deposition of cellulose in the
wall. As pectin is reduced in mutants, the orientation of cellulose microfibrils that interact with pectins is
changed, concomitant with increased molecular mobility of both cellulose and pectin. The experimental
application of pectate lyase (PL), which removes matrix polysaccharides, reveals thinner, more easily
fragmented fibrils in the mutants, suggesting that cellulose structure might be fundamentally altered, as
supported by our SFG data. Finally, the disruption of wall structure likely triggers changes in wall integrity
signaling to respond to the deficiency of pectin and/or cellulose biosynthesis during plant developmental
processes.
METHODS
Plant Materials and Growth Conditions
Arabidopsis (Arabidopsis thaliana) ecotype Colombia (Col), qua2 (qua2-1) and tsd2 (tsd2-1) mutants, a gift
from Tanya Falbel (University of Wisconsin), were used in this study. Transgenic plants expressing GFP-
CESA3 (Desprez et al., 2007), GFP-MAP4 (Marc et al., 1998) and QUA2pro-GUS, respectively, were generated
using the Agrobacterium-based floral dipping method (Clough and Bent, 1998) with Agrobacterium
tumefaciens strain GV3101. Positive transformants were screened on MS plates containing 2.2 g/L MS salts
(Caisson Laboratories), 0.6 g/L MES (2-N-morpholino-ethanesulfonic acid; Research Organics), 1% (w/v)
sucrose, and 0.8% (w/v) agar-agar (Research Organics), 25 mg/mL hygromycin (Omega Scientific), pH 5.6.
Seedlings were transplanted from MS plates to soil for growth under a photoperiod of 16 h white fluorescent
light (4100K, 150–200 μmol m−2 s−1)/8 h dark in a 22°C growth chamber.
18
Protein Expression and Purification
The catalytic domain of QUA2 (150 aa–684 aa) was subcloned into pMBP-parallel2 by PCR. The construct
containing the QUA2 catalytic domain with an N-terminal 6xHis-MBP tag was transformed and expressed in
Escherichia coli strain BL21 (DE3) cells. After induction with 0.2 mM IPTG overnight at 16°C, the cells were
pelleted at 4000 g for 10 minutes at 4°C. The pellets were lysed in a buffer containing 25 mM HEPES, pH
7.5, 150 mM NaCl, 0.5 mM TCEP-HCl, 250 mM sucrose, and 1 mM PMSF by French Press. The lysate was
then centrifuged at 25,000 g for 30 min at 4°C. The supernatants were loaded onto amylose resin using gravity
columns at 4°C, which was subsequently washed three times with a buffer containing 25 mM HEPES, pH 7.5,
150 mM NaCl, 0.5 mM TCEP-HCl and 250 mM sucrose. Then 10 mM maltose was added to the washing
buffer and used to elute target proteins. The target proteins were further purified on a Superdex200 10/30 (GE
Healthcare) column equilibrated with 25 mM Tris-HCl, pH 8.0, 150 mM NaCl, 250 mM sucrose, and 2 Mm
dithiothreitol (DTT). The peak fractions were pooled and snap-frozen in liquid nitrogen for storage.
The purified MBP (negative control) and MBP-QUA2 proteins were resolved on 12% SDS-PAGE gels and
then stained with Coomassie Blue or immunolabeled with anti-polyhistidine. For immunoblot analysis,
separated proteins were transferred onto nitrocellulose membranes (GE Healthcare) in a BioRad Mini-
Transfer Cell at 100 V for 60 min. After blocking in Tris Buffered Saline with Tween 20 (TBST: 25 mM Tris
base, 150 mM NaCl, and 0.1% Tween 20, pH 7.5) containing 5% non-fat milk for 30 min, the membrane was
incubated overnight with a monoclonal anti-polyhistidine primary antibody (Sigma-Aldrich, Cat#H1029,
1:5000). Then the membrane was washed for three times in TBST buffer and incubated with alkaline
phosphatase-conjugated goat anti-mouse secondary antibody (Sigma-Aldrich, Cat#A9316, 1:5000) for 30 min.
After thorough washing, membrane was developed in 5-bromo-4-chloro-3'-indolyphosphate p-toluidine salt
(BCIP)/nitro-blue tetrazolium chloride (NBT) substrate solution (Amresco).
Enzymatic Activity Assay
The methyltransferase assay was performed by incubating the purified MBP-QUA2 catalytic domain or MBP
alone (negative control) in the buffer containing 50 mM HEPES, pH7.5, 2 mM MgCl2, 0.25 M sucrose, 10
μM SAM (Promega) and 50 μg polygalacturonic acid (PGA, Sigma-Aldrich, Cat#81325) at 30°C for 2 hours.
The PGA substrate was dissolved in 37.5 mM sodium acetate and the pH was adjusted to 7.5. After completion
of the reaction, the reaction product, SAH, was monitored using the MTase-GloTM Methyltransferase Assay
kit (Promega) according to the manufacturer’s directions. Briefly, 20 μL reaction products were transferred
into a Corning 96-well white plate and mixed with 5 μL 5X MTase-GloTM reagent, which converts SAH into
ADP. After the addition of 25 μL MTase-GloTM Detection Solution, the generated ADP was converted into
ATP which was monitored by a luminescent reaction. Luminescence was recorded using a plate-reading
luminometer (Synergy H1 microplate reader, BioTek). The change in luminescence represents background-

19
subtracted luminescence. For time- and concentration-dependent enzyme assays, the indicated reaction times,
protein or PGA concentration were applied. Upon reaction completion, 5 μL of 0.5% (v/v) trifluoroacetic acid
(TFA, Sigma-Aldrich, Cat#T6608) was mixed with 20 μL reaction product to stop the reaction. To test the
substrate specificity of QUA2, alginate (Sigma-Aldrich, Cat#A1112) and starch (Sigma-Aldrich, Cat#S9765),
two other polysaccharides, were individually added to reactions.
Immuno Dot Blot Analysis
Immuno dot blotting was performed as previously described with minor modifications (Perez-Perez et al.,
2019). Aliquots of 3 μL of reaction products were spotted onto nitrocellulose membranes (GE Healthcare)
and allowed to air dry for 1 h. The membrane was blocked with TBS containing 1.5% (w/v) non-fat milk.
Subsequently, the membrane was incubated with a primary antibody (Agrisera; JIM5, Cat#AS184194; JIM7,
Cat#AS184195; 1:100) in blocking solution for 2 h at room temperature. After washing three times in TBS,
the membrane was incubated with peroxidase-conjugated goat anti-rat secondary antibody (SeraCare;
Cat#5220-0364; 1:1000) for 1 h. After washing three times in TBS, the blot was developed using western
ECL substrate solution (Bio-rad; Cat#170-5060). The experiment was replicated three times.
Measurements of Hypocotyl Length and Width, Rosette Diameter and Plant Height
Seeds were surface-sterilized in 30% bleach + 0.1% (w/v) SDS, washed four times with sterile water, stored
at 4°C for 3 days, and sown on MS plates without sucrose. After exposure to light for 2–4 h to stimulate seed
germination, seedlings were grown in the dark for 2 to 6 days at 22°C. Plates with etiolated seedlings were
scanned using an HP Scanjet 8300 scanner at 600 dpi, and hypocotyl length was measured using ImageJ.
Hypocotyl width was recorded on a Zeiss Observer SD spinning disk confocal microscope with a 20´
objective, and quantified in ImageJ. Adult plants were imaged using a digital camera (Nikon D5100 DSLR).
Rosette diameters, petiole length and leaf area were measured in ImageJ, and plant height was measured using
a ruler.
Preparation of Alcohol Insoluble Residue (AIR)
Seedlings growing in the dark for 6 days were harvested and ground into a fine powder in liquid nitrogen with
a mortar and pestle. The powder was suspended in 30 mL 1:1 chloroform/methanol (v/v) with shaking for 1
h at room temperature. After precipitation by centrifugation at 4500 g for 10 min at room temperature, the
residue was washed four times in 70% ethanol by resuspension and centrifugation at 4500 g for 10 min at
room temperature. The final alcohol insoluble residue was suspended and centrifuged at 4500 g for 10 min at
room temperature in 100% acetone and air-dried in a chemical fume hood at room temperature (Fry, 1988).

20
Measurements of Uronic Acids and Methanol Release
For measurements of total uronic acids (Filisetti-Cozzi and Carpita, 1991), AIR was extracted from 6-day-old
dark-grown seedlings. Samples with 1 mg AIR were suspended in 141 μL of water in a glass tube. 14 μL of 4
M sulfamic acid (Fisher Scientific)-potassium sulfamate (pH 1.6) was added and mixed thoroughly. Then 845
μL concentrated H2SO4 containing 75 mM sodium tetraborate (Sigma-Aldrich) was added, and the solution
was mixed vigorously by vortexing for 10 s. The solution was heated in a boiling water bath at 100°C for 5
min. After cooling down samples in a room temperature water bath, an aliquot of each sample was diluted 50-
fold by adding 20 μL of sample to 980 μL of 85% (v/v) H2SO4. After thorough mixing, initial absorbance at
525 nm was recorded in a plastic cuvette using a NanoDrop 2000C spectrophotometer. An aliquot of 28 μL
of 0.15% (w/v) m-hydroxydiphenyl (Sigma-Aldrich) in 0.5% (w/v) NaOH was added to the diluted sample
and mixed by inversion, and the mix was allowed to incubate at room temperature for 5 min before absorbance
was measured at 525 nm. D-Galacturonic Acid (Sigma-Aldrich) was used as a standard to calculate
concentrations.
To measure released methylesters (Muller et al., 2013), approximately 1 mg AIR was weighed out for each
experiment. After washing in 1 mL water and centrifugation at 21,130 g for 10 min at room temperature, 400
μL of 0.5 M NaOH was added to samples to incubate at room temperature for 1 h to release methylesters, and
then 200 μL 1M HCl was added and mixed by vortexing for neutralization. Samples were centrifuged at 2400
g for 10 min at room temperature and 125 μL of supernatant was added to 125 μL 20 mM HEPES buffer (pH
7.5). Samples were oxidized in 250 μL HEPES buffer containing 0.03 U alcohol oxidase (Sigma-Aldrich)
with shaking for 15 min at room temperature. An aliquot of 250 μL of assay buffer (20 mM acetyl acetone,
50 mM acetic acid, 2 M ammonium acetate) was then added to each sample and incubated at 60°C for 15 min.
After the solution was cooled in a room temperature water bath, absorbance at 412 nm was measured using a
NanoDrop 2000C spectrophotometer. Methanol was used for a standard curve to calculate total methylester
content. Assuming that methanol was released primarily from HG, the degree of HG methylesterification was
estimated by dividing nmol of released methanol by nmol of uronic acids in the same amount alcohol insoluble
residue (AIR). Note that this is an indirect estimate of the true degree of HG methylesterification, and depends
on two independent assays, one for uronic acid content and the other for methylester release.
Monosaccharide Composition Analysis
The monosaccharide analysis protocol was derived from (De Ruiter et al., 1992). For each experiment, 1 mg
of ground AIR sample and 500 μL of 3 N methanolic hydrochloric acid (Supelco Cat#33051) were mixed and
incubated at 80°C for 16 h, cooled on ice, and dried with filtered air at room temperature. An aliquot of 200
μL of 2 M trifluoroacetic acid was added and mixed thoroughly with dried wall residue for hydrolysis,
incubated at 121°C for 2 h, and cooled on ice. The samples were centrifuged at 14,000 g for 5 min at room
21
temperature and air-dried. The samples were then resuspended with ddH2O and filtered with 0.2 μm Millex-
LG syringe-driven filter units (Cat#SLLGR04NL) and analyzed by high-performance anion exchange
chromatography with pulsed amperometric detection (HPAEC-PAD) on a CarboPac PA20 column at a flow
rate of 0.5 mL/min (Dionex ICS-5000 Capillary Reagent-Free IC System, ThermoScientific). The column was
first eluted with 10 mM sodium hydroxide for 15 min and then ramped to an equal mixture of 100 mM sodium
hydroxide and 100 mM sodium acetate over 25 min. Sugar monosaccharide composition was quantified based
on peaks in the samples using standards (Fuc, Rha, Ara, Gal, Glc, and Xyl at 100 mg/mL; galacturonic acid
and glucuronic acid at 1 mg/mL, Sigma-Aldrich).
Cellulose Content Measurements
Tissue from 6-day-old dark-grown seedlings and 4-week-old rosette leaves from Arabidopsis Col, qua2 and
tsd2 genotypes were used to measure crystalline cellulose content following a procedure (Xiao et al., 2016)
based on the Updegraff method (Updegraff, 1969).
Sum Frequency Generation (SFG) Imaging
Etiolated six-day-old seedlings of Arabidopsis Col, qua2 and tsd2 genotypes were harvested and immersed in
D2O overnight in the dark for water exchange before SFG analysis. Ten to fifteen seedlings were grouped and
aligned closely into a bundle on a glass coverslip. After adding D2O, another glass coverslip was added on the
top to seal the sample and keep the seedlings wet. Three regions from the top, middle and base of each set of
hypocotyls were analyzed, and two SFG spectra at each location were collected in longitudinal and transverse
directions relative to the hypocotyl growth axis. Due to spatial variability across the samples, SFG spectra
from nine locations of each hypocotyl region were collected and averaged for each region. The hydroxyl/alkyl
(OH/CH) area ratio was calculated by dividing the OH peak area (3150 cm–1 to 3700 cm–1) with the CH peak
area (2700 cm–1 to 3050 cm–1) for each SFG spectrum.
In the SFG system, two high-intensity femtosecond laser pulses with wavelengths at 800 nm and tunable
infrared region (2.5–10 µm) were synchronized and overlapped on the samples. The 85 fs, 800 nm output
pulses were generated at 2 kHz from a chirped pulse amplification system (Coherent, Libra) with a set of
Ti:sapphire oscillator/amplifiers using an 80 kHz laser running at 20 fs and pumped by a frequency-doubled
Nd: YLF diode-pumped laser producing 250 ns, 527 nm pulses at 2 kHz. By splitting the 800 nm output, 75%
of the output was used to generate a tunable infrared line through an OPG/OPA system (Coherent, Opera Solo)
equipped with a non-linear difference frequency generation (NDFG) stage, and the remaining 25% of the
pulses passed through a pair of angle-tuned Fabry-Pérot etalons (TecOptics, Merrick, NY) for spectral
narrowing. Both the p-polarized infrared and the s-polarized visible laser were overlapped at the sample
surface at an incidence angle of 45° with respect to the surface plane. The s-polarized SFG signal was selected
and detected in the transmission geometry. The SFG signal was filtered with a 775 nm short-pass filter,

22
dispersed with a volume-phase holographic (VPH) grating (Andor, Holospec), and then detected with a back-
illuminated deep-depletion charge-coupled device (CCD) camera (Andor, DU420A-BEX2-DD). The probe
size of the SFG system was estimated to be approximately 120 µm along the laser incidence plane direction
and approximately 80 µm perpendicular to the incidence plane. The probe depth was measured to be
approximately 20–25 µm from the top external surface of the sample. SFG spectra were obtained by stitching
multiple NDFG spectra together because each NDFG setting only provides an IR profile with 150–200 cm–1
bandwidth. SFG spectra for cellulose need to be collected from 2700 cm–1 to 3700 cm–1. After stitching, each
SFG spectrum was normalized by the incident IR profile with the same frequency region (Lee et al., 2016).
Atomic Force Microscopy
AFM sample preparation and imaging followed (Xiao et al., 2016) with minor modifications. Seedlings were
grown in the dark at 22°C for 3 d before harvesting hypocotyls. Tissues were ground in liquid nitrogen and
rinsed in 20 mM HEPES (pH 7.0) with 0.1% Tween 20 at least three times with spinning in between rinses
until the supernatant was clear. A volume of fresh buffer equaling 150 µL was added to the pellet and vortexed.
The tubes were spun down, supernatant removed, and 100 µL of fresh buffer was added. Tubes were put on a
rocker for 30 min to wash and disperse the pellet thoroughly. A final spin was done to remove the supernatant
and 50 µL of 20 mM HEPES, pH 7.5 buffer with no detergent was added to the pellet and mixed. Drops of 5
µL suspension were placed on glass slides and allowed to dry almost completely to aid in sticking the cuticle
sides of cells to the glass. Slides were gently rinsed with 20 mM HEPES buffer to remove unbound material.
AFM imaging was performed on a Dimension Icon system with a NanoScope V controller (Bruker
Corporation, Santa Barbara, CA) using the PeakForce QNM program under fluid conditions. A ScanAsyst
Fluid+ tip was calibrated using software to determine deflection sensitivity and spring constant. The AFM
system is contained inside a vibration isolation hood (Technical Manufacturing Corporation, Peabody, MA)
to reduce noise interference and allow for high resolution images of biological materials. PeakForce QNM
scanning parameters were controlled by the ScanAsyst software for most settings to achieve the best resolution
for both topography and peak force error images, except for the scan rate, which was set to 0.8 Hz, and the
peak force, which was set to 800 pN. Samples were imaged at a size of 2 ́ 2 µm with 512 ́ 512 pixels. Images
were processed in Nanoscope Analysis 1.8v software (Bruker Corporation) and exported as TIFs.
Field Emission Scanning Electron Microscopy (FESEM)
FESEM experiments were performed in apical hypocotyls from 3-day-old dark-grown seedlings without or
with 10 µg/mL pectate lyase treatment (Megazyme E-PLYCJ, Lot 130901a) following the protocol described
in (Xiao et al., 2016) except that the critical point dryer used in this experiment was a manually operated BAL-
TEC CPD030.

23
13C-Labeling and Solid-State NMR Analysis
Never-dried primary cell walls were prepared as in (Wang et al., 2015): Arabidopsis seedlings were grown in
dark for 14 days using a liquid medium with 13C-labeled glucose as the sole carbon source. Seedlings were
harvested, frozen, and ground in liquid nitrogen. The resulting materials were then washed with 1.5% SDS
for 3 h, treated with amylase, and washed with water to remove starch, cell membranes and proteins and
deactivate enzymes. To inhibit microbial contamination, 0.02% (w/v) NaN3 was used in all solutions. Bulk
water was removed by centrifugation at 4500 g for 1 h at room temperature (White et al., 2014). For each
sample, ~80 mg of hydrated seedlings was packed into a 4-mm magic-angle spinning (MAS) NMR rotor for
measurements. Solid-state NMR experiments were conducted on a 400-MHz Bruker AVANCE spectrometer
at 9.4 Tesla using a 4-mm MAS probe. Typical radiofrequency field strengths were 62.5 kHz for 13C and 62.5
to 83 kHz for 1H. 13C chemical shifts were externally referenced to the adamantane CH2 peak at 38.48 ppm
on the tetramethylsilane (TMS) scale. All spectra were recorded at 298 K under 10 kHz MAS frequency. 1D 13C spectra were measured using 13C direct polarization (DP) with a long recycle delay of 35 s for
quantitatively detecting all polysaccharides, whose 13C-T1 relaxation times are well below 6 s in uniformly 13C-labeled plant samples (Wang et al., 2015), and a short recycle delay of 2 s for selecting mobile molecules
with short relaxation times. The intensity ratios between these two spectra represent the relative mobility of
cell wall molecules.
Confocal Microscopy
Imaging experiments were performed according to (Xiao et al., 2016). Seedlings were placed in 40 μL water
in a chamber composed of a microscope slide and coverslip separated by two pieces of double-stick tape. For
pressure experiments, an additional chamber was designed with a smaller cover glass on the top with a large
cover glass at the bottom. Images were taken on a Zeiss Observer SD spinning disk confocal microscope with
a 100´ 1.40 NA oil-immersion objective. PI fluorescence was detected with a 561 nm excitation laser and
617/73 nm emission filter. GFP fluorescence was detected using a 488 nm excitation laser and 525/50 nm
emission filter. GFP-CESA3 and GFP-MAP4 images were recorded in hypocotyl cells of dark-grown
seedlings. Time-lapse and Z-series images were analyzed using ImageJ and Imaris (Chen et al., 2010).
Drug Treatments
To analyze hypocotyl elongation after growth on oryzalin (Chem Service N-12729), oryzalin was added into
MS plates at different concentrations, seeds were sown on the plates, and hypocotyl length and width from 6-
day-old dark-grown seedlings were imaged and measured in ImageJ. Drug treatments for live-cell imaging
were identical to those described previously (Xiao et al., 2016). Three-day-old dark-grown seedlings were
submerged in 1 mL liquid ½ MS medium containing 10 µM oryzalin dissolved in DMSO (Sigma) and
incubated in darkness for 10 min to 240 min before imaging with spinning disk confocal microscopy.

24
Gene Expression Detection by Real-time Quantitative PCR
Tissue from three-day-old dark-grown Col, qua2 and tsd2 seedlings was used for total RNA extraction with a
Plant RNA Kit (Omega Bio-Tek). Genomic DNA in samples was removed with RNase-free DNase I (NEB).
RNA concentration was measured by spectrophotometer (NanoDrop 2000C), and first-strand cDNA was
synthesized using qScript cDNA SuperMix (Quanta Biosciences) from DNase I-treated RNA. qPCR was
performed using SYBR Green FastMix (Quanta Biosciences) with cDNA and gene-specific primers on a
StepOne Plus Real-Time PCR machine (Applied Biosystems). The transcript levels of target genes relative to
EF1 as a reference gene were calculated using the DDCT method. Primer sequences are listed in Table S1.
β-Glucuronidase (GUS) Activity Analysis
In addition to measurement of mRNA expression in different tissues by qPCR, the spatial expression pattern
of QUA2 was examined by histochemical analysis. Twenty independent transgenic lines expressing
QUA2pro:GUS were obtained (Primer sequences are listed in Supplemental Table 1), and T2 plants were used
for GUS staining analysis. Tissues were immersed in buffer containing 50 mM sodium phosphate pH 7.2, 0.2%
(v/v) Triton X-100, and 2 mM 5-bromo-4-chloro-3-indolyl-beta-D-glucuronic acid, and
cyclohexylammonium salt (X-Gluc) and incubated at 37°C in the dark for 4–16 h, which was dependent on
the tissue age. Young dark-grown and light-grown seedlings were stained for 4 hours, and flowers, siliques
and stems of 5-week-old QUA2pro:GUS adult plants were stained for 16 hours. Pigment was removed from
tissue with 70% ethanol, and images of GUS staining were recorded using a Zeiss Discovery V12 fluorescence
dissecting microscope.
Statistical Analyses
All experiments were repeated at least twice. Data are represented as averages ± SD or SE, as specified.
Analyses were performed using Student’s t-test (two-tailed) or one-way ANOVA with Tukey test to evaluate
the significant difference, and the P-value thresholds are shown as P < 0.05 or P < 0.001. Statistical results
are available in Supplemental File 1.
Accession Numbers
Sequence data from this article can be found in the Arabidopsis Genome Initiative or GenBank/EMBL
databases under the following accession numbers: CESA1 (At4g32410), CESA3 (At5g05170), CESA6
(At5g64740), CLASP (At2g20190), COBRA (At5g60920), CSI1 (At2g22125), EF1-a (At5g60390), EXT3
(At1g21310), EXT4 (At1g76930), FEI1 (At1g31420), FEI2 (At2g35620), FER (At3g51550), FADLOX
(At1g26380), FRA1 (At5g47820), GAE1 (At4g30440), GAUT1 (At3g61130), GAUT7 (At2g38650),
GAUT8 (At3g25140), GAUT12 (At5g54690), GAUT15 (At3g58790), HERK1 (At3g46290), KIN13A
(At3g16630), KOR1 (At5g49720), KTN1 (At1g80350), MAP20 (At5g37478), MAP65-1 (At5g55230),

25
MAP70-1 (At1g68060), MAP70-5 (At4g17220), PME35 (At3g59010), QUA2/TSD2 (At1g78240), THE1
(At5g54380), WAK1 (At1g21250), WAK2 (At1g21270), WAK3 (At1g21240), WAK4 (At1g21210), WAK5
(At1g21230).
Supplemental Data
Supplemental Figure 1, Related to Figure 2. Schematic Gene Structure of QUASIMODO2.
Supplemental Figure 2, Related to Figure 2. qua2 and tsd2 Plants Are Smaller and Shorter than Wild Type.
Supplemental Figure 3, Related to Figure 2. QUA2pro:GUS Expression Patterns in Different Plant Tissues.
Supplemental Figure 4, Related to Figure 7. Hypocotyls and Microtubules of qua2 and tsd2 Mutants Are
More Sensitive to Oryzalin Treatment.
Supplemental Figure 5, Related to Figure 7. Tissue Integrity in Hypocotyls of qua2 and tsd2 Mutants Is
Sensitive to Oryzalin Treatment.
Supplemental Figure 6, Related to Figure 7. Cortical Microtubules in qua2 and tsd2 Mutants Are More
Sensitive to 10 mM Oryzalin Treatment for 30 min to 240 min.
Supplemental Figure 7, Related to Figure 7. Cortical Microtubules of qua2 and tsd2 Are More Sensitive to
Mechanical Stress.
Supplemental Table 1. Primers Used in This Study.
Supplemental File 1. Detailed Results of Statistical Analyses.
Supplemental Movie 1. GFP-CESA3 particle motility in 3-d-old dark grown Col, qua2, and tsd2 seedlings.
Supplemental Movie Legend. GFP-CESA3 particle motility in 3-d-old dark grown Col, qua2, and tsd2
seedlings.
FUNDING
With the exceptions below, this work was supported as part of The Center for Lignocellulose Structure and
Formation, an Energy Frontier Research Center funded by the U.S. Department of Energy, Office of
Science, Basic Energy Sciences to S.K., D.J.C., and C.T.A (award no. DE–SC0001090). Analysis of QUA2
protein activity was supported by Fundamental Research Funds for the Central Universities to C.X
(YJ20173 and SCU2019D013) and China Postdoctoral Science Foundation to J.D (2018M643465).
AUTHOR CONTRIBUTIONS
J.D., C.X., S.Q., S.K., T.W., D.J.C., and C.T.A. designed the research; J.D., C.X., A.K., L.W., S.H., W.J.B.,
S.N.K., Y.Z., Y.R., and M.R. performed research; J.D., C.X., S.K., T.W., D.J.C., and C.T.A. analyzed data;
J.D., C.X., T.W. and C.T.A. wrote the article.

26
ACKNOWLEDGEMENTS
The authors thank Liza Wilson and Sydney Duncombe for technical assistance with AFM experiments,
Tanya Falbel for providing seeds of qua2 and tsd2 mutants, Richard Cyr for providing the GFP-MAP4
expression construct, and Nicole R. Brown for helpful comments on the manuscript.
DECLARATION OF INTERESTS
The authors declare no competing interests.

27
Table 1. Expression levels of wall and MT-related genes. Detection of mRNA expression levels from 3-day-old
etiolated Col, qua2 and tsd2 seedlings by quantitative RT-PCR. EF1-a was amplified as an internal control. Expression
levels in Col were normalized to 1, and the expression levels of target genes in qua2 and tsd2 seedlings were calculated
relative to these values. Data present average and standard deviation (SD, n = 3 technical replicates). Asterisks indicate
significant differences (*P < 0.05, **P < 0.001, t-test). See also Supplemental Table 1. Gene Name Relative Expression
qua2 tsd2 Cellulose synthesis-related genes CESA1 0.58 ± 0.05** 0.48 ± 0.01** CESA3 0.69 ± 0.03* 0.51 ± 0.06* CESA6 0.50 ± 0.03* 0.43 ± 0.02** KOR1 0.42 ± 0.02** 0.33 ± 0.03** COBRA 0.72 ± 0.04* 0.70 ± 0.02* CSI1 0.54 ± 0.02** 0.42 ± 0.01** MT-related genes MAP20 0.59 ± 0.09* 0.86 ± 0.12 MAP65-1 0.91 ± 0.02 0.87 ± 0.03 MAP70-1 0.62 ± 0.04** 0.58 ± 0.01** MAP70-5 0.22 ± 0.01** 0.26 ± 0.02** CLASP 0.57 ± 0.05** 0.41 ± 0.04** FRA1 0.46 ± 0.01** 0.31 ± 0.04** KTN1 0.69 ± 0.04** 0.62 ± 0.04** Cell wall integrity genes FER 0.65 ± 0.01* 0.56 ± 0.03* HERK1 0.36 ± 0.01** 0.31 ± 0.02** FEI1 0.68 ± 0.01** 0.50 ± 0.07** FEI2 0.70 ± 0.05* 0.59 ± 0.03** KIN13A 0.48 ± 0.02** 0.40 ± 0.01** THE1 0.41 ± 0.06* 0.25 ± 0.02** WAK1 0.94 ± 0.01 0.18 ± 0.03* WAK2 1.07 ± 0.31 0.42 ± 0.13* WAK3 1.68 ± 0.24 0.94 ± 0.23 WAK4 0.99 ± 0.20 0.20 ± 0.06* WAK5 0.77 ± 0.29 0.15 ± 0.06** Pectin-related genes GAE1 0.71 ± 0.10* 0.53 ± 0.04* GAUT1 0.68 ± 0.06* 0.65 ± 0.07* GAUT7 0.68 ± 0.09* 0.63 ± 0.06** GAUT8 1.08 ± 0.06 1.08 ± 0.03 GAUT12 0.47 ± 0.07** 0.19 ± 0.02** GAUT15 1.04 ± 0.20 0.76 ± 0.03 EXT3 1.66 ± 0.09* 2.16 ± 0.07** EXT4 5.79 ± 0.57** 5.25 ± 0.49** PME35 0.0065 ± 0.001** 0.0036 ± 0.003**

28
REFERENCES
Ambrose, J.C., Shoji, T., Kotzer, A.M., Pighin, J.A., and Wasteneys, G.O. (2007). The Arabidopsis CLASP gene encodes a microtubule-associated protein involved in cell expansion and division. The Plant cell 19, 2763-2775.
Amos, R.A., Pattathil, S., Yang, J.Y., Atmodjo, M.A., Urbanowicz, B.R., Moremen, K.W., and Mohnen, D. (2018). A two-phase model for the non-processive biosynthesis of homogalacturonan polysaccharides by the GAUT1:GAUT7 complex. The Journal of biological chemistry 293, 19047-19063.
Atmodjo, M.A., Hao, Z., and Mohnen, D. (2013). Evolving views of pectin biosynthesis. Annu. Rev. Plant Biol. 64, 747-779.
Atmodjo, M.A., Sakuragi, Y., Zhu, X., Burrell, A.J., Mohanty, S.S., Atwood, J.A., 3rd, Orlando, R., Scheller, H.V., and Mohnen, D. (2011). Galacturonosyltransferase (GAUT)1 and GAUT7 are the core of a plant cell wall pectin biosynthetic homogalacturonan:galacturonosyltransferase complex. Proc Natl Acad Sci U S A 108, 20225-20230.
Barnette, A.L., Lee, C., Bradley, L.C., Schreiner, E.P., Park, Y.B., Shin, H., Cosgrove, D.J., Park, S., and Kim, S.H. (2012). Quantification of crystalline cellulose in lignocellulosic biomass using sum frequency generation (SFG) vibration spectroscopy and comparison with other analytical methods. Carbohydr Polym 89, 802-809.
Baron-Epel, O., Gharyal, P.K., and Schindler, M. (1988). Pectins as Mediators of Wall Porosity in Soybean Cells. Planta 175, 389-395.
Baskin, T.I., Beemster, G.T., Judy-March, J.E., and Marga, F. (2004). Disorganization of cortical microtubules stimulates tangential expansion and reduces the uniformity of cellulose microfibril alignment among cells in the root of Arabidopsis. Plant Physiology 135, 2279-2290.
Bethke, G., Thao, A., Xiong, G., Li, B., Soltis, N.E., Hatsugai, N., Hillmer, R.A., Katagiri, F., Kliebenstein, D.J., Pauly, M., and Glazebrook, J. (2016). Pectin Biosynthesis Is Critical for Cell Wall Integrity and Immunity in Arabidopsis thaliana. The Plant cell 28, 537-556.
Biswal, A.K., Atmodjo, M.A., Li, M., Baxter, H.L., Yoo, C.G., Pu, Y., Lee, Y.C., Mazarei, M., Black, I.M., Zhang, J.Y., Ramanna, H., Bray, A.L., King, Z.R., LaFayette, P.R., Pattathil, S.,Donohoe, B.S., Mohanty, S.S., Ryno, D., Yee, K., Thompson, O.A., Rodriguez, M., Jr.,Dumitrache, A., Natzke, J., Winkeler, K., Collins, C., Yang, X., Tan, L., Sykes, R.W., Gjersing,E.L., Ziebell, A., Turner, G.B., Decker, S.R., Hahn, M.G., Davison, B.H., Udvardi, M.K.,Mielenz, J.R., Davis, M.F., Nelson, R.S., Parrott, W.A., Ragauskas, A.J., Neal Stewart, C., Jr.,and Mohnen, D. (2018). Sugar release and growth of biofuel crops are improved by downregulationof pectin biosynthesis. Nat. Biotechnol. 36, 249-257.
Bou Daher, F., Chen, Y., Bozorg, B., Clough, J., Jonsson, H., and Braybrook, S.A. (2018). Anisotropic growth is achieved through the additive mechanical effect of material anisotropy and elastic asymmetry. Elife 7.
Boudsocq, M., Willmann, M.R., McCormack, M., Lee, H., Shan, L., He, P., Bush, J., Cheng, S.H., and Sheen, J. (2010). Differential innate immune signalling via Ca(2+) sensor protein kinases. Nature 464, 418-422.
Bouton, S., Leboeuf, E., Mouille, G., Leydecker, M.T., Talbotec, J., Granier, F., Lahaye, M., Hofte, H., and Truong, H.N. (2002). QUASIMODO1 encodes a putative membrane-bound glycosyltransferase required for normal pectin synthesis and cell adhesion in Arabidopsis. The Plant cell 14, 2577-2590.
Broxterman, S.E., and Schols, H.A. (2018). Interactions between pectin and cellulose in primary plant cell walls. Carbohydr Polym 192, 263-272.
Caffall, K.H., and Mohnen, D. (2009). The structure, function, and biosynthesis of plant cell wall pectic polysaccharides. Carbohydr. Res. 344, 1879-1900.
Cannon, M.C., Terneus, K., Hall, Q., Tan, L., Wang, Y., Wegenhart, B.L., Chen, L., Lamport, D.T., Chen, Y., and Kieliszewski, M.J. (2008). Self-assembly of the plant cell wall requires an extensin scaffold. Proc. Natl. Acad. Sci. U. S. A. 105, 2226-2231.
Chen, S.L., Ehrhardt, D.W., and Somerville, C.R. (2010). Mutations of cellulose synthase (CESA1) phosphorylation sites modulate anisotropic cell expansion and bidirectional mobility of cellulose synthase. Proc. Natl. Acad. Sci. U. S. A. 107, 17188-17193.

29
Chen, X., Lee, C.M., Wang, H.-F., Jensen, L., and Kim, S.H. (2017). Experimental and Theoretical Study of Azimuth Angle and Polarization Dependences of Sum-Frequency-Generation Vibrational Spectral Features of Uniaxially Aligned Cellulose Crystals. The Journal of Physical Chemistry C 121, 18876-18886.
Cheung, A.Y., and Wu, H.M. (2011). THESEUS 1, FERONIA and relatives: a family of cell wall-sensing receptor kinases? Curr. Opin. Plant Biol. 14, 632-641.
Clough, S.J., and Bent, A.F. (1998). Floral dip: a simplified method for Agrobacterium-mediated transformation of Arabidopsis thaliana. Plant J. 16, 735-743.
Cornuault, V., Manfield, I.W., Ralet, M.C., and Knox, J.P. (2014). Epitope detection chromatography: a method to dissect the structural heterogeneity and inter-connections of plant cell-wall matrix glycans. Plant J. 78, 715-722.
Cosgrove, D.J. (2005). Growth of the plant cell wall. Nature reviews. Molecular cell biology 6, 850-861. De Ruiter, G.A., Schols, H.A., Voragen, A.G., and Rombouts, F.M. (1992). Carbohydrate analysis of
water-soluble uronic acid-containing polysaccharides with high-performance anion-exchange chromatography using methanolysis combined with TFA hydrolysis is superior to four other methods. Analytical Biochemistry 207, 176-185.
Derbyshire, P., Findlay, K., McCann, M.C., and Roberts, K. (2007). Cell elongation in Arabidopsis hypocotyls involves dynamic changes in cell wall thickness. Journal of Experimental Botany 58, 2079-2089.
Desprez, T., Juraniec, M., Crowell, E.F., Jouy, H., Pochylova, Z., Parcy, F., Hofte, H., Gonneau, M., and Vernhettes, S. (2007). Organization of cellulose synthase complexes involved in primary cell wall synthesis in Arabidopsis thaliana. Proc. Natl. Acad. Sci. U. S. A. 104, 15572-15577.
Dick-Perez, M., Zhang, Y., Hayes, J., Salazar, A., Zabotina, O.A., and Hong, M. (2011). Structure and interactions of plant cell-wall polysaccharides by two- and three-dimensional magic-angle-spinning solid-state NMR. Biochemistry (Mosc.) 50, 989-1000.
Driouich, A., Follet-Gueye, M.L., Bernard, S., Kousar, S., Chevalier, L., Vicre-Gibouin, M., and Lerouxel, O. (2012). Golgi-mediated synthesis and secretion of matrix polysaccharides of the primary cell wall of higher plants. Frontiers in plant science 3.
Durand, C., Vicre-Gibouin, M., Follet-Gueye, M.L., Duponchel, L., Moreau, M., Lerouge, P., and Driouich, A. (2009). The organization pattern of root border-like cells of Arabidopsis is dependent on cell wall homogalacturonan. Plant Physiol. 150, 1411-1421.
Feng, W., Kita, D., Peaucelle, A., Cartwright, H.N., Doan, V., Duan, Q., Liu, M.C., Maman, J., Steinhorst, L., Schmitz-Thom, I., Yvon, R., Kudla, J., Wu, H.M., Cheung, A.Y., and Dinneny, J.R. (2018). The FERONIA Receptor Kinase Maintains Cell-Wall Integrity during Salt Stress through Ca(2+) Signaling. Current Biology 28, 666-675 e665.
Filisetti-Cozzi, T.M., and Carpita, N.C. (1991). Measurement of uronic acids without interference from neutral sugars. Anal. Biochem. 197, 157-162.
Fontecave, M., Atta, M., and Mulliez, E. (2004). S-adenosylmethionine: nothing goes to waste. Trends in biochemical sciences 29, 243-249.
Fry, S.C. (1988). The growing plant cell wall : chemical and metabolic analysis. (Burnt Mill, Harlow, Essex, England; New York: Longman Scientific & Technical; J. Wiley).
Gao, P., Xin, Z., and Zheng, Z.L. (2008). The OSU1/QUA2/TSD2-encoded putative methyltransferase is a critical modulator of carbon and nitrogen nutrient balance response in Arabidopsis. PLoS ONE 3, e1387.
Goubet, F., and Mohnen, D. (1999). Subcellular localization and topology of homogalacturonan methyltransferase in suspension-cultured Nicotiana tabacum cells. Planta 209, 112-117.
Guo, H.Q., Li, L., Ye, H.X., Yu, X.F., Algreen, A., and Yin, Y.H. (2009). Three related receptor-like kinases are required for optimal cell elongation in Arabidopsis thaliana. Proc. Natl. Acad. Sci. U. S. A. 106, 7648-7653.
Hamant, O., Inoue, D., Bouchez, D., Dumais, J., and Mjolsness, E. (2019). Are microtubules tension sensors? Nature communications 10, 2360.
Hamant, O., Heisler, M.G., Jonsson, H., Krupinski, P., Uyttewaal, M., Bokov, P., Corson, F., Sahlin, P., Boudaoud, A., Meyerowitz, E.M., Couder, Y., and Traas, J. (2008). Developmental patterning by mechanical signals in Arabidopsis. Science 322, 1650-1655.

30
Hematy, K., and Hofte, H. (2008). Novel receptor kinases involved in growth regulation. Curr. Opin. Plant Biol. 11, 321-328.
Hongo, S., Sato, K., Yokoyama, R., and Nishitani, K. (2012). Demethylesterification of the primary wall by PECTIN METHYLESTERASE35 provides mechanical support to the Arabidopsis stem. The Plant cell 24, 2624-2634.
Hsiao, K., Zegzouti, H., and Goueli, S.A. (2016). Methyltransferase-Glo: a universal, bioluminescent and homogenous assay for monitoring all classes of methyltransferases. Epigenomics 8, 321-339.
Hu, H.Z., Zhang, R., Feng, S.Q., Wang, Y.M., Wang, Y.T., Fan, C.F., Li, Y., Liu, Z.Y., Schneider, R., Xia, T., Ding, S.Y., Persson, S., and Peng, L.C. (2018). Three AtCesA6-like members enhance biomass production by distinctively promoting cell growth in Arabidopsis. Plant Biotechnology Journal 16, 976-988.
Ibar, C., and Orellana, A. (2007). The import of S-Adenosylmethionine into the golgi apparatus is required for the methylation of homogalacturonan. Plant Physiology 145, 504-512.
Jacques, E., Verbelen, J.P., and Vissenberg, K. (2013). Mechanical stress in Arabidopsis leaves orients microtubules in a 'continuous' supracellular pattern. BMC Plant Biol. 13.
Kafle, K., Xi, X., Lee, C.M., Tittmann, B.R., Cosgrove, D.J., Park, Y.B., and Kim, S.H.J.C. (2014a). Cellulose microfibril orientation in onion (Allium cepa L.) epidermis studied by atomic force microscopy (AFM) and vibrational sum frequency generation (SFG) spectroscopy 21, 1075-1086.
Kafle, K., Shi, R., Lee, C.M., Mittal, A., Park, Y.B., Sun, Y.-H., Park, S., Chiang, V., and Kim, S.H.J.C. (2014b). Vibrational sum-frequency-generation (SFG) spectroscopy study of the structural assembly of cellulose microfibrils in reaction woods 21, 2219-2231.
Kim, S.J., Held, M.A., Zemelis, S., Wilkerson, C., and Brandizzi, F. (2015). CGR2 and CGR3 have critical overlapping roles in pectin methylesterification and plant growth in Arabidopsis thaliana. Plant Journal 82, 208-220.
Kohorn, B.D., and Kohorn, S.L. (2012). The cell wall-associated kinases, WAKs, as pectin receptors. Frontiers in plant science 3, 88.
Korolev, A.V., Buschmann, H., Doonan, J.H., and Lloyd, C.W. (2007). AtMAP70-5, a divergent member of the MAP70 family of microtubule-associated proteins, is required for anisotropic cell growth in Arabidopsis. J. Cell Sci. 120, 2241-2247.
Korolev, A.V., Chan, J., Naldrett, M.J., Doonan, J.H., and Lloyd, C.W. (2005). Identification of a novel family of 70 kDa microtubule-associated proteins in Arabidopsis cells. Plant J. 42, 547-555.
Krupkova, E., Immerzeel, P., Pauly, M., and Schmulling, T. (2007). The TUMOROUS SHOOT DEVELOPMENT2 gene of Arabidopsis encoding a putative methyltransferase is required for cell adhesion and co-ordinated plant development. Plant Journal 50, 735-750.
Lee, C.M., Kafle, K., Park, Y.B., and Kim, S.H. (2014). Probing crystal structure and mesoscale assembly of cellulose microfibrils in plant cell walls, tunicate tests, and bacterial films using vibrational sum frequency generation (SFG) spectroscopy. Phys. Chem. Chem. Phys. 16, 10844-10853.
Lee, C.M., Kafle, K., Huang, S., and Kim, S.H. (2016). Multimodal Broadband Vibrational Sum Frequency Generation (MM-BB-V-SFG) Spectrometer and Microscope. J Phys Chem B 120, 102-116.
Lindner, H., Muller, L.M., Boisson-Dernier, A., and Grossniklaus, U. (2012). CrRLK1L receptor-like kinases: not just another brick in the wall. Curr. Opin. Plant Biol. 15, 659-669.
Liu, H., Ma, Y., Chen, N., Guo, S., Guo, X., Chong, K., and Xu, Y. (2013). Overexpression of stress-inducible OsBURP16, the beta subunit of polygalacturonase 1, decreases pectin content and cell adhesion and increases abiotic stress sensitivity in rice. Plant Cell and Environment 37, 1144-1158.
Lopez-Sanchez, P., Martinez-Sanz, M., Bonilla, M.R., Wang, D., Gilbert, E.P., Stokes, J.R., and Gidley, M.J. (2017). Cellulose-pectin composite hydrogels: Intermolecular interactions and material properties depend on order of assembly. Carbohydr Polym 162, 71-81.
Lopez-Sanchez, P., Martinez-Sanz, M., Bonilla, M.R., Wang, D., Walsh, C.T., Gilbert, E.P., Stokes, J.R., and Gidley, M.J. (2016). Pectin impacts cellulose fibre architecture and hydrogel mechanics in the absence of calcium. Carbohydr Polym 153, 236-245.
Makarem, M., Sawada, D., O’Neill, H.M., Lee, C.M., Kafle, K., Park, Y.B., Mittal, A., and Kim, S.H. (2017). Dependence of Sum Frequency Generation (SFG) Spectral Features on the Mesoscale Arrangement of SFG-Active Crystalline Domains Interspersed in SFG-Inactive Matrix: A Case

31
Study with Cellulose in Uniaxially Aligned Control Samples and Alkali-Treated Secondary Cell Walls of Plants. The Journal of Physical Chemistry C 121, 10249-10257.
Makarem, M., Lee, C.M., Kafle, K., Huang, S., Chae, I., Yang, H., Kubicki, J.D., and Kim, S.H.J.C. (2019). Probing cellulose structures with vibrational spectroscopy 26, 35-79.
Marc, J., Granger, C.L., Brincat, J., Fisher, D.D., Kao, T.H., McCubbin, A.G., and Cyr, R.J. (1998). A GFP-MAP4 reporter gene for visualizing cortical microtubule rearrangements in living epidermal cells. The Plant cell 10, 1927-1939.
Miao, Y., Li, H.Y., Shen, J., Wang, J., and Jiang, L. (2011). QUASIMODO 3 (QUA3) is a putative homogalacturonan methyltransferase regulating cell wall biosynthesis in Arabidopsis suspension-cultured cells. Journal of Experimental Botany 62, 5063-5078.
Miedes, E., Suslov, D., Vandenbussche, F., Kenobi, K., Ivakov, A., Van Der Straeten, D., Lorences, E.P., Mellerowicz, E.J., Verbelen, J.P., and Vissenberg, K. (2013). Xyloglucan endotransglucosylase/hydrolase (XTH) overexpression affects growth and cell wall mechanics in etiolated Arabidopsis hypocotyls. Journal of Experimental Botany 64, 2481-2497.
Mouille, G., Ralet, M.C., Cavelier, C., Eland, C., Effroy, D., Hematy, K., McCartney, L., Truong, H.N., Gaudon, V., Thibault, J.F., Marchant, A., and Hofte, H. (2007). Homogalacturonan synthesis in Arabidopsis thaliana requires a Golgi-localized protein with a putative methyltransferase domain. Plant J. 50, 605-614.
Muller, K., Levesque-Tremblay, G., Bartels, S., Weitbrecht, K., Wormit, A., Usadel, B., Haughn, G., and Kermode, A.R. (2013). Demethylesterification of cell wall pectins in Arabidopsis plays a role in seed germination. Plant Physiology 161, 305-316.
Neumetzler, L., Humphrey, T., Lumba, S., Snyder, S., Yeats, T.H., Usadel, B., Vasilevski, A., Patel, J., Rose, J.K., Persson, S., and Bonetta, D. (2012). The FRIABLE1 Gene Product Affects Cell Adhesion in Arabidopsis. PLoS ONE 7, e42914.
Ordaz-Ortiz, J.J., Marcus, S.E., and Knox, J.P. (2009). Cell wall microstructure analysis implicates hemicellulose polysaccharides in cell adhesion in tomato fruit pericarp parenchyma. Molecular Plant 2, 910-921.
Orfila, C., Sorensen, S.O., Harholt, J., Geshi, N., Crombie, H., Truong, H.N., Reid, J.S., Knox, J.P., and Scheller, H.V. (2005). QUASIMODO1 is expressed in vascular tissue of Arabidopsis thaliana inflorescence stems, and affects homogalacturonan and xylan biosynthesis. Planta 222, 613-622.
Paredez, A.R., Somerville, C.R., and Ehrhardt, D.W. (2006). Visualization of cellulose synthase demonstrates functional association with microtubules. Science 312, 1491-1495.
Paredez, A.R., Persson, S., Ehrhardt, D.W., and Somerville, C.R. (2008). Genetic evidence that cellulose synthase activity influences microtubule cortical array organization. Plant Physiology 147, 1723-1734.
Park, Y.B., and Cosgrove, D.J. (2012). A revised architecture of primary cell walls based on biomechanical changes induced by substrate-specific endoglucanases. Plant Physiol. 158, 1933-1943.
Park, Y.B., and Cosgrove, D.J. (2015). Xyloglucan and its interactions with other components of the growing cell wall. Plant Cell Physiol. 56, 180-194.
Peaucelle, A., Wightman, R., and Hofte, H. (2015). The Control of Growth Symmetry Breaking in the Arabidopsis Hypocotyl. Current Biology 25, 1746-1752.
Peaucelle, A., Braybrook, S.A., Le Guillou, L., Bron, E., Kuhlemeier, C., and Hofte, H. (2011). Pectin-Induced Changes in Cell Wall Mechanics Underlie Organ Initiation in Arabidopsis. Current Biology 21, 1720-1726.
Perez-Perez, Y., Carneros, E., Berenguer, E., Solis, M.T., Barany, I., Pintos, B., Gomez-Garay, A., Risueno, M.C., and Testillano, P.S. (2019). Pectin De-methylesterification and AGP Increase Promote Cell Wall Remodeling and Are Required During Somatic Embryogenesis of Quercus suber. Front Plant Sci 9, 1915.
Phyo, P., Wang, T., Xiao, C., Anderson, C.T., and Hong, M. (2017). Effects of Pectin Molecular Weight Changes on the Structure, Dynamics, and Polysaccharide Interactions of Primary Cell Walls of Arabidopsis thaliana: Insights from Solid-State NMR. Biomacromolecules 18, 2937-2950.
Popper, Z.A., and Fry, S.C. (2008). Xyloglucan-pectin linkages are formed intra-protoplasmically, contribute to wall-assembly, and remain stable in the cell wall. Planta 227, 781-794.

32
Qu, L., Wu, C., Zhang, F., Wu, Y., Fang, C., Jin, C., Liu, X., and Luo, J. (2016). Rice putative methyltransferase gene OsTSD2 is required for root development involving pectin modification. Journal of Experimental Botany 67, 5349-5362.
Rajangam, A.S., Kumar, M., Aspeborg, H., Guerriero, G., Arvestad, L., Pansri, P., Brown, C.J., Hober, S., Blomqvist, K., Divne, C., Ezcurra, I., Mellerowicz, E., Sundberg, B., Bulone, V., and Teeri, T.T. (2008). MAP20, a microtubule-associated protein in the secondary cell walls of hybrid aspen, is a target of the cellulose synthesis inhibitor 2,6-dichlorobenzonitrile. Plant Physiology 148, 1283-1294.
Refregier, G., Pelletier, S., Jaillard, D., and Hofte, H. (2004). Interaction between wall deposition and cell elongation in dark-grown hypocotyl cells in Arabidopsis. Plant Physiology 135, 959-968.
Riveras, E., Alvarez, J.M., Vidal, E.A., Oses, C., Vega, A., and Gutierrez, R.A. (2015). The Calcium Ion Is a Second Messenger in the Nitrate Signaling Pathway of Arabidopsis. Plant Physiol. 169, 1397-1404.
Robinson, S., and Kuhlemeier, C. (2018). Global Compression Reorients Cortical Microtubules in Arabidopsis Hypocotyl Epidermis and Promotes Growth. Current Biology 28, 1794-1802 e1792.
Somerville, C., Bauer, S., Brininstool, G., Facette, M., Hamann, T., Milne, J., Osborne, E., Paredez, A., Persson, S., Raab, T., Vorwerk, S., and Youngs, H. (2004). Toward a systems approach to understanding plant cell walls. Science 306, 2206-2211.
Sterling, J.D., Atmodjo, M.A., Inwood, S.E., Kumar Kolli, V.S., Quigley, H.F., Hahn, M.G., and Mohnen, D. (2006). Functional identification of an Arabidopsis pectin biosynthetic homogalacturonan galacturonosyltransferase. Proc Natl Acad Sci U S A 103, 5236-5241.
Stoppin-Mellet, V., Gaillard, J., and Vantard, M. (2006). Katanin's severing activity favors bundling of cortical microtubules in plants. Plant J. 46, 1009-1017.
Swamy, P.S., Hu, H., Pattathil, S., Maloney, V.J., Xiao, H., Xue, L.J., Chung, J.D., Johnson, V.E., Zhu, Y., Peter, G.F., Hahn, M.G., Mansfield, S.D., Harding, S.A., and Tsai, C.J. (2015). Tubulin perturbation leads to unexpected cell wall modifications and affects stomatal behaviour in Populus. Journal of Experimental Botany 66, 6507-6518.
Tire, C., De Rycke, R., De Loose, M., Inze, D., Van Montagu, M., and Engler, G. (1994). Extensin gene expression is induced by mechanical stimuli leading to local cell wall strengthening in Nicotiana plumbaginifolia. Planta 195, 175-181.
Updegraff, D.M. (1969). Semimicro determination of cellulose in biological materials. Anal. Biochem. 32, 420-424.
Verger, S., Chabout, S., Gineau, E., and Mouille, G. (2016). Cell adhesion in plants is under the control of putative O-fucosyltransferases. Development 143, 2536-2540.
Verger, S., Long, Y., Boudaoud, A., and Hamant, O. (2018). A tension-adhesion feedback loop in plant epidermis. Elife 7.
Vincken, J.P., Schols, H.A., Oomen, R.J., McCann, M.C., Ulvskov, P., Voragen, A.G., and Visser, R.G. (2003). If homogalacturonan were a side chain of rhamnogalacturonan I. Implications for cell wall architecture. Plant Physiol. 132, 1781-1789.
Voiniciuc, C., Engle, K.A., Gunl, M., Dieluweit, S., Schmidt, M.H., Yang, J.Y., Moremen, K.W., Mohnen, D., and Usadel, B. (2018). Identification of Key Enzymes for Pectin Synthesis in Seed Mucilage. Plant Physiol 178, 1045-1064.
Wang, T., Park, Y.B., Cosgrove, D.J., and Hong, M. (2015). Cellulose-Pectin Spatial Contacts Are Inherent to Never-Dried Arabidopsis Primary Cell Walls: Evidence from Solid-State Nuclear Magnetic Resonance. Plant Physiology 168, 871-884.
Wang, T., Park, Y.B., Caporini, M.A., Rosay, M., Zhong, L., Cosgrove, D.J., and Hong, M. (2013). Sensitivity-enhanced solid-state NMR detection of expansin's target in plant cell walls. Proc. Natl. Acad. Sci. U. S. A. 110, 16444-16449.
Weraduwage, S.M., Kim, S.J., Renna, L., F, C.A., T, D.S., and Brandizzi, F. (2016). Pectin Methylesterification Impacts the Relationship between Photosynthesis and Plant Growth. Plant Physiol. 171, 833-848.
White, P.B., Wang, T., Park, Y.B., Cosgrove, D.J., and Hong, M. (2014). Water-Polysaccharide Interactions in the Primary Cell Wall of Arabidopsis thaliana from Polarization Transfer Solid-State NMR. J. Am. Chem. Soc. 136, 10399-10409.

33
Wilkins, K.A., Matthus, E., Swarbreck, S.M., and Davies, J.M. (2016). Calcium-Mediated Abiotic Stress Signaling in Roots. Frontiers in plant science 7, 1296.
Winter, D., Vinegar, B., Nahal, H., Ammar, R., Wilson, G.V., and Provart, N.J. (2007). An "Electronic Fluorescent Pictograph" Browser for Exploring and Analyzing Large-Scale Biological Data Sets. Plos One 2.
Xiao, C., and Anderson, C.T. (2016). Interconnections between cell wall polymers, wall mechanics, and cortical microtubules: Teasing out causes and consequences. Plant Signal Behav 11, e1215396.
Xiao, C., Zhang, T., Zheng, Y., Cosgrove, D.J., and Anderson, C.T. (2016). Xyloglucan Deficiency Disrupts Microtubule Stability and Cellulose Biosynthesis in Arabidopsis, Altering Cell Growth and Morphogenesis. Plant Physiol. 170, 234-249.
Xiao, C., Barnes, W.J., Zamil, M.S., Yi, H., Puri, V.M., and Anderson, C.T. (2017). Activation tagging of Arabidopsis POLYGALACTURONASE INVOLVED IN EXPANSION2 promotes hypocotyl elongation, leaf expansion, stem lignification, mechanical stiffening, and lodging. Plant Journal 89, 1159-1173.
Xu, S.L., Rahman, A., Baskin, T.I., and Kieber, J.J. (2008). Two leucine-rich repeat receptor kinases mediate signaling, linking cell wall biosynthesis and ACC synthase in Arabidopsis. The Plant cell 20, 3065-3079.
Xu, Y., Sechet, J., Wu, Y., Fu, Y., Zhu, L., Li, J., Zhang, Y., Gineau, E., Gaertner, C., Zhou, J., Fan, X., Liu, Y., Zhou, L., Mouille, G., and Lin, X. (2017). Rice Sucrose Partitioning Mediated by a Putative Pectin Methyltransferase and Homogalacturonan Methylesterification. Plant Physiol. 174, 1595-1608.
Xu, Y., Sechet, J., Wu, Y., Fu, Y., Zhu, L., Li, J., Zhang, Y., Gineau, E., Gaertner, C., Zhou, J., Fan, X., Liu, Y., Zhou, L., Mouille, G., and Lin, X. (2018). Rice Sucrose Partitioning Mediated by a Putative Pectin Methyltransferase and Homogalacturonan Methylesterification. Plant Physiol. 174, 1595-1608.
Yoneda, A., Ito, T., Higaki, T., Kutsuna, N., Saito, T., Ishimizu, T., Osada, H., Hasezawa, S., Matsui, M., and Demura, T. (2010). Cobtorin target analysis reveals that pectin functions in the deposition of cellulose microfibrils in parallel with cortical microtubules. Plant J. 64, 657-667.
Zhang, T., Zheng, Y., and Cosgrove, D.J. (2016). Spatial organization of cellulose microfibrils and matrix polysaccharides in primary plant cell walls as imaged by multichannel atomic force microscopy. Plant J. 85, 179-192.
Zhang, T., Tang, H., Vavylonis, D., and Cosgrove, D.J. (2019). Disentangling loosening from softening: insights into primary cell wall structure. Plant J. 100, 1101-1117.
Zheng, Y., Liao, C., Zhao, S., Wang, C., and Guo, Y. (2016). The Glycosyltransferase QUA1 Regulates Chloroplast-Associated Calcium Signaling During Salt and Drought Stress in Arabidopsis. Plant Cell Physiol. 58, 329-341.
Zheng, Y., Wang, X., Chen, Y., Wagner, E., and Cosgrove, D.J. (2018). Xyloglucan in the primary cell wall: assessment by FESEM, selective enzyme digestions and nanogold affinity tags. Plant J. 93, 211-226.
Zykwinska, A., Thibault, J.F., and Ralet, M.C. (2008). Competitive binding of pectin and xyloglucan with primary cell wall cellulose. Carbohyd Polym 74, 957-961.
Zykwinska, A.W., Ralet, M.C., Garnier, C.D., and Thibault, J.F. (2005). Evidence for in vitro binding of pectin side chains to cellulose. Plant Physiol. 139, 397-407.

Figure 1. QUA2 Displays Methyltransferase Activity on PGA in vitro. (A) Schematic of predicted protein structure ofQUA2. Black box represents transmembrane domain (TMD). Dark gray box indicates the catalytic domain, which is inthe SAM-dependent methyltransferase_29 superfamily. The N- and C-termini of QUA2 putatively face the cytosol andGolgi lumen, respectively. (B) SDS-PAGE and coomassie staining of purified MBP and MBP-fused QUA2 proteins. MBPand MBP-QUA2 are predicted to migrate at ∼40 kDa and ∼100 kDa, respectively. (C) Immunoblot of purified MBP andMBP fused QUA2 proteins using an anti-polyhistidine antibody. (D) Methyltransferase assay with purified proteins. Foreach 50 µL reaction, 1 µg purified MBP or MBP-QUA2 protein was incubated with 50 μg PGA in the presence of 10 μMSAM, 2 mM Mg2+, and 0.25 M sucrose. Enzymatic activity is proportional to the accumulated reaction product SAH,which is converted into ADP, then to ATP, and finally monitored by luciferase activity. The change in luminescence (inrelative light units, RLU) is the net luminescence over background, which is calculated as the raw luminescence minusthe background luminescence (no enzyme control). (E, F and G) Methyltransferase activity of purified MBP-QUA2 istime- and concentration-dependent. Reactions were set up as described in D, except for the indicated proteinconcentrations (F), or PGA concentrations (G). After incubation at 30�C for 2 hours except in (E), the reactions werestopped by the addition of 0.5% TFA and analyzed for SAH content. (H) Substrate specificity test of QUA2.Methyltransferase assays were performed when supplied with 50 μg of the indicated polysaccharide. In the presence ofPGA, the SAH generated is more than 7 fold and 16 fold higher than when alginate or starch were supplied, respectively.(I) Immuno dot blot of the product of the methyltransferase reaction of MBP-QUA2 using monoclonal antibody JIM5(recognizing low-methylesterified HG) and JIM7 (recognizing methylesterified HG). Products reacted in the presence ofthe indicated substrate for the indicated time were adsorbed to a nitrocellulose membrane for immunoblotting. Controldots were processed in the absence of primary antibody. Each column (D–H) represents the average of three replicates,and error bars show standard error (SE). **P < 0.001, Student’s t-test.

Figure 2. qua2 and tsd2 Mutants Have Shorter Hypocotyls and Show Cell Adhesion Defects. (A) Six-day-oldetiolated Arabidopsis Col, qua2, and tsd2 seedlings. Scale bar represents 1 cm. (B) Quantification of hypocotyl lengthin dark-grown seedlings 2 to 6 days after sowing (DAS) (n ≥ 30 seedlings per genotype per time point). qua2 and tsd2hypocotyls were much shorter than Col controls, and tsd2 hypocotyls were shorter than qua2 hypocotyls. Error barsrepresent standard deviation (SD); *P < 0.05, **P < 0.001, Student’s t-test. (C) Hypocotyls from 3-day-old dark-grownCol, qua2, and tsd2 seedlings. Scale bar represents 100 µm. (D) Images of stomata present on the abaxial side ofcotyledons of 6-day-old light-grown Col, qua2, and tsd2 seedlings; cells were labeled with 100 µg/ml propidium iodide(PI) and imaged by spinning disk confocal microscopy. Scale bar represents 10 µm.

Figure 3. qua2 and tsd2 Mutants Have Reduced Pectin and Cellulose Content. (A) Total uronic acid content from6-day-old etiolated Col, qua2, and tsd2 seedlings, (n = 5 technical replicates from three biological replicates pergenotype). (B) Methanol released from cell walls of 6-day-old etiolated Col, qua2, and tsd2 seedlings, (n = 5 technicalreplicates from three biological replicates per genotype). (C) Calculated degree of pectin methylesterification from 6-day-old etiolated Col, qua2, and tsd2 seedlings, (n = 5 technical replicates from three biological replicates pergenotype). Bottom whisker is from minimum to quartile 1, bottom box is from quartile 1 to median, top box is frommedian to quartile 3, and top whisker is from quartile 3 to maximum. (D) Monosaccharide composition from cell wallsof 6-day-old etiolated Col, qua2, and tsd2 seedlings, n ≥ 5 technical replicates per genotype. (E and F) Crystallinecellulose content from 6-day-old etiolated seedlings (E) and the leaves (F) of 4-week-old Col, qua2, and tsd2 plants (n= 5 technical replicates per genotype). Error bars represent standard deviation (SD); *P < 0.05, *P < 0.001, Student’s t-test.

Figure 4. Cellulose Synthase Complex Motility Is Reduced in qua2 and tsd2 Etiolated Hypocotyls. (A) Singleframes and time averages of time-lapse datasets with 61 frames (5 min duration, 5 sec interval) from 3-day-oldetiolated GFP-CESA3 Col, GFP-CESA3 qua2, and GFP-CESA3 tsd2 hypocotyls showing GFP-CESA3 particles andtrajectories, respectively. Scale bar represents 10 μm. (B) Kymographs of linear tracks showing movement directions ofGFP-CESA3 particles in (A) from Col, qua2, and tsd2. (C) Box plot of GFP-CESA3 particle velocity (n ≥ 965 particlesfrom at least 11 cells per genotype). **P < 0.001, Student’s t-test. (D) Maximum projections from z-series of 3-day-oldetiolated seedlings expressing GFP-CESA3. Scale bar represents 10 μm. (E) Box plot of average particle density (n ≥9873 particles from at least 13 cells per genotype) from 3-day-old etiolated GFP-CESA3 Col, GFP-CESA3 qua2, andGFP-CESA3 tsd2 hypocotyls. Bottom whisker is from minimum to quartile 1, bottom box is from quartile 1 to median,top box is from median to quartile 3, and top whisker is from quartile 3 to maximum.

Figure 5. Cellulose Is Disorganized in qua2 and tsd2 Etiolated Hypocotyls. (A) SFG signal intensity from top,middle and basal hypocotyl regions of 6-day-old etiolated Col, qua2, and tsd2 seedlings. (B) Degree of anisotropicorganization in fibrils of Col, qua2, and tsd2 genotypes (n = 6 location points from a bundle of 10 seedlings). Error barsrepresent SE. (C) AFM images from top regions of 3-day-old etiolated Col, qua2, and tsd2 hypocotyls. Blue lines ininset images indicate cell long axis; white dashed arrows indicate scan direction. Scale bar represents 200 nm. (D andE) FESEM images from top regions of 3-day-old etiolated Col, qua2, and tsd2 hypocotyls without (D) and with (E)pectate lyase (PL) treatment, purple arrows display the positions where fibrils were fragmented. Scale bar represents100 nm. (F) Diagram of fibril patterning from FESEM images in (E). (G) Quantification of fibril width from FESEMimages (n ≥ 100 CMFs from at least 3 images). Bottom whisker is from minimum to quartile 1, bottom box is fromquartile 1 to median, top box is from median to quartile 3, and top whisker is from quartile 3 to maximum. In (B) and(G), error bars represent standard deviation (SD); in (G), **P < 0.001, Student’s t-test.

Figure 6. qua2 and tsd2 Mutants Have Increased Mobility for Both Cellulose and Pectin As Detected by NMR.(A) 13C direct polarization (DP) spectra measured with short recycle delays of 2 s for probing mobile molecules (red)and 35 s for quantitative detection (black) at 293 K. The relative intensity between these two spectra are indicated for
resolved cellulose and pectin peaks, with the higher relative intensity representing higher mobility. (B) Relative intensityratios between the 2-s DP that selects the mobile molecules and quantitative DP spectra for wild-type (black), qua2(blue), and tsd2 (red) cell walls.
Figure 7. Cortical Microtubule Patterning Is Altered, and Microtubules Are More Sensitive to OryzalinTreatment and Mechanical Stress in qua2 and tsd2 Alleles. (A) Maximum projections of z-stack images of MTsfrom top, middle and basal hypocotyls of 3-day-old etiolated GFP-MAP4 Col, GFP-MAP4 qua2, and GFP- MAP4 tsd2seedlings, scale bar represents 10 μm. (B) Violin plots of microtubule angles relative to the cell elongation axis inepidermal cells from top, middle and basal hypocotyls (n ≥ 50 MTs from at least 12 cells from 3 seedlings pergenotype). The arrow in the small inset indicates the cell elongation axis. **P < 0.001, Student’s t-test. (C) Cortical MTpatterning in top hypocotyl regions of 3-day-old etiolated seedlings of GFP-MAP4 Col, GFP-MAP4 qua2, and GFP-MAP4 tsd2 seedlings treated with 10 mM oryzalin over time, scale bar represents 10 μm. Diffuse labeling in lowerrighthand panels likely represents soluble GFP-MAP4. (D) Projections of z-stack images of MTs from top, middle andbasal hypocotyl regions of 3-day-old etiolated seedlings of GFP-MAP4 Col, GFP-MAP4 qua2, and GFP-MAP4 tsd2genotypes subjected to a stress of 0.49 N, scale bar represents 10 μm.

Figure 8. Schematic of How Loss of the Pectin Methyltransferase QUA2 Affects HomogalacturonanBiosynthesis, Cellulose Biosynthesis and Wall Architecture. In wild type plants (left), QUA2 functions as amethyltransferase to help synthesize highly methylesterified HG. qua2 and tsd2 mutants (right) produce lower amountsof HG and accumulate less HG in the cell wall (CW), which influences the activity of plasma membrane-localizedcellulose synthase complexes guided by cortical microtubules, decreasing cellulose deposition in the wall. The reducedHG content in the wall also alters cellulose microfibril patterning. The disruption of wall structure due to lower pectinand/or cellulose alters microtubule patterning and enhances the molecular mobility of pectin and cellulose, possibly dueto increased interactions between them.
DOI 10.1105/tpc.20.00252; originally published online September 3, 2020;Plant Cell
and Chaowen XiaoYue Rui, Mei Ruan, Shiqian Qi, Seong H. Kim, Tuo Wang, Daniel J. Cosgrove, Charles T Anderson
Juan Du, Alex Kirui, Shixin Huang, Lianglei Wang, William J Barnes, Sarah Kiemle, Yunzhen Zheng,Wall Integrity in Arabidopsis thaliana
Mutations in the Pectin Methyltransferase QUASIMODO2 Influence Cellulose Biosynthesis and
This information is current as of October 12, 2020
Supplemental Data /content/suppl/2020/09/03/tpc.20.00252.DC1.html
Permissions X
https://www.copyright.com/ccc/openurl.do?sid=pd_hw1532298X&issn=1532298X&WT.mc_id=pd_hw1532298
eTOCs http://www.plantcell.org/cgi/alerts/ctmain
Sign up for eTOCs at:
CiteTrack Alerts http://www.plantcell.org/cgi/alerts/ctmain
Sign up for CiteTrack Alerts at:
Subscription Information http://www.aspb.org/publications/subscriptions.cfm
is available at:Plant Physiology and The Plant CellSubscription Information for
ADVANCING THE SCIENCE OF PLANT BIOLOGY © American Society of Plant Biologists