MUSIC COLLABORATIVE RESEARCH - Sacramento State · JACK Quartet, Guitarist Benjamin Verdery, the...
24
MUSIC COLLABORATIVE RESEARCH Compiled by Taylor Robles Jenn Bailey Barry Crider Christine Diaz
Transcript of MUSIC COLLABORATIVE RESEARCH - Sacramento State · JACK Quartet, Guitarist Benjamin Verdery, the...

MUSIC COLLABORATIVE RESEARCH
Compiled by
Taylor RoblesJenn BaileyBarry CriderChristine Diaz

TABLE OF CONTENTS [1] CLIENT[2] SACRAMENTO STATE SYSTEM[3] AUDIENCE & DEMOGRAPHICS[4] COMPETITIVE AUDIT

[1] CLIENT

Client: Musiccompiled by Taylor Robles
DEPARTMENT OF MUSIC
“A fully accredited member of the National Association of Schools of Music (NASM) since 1964, the Department of Music offers the Bachelor of Music, Bachelor of Arts, and Master of Music degrees, as well as the teaching credential for the state of California. Students may also opt for programs which combine music with one or more other academic areas to pursue individualized educational goals.” – Welcome to the Department of Music, Depart-ment of Music
“Being a musician requires not only talent, desire, and lots of hard work; it also requires an environment in which you can develop your musical talents to their fullest.
At the Department of Music at Sacramento State, we provide a supportive environment along with the thorough education you need to succeed.
We offer the rigorous study of music associated with prestigious conservatories, with the added advantages of an outstanding liberal arts education and the amenities of a multifac-eted university.
With this comprehensive background, our graduates have gone on to extraordinary careers as performers, conductors, composers and teachers. Many have furthered their educa-tion through graduate study. Others have used their broad education as a springboard to careers in business and technology.” – About Our Music Programs, Department of Music
Concentrations: Ensembles:Instrumental Concert Band OperaEducation Marching Band Percussion GroupJazz Wind Ensemble Baroque EnsembleManagement Orchestra Liberace Wind QuintetKeyboard Instrumental Jazz Sun QuartetTheory/Composition Vocal JazzVoice Choirs
Expectations:The CSUS Department of Music is looking for a new design campaign to promote their annual Festival of New American Music held at Sacramento State, November 1-10. The featured composer this year will be Augusta Read Thomas, and the festival will include per-formances by Third Coast Percussion, pianist Geoffrey Burleson, jazz guitarist Mark Elf, the JACK Quartet, Guitarist Benjamin Verdery, the San Francisco Contemporary Music Players, and many more. The final deliverable for the client will be a double-sided, full color 18 × 24 poster.
Budget:The budget for the Department of Music is small, in that a majority of the funding is distrib-uted to faculty and put towards the hosting of their major events, with whatever remains put towards promotional efforts. Profits come from ticket sales, donations from sponsors, donors, and alumni.
Pricing:Ticket prices for events range from “free admission” to $30+ (depending on the event).
COLLABORATIVE RESEARCH:Client Information
Compiled by Taylor Robles
As a part of the College of
Arts and Letters, the final
deliverables for the Depart-
ment of Music should also
reflect a cohesive system that
remains consistent across
all departments (i.e. system,
choice of typeface, or use of
color palette).
Client: Musiccompiled by Taylor Robles
Current System:
The Department of Music adheres to a consistent system in regards to their printed promo-tional material. A constant template is used across all printed posters, postcards, mailing brochures, and postcards. Online, each section within the Department of Music has a website of its own, and each of them is uses a different system.
Target Audience:The target audience for the Department of Music includes: Sacramento State students and alumni, donors, sponsors, musicians/performers, as well as music enthusiasts in the general Sacramento area (see “Audience Demographics” for further information).
Copy Writing:The Department of Music generally has a lot of information that is included on posters, bro-chures, and other printed materials. Design for printed promotions are very text heavy. The copy for these promotions will be provided by the client to be used on the final deliverable.
Distribution:Information in regards to the Department of Music are distributed through printed materials (i.e. posters, brochures, programs, mailers, and postcards), digital means (i.e. Department website), and social media channels. The utilization of Reprographics Services on campus for printed materials is to be encouraged with the final deliverable.
BRANDING STANDARDS
Naming System:California State University, Sacramento – Formal NameSacramento State – Common NameSac State – Nickname
Signature:The University’s signature is composed of the Sacramento State logo (symbol and word-mark) and tagline. This signature represents the University as a whole—it’s goals, image, ideas, personality and values. This signature should be applied to all university-related docu-ments that do not call for use of the formal seal and should be displayed as a prominent element. – Sacramento State Identity Style Guide, CSUS
COLLABORATIVE RESEARCH
Strengths: Printed materi-
als remain consistent with
the choice of typeface, color
palette, and size (i.e. ~5.5 ×
11 tri-fold mailers)
Weaknesses: Webpage
designs are inconsistent with
their choice of color palette
and typeface. There is no cor-
relation between the printed
materials and the websites,
and the only unifier is the use
of the Sacramento State logo.
Client: Musiccompiled by Taylor Robles
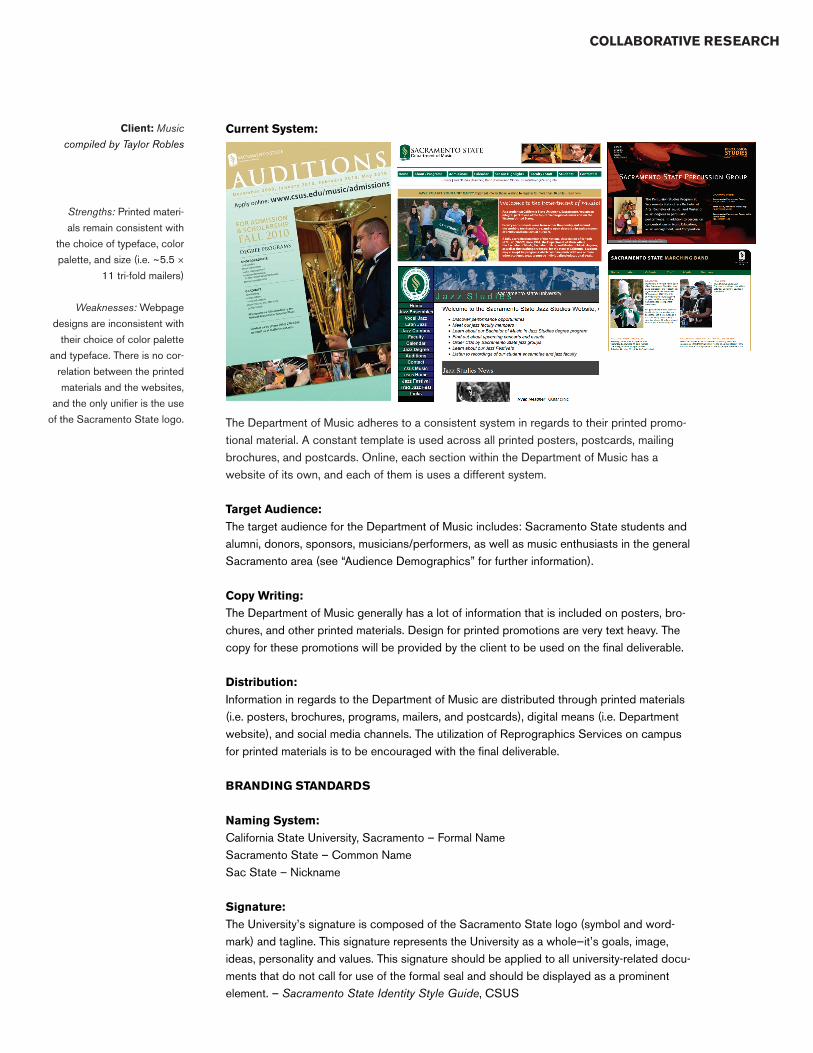
Mark dissection:
Color Guidelines & Fonts: Pantone 343C, Pantone 4515, Pantone 872 Metallic Gold (optional substitute for PMS 4515), and Black, make up the standard colors used in the Sacramento State identity. The typefaces used include Trajan and Myriad.
COLLABORATIVE RESEARCH
Department Branding: No
extensive branding standard
exists for the department
or the College of Arts and
Letters as a whole. The only
existing standards emphasize
the importance of italicizing
opera titles and putting song
titles in quotes. However,
when the title is a form and
key (Symphony in G), use no
italics or quotes (i.e. One of
my favorite classical pieces is
Franz Schubert’s adagio from
“String Quintet in C Major,” D.
956, op. post. 163.).

[2] SACRAMENTO STATE SYSTEM
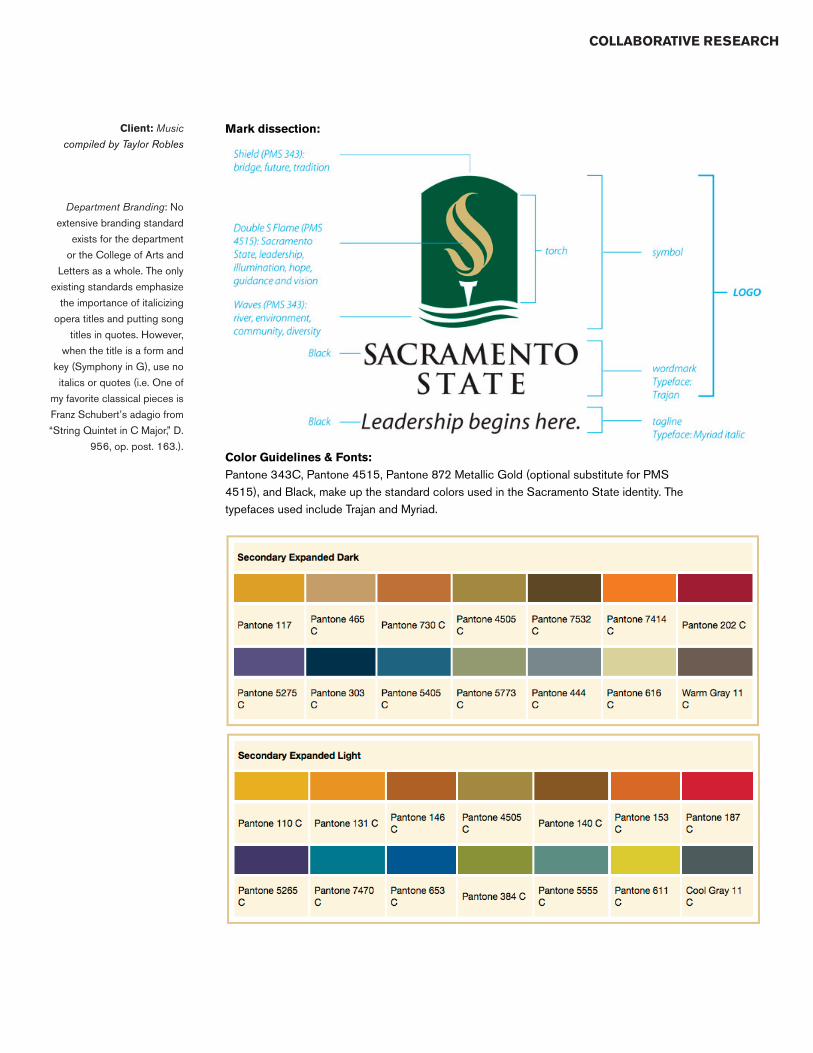
Music Site
Global links are consistent on every page.
All embedded links are con-sistent in color.
Two typef faces are used throughout the site.
Two different layouts are used, one using embedded
links in the left-hand column, the other using a two
column/two row grid system.
Consistent spacing for header/footer.
COLLABORATIVE RESEARCH:Sac State Music Department System
Compiled by Jenn Bailey
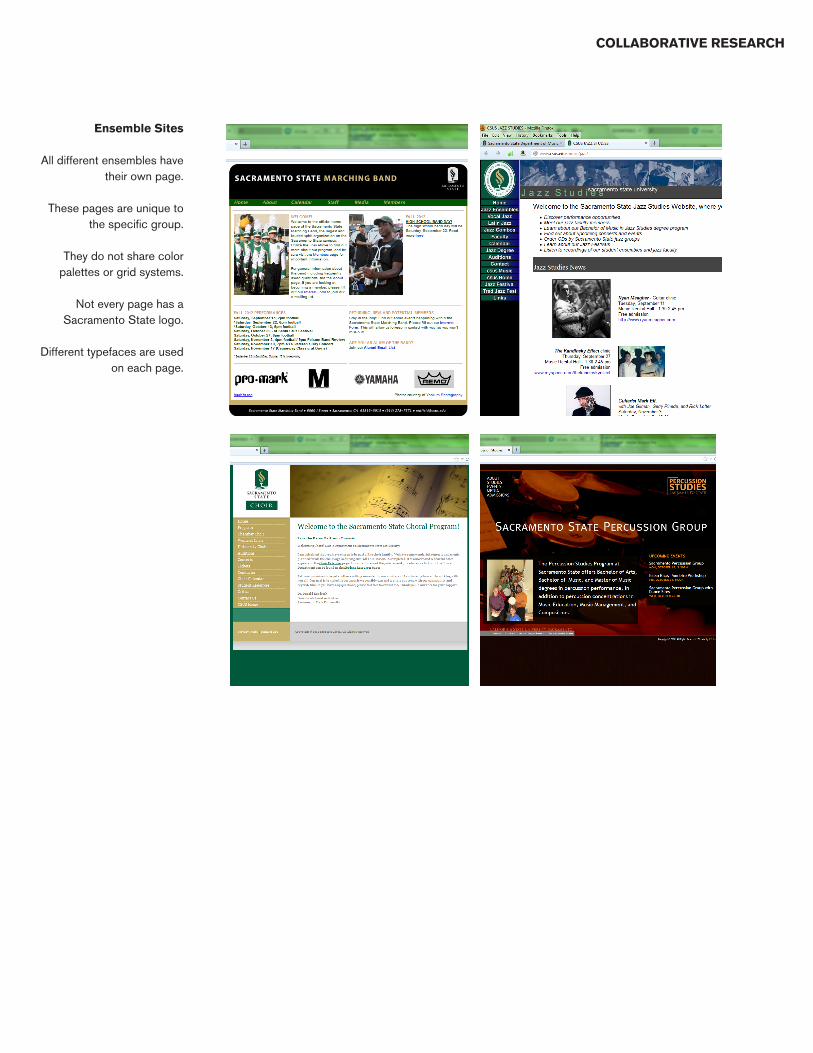
Ensemble Sites
All different ensembles have their own page.
These pages are unique to the specific group.
They do not share color palettes or grid systems.
Not every page has a Sacramento State logo.
Different typefaces are used on each page.
COLLABORATIVE RESEARCH

[3] AUDIENCE & DEMOGRAPHICS

Regional Community
COLLABORATIVE RESEARCH:Audience & Demographics
Compiled by Barry Crider
Personal Experience with CSUS 2000 2008
Count %Yes Count %Yes
In the past 12 months approx. how many times if any have you been to the Sacra-mento State Campus?(Check all that apply)
Not at all 127 27.4% 86 28.5%
Once 71 15.3% 64 21.2%
2-4 times 142 30.6% 97 32.1%
5-9 times 62 13.4% 28 9.3%
In the past 12 months for which of the following reasons have you been on the Sacramento State campus? (Check all that apply)
Theater, music, art, or other cultural event
99 21.2% 35 11.6%
Sac State Visibility Survey 2000 2008
Count %Agree Count %Agree
Please indicate how much you agree or disagree with each of the following statements.
Sacramento State does a good job of publicizing its cultural events (music, art, dance, theater, lectures, etc.).
408 60.0% 202 57.9%
US Census Data 2010
City of Sacramento
Population 472,178
People under 18 25%
People between 18-65 63.5%
People over 65 11.5%
White Black Hispanic Asian
Race 45% 14.6% 26.9% 18.3%
This is a table of data compiled from the Office of Institutional
Research’s Community Outreach Survey. This is useful in telling us how big our regional audience is
and how receptive they’ve been to Sac State College of Arts and Let-
ters events in the past.
According to the data, attendance of theater, music, art, or other cul-
tural events has dropped.
This shows that this is an area that we may want to pour more of our
focus into.

Regional Community US Census Data 2010
Sacramento City County
Language other than english spoken in the home
36%
# of Households 173,938 508,499
# of people per house 2.29 2.69
Median Household Income $50,267 $56,439
5th Congressional District 2010
Highschool Graduates 80.5%
Some College N/A
Bachelors Degree 24.5%
Graduates or Professional Degree N/A
Taking into account aspects like household income and level of
education can make an impact on designing for this audience. The
poverty level for a family of three in Sacramento is $17,273, so judging
by the median household income for Sacramento, some people
do have expendable income for entertainment like College of Arts &
Letters events.
A good market to target are the people in the area who do have a college degree, because they will be more inclined and more com-fortable with to participating in a college community environment.
COLLABORATIVE RESEARCH

Alumni #’s By County
Sacramento 74,370 Butte 908 Lassen 141Placer 15,067 Fresno 825 Madera 122El Dorado 6,666 Riverside 785 Del Norte 108San Joaquin 6,305 Amador 763 San Benito 103Yolo 6,019 Santa Cruz 753 Kings 90Solano 6,018 Yuba 725 Glenn 72Contra Costa 5,575 Ventura 656 Imperial 47Alameda 3,637 San Luis Obispo 596 Trinity 47Santa Clara 3,018 Kern 556 Modoc 45Los Angeles 2,904 San Bernardino 526 Mariposa 44Sonoma 2,642 Calaveras 491 Inyo 39San Diego 2,080 Humboldt 476 Sierra 34Nevada 1,833 Merced 438 Mono 25Sutter 1,661 Mendocino 432 Alpine 11San Mateo 1,617 Santa Barbara 398 Total 160,642San Francisco 1,613 Tulare 354Orange 1,495 Tuolumne 312Stanislaus 1,449 Lake 287Napa 1,309 Siskiyou 287Monterey 1,131 Tehama 229Marin 1,102 Colusa 210Shasta 1,043 Plumas 153
2011 Living Alumni of Sacramento Stateby California County
Alpine
Mono
Sierra
Mariposa
Modoc
Trinity
Glenn
Del Norte
Lassen
Plumas
Colusa
Tehama
Lake
Siskiyou
Tuolumne
Mendocino
Humboldt
Butte
Shasta
Napa
San Francisco
S
Alameda
ContraCosta
Solano
Yolo
San Joaquin
El Dorado
Placer
Inyo
Imperial
Kings
SanBenito
Tulare
Santa Barbara
Merced
San Bernardino
KernSan LuisObispo
Ventura
Santa Cruz
Riverside
Fresno
Monterey
San Mateo
San Diego
Los Angeles
Santa Clara
0 to 199200 to 399400 to 799800 to 1,1991,200 to 9,99910,000 to 49,99950,000 to 75,000
Sacramento State - University Fact Book Section 8: Alumni 56
COLLABORATIVE RESEARCH

Campus Community:Student
CSUS O.I.R. Campus Climate Survey 2007
Age Distribution
17-24 70.7%
25-29 18.9%
30-34 4.1%
35-39 2.6%
40+ 3.8%
Gender
Female 63.4%
Male 36.6%
Race & Ethnicity
African American 6.17%
Hispanic/Latino 16.08%
Asian/Pacific Islander 18.36%
Caucasian 43.38%
Other 6.42%
Unreported or Decline to State 8.94%
Huffington Post 2012
Average National Student Loan Debt
+/- $21,000
According to the on campus climate survey, the majority group
on campus is 17-24 year old white females. However this does not
mean this is the only group we are marketing to on campus.
Our campaign should be diverse and relatable to all demographics.
It is common knowlege that most college students are broke. Taking this into account is very important
when pricing events as to not alienate someone who would want
to come but can’t afford a high ticket price.
COLLABORATIVE RESEARCH
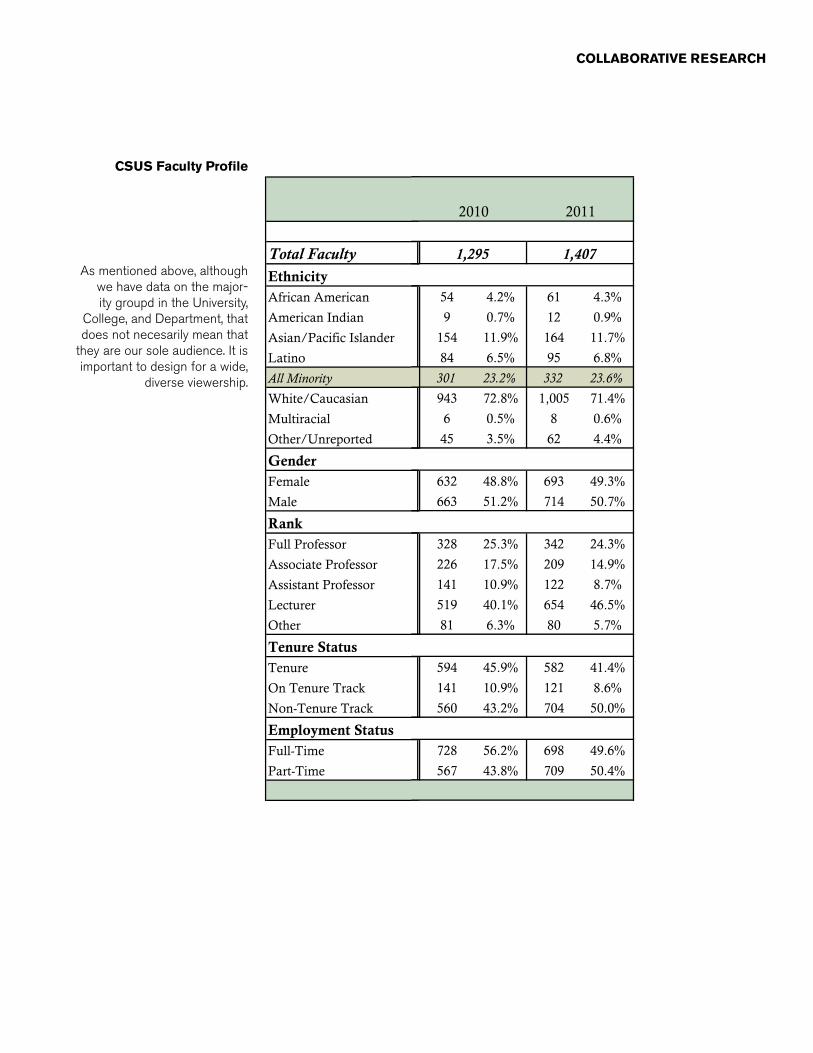
CSUS Faculty ProfileTABLE 1: Faculty Profile
Total FacultyEthnicityAfrican American 69 4.2% 68 4.3% 71 4.7% 54 4.2% 61 4.3%
American Indian 19 1.1% 15 0.9% 14 0.9% 9 0.7% 12 0.9%
Asian/Pacific Islander 171 10.3% 168 10.6% 166 11.1% 154 11.9% 164 11.7%
Latino 105 6.3% 110 6.9% 98 6.5% 84 6.5% 95 6.8%
All Minority 364 22.0% 361 22.8% 349 23.3% 301 23.2% 332 23.6%
White/Caucasian 1,221 73.8% 1,147 72.5% 1,090 72.6% 943 72.8% 1,005 71.4%
Multiracial 6 0.5% 8 0.6%
Other/Unreported 69 4.2% 75 4.7% 62 4.1% 45 3.5% 62 4.4%
GenderFemale 829 50.1% 771 48.7% 732 48.8% 632 48.8% 693 49.3%
Male 825 49.9% 812 51.3% 769 51.2% 663 51.2% 714 50.7%
RankFull Professor 354 21.4% 350 22.1% 351 23.4% 328 25.3% 342 24.3%
Associate Professor 180 10.9% 207 13.1% 229 15.3% 226 17.5% 209 14.9%
Assistant Professor 213 12.9% 199 12.6% 172 11.5% 141 10.9% 122 8.7%
Lecturer 810 49.0% 733 46.3% 664 44.2% 519 40.1% 654 46.5%
Other 97 5.9% 94 5.9% 85 5.7% 81 6.3% 80 5.7%
Tenure StatusTenure 553 33.4% 578 36.5% 618 41.2% 594 45.9% 582 41.4%
On Tenure Track 238 14.4% 219 13.8% 180 12.0% 141 10.9% 121 8.6%
Non-Tenure Track 863 52.2% 786 49.7% 703 46.8% 560 43.2% 704 50.0%
Employment StatusFull-Time 793 47.9% 796 50.3% 788 52.5% 728 56.2% 698 49.6%
Part-Time 861 52.1% 787 49.7% 713 47.5% 567 43.8% 709 50.4%
Updated 1/23/12
Note: In order to avoid duplicating headcounts, faculty with more than one assignment are only counted once.
1,407
Fall
2011
1,654 1,583 1,501 1,295
2009 20102007 2008
Sacramento State - University Fact Book Section 1: Faculty and Staff 1
TABLE 1: Faculty Profile
Total FacultyEthnicityAfrican American 69 4.2% 68 4.3% 71 4.7% 54 4.2% 61 4.3%
American Indian 19 1.1% 15 0.9% 14 0.9% 9 0.7% 12 0.9%
Asian/Pacific Islander 171 10.3% 168 10.6% 166 11.1% 154 11.9% 164 11.7%
Latino 105 6.3% 110 6.9% 98 6.5% 84 6.5% 95 6.8%
All Minority 364 22.0% 361 22.8% 349 23.3% 301 23.2% 332 23.6%
White/Caucasian 1,221 73.8% 1,147 72.5% 1,090 72.6% 943 72.8% 1,005 71.4%
Multiracial 6 0.5% 8 0.6%
Other/Unreported 69 4.2% 75 4.7% 62 4.1% 45 3.5% 62 4.4%
GenderFemale 829 50.1% 771 48.7% 732 48.8% 632 48.8% 693 49.3%
Male 825 49.9% 812 51.3% 769 51.2% 663 51.2% 714 50.7%
RankFull Professor 354 21.4% 350 22.1% 351 23.4% 328 25.3% 342 24.3%
Associate Professor 180 10.9% 207 13.1% 229 15.3% 226 17.5% 209 14.9%
Assistant Professor 213 12.9% 199 12.6% 172 11.5% 141 10.9% 122 8.7%
Lecturer 810 49.0% 733 46.3% 664 44.2% 519 40.1% 654 46.5%
Other 97 5.9% 94 5.9% 85 5.7% 81 6.3% 80 5.7%
Tenure StatusTenure 553 33.4% 578 36.5% 618 41.2% 594 45.9% 582 41.4%
On Tenure Track 238 14.4% 219 13.8% 180 12.0% 141 10.9% 121 8.6%
Non-Tenure Track 863 52.2% 786 49.7% 703 46.8% 560 43.2% 704 50.0%
Employment StatusFull-Time 793 47.9% 796 50.3% 788 52.5% 728 56.2% 698 49.6%
Part-Time 861 52.1% 787 49.7% 713 47.5% 567 43.8% 709 50.4%
Updated 1/23/12
Note: In order to avoid duplicating headcounts, faculty with more than one assignment are only counted once.
1,407
Fall
2011
1,654 1,583 1,501 1,295
2009 20102007 2008
Sacramento State - University Fact Book Section 1: Faculty and Staff 1
As mentioned above, although we have data on the major-ity groupd in the University,
College, and Department, that does not necesarily mean that
they are our sole audience. It is important to design for a wide,
diverse viewership.
COLLABORATIVE RESEARCH

Music Dept. Faculty Statistics
TABLE 10: Faculty Profile
Total FacultyDepartment
College
University
EthnicityAfrican American 2 3.8% 3 6.0% 3 5.9% 3 6.0% 2 4.2%
American Indian
Asian 3 5.7% 2 4.0% 3 5.9% 3 6.0% 3 6.3%
Latino 1 1.9% 1 2.0% 1 2.0% 1 2.0% 2 4.2%
Underrepresented Minority 3 5.7% 4 8.0% 4 7.8% 4 8.0% 4 8.3%
All Minority 6 11.3% 6 12.0% 7 13.7% 7 14.0% 7 14.6%
Multiracial
White/Caucasian 45 84.9% 44 88.0% 44 86.3% 43 86.0% 41 85.4%
Other/Unreported 2 3.8%
% Minority (College) 67 16.0% 63 15.9% 62 16.3% 52 15.6% 57 16.4%
% Minority (University) 364 22.0% 361 22.8% 349 23.3% 301 23.2% 332 23.6%
GenderDepartment- Female 17 32.1% 17 34.0% 18 35.3% 16 32.0% 15 31.3%
Department- Male 36 67.9% 33 66.0% 33 64.7% 34 68.0% 33 68.8%
College-Female 212 50.6% 200 50.6% 195 51.3% 168 50.3% 174 50.0%
College-Male 207 49.4% 195 49.4% 185 48.7% 166 49.7% 174 50.0%
University-Female 829 50.1% 771 48.7% 732 48.8% 632 48.8% 693 49.3%
University-Male 825 49.9% 812 51.3% 769 51.2% 663 51.2% 714 50.7%
RankFull Professor 16 30.2% 15 30.0% 15 29.4% 15 30.0% 15 31.3%
Associate Professor 3 5.7% 3 6.0% 3 5.9% 4 8.0% 4 8.3%
Assistant Professor 1 1.9% 2 4.0% 2 3.9% 1 2.0% 1 2.1%
Lecturer 33 62.3% 30 60.0% 31 60.8% 30 60.0% 28 58.3%
Tenure StatusTenure 19 35.8% 18 36.0% 18 35.3% 19 38.0% 19 39.6%
On Tenure Track 1 1.9% 2 4.0% 2 3.9% 1 2.0% 1 2.1%
Non-Tenure Track 33 62.3% 30 60.0% 31 60.8% 30 60.0% 28 58.3%
1,295
Fall
2007 2008 2009 2010
Note: Faculty members with more than one assignment are only counted once and are attributed to the department with the greatest portion of FTE based on HR Census data (October 1).
2011
48
348
1,407
53
419
1,654
50
395
1,583
51
380
1,501
50
334
Music 15
COLLABORATIVE RESEARCH
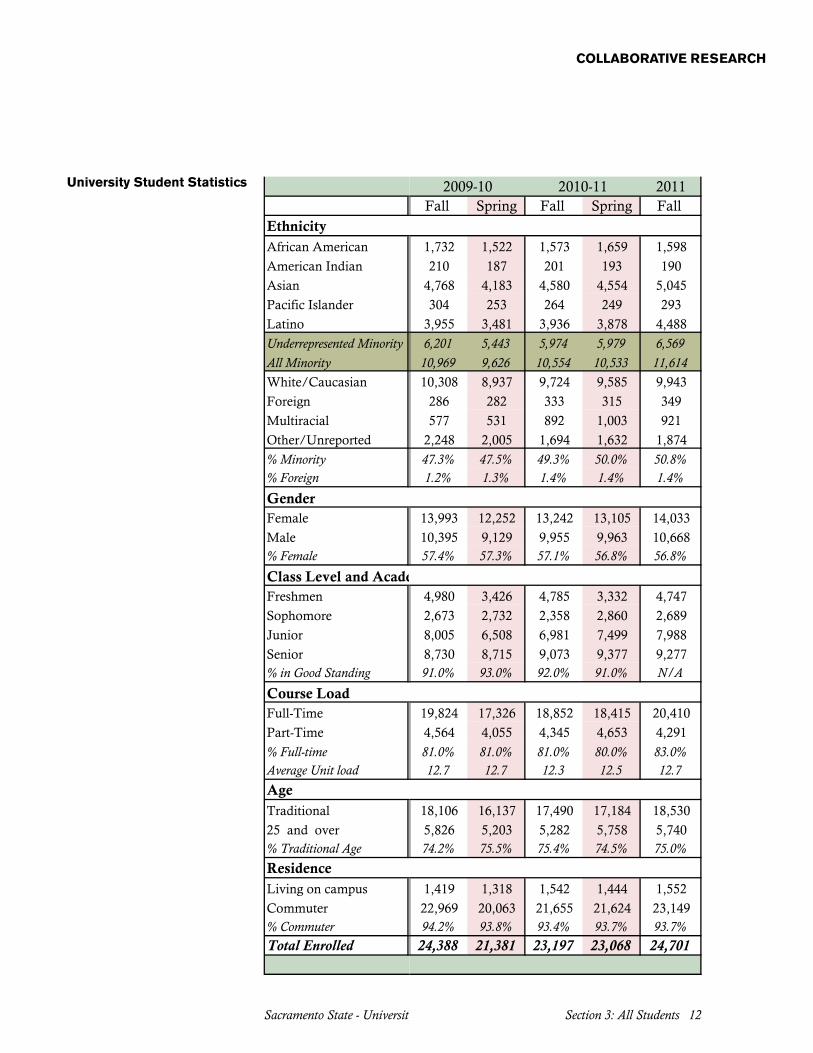
University Student Statistics
TABLE 8: All Undergraduate Students - Profile
2011Fall Spring Fall Spring Fall Spring Fall Spring Fall
EthnicityAfrican American 1,693 1,571 1,678 1,630 1,732 1,522 1,573 1,659 1,598
American Indian 224 215 222 210 210 187 201 193 190
Asian 4,282 4,073 4,357 4,234 4,768 4,183 4,580 4,554 5,045
Pacific Islander 237 235 265 265 304 253 264 249 293
Latino 3,327 3,164 3,495 3,369 3,955 3,481 3,936 3,878 4,488
Underrepresented Minority 5,481 5,185 5,660 5,474 6,201 5,443 5,974 5,979 6,569All Minority 9,763 9,258 10,017 9,708 10,969 9,626 10,554 10,533 11,614White/Caucasian 9,480 9,010 9,568 9,217 10,308 8,937 9,724 9,585 9,943
Foreign 276 264 257 252 286 282 333 315 349
Multiracial 577 531 892 1,003 921
Other/Unreported 4,205 4,419 4,192 2,845 2,248 2,005 1,694 1,632 1,874
% Minority 41.2% 40.3% 41.7% 44.1% 47.3% 47.5% 49.3% 50.0% 50.8%% Foreign 1.2% 1.2% 1.1% 1.1% 1.2% 1.3% 1.4% 1.4% 1.4%
GenderFemale 13,567 12,990 13,686 12,630 13,993 12,252 13,242 13,105 14,033
Male 10,157 9,961 10,348 9,392 10,395 9,129 9,955 9,963 10,668% Female 57.2% 56.6% 56.9% 57.4% 57.4% 57.3% 57.1% 56.8% 56.8%
Class Level and Academic StatusFreshmen 5,507 4,617 5,738 3,206 4,980 3,426 4,785 3,332 4,747
Sophomore 2,531 2,766 2,639 2,724 2,673 2,732 2,358 2,860 2,689
Junior 6,820 6,657 7,054 7,130 8,005 6,508 6,981 7,499 7,988
Senior 8,866 8,911 8,603 8,962 8,730 8,715 9,073 9,377 9,277% in Good Standing 91.0% 92.0% 91.0% 91.0% 91.0% 93.0% 92.0% 91.0% N/A
Course LoadFull-Time 18,045 16,916 18,472 17,721 19,824 17,326 18,852 18,415 20,410
Part-Time 5,679 6,035 5,562 4,301 4,564 4,055 4,345 4,653 4,291
% Full-time 76.0% 74.0% 77.0% 80.0% 81.0% 81.0% 81.0% 80.0% 83.0%Average Unit load 12.4 12.1 12.4 12.8 12.7 12.7 12.3 12.5 12.7
AgeTraditional 16,967 16,139 16,947 16,484 18,106 16,137 17,490 17,184 18,530
25 and over 5,387 5,324 5,388 5,477 5,826 5,203 5,282 5,758 5,740% Traditional Age 71.5% 70.3% 70.5% 74.9% 74.2% 75.5% 75.4% 74.5% 75.0%
ResidenceLiving on campus 955 894 975 906 1,419 1,318 1,542 1,444 1,552
Commuter 22,769 22,057 23,059 21,116 22,969 20,063 21,655 21,624 23,149% Commuter 96.0% 96.1% 95.9% 95.9% 94.2% 93.8% 93.4% 93.7% 93.7%Total Enrolled 23,724 22,951 24,034 22,022 24,388 21,381 23,197 23,068 24,701
2010-112009-102008-092007-08Academic Year
Sacramento State - University Fact Book Section 3: All Students 12
COLLABORATIVE RESEARCH

Music Dept. Student Statistics
TABLE 2: All Undergraduate Student Profile
Total Enrolled*Department Total
College Total
% of College
EthnicityAfrican American 17 6.8% 14 6.3% 17 7.4% 14 6.9% 13 6.2%
American Indian 4 1.6% 5 2.3% 1 0.4% 1 0.5% 3 1.4%
Asian 26 10.4% 20 9.0% 24 10.4% 27 13.2% 21 10.0%
Latino 21 8.4% 21 9.5% 28 12.1% 19 9.3% 28 13.3%
Pacific Islander 1 0.5% 3 1.3% 3 1.5% 3 1.4%
Underrepresented Minority 42 16.8% 41 18.5% 49 21.2% 37 18.1% 47 22.4%
All Minority 68 27.2% 61 27.5% 73 31.6% 64 31.4% 68 32.4%
Multiracial 12 5.2% 15 7.4% 13 6.2%
White/Caucasian 145 58.0% 134 60.4% 127 55.0% 112 54.9% 112 53.3%
Foreign 3 1.2% 2 0.9% 4 1.7% 4 2.0% 2 1.0%
Other/Unreported 34 13.6% 25 11.3% 15 6.5% 9 4.4% 15 7.1%
% Minority (College) 1,285 32.6% 1,321 34.4% 1,404 35.3% 1,291 36.0% 1,331 36.5%
% Minority (University) 9,763 41.2% 10,017 41.7% 10,969 45.0% 10,554 45.5% 11,619 47.0%
GenderDepartment- Female 125 50.0% 98 44.1% 111 48.1% 97 47.5% 93 44.3%
Department- Male 125 50.0% 124 55.9% 120 51.9% 107 52.5% 117 55.7%
College-Female 2,395 60.8% 2,366 61.7% 2,420 60.9% 2,185 60.8% 2,161 59.3%
College-Male 1,544 39.2% 1,470 38.3% 1,552 39.1% 1,406 39.2% 1,486 40.7%
University-Female 13,567 57.2% 13,686 56.9% 13,993 57.4% 13,242 57.1% 14,033 56.8%
University-Male 10,157 42.8% 10,348 43.1% 10,395 42.6% 9,955 42.9% 10,668 43.2%
AgeUnder 18 7 2.8% 5 2.3% 4 1.7% 5 2.5% 5 2.4%
18-24 198 79.2% 181 81.5% 184 79.7% 160 78.4% 173 82.4%
25 and over 45 18.0% 36 16.2% 43 18.6% 39 19.1% 32 15.2%
Commuter StatusLiving on Campus 27 10.8% 21 9.5% 21 9.1% 17 8.3% 12 5.7%
Commuters 223 89.2% 201 90.5% 210 90.9% 187 91.7% 198 94.3%
ResidenceCalifornia Resident 247 98.8% 219 98.6% 221 95.7% 198 97.1% 207 98.6%
Outside California 1 0.4% 2 0.9% 7 3.0% 3 1.5% 2 1.0%
Foreign 2 0.8% 1 0.5% 3 1.3% 3 1.5% 1 0.5%
* Total enrollment includes new, continuing, and returning students.
210
3,647
5.8%
231
3,972
5.8%
204
3,591
5.7%
250
3,939
6.3%
222
3,836
5.8%
2011
Fall
2007 2008 2009 2010
Music 2
COLLABORATIVE RESEARCH

Donations and Funding
The sources of support chart shows that the large majority of
support for the University comes from donors. This shows that it is
more imperative than ever that we unify the College of Arts and Let-
ters so no further funding is cut and we can continue putting on great events like Robin Hood, “Water: Essence and Potential”, and the
Festival of New American Music.
The large majority of funding that comes into the University is fun-
neled into the individual Colleges. However I was unable to find data
on how much of that chunk goes to the College of Arts and Letters, let
alone the Music Department.
COLLABORATIVE RESEARCH

[4] COMPETITIVE AUDIT
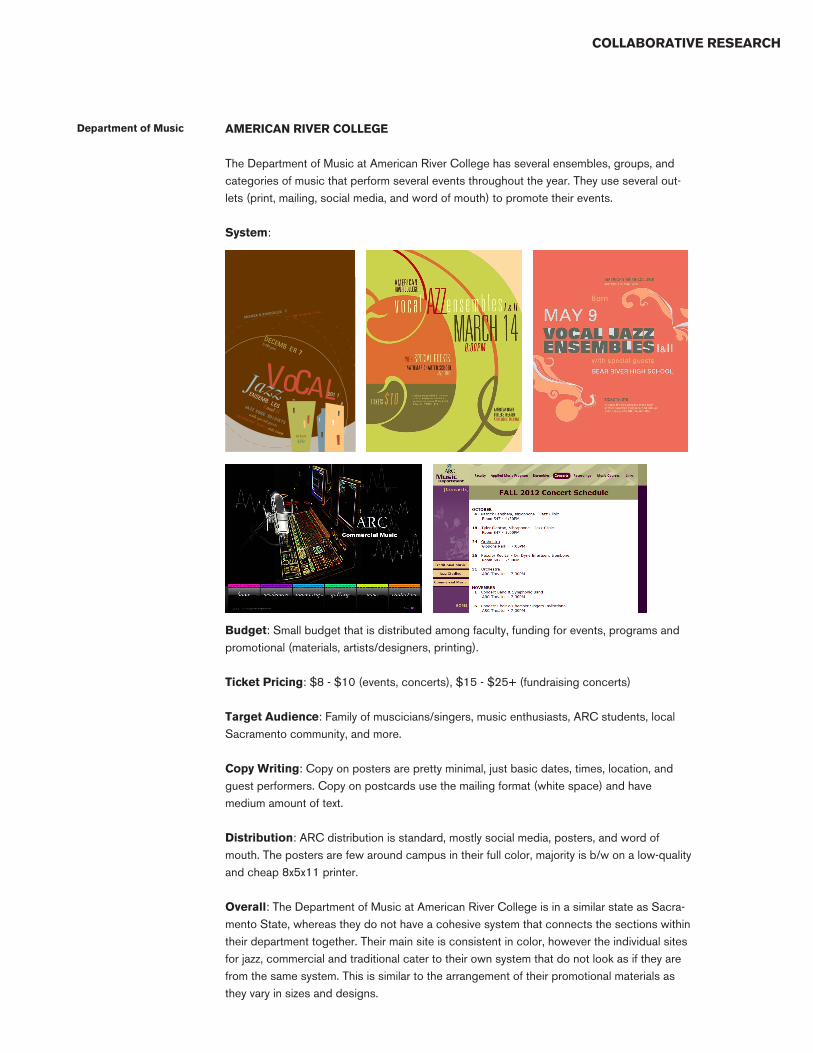
AMERICAN RIVER COLLEGE
The Department of Music at American River College has several ensembles, groups, and categories of music that perform several events throughout the year. They use several out-lets (print, mailing, social media, and word of mouth) to promote their events.
System:
Budget: Small budget that is distributed among faculty, funding for events, programs and promotional (materials, artists/designers, printing).
Ticket Pricing: $8 - $10 (events, concerts), $15 - $25+ (fundraising concerts)
Target Audience: Family of muscicians/singers, music enthusiasts, ARC students, local Sacramento community, and more.
Copy Writing: Copy on posters are pretty minimal, just basic dates, times, location, and guest performers. Copy on postcards use the mailing format (white space) and have medium amount of text.
Distribution: ARC distribution is standard, mostly social media, posters, and word of mouth. The posters are few around campus in their full color, majority is b/w on a low-quality and cheap 8x5x11 printer.
Overall: The Department of Music at American River College is in a similar state as Sacra-mento State, whereas they do not have a cohesive system that connects the sections within their department together. Their main site is consistent in color, however the individual sites for jazz, commercial and traditional cater to their own system that do not look as if they are from the same system. This is similar to the arrangement of their promotional materials as they vary in sizes and designs.
COLLABORATIVE RESEARCH
VoCALJazzENSEMB LESI and II
DECEMB ER 7
201 1
JA ZZ VOICE SO LOIS TS
with special guests
8:00 pm
FO LSOM HIGH SCHOO L JAZZ CHOIR
AM ERICA N RIVER COLLEG E4700 Co ll ege Oa k Drive
$10tickets:
Department of Music

UC DAVIS
The Department of Music presents more than 100 events each year by a range of ensem-bles, including the UC Davis Symphony Orchestra, University Chorus, Empyrean Ensemble, Concert Band, Early Music and Baroque Ensembles, Jazz Band, Hindustani Vocal Ensem-ble, Gamelan Ensemble, and Samba School. The department sponsors an annual artist-in-residence program, bringing internationally renowned artists for performances and lectures. The department also presents a free weekly noon-concert series, which features visiting artists, department ensembles, and student performers in an informal setting.
System:
Budget: Not cheap. The Mondavi cater to several musical performances throughout the year and the ticket prices range from $30+ depending on the performer. The Department of Music also is better funded than other universities like Sac State as they have a lot more sponsors for events.
Ticket Pricing: Free to $30+, Discounts for students depending on year (freshmen get one ticket free, other students get 1/2 price)
Target Audience: UC Davis students, donors to the Mondavi, performers and muscicians, family and friends of performers and muscicians, music community in Davis
Copy Writing: The text is minimal. They usually consist of dates, performers, location and descriptors about the events.
Distribution: Posters, Mondavi Website, Flyers, Social Media
Overall: The Mondavi Center at UC Davis is where majority of the events are taken place and a lot of the information about events (dates, times, performers and tickets) are available on their website. However they use various platforms to get the word out about events, but overall, there system is consistent on the Mondavi site, but there is a disconnect to the actual link to the UC Davis Department of Music which uses a different system altogether.
COLLABORATIVE RESEARCH
Department of Music
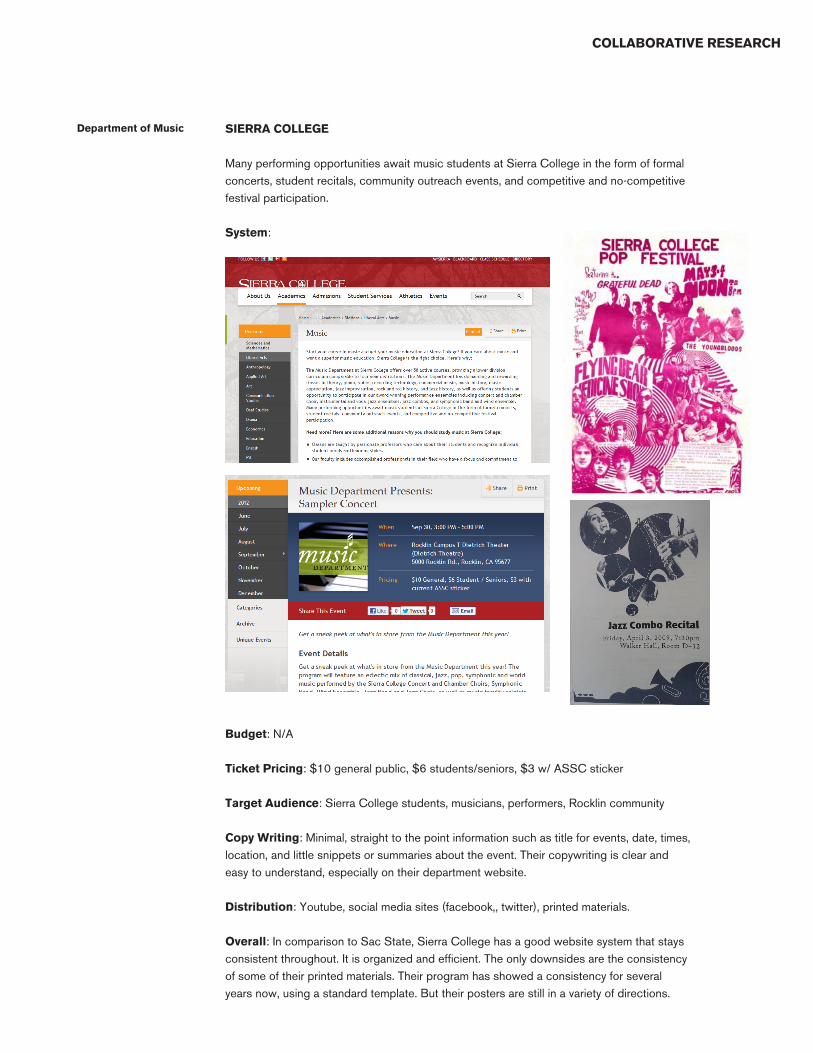
SIERRA COLLEGE
Many performing opportunities await music students at Sierra College in the form of formal concerts, student recitals, community outreach events, and competitive and no-competitive festival participation.
System:
Budget: N/A
Ticket Pricing: $10 general public, $6 students/seniors, $3 w/ ASSC sticker
Target Audience: Sierra College students, musicians, performers, Rocklin community
Copy Writing: Minimal, straight to the point information such as title for events, date, times, location, and little snippets or summaries about the event. Their copywriting is clear and easy to understand, especially on their department website.
Distribution: Youtube, social media sites (facebook,, twitter), printed materials.
Overall: In comparison to Sac State, Sierra College has a good website system that stays consistent throughout. It is organized and efficient. The only downsides are the consistency of some of their printed materials. Their program has showed a consistency for several years now, using a standard template. But their posters are still in a variety of directions.
COLLABORATIVE RESEARCH
Department of Music

LOCAL COMMUNITY: Ace of Spades, Bows & Arrows, Crest Theatre
These three are places in the Sacramento community that organize performances and events around the area, mostly centered around downtown. Events include live perfor-mances and shows that cater to several genres of music.
System(s):
Budget: The budget from the Crest Theater mostly comes from proceeds from bands/musicians/performers renting out their facility, ticket sales, and movie sales.
Ticket Pricing: $1 - $25+ (Ace of Spades) $1 $30+ (Bows & Arrows) $25 - $30 (Crest)
Target Audience: Music enthusiasts, Theater/Movie enthusiasts, locals from Sacramento Area with ages ranging from young to old. Midtown/Downtown residents. College students.
Copy Writing: Ace of Spades promotional pieces are minimal in copy, same with Bows & Arrows. Crest Theater however has a mix of lots of copy and minimal.
Distribution: Printed promotional pieces, social media (facebook, twitter), website (mostly)
Overall: Bows & Arrows is similar to how Sac State is set up. The system is everywhere, their posters do not show consistency. But Ace of Spades and the Crest Theater show a consistent marketing system for their events, especially on their website (Ace of Spades) and their poster layout (Crest), good qualities that allow for easy identification.
COLLABORATIVE RESEARCH
Music Venues
Ace of Spades
Bows & Arrows
Crest Theater


![World Classic Music for Guitarist No.2[1]](https://static.fdocuments.us/doc/165x107/577cc1171a28aba711923e68/world-classic-music-for-guitarist-no21.jpg)