MURDOCH RESEARCH...
29
MURDOCH RESEARCH REPOSITORY http://researchrepository.murdoch.edu.au/ Desvaux, S., Grosbois, V., Pham, T.T.H., Fenwick, S., Tollis, S., Pham, N.H., Tran, A. and Roger, F. (2011) Risk factors of highly pathogenic avian influenza H5N1 occurrence at the village and farm levels in the Red River Delta region in Vietnam. Transboundary and Emerging Diseases, 58 (6). pp. 492-502 http://researchrepository.murdoch.edu.au/6009/ Copyright © 2011 Blackwell Verlag GmbH It is posted here for your personal use. No further distribution is permitted.
Transcript of MURDOCH RESEARCH...

MURDOCH RESEARCH REPOSITORY http://researchrepository.murdoch.edu.au/
Desvaux, S., Grosbois, V., Pham, T.T.H., Fenwick, S., Tollis, S., Pham, N.H., Tran, A. and Roger, F. (2011) Risk factors of highly pathogenic avian influenza H5N1 occurrence at the
village and farm levels in the Red River Delta region in Vietnam. Transboundary and Emerging Diseases,
58 (6). pp. 492-502
http://researchrepository.murdoch.edu.au/6009/
Copyright © 2011 Blackwell Verlag GmbH
It is posted here for your personal use. No further distribution is permitted.

1
Risk factors of Highly Pathogenic Avian Influenza H5N1 occurrence at the village and farm 1
levels in the Red River Delta region in Vietnam 2
3
Desvaux Stéphanie12 *
, Grosbois Vladimir1, Pham Thi Thanh Hoa
3, Fenwick Stan
2, Tollis Sébastien
1, 4
Pham Ngoc Hai4, Tran Annelise
1, 5, Roger François
1 5
6
1CIRAD, Animal et gestion intégrée des risques (AGIRs), Montpellier F-34398, France 7
2 Murdoch University, School of Veterinary & Biomedical Sciences, Western Australia 6150, 8
Australia 9
3 NIAH-CIRAD, Hanoi, Vietnam 10
4 Vietnam National University, International Centre for Advanced Research on Global Change 11
(ICARGC), Hanoi, Vietnam 12
5 CIRAD, UMR Territoires, environnement, télédétection et information spatiale (TETIS), Montpellier 13
F-34093, France 14
15
16
Corresponding author: [email protected] 17
18
Worked carried out in Vietnam 19
20
21
22
23
24
25
26
27
Running head 28 29
Case control study on HPAI H5N1 in Northern Vietnam30
Page 1 of 28 Transboundary and Emerging Diseases

2
Abstract 31
A case-control study at both village and farm levels was designed to investigate risk factors for Highly 32
Pathogenic Avian Influenza H5N1 during the 2007 outbreaks in one province of Northern Vietnam. 33
Data related to human and natural environments, and poultry production systems was collected for 19 34
case and 38 unmatched control villages and 19 pairs of matched farms. Our results confirmed the role 35
of poultry movements and trading activities. In particular, our models found that higher number of 36
broiler flocks in the village increased the risk (OR = 1.49, 95% CI: 1.12-1.96), as well as the village 37
having at least one poultry trader (OR =11.53, 95% CI: 1.34-98.86). To a lesser extent, in one of our 2 38
models, we also identified that increased density of ponds and streams, commonly used for waterfowl 39
production, and greater number of duck flocks in the village also increased the risk. The higher 40
percentage of households keeping poultry, as an indicator of households keeping backyard poultry in 41
our study population, was a protective factor (OR= 0.95, 95% CI: 0.91-0.98). At the farm level, 3 risk 42
factors at the 5% level of type I error were identified by univariate analysis: a greater total number of 43
birds (P=0.006), and increase in the number of flocks having access to water (p=0.027, and a greater 44
number of broiler flocks in the farm (P=0.049). Effect of vaccination implementation (date and doses) 45
was difficult to investigate due to a poor recording system. Some protective or risk factors with limited 46
effect may not have been identified due to our limited sample size. Nevertheless, our results provide a 47
better understanding of local transmission mechanisms of HPAI H5N1 in one province of the Red 48
River Delta region in Vietnam and highlight the need to reduce at-risk trading and production 49
practices. 50
Key words: HPAI; H5N1; Vietnam; Risk factors51
Page 2 of 28Transboundary and Emerging Diseases

3
1. INTRODUCTION 52
Vietnam, with a poultry population over 200 million (Desvaux and Dinh, 2008), faced its first 53
outbreaks of Highly Pathogenic Avian Influenza (HPAI) H5N1 at the end of 2003 (OIE, 2008). By the 54
end of 2009, 5 epidemic waves had occurred in domestic poultry; with the latest waves being limited 55
to the North or the South regions whereas the first waves had a national distribution (Minh et al, 56
2009). To limit the number of outbreaks and the risk of transmission to humans, the Government of 57
Vietnam decided to use a mass vaccination strategy at the end of 2005. After a period of about a year 58
without an outbreak, Northern Vietnam faced a significant epidemic in 2007 with 88 communes 59
(administrative level made of several villages) affected in the Red River Delta administrative region 60
(Minh et al, 2009). So far, most of the studies investigating the role of potential risk factors on the 61
occurrence of HPAI outbreaks in Vietnam have been implemented at the commune level using 62
aggregated data from general databases for risk factor quantification (Gilbert et al, 2008; Henning et 63
al, 2009a; Pfeiffer et al, 2007). In Pfeiffer’s study of the 3 first waves (Pfeiffer et al, 2007) increased 64
risk was associated with decreased distance from higher density human populated areas, increased 65
land area used for rice, increased density of domestic water birds and increased density of chickens. In 66
the same study, significant interaction terms related to the periods and the regions were also associated 67
with the risk of HPAI emphasizing the importance of spatio-temporal variation in the disease pattern. 68
Gilbert demonstrated that the relative importance of duck and rice crop intensity, compared to human 69
density, on the risk of HPAI was variable according to the waves (Gilbert et al, 2008). Human-related 70
transmission (as illustrated by human density being the predominant risk factor) played an important 71
role in the first wave, whereas rice cropping intensity was the predominant risk factor in the second 72
wave. For the third wave, duck and rice cropping intensity became less strong predictors probably due 73
to control measures targeting duck populations during that period. Those studies provided a general 74
understanding of the main mechanisms involved in the epidemiology of HPAI in this region and their 75
Page 3 of 28 Transboundary and Emerging Diseases
4
possible evolution over the different waves: in particular the role of human activities in the 76
transmission process and the role of environment (mainly rice-related areas) as an indicator of the 77
presence of duck populations or as a component of the transmission and maintenance processes. 78
Previously, only one published case-control study has been carried out in Vietnam, at the farm level, 79
following outbreaks in the South in 2006 (Henning et al, 2009b). There have been no studies 80
investigating village-level indicators for HPAI infection. In order to define more detailed risk factors 81
at a smaller scale (village and farm), this case-control study was carried out in one province in 82
Northern Vietnam, Bac Giang, located 50 kms northeast of the capital Hanoi (Fig 1). Bac Giang had a 83
poultry population estimated around 10 millions in 2007 (GSO, 2010) of which around 1 million were 84
ducks. The province presents 3 distinct agro-ecological areas with one of them consisting of lowland, 85
typical of the rest of the Red River Delta area in terms of agricultural practices and poultry density 86
(Xiao, 2006; Desvaux and Dinh 2008). We focused our study in this lowland area since it is in this 87
type of agro-ecological area that outbreaks in northern Vietnam were mainly concentrated (Pfeiffer et 88
al, 2007; Minh et al, 2009). The objective of the study was to evaluate the risk factors related to the 89
human and natural environments and the poultry production systems on the introduction; transmission 90
or maintenance of the HPAI virus during the 2007 epidemic wave in Northern Vietnam, at both village 91
and farm levels. 92
2. MATERIALS AND METHODS 93
2.1. Study design overview 94
Two epidemiological units of interest were considered in this study: the village and the farm. Risk 95
factors were investigated using a non matched case-control study for the villages and a matched case-96
control study, based on farm production type and location, for farms. Questionnaires were designed 97
and administered between April and May 2008 and were related to outbreaks occurring in 2007. The 98
Page 4 of 28Transboundary and Emerging Diseases

5
epidemic wave period was defined as a window between February 2007 and August 2007 (DAH, 99
2008). 100
2.2. Data source and case and control selection 101
The initial data source used was provided by the Sub Department of Animal Health of Bac Giang 102
province where the study was based. The data included information on 2005 and 2007 H5N1 103
outbreaks aggregated at the village level and included both villages with disease outbreaks and 104
villages where only preventive culling had been performed. There was no precise indication of the 105
number of farms infected or culled in the villages. In addition, some outbreaks were based on reported 106
mortalities only whereas others also had laboratory confirmation of H5N1 infection. Laboratory 107
confirmation was performed either by the Veterinary Regional Laboratory or the National Centre for 108
Veterinary Diagnosis. Given these parameters, a village case was therefore initially defined as a 109
village having reported H5N1 mortality and/or a village with laboratory confirmation reported. 110
2.2.1. Case and control selection at village level 111
In order to further refine the list of village cases, the list of infected village obtained was checked by 112
field visits and discussion with local veterinary authorities (district and commune veterinarians) before 113
the study commenced. When local veterinary authorities agreed on the HPAI status of a particular 114
village, it was confirmed as a case. Where a discrepancy was found between our list and their reports, 115
details were requested on the mortality event in the village farms involved. A case-definition was then 116
applied on the description of symptoms provided by the local veterinarians and the village was defined 117
as a case if the following criteria were met in at least one farm in the village: 118
o per acute or acute disease (time from observed symptoms to mortality less than 2 119
days) 120
o mortality over 10 % within 1 day 121
Page 5 of 28 Transboundary and Emerging Diseases
6
o neurological signs in ducks if ducks were involved in the outbreak (head tilt, 122
uncoordinated movements) 123
o a positive result for a rapid diagnostic H5N1 test on sick birds if such a test had 124
been applied (usually not reported on our initial list). 125
At the end of the field interviews and before analysis, a final check of the case villages included was 126
carried out based on the answers to the village questionnaires. This enabled case villages where 127
mortalities had occurred outside the epidemic wave period to be removed from the study. 128
The villages from communes with outbreaks in 2005 or 2007 were also excluded to take into account 129
pre-emptive culling sometimes organized at a large scale. Control villages were randomly selected 130
from the remaining villages in the study area. Two controls were selected for each case. The selection 131
of control was stratified at the district level for administrative reason and to balance the number of 132
case and control per district. A last check on the selection of controls was performed based on the 133
answers to the questionnaire. Control villages reporting unusual poultry mortality in 2007 (anytime in 134
2007) were excluded from the analysis. 135
2.2.2. Case and control selection at farm level 136
The case farms were the first farms that had an outbreak in each of the case village. This was designed 137
to investigate risk factors of introduction. If this farm was not available, the nearest farm 138
(geographically) to be infected in 2007 was selected. 139
The matched control farms were selected among farms that never experienced an HPAI outbreak in 140
the same village as the case farm (matched by location) and were also matched by species and by 141
production type (broiler, layer or breeder). 142
2.3. Data collection 143
2.3.1. Questionnaires 144
Page 6 of 28Transboundary and Emerging Diseases

7
Two questionnaires were developed, for the village and the farm levels. The village questionnaire, 145
targeted at the head of the village, included general information about the village (number of 146
households, presence of a live bird market within or near the village, presence of wild birds), the list of 147
poultry farms in the village in 2007, the origin of day-old-chicks (DOC) in 2007, the vaccination 148
practices, the description of mortality events that had occurred in previous years and a description of 149
the HPAI outbreak for the village case (timeline, reporting, control measures). Where mortality events 150
had occurred in previous years, we asked for estimates of the percentage of households involved and 151
the date of this mortality event. The latter information was used to confirm the case or control status of 152
the villages by eliminating cases with mortalities outside the defined epidemic period and controls 153
with reported poultry mortality in 2007 (any report of poultry mortality by the head of the village was 154
considered as an unusual event since only significant mortality event are generally noticed by local 155
authority). 156
At the farm level, the questionnaire was targeted at the farmer or his/her family. The questions 157
included information on the composition of the farm poultry population in 2007, trading practices (to 158
whom they were selling and buying their birds), vaccination practices, and housing systems and for 159
the cases, a description of the HPAI outbreak event. General opinions of the farmers were also 160
collected regarding thoughts on why the farm had or did not have an HPAI outbreak. 161
2.3.2. Environmental and infrastructure data 162
As no Geographic Information System (GIS) map layers were available for the village administrative 163
level, the density of variables possibly related to the transmission of virus (transport network, running 164
water) or the persistence of virus (presence of rice fields and non running water) was calculated for a 165
500 m radius buffer zone from each village center using GIS software (ESRI ArcGISTM
, Spatial 166
Analyst, Zonal statistics as table function). GIS layers including transport networks, hydrographic 167
networks, lakes and ponds were bought from the National Cartography House in Hanoi. The density of 168
Page 7 of 28 Transboundary and Emerging Diseases

8
transport feature (national roads and all roads) and animal production-related water features (canals, 169
ponds and streams) were calculated within each buffer zone by dividing the number of pixels occupied 170
by a specific feature by the total number of pixels in the buffer. The size of a pixel was defined as 20 x 171
20 meters. A land cover map derived from a composite SPOT (Satellite Pour l’Observation de la 172
Terre) image supervised classification (Fig 1) was produced, validated by field visits and used to 173
characterize the landscape of our study area (Tollis, 2009). The density of 5 different land cover types 174
(water, rice, forest and fruit-tree, upland culture and residential areas) was calculated within each 175
buffer. 176
2.4 Data analysis 177
2.4.1. Univariate analyses 178
Statistical analyses were conducted using Stata 10 (StataCorp. 2007. Stata Statistical Software: 179
Release 10. College Station, TX: StataCorp LP) and R 2.11.1 softwares. The association between the 180
outcomes (being a case or a control) and each explanatory variable was assessed using exact logistic 181
regression (Hosmer and Lemeshow, 2000) (with the exlogistic command in Stata). A matched 182
procedure was undertaken for the matched case-control study at the farm level. P-values for each 183
variable were estimated using the Wald test (Hosmer and Lemeshow, 2000). Variables having a p-184
value ≤ 0.1 were candidates for inclusion in the multivariable model. All continuous variables were 185
tested for linearity assumption by comparing two models with the Likelihood Ratio test: a model using 186
a categorical transformation and a model with the same transformation but the variable treated as an 187
ordinal variable. Different categories were tested: either a transformation based on quintile (or quartile 188
depending on the distribution) or using equal range of values of the variable. 189
2.4.2. Multivariate analyses 190
For the unmatched case-control study at the village level only, an investigation of multivariate models 191
was undertaken. The first step was to build a model including all the explanatory variables selected 192
Page 8 of 28Transboundary and Emerging Diseases
9
during the univariate step. We also included into this model one environmental variable with a p-value 193
of less than 0.2. We then checked for collinearity among the variables in this model using -collin 194
command in Stata, checking that tolerance was of more than 0.1 (Chen et al, 2010). In order to take 195
into account our small sample size we used a backward stepwise selection method based on the 196
second-order bias correction Akaike Information Criteria comparison (AICc) (Burnham, 2004). 197
Variables were removed sequentially. At each step, the variable which removal resulted in the largest 198
AICc decrease was excluded. Goodness-of-fit of the final multivariate models was assessed using 199
Pearson’s chi square test. 200
3. RESULTS 201
3.1. Study population 202
After initial field visits for infected village selection and confirmation, we ended up with a total 203
number of 22 villages which had experienced an HPAI outbreak in Bac Giang in 2007. Among those 204
22 villages, 20 were targeted for interview (the 2 remaining ones belonged to 2 districts from more 205
remote areas not targeted in our study as not representative of the Red River Delta region) and 40 206
control villages were selected. One village could not be interviewed and after reviewing the mortality 207
criteria, a final total of 18 villages were included in our analysis as cases. The same procedure was 208
followed to check control villages and 6 were omitted because they did not meet the definition for a 209
control (unusual poultry mortalities was reported in 2007). In total, 18 case villages and 32 control 210
villages were included in the final analysis. 211
Using the established criteria, a total of 18 pairs of matched farms remained for the analysis. 212
3.2. Characteristics of the study population 213
The village study population (18 cases and 32 controls) were located within 6 districts and 32 different 214
communes. On average, the number of households per village was 218 (range 21-600). 215
Page 9 of 28 Transboundary and Emerging Diseases
10
The farm study population consisted of 18 pairs of case and control farms totaling 74 flocks, with 216
farms having on average 2.1 flocks (range 1-4, median2) of mixed poultry types. Duck flocks (N=34) 217
had numbers of birds ranging from 10 to 1050 (mean 351; median 200) with the main breeds being 218
Tau Khoang (N=11) and Super Egg (N=9). Chicken flocks (N=28) ranged from 10 to 2500 birds 219
(mean 363; median 230) with the main breeds being local (N=26). Muscovy duck flocks (N=12) 220
ranged from 20 to 400 birds (mean 160; median 200) with all flocks derived from the French breed. 221
3.2.1. Description of the case farms 222
Outbreaks had occurred in the farms between 7th
April 2007 and 23rd
June 2007. Among the 18 case 223
farms, clinical signs and mortality were reported from 63 % of the flocks (24/38). At the farm level 224
between 25 and 100% of the flocks were showing clinical signs and mortality. On average, 45% of the 225
birds in the infected flocks died before the remaining ones were culled (n=24, range 5-100). The 226
description of infected flocks by species, production type and age is given in Table I. The average age 227
of infected birds was 66 days (range 20-120 days, median 60). Fourteen case farms out of 18 were 228
reported to have been vaccinated against HPAI. The disease occurred on average 48 days after 229
vaccination (range 7-92, n=7). 230
3.2.2. Description of the report and culling delay 231
On average the farmers declared the disease to official veterinarians 2.8 days (range 1-8, n=18) after 232
the onset of the disease. There were on average 8.9 days between the onset of the disease at the farm 233
and the culling of the flock (range 1-31, n=16). 234
3.2.3. Farmers’ behavior and thoughts regarding HPAI source 235
Of 14 farmers who answered the question, 12 tried to cure their birds, 6 buried the dead birds, 4 threw 236
the dead birds into a river, channel or fish pond, 1 ate the dead birds and 1 tried to sell the sick birds. 237
The following possible causes of HPAI in the farm were quoted by the farmers: 238
- introduction from neighboring infected farms (3 answers) 239
Page 10 of 28Transboundary and Emerging Diseases

11
- contact with wild birds (2 answers) 240
- scavenging in rice fields (2 answers) 241
- contamination of the channel water due to animal burying nearby (1 answer) 242
- poisonous feed in rice field (1 answer) 243
Five farmers out of 18 did not believe their farm had HPAI even following veterinary authorities’ 244
confirmation of the diagnosis. 245
3.3. Vaccination practices in the village study population 246
Twelve percent (6/50) of the heads of village declared that vaccination was not compulsory, whereas it 247
is; but only one head of village declared that no AI vaccination had been used in the village. In the 248
majority of the villages (94% = 45/48), the small size farms had to take their birds to a vaccination 249
center. Those farms usually had less than 50 birds (56%=27/48 of the villages) or between 50-100 250
birds (35%=17/48). One village declared that farms up to 200 birds had to bring birds to the 251
vaccination center. The vaccination center was located within each village. In most of the villages 252
(90%) the head of the village declared that there was only one injection of HPAI vaccine per bird per 253
campaign. Heads of villages also reported that the vaccination coverage was not 100% due to 254
difficulty in catching some birds in the farms and also because certain farmers with small number of 255
birds did not want to vaccinate them. 256
3.3. Analyses at the village-level 257
Twenty eight potential risk factors were individually tested using simple exact logistic regression 258
method. Table II presents odds ratio (OR) estimation and their confidence intervals (CI). Then, eight 259
variables with p≤0.1 and the only environmental variable with a p-value less than 0.2 were included in 260
the initial multiple logistic regression model. Hatchery in the village (p-value of less than 0.1) was not 261
included in the model because of the limited number of units in one category, which caused a problem 262
with parameter estimation (Table II). The variable related to the number of flocks of more than 100 263
Page 11 of 28 Transboundary and Emerging Diseases

12
birds was of concern regarding collinearity (Tolerance=0.12). We tested the selection without this 264
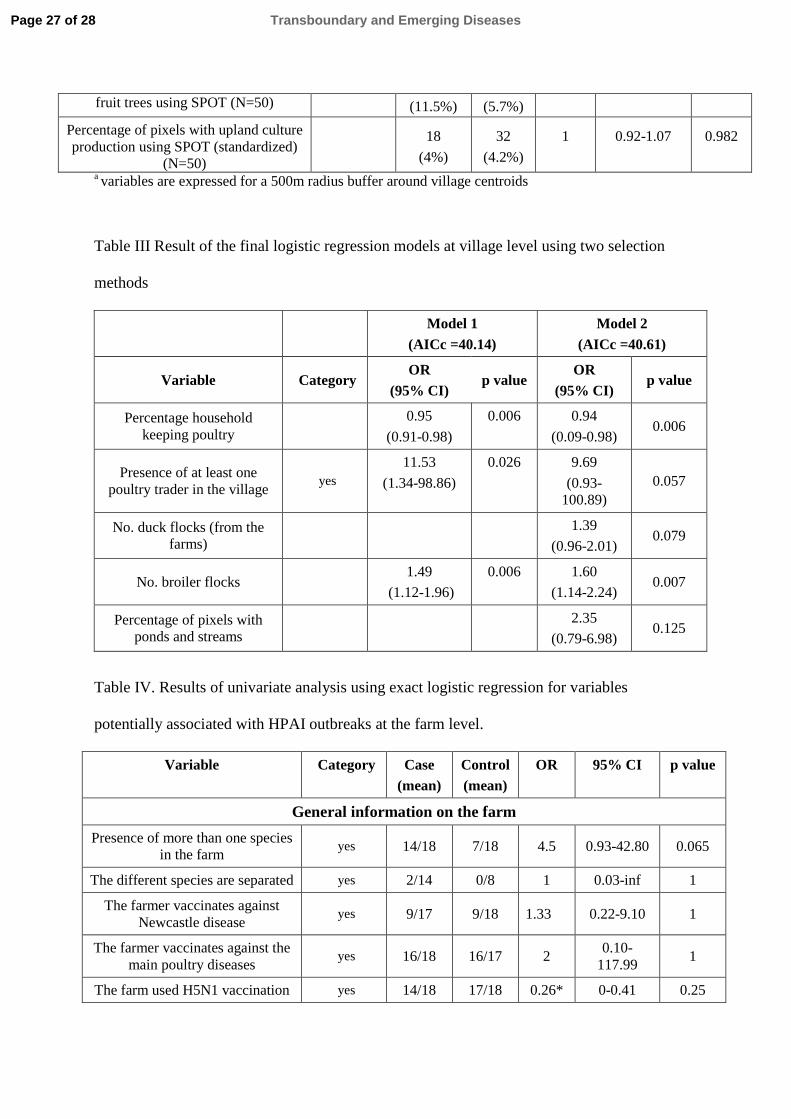
variable in the full model and came to the same result. . Table III provides a summary of the 2 models 265
obtained from the backyards selection based on the AICc. Those 2 models have an AICc that did not 266
differ by more than 2 points and can thus be considered as describing the data with equivalent quality 267
(Burnham, 2004). The lowest AICc model included three main predictors: percentage of households 268
keeping poultry, presence of at least one poultry trader in the village and number of broiler flocks. The 269
second lowest AICc model allowed the identification of risk factors of moderate effect. Indeed, model 270
2 identified two additional risk factors at the limit of significance: number of duck flocks and the 271
percentage of village area occupied by ponds and small streams. These two final models fitted the data 272
adequately (model 1: Pearson’s chi square = 37.33, df= 34, p value=0.3185; model 2: Pearson’s chi 273
square = 25.66, df=37, p value=0.9198) 274
3.4 Analysis at the farm-level 275
Three factors were significantly influential at the 5% level: the total number of birds in 2007 276
(p=0.005), number of flocks having access to water (p=0.027), and the number of broiler flocks in the 277
farm in 2007 (p=0.049). Two factors could be considered as significantly influential at the 10% level: 278
the presence of more than one species in the farm (p=0.065) and the total number of flocks in 2007 279
(p=0.089) (Table IV). No multivariate model was built due to limited sample size. 280
4. DISCUSSION 281
Our results confirm the role played by poultry movements and trading activities, detailed by different 282
indicators both at village and farm levels. Our results also suggest the role played by certain water 283
bodies in virus transmission or as a temporary reservoir. The precise influence of vaccination was 284
difficult to investigate due to limited data available. 285
4.1. Methodology 286
Page 12 of 28Transboundary and Emerging Diseases

13
Both studies suffered from low statistical power that probably led to conclude that some potential risk 287
factors did not have effect whereas they had one (type II error). 288
We especially faced some limitations in the analysis of the matched case-control study at farm level. 289
Indeed, the effective sample size is reduced by the matching procedure with only discordant pairs 290
included into the analysis (Dohoo et al, 2003). The number of farm cases could not be increased since 291
we had initially targeted all cases in our study area, but we should have tried to increase the number of 292
matched controls per case in order to increase the effective sample size. We also recognize that for 293
some questions recall bias may have occurred. This is particularly obvious for the questions related to 294
the detailed implementation of the vaccination (date and number of injections). However, for most of 295
the questions related to the structure of the village or the farm, no bias was suspected in the answers. 296
The selection biases were limited by our checking of the status at different steps of the study: field 297
verification after initial selection and elimination criteria based on mortality events after interviews 298
and before inclusion into the analysis. 299
4.2. Intensity of poultry movements and trading activity at the village and farm level 300
A higher number of broiler flocks was found to be a significant risk factor for HPAI outbreaks at both 301
the village and farm levels. Broiler production is characterized by a high turnover of birds because of 302
the short production cycle and by a high number of trading connections and poultry movements, with 303
several DOC supplies per year and visits by multiple traders when a flock is being sold. Furthermore, 304
H5N1 vaccination in Vietnam is normally carried out during 2 main campaigns per year, in March-305
April and October-November (FAO, 2010). In some areas vaccination is also organized between those 306
campaigns to better suit the production cycles but Bac Giang province was following the bi-annual 307
vaccination strategy in 2007. Thus, some broiler flocks could have been produced between the main 308
vaccination campaigns and thus not protected against the infection as demonstrated by serological 309
study of the vaccination coverage (Desvaux et al, 2010). Therefore, we can hypothesize that in 310
Page 13 of 28 Transboundary and Emerging Diseases

14
Vietnam the number of broiler flocks is a risk factor of H5N1 introduction because of the high poultry 311
trading movements related to this production type and because of the low vaccination coverage. 312
Broiler flocks may also better reveal virus circulation than layer flocks that are better vaccinated as 313
illustrated by the distribution of flocks affected in the case farms (Table I). Indeed, infected not 314
vaccinated flocks show a more typical HPAI clinical picture. Paul et al (2010) found that density of 315
broiler and layer ducks and, to a lesser extent, density of boiler and layer chickens was associated with 316
the risk of HPAI in Thailand where vaccination against HPAI is not applied. In our study we found 317
that only the number of broiler flocks is associated with this risk. 318
The presence of at least one poultry trader in the village was found to be significantly associated with 319
the risk of HPAI at the village level. This variable is an indicator of the poultry movements within the 320
village that may contribute to disease introduction and transmission. Traders are usually carrying 321
poultry on their motorbikes or on small trucks without significant biosecurity measures (Agrifood 322
Consulting International, 2007). They also often bring birds at home for few days in order to gather 323
enough animals for selling. Those practices probably contribute to the introduction of virus within the 324
village which can then be easily transmitted to village farms by animal and human movements. The 325
presence of a trader was not tested as a potential risk factor in previous studies. 326
We also found that a higher percentage of households keeping poultry was a protective factor at the 327
village level. In our sample of villages there was no correlation between the number of poultry farms 328
and this percentage meaning that it is more an indicator of the percentage of backyard poultry in the 329
village. Backyard production is defined as a poultry production of small size with low level of 330
investment and technical performance (Desvaux and Dinh, 2008). Thus, villages with high percentage 331
of households keeping backyard poultry are probably more rural and with a smaller human density 332
than others (human density figures were not available for our villages but we found a tendency for 333
negative correlation between household density and this percentage in our sample). The protective 334
Page 14 of 28Transboundary and Emerging Diseases
15
effect of low human density on the risk of HPAI has been reported in previous studies (Minh et al, 335
2009; Paul et al, 2010; Pfeiffer et al, 2007). Another observation that can be made from this result is 336
that even if the percentage of households keeping backyard poultry increases in a village, the risk of 337
HPAI does not increase. This could be explained by the backyard production system having less 338
trading activities and connections than semi-commercial farms. This result is also in accordance with 339
Paul et al’s (2010) results. It is also possible that people keeping backyard poultry pay less attention to 340
their birds than larger farmers. Thus, we cannot exclude the possibility that detection of HPAI suspect 341
cases is less efficient in this sector. 342
Finally, all the variables found positively associated with the risk of HPAI outbreaks in our study 343
explain how the disease can be spread form one village or farm to another, thus they are indicators of 344
the distribution mechanism. 345
4.3. Farm-level factors 346
Apart from a higher number of broiler flocks, , an increased number of birds and a greater number of 347
all poultry flocks were both also identified as potential risk factors by the univariate analysis at the 348
farm level. Size of the farm has already been described as a risk factor for HPAI infection (Thompson 349
et al, 2008). This may be explained by an increased frequency of potentially infectious contacts (e.g. 350
by traders, feed or DOC suppliers). Furthermore, viral transmission was also found to be dependent on 351
an increased number of birds (Tsukamoto et al, 2007). Thus a big farm may have more chance to 352
develop a typical H5N1 case with most of the birds being infected and showing symptoms and 353
subsequently being detected as a HPAI case. 354
The presence of more than one species in the farm was also positively associated with the risk of 355
HPAI. This variable may simply be an indicator of a farm having several flocks or an indicator of the 356
role of waterfowl in the increased risk of HPAI as discussed later. 357
Page 15 of 28 Transboundary and Emerging Diseases

16
Most of the farmers declared that their flocks were vaccinated against H5N1, but we can suspect a bias 358
in this answer since, as the vaccination was compulsory, the tendency might be to declare that the 359
flocks were vaccinated. Furthermore, there were too many missing data related to the date of 360
vaccination or the number of injections received to categorize the farms according to those criteria or 361
to observe this having an influence on the protection of the birds. The poor recording system, both at 362
farm or veterinary services levels, did not allow us to fully investigate the influence of vaccination 363
except indirectly by showing that broiler flocks, known to be less vaccinated, are also related to an 364
increased risk of infection. 365
4.4. Environmental and infrastructure variables at village and farm level 366
At the village level, a higher percentage of the village surface occupied by ponds and small streams 367
(defined as a 500 meters radius buffer zone around the village centroids) was found to increase the risk 368
of H5N1 outbreak in one of our models. At the farm level, a higher number of flocks having a housing 369
system with access to outdoor water was found to be a risk factor by the univariate analysis. The farm 370
level result corroborates the result at the village level since the water bodies involved in the poultry 371
farming of ducks and Muscovy ducks in Vietnam are usually ponds, canals or small streams, with the 372
birds being kept in a restricted area (around a pond or within part of a canal or small river) or with the 373
ducks ranging in the rice fields, canals and rivers during the day (Desvaux and Dinh, 2008). It was 374
also known, and reported by one of our interviewed farmers, that dead birds may be thrown into canals 375
or rivers by farmers, contributing to contamination of this possible reservoir of virus. In our study, the 376
density of canals within the 500 m buffer zone was not identified as a significant risk factor probably 377
because canals are more frequent outside the village than inside contrary to the ponds. Direct and 378
indirect contact with wild birds through the aquatic environment can also be hypothesized even if in 379
Vietnam infection from wild birds to domestic poultry has not been proven. Our results support the 380
previous work that faecal-oral transmission by contaminated water is a mechanism of avian influenza 381
Page 16 of 28Transboundary and Emerging Diseases

17
transmission (Brown et al, 2007), and our results suggest that contaminated water can play a part in 382
the transmission of the virus within a flock and also between flocks sharing the same environment at 383
the same time or at different periods (Brown et al, 2007; Brown et al, 2009; Tran et al, 2010). 384
Our study area was limited to few districts in one province and thus the heterogeneity of spatial 385
variables was limited. This may explain why we did not find any significant relationship between our 386
outcome and variables related to transport networks as shown in previous studies (Fang et al, 2008) 387
(Paul et al, 2010). 388
Density of waterfowl was recognized previously as a risk factor for disease occurrence, possibly due 389
to their potential role as a reservoir of infection (Biswas et al, 2009; Fang et al, 2008; Gilbert et al, 390
2006; Paul et al, 2010; Pfeiffer et al, 2007). Nevertheless, in our study, the number of duck flocks was 391
at the limit of significance at the village and farm levels, indicating that this species was not a 392
predominant risk factor for disease occurrence in 2007 in our study area. This might be explained in 393
the Vietnamese context by the prevention measures applied to that species (vaccination) and also to 394
the H5N1 strains circulating in North Vietnam. Indeed, as ducks were recognized as a silent carrier in 395
a study conducted in 2005 (National Center for Veterinary Diagnosis, 2005) the veterinary services 396
took the decision to vaccinate this species. Thus, in 2007 ducks in Vietnam were better protected 397
against infection than in the earlier waves of infection. Another significant change relates to the 398
predominant strains circulating in North Vietnam in 2007 (clade 2.3.4) (Nguyen et al, 2008) which are 399
more pathogenic for ducks than the original clade 1 strain (Swane and Pantin-Jackwood., 2008) and 400
may limit the role of silent carrier played by non-vaccinated ducks. 401
5. CONCLUSIONS. 402
Our results provide a better understanding of the local transmission mechanisms of the HPAI H5N1 403
virus in one province of the Red River Delta region by confirming and detailing the role played by 404
poultry movements and trading activities as well as water bodies in the introduction and transmission 405
Page 17 of 28 Transboundary and Emerging Diseases

18
of the H5N1 virus at the village and farm levels. Despite limited statistical power and possible 406
unrecognized risk factors of more limited effect, we were able to characterize the villages that may be 407
more at risk of H5N1 outbreaks based on the structure of their poultry production (a higher number of 408
broiler flocks), the presence of a poultry trader and a higher surface area of ponds or small streams. It 409
was interesting to note that broiler flocks are also those known to be less well vaccinated against 410
H5N1 due to their short production cycle. Thus, despite intensive mass communication and awareness 411
campaigns organized in Vietnam by different programs since HPAI first occurred, there are still 412
considerable at-risk behaviors and local disease transmission is still difficult to avoid. Nevertheless, it 413
should also be noted that detection of an H5N1 case may also be more challenging for farmers and 414
local veterinarians since clinical expression is probably altered in partially immunized populations. 415
We also recognize the limitation of classical epidemiological studies for investigating the effect of 416
vaccination in the absence of good recording systems. Use of modeling approaches to test effect of 417
different vaccination strategies on populations or capture-recapture methods using different 418
information sources may be more suitable techniques in that context. Finally, it is vital that the 419
scientific knowledge acquired is transformed into appropriate actions in terms of prevention and 420
surveillance. In this respect, better use of sociological approaches could also help to change high risk 421
practices. 422
423
Acknowledgments 424
We thank the French Ministry of Foreign and European Affairs for funding the Gripavi project in the 425
frame of which this work was done. We are grateful to the provincial veterinary services of Bac Giang 426
province that supported us for data collection and to Mrs Pham Thi Thu Huyen for the data entry. 427
Page 18 of 28Transboundary and Emerging Diseases
19
References 428
Agrifood Consulting International, 2007: The economic impact of highly pathogenic avian 429
influenza – Related biosecurity policies on the Vietnamese poultry sector. Poultry sector rehabilitation 430
project, Hanoi, Vietnam. 431
Biswas, P. K., J. P. Christensen, S. S. Ahmed, H. Barua, A. Das, M. H. Rahman, M. Giasuddin, A. S. 432
Hannan, A. M. Habib, and N. C. Debnath, 2009: Risk factors for infection with highly pathogenic 433
influenza A virus (H5N1) in commercial chickens in Bangladesh. Vet Rec. 164, 743-6. 434
Brown, J. D., D. E. Swayne, R. J. Cooper, R. E. Burns, and D. E. Stallknecht, 2007: Persistence of H5 435
and H7 avian influenza viruses in water. Avian Dis. 51, 285-9. 436
Brown, J. D., G. Goekjian, R. Poulson, S. Valeika, and D. E. Stallknecht, 2009: Avian influenza virus 437
in water: infectivity is dependent on pH, salinity and temperature. Vet Microbiol. 136, 20-6. 438
Burnham, K. P. and D. R. Anderson, 2004: Multimodel Inference. Understanding AIC and BIC in 439
model selection. Sociological Methods and Research 33, 261-304. 440
Chen, X., P. B. Ender, M. Mitchell and C. Wells, 2010: Logistic regression diagnosis. UCLA: 441
Academic Technology Services, Statistical Consulting Group. Available at 442
http://www.ats.ucla.edu/stat/stata/webbooks/logistic/chapter3/statalog3.htm.(accessed 10 march 2010). 443
DAH, 2008: Update on HPAI and FMS situation. Available at: 444
http://www.cucthuy.gov.vn/index.php?option=com_content&task=category§ionid=1&id=19&Ite445
mid=64.(accessed 7 march 2008) 446
Desvaux, S. and T. V. Dinh, 2008: A general review and a description of the poultry production in 447
Vietnam. Agricultural Publishing House, Hanoi, Vietnam. 448
Desvaux, S., M.Peyre, P.T.T Hoa, N.T.Dung and F.Roger, 2010: H5N1 avian influenza 449
seroprevalence in North Vietnam under a mass vaccination context. Options for the control of 450
influenza VII, Hong Kong SAR, China. 451
Page 19 of 28 Transboundary and Emerging Diseases

20
Dohoo, I., W. Martin, and H. Stryhn, Eds., 2003: Veterinary epidemiologic research. AVC Inc. 452
Fang, L. Q., S. J. de Vlas, S. Liang, C. W. Looman, P. Gong, B. Xu, L. Yan, H. Yang, J. H. Richardus, 453
and W. C. Cao, 2008: Environmental factors contributing to the spread of H5N1 avian influenza in 454
mainland China. PLoS One, 3, e2268. 455
FAO, 2010: Animal influenza disease emergency, situation update. FAO AIDE News 456
Gilbert, M., P. Chaitaweesub, T. Parakamawongsa, S. Premashthira, T. Tiensin, W. Kalpravidh, H. 457
Wagner, and J. Slingenbergh, 2006: Free-grazing ducks and highly pathogenic avian influenza, 458
Thailand. Emerg Infect Dis. 12, 227-34. 459
Gilbert, M., X. Xiao, D. U. Pfeiffer, M. Epprecht, S. Boles, C. Czarnecki, P. Chaitaweesub, W. 460
Kalpravidh, P. Q. Minh, M. J. Otte, V. Martin, and J. Slingenbergh, 2008: Mapping H5N1 highly 461
pathogenic avian influenza risk in Southeast Asia. Proc Natl Acad Sci U S A, 105, 4769-74. 462
GSO, 2010: Number of poultry per province. Available at 463
http://www.gso.gov.vn/default_en.aspx?tabid=469&idmid=3&ItemID=8846.(Accessed 1st July 2010) 464
Henning, J., D. U. Pfeiffer, and T. Vu le, 2009a: Risk factors and characteristics of H5N1 Highly 465
Pathogenic Avian Influenza (HPAI) post-vaccination outbreaks. Vet Res. 40, 15. 466
Henning, K. A., J. Henning, J. Morton, N. T. Long, N. T. Ha, and J. Meers, 2009b: Farm- and flock-467
level risk factors associated with Highly Pathogenic Avian Influenza outbreaks on small holder duck 468
and chicken farms in the Mekong Delta of Viet Nam. Prev Vet Med. 91, 179-88. 469
Hosmer D.W. and S. Lemeshow, 2000: Applied logistic regression, 2nd
edition. Wiley, New York. 470
Minh, P. Q., R. S. Morris, B. Schauer, M. Stevenson, J. Benschop, H. V. Nam, and R. Jackson, 2009: 471
Spatio-temporal epidemiology of highly pathogenic avian influenza outbreaks in the two deltas of 472
Vietnam during 2003-2007. Prev Vet Med. 89, 16-24. 473
National Center for Veterinary Diagnosis, 2005: Report on pilot surveillance of avian influenza. DAH, 474
Hanoi, Vietnam. 475
Page 20 of 28Transboundary and Emerging Diseases
21
Nguyen., T. D., T. V. Nguyen., D. Vijaykrishna., R. G. Webster., Y. Guan., J. S. M. Peiris., and G. J. 476
D. Smith, 2008: Multiple sublineages of Influenza A virus (H5N1), Vietnam, 2005−2007. Emerg 477
Infect Dis. 4, 632-636. 478
OIE, 2008: World animal health. Available at http://www.oie.int/eng/info/en_sam.htm.(accessed 7 479
march 2008) 480
Paul, M., S. Tavornpanich, D. Abrial, P. Gasqui, M. Charras-Garrido, W. Thanapongtharm, X. Xiao, 481
M. Gilbert, F. Roger, and C. Ducrot, 2010: Anthropogenic factors and the risk of highly pathogenic 482
avian influenza H5N1: prospects from a spatial-based model. Vet Res. 41, 28. 483
Pfeiffer.D.U, Minh.P.Q, Martin.M, Epprecht.M, and Otte.M.J, 2007: An analysis of the spatial and 484
temporal patterns of highly pathogenic avian influenza occurrence in Vietnam using national 485
surveillance data. Vet J. 174, 302-9. 486
Swane., D. E. and M. Pantin-Jackwood, 2008: Pathobiology of avian influenza virus infections in 487
birds and mammals. In. Swane D. E (ed), Avian influenza, 1st edn. pp 87-122. Blackwell Publishing, 488
USA. 489
Thompson, P. N., M. Sinclair, and B. Ganzevoort, 2008: Risk factors for seropositivity to H5 avian 490
influenza virus in ostrich farms in the Western Cape Province, South Africa. Prev Vet Med. 86, 139-491
52. 492
Tollis S., 2009: Application de la télédétection à moyenne résolution spatiale et des systèmes 493
d'information géographique à la définition d'indicateurs environnementaux relatifs au risque de grippe 494
aviaire au Vietnam. Report for Professional Master 2 in Geomatic. University of Toulouse, France. 495
Tran., A., F. Goutard., L. Chamaillé., N. Baghdadai., and D. L. Seen, 2010: Remote sensing and avian 496
influenza: A review of image processing methods for extracting key variables affecting avian 497
influenza virus survival in water from Earth observation satellites. International Journal of applied 498
Earth observation and geoinformation, 12, 1-8. 499
Page 21 of 28 Transboundary and Emerging Diseases

22
Tsukamoto, K., T. Imada, N. Tanimura, M. Okamatsu, M. Mase, T. Mizuhara, D. Swayne, and S. 500
Yamaguchi, 2007: Impact of different husbandry conditions on contact and airborne transmission of 501
H5N1 highly pathogenic avian influenza virus to chickens. Avian Dis. 51, 129-32. 502
Whittingham, M. J., P. A. Stephens, R. B. Bradbury, and R. P. Freckleton, 2006: Why do we still use 503
stepwise modeling in ecology and behaviour? J Anim Ecol. 75, 1182-9. 504
Xiao, X. M., S Boles,S. Frolking, C. S.Li, J. Y.Babu, W. Salas, B Mooren 2006: Mapping paddy rice 505
agriculture in South and Southeast Asia using multi-temporal MODIS images. Remote Sensing of 506
Environment, 100, 95-113. 507
508
509 510 511
512
Page 22 of 28Transboundary and Emerging Diseases
23
Figure Legend 513
Figure 1. Bac Giang province land cover map derived from composite SPOT image supervised 514
classification 515 516
517
Page 23 of 28 Transboundary and Emerging Diseases
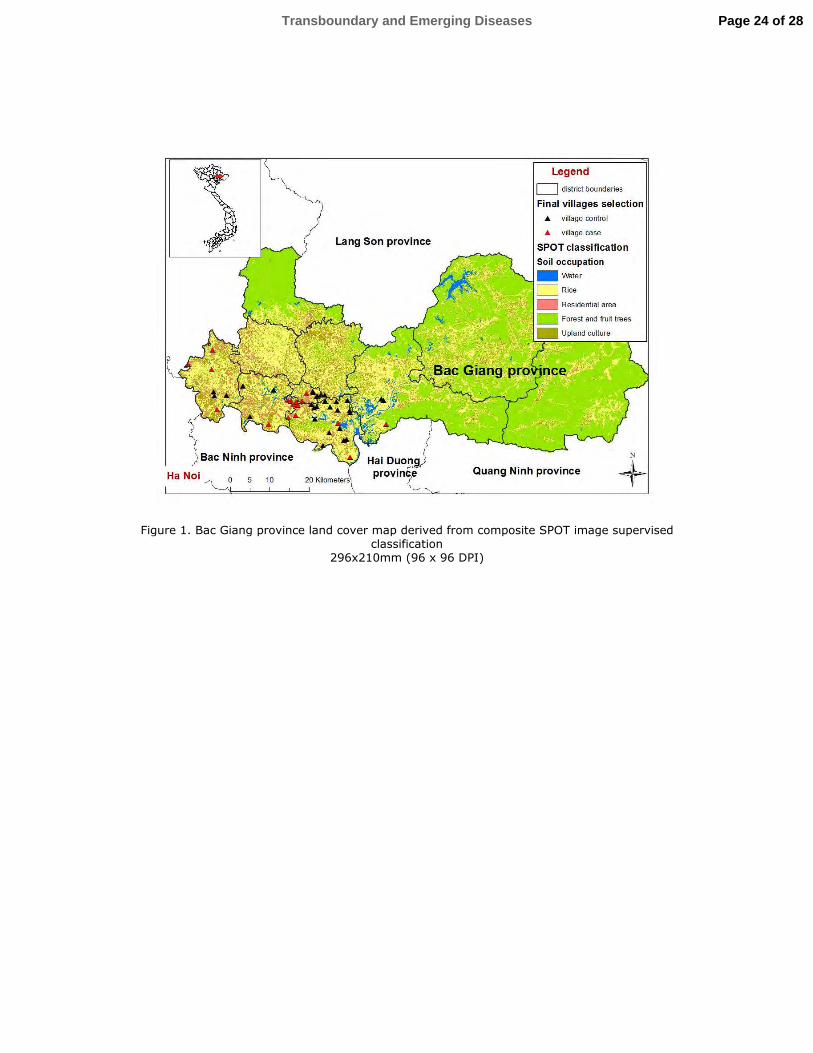
Figure 1. Bac Giang province land cover map derived from composite SPOT image supervised classification
296x210mm (96 x 96 DPI)
Page 24 of 28Transboundary and Emerging Diseases

Tables
Table I Description of the infected flocks in the case farms
Species No.
flocks
No. flocks with
clinical signs or
mortality
No. broiler
flocks with
clinical signs or
mortality
No. breeder or
layer flocks with
clinical signs or
mortality
Mean age of the
affected flock in
days (min-max)
Chicken 15 10 10/13 0/2 78 (30-120)
Duck1 16 10 7/9 1/5 53 (20-90)
Muscovy
Duck
7 4 4/7 0/0 71 (45-90)
38 24 21/29 1/7 1 The production type of 2 duck flocks with clinical signs was not recorded because the farmer answered
globally for all his duck flocks
Table II Results of univariate analysis using exact logistic regression for variables potentially
associated with HPAI outbreaks at the village level.
Variable Category Case
(mean)
Control
(mean) OR 95% CI p value
General information on the village
No. households in the village in 2007
(N=49)
18
(260)
31
(195) 1 1-1.01 0.094
Percentage household keeping poultry
(N=44)
16
(65%)
28
(83%)
0.98
0.96-1.00
0.053
A few 9 23 1
Wild birds present in rice fields around
the village (N=50) A lot 9 9
2.51
0.65-10.03
0.216
A few 13 23 1
Wild birds present in the village (N=50) A lot 5 9
0.98
0.21-4.16
1
Live bird market present in the village
in 2007 (N=50) Yes 5/18 3/32 33.6
0.60-26.84
0.197
Presence of at least one poultry trader in
the village in 2007(N=50) Yes 10/18 5/32 6.45
1.40-32.08
0.009
Presence of at least one bird hunter in
the village in 2007 (N=49) Yes 8/17 8/32
2.61
0.64-11.00
0.214
Presence of at least one hatchery (N=50) Yes 3/18 0/32 7.55
0.77-inf
0.083
Poultry production in the village in 2007
No. flock (from farms) of more than 100 18 32 1.31 1.11-1.58 0.001
Page 25 of 28 Transboundary and Emerging Diseases

birds (N=50) (6.6) (4.4)
Percentage of farms vaccinated against
HPAI (N=43)
14
(74%)
29
(79%)
0.98
0.95-1.02
0.341
Species
No chicken flocks (from the farms)
(N=50)
18
(4)
32
(2.7)
1.18
0.95-1.48
0.141
No. duck flocks (from the farms)
(N=50)
18
(4.3)
32
(2.3) 1.25
1.02-1.58
0.029
Presence of Muscovy duck flock(s) in
the village (N=50)
13/18
8/32
7.43
1.81-35.98
0.003
Production type
No. broiler flocks (N=50) 18
(7.1)
32
(3.2)
1.38
1.14-1.71
<0.001
No. breeder flocks (N=50) 18
(0.5)
32
(0.3)
1.30
0.56-3.00
0.606
No. layer flocks (N=50) 18
(2.2)
32
(1.8) 1.06
0.83-1.35
0.662
Housing system
No enclosed flocks (N=50) 18
(2.2)
32
(3.3)
0.85
0.65-1.07
0.207
No. fenced flocks (outdoor access)
(N=50)
18
(5.8)
32
(1.8)
1.49
1.18-1.98
<0.001
Presence of scavenging flock(s) (N=50) 6/18
4/32
3.4
0.67-19.64
0.165
Spatial a
Percentage of pixels with canals (N=50) 18
(0.8%)
32
(0.6%)
1.16
0.72-1.80
0.559
Percentage of pixels with ponds and
streams (N=50)
18
(1.8%)
32
(1.1%)
1.25
0.91-1.75
0.170
Percentage of pixels with national roads
(N=50)
18
(1.2%)
32
(1.1%)
1.04
0.77-1.38
0.773
Percentage of pixels with all kind of
roads (N=50)
18
(2.4%)
32
(1.9%)
1.07
0.85-1.33
0.571
Percentage of pixels with water using
SPOT (N=50)
18
(6.2%)
32
(5.5%)
1.01
0.95-1.06
0.790
Percentage of pixels with rice using
SPOT (N=50)
18
(54.6%)
32
(59.1%)
0.99
0.96-1.02
0.452
Percentage of pixels with residential
area using SPOT (N=50)
18
(23.6%)
32
(25.5%)
0.99
0.95-1.03
0.671
Percentage of pixels with forest and 18 32 1.02 0.99-1.06 0.228
Page 26 of 28Transboundary and Emerging Diseases
fruit trees using SPOT (N=50) (11.5%) (5.7%)
Percentage of pixels with upland culture
production using SPOT (standardized)
(N=50)
18
(4%)
32
(4.2%)
1
0.92-1.07
0.982
a variables are expressed for a 500m radius buffer around village centroids
Table III Result of the final logistic regression models at village level using two selection
methods
Model 1
(AICc =40.14)
Model 2
(AICc =40.61)
Variable Category OR
(95% CI) p value
OR
(95% CI) p value
Percentage household
keeping poultry
0.95
(0.91-0.98)
0.006 0.94
(0.09-0.98) 0.006
Presence of at least one
poultry trader in the village yes
11.53
(1.34-98.86)
0.026 9.69
(0.93-
100.89)
0.057
No. duck flocks (from the
farms)
1.39
(0.96-2.01) 0.079
No. broiler flocks 1.49
(1.12-1.96)
0.006 1.60
(1.14-2.24) 0.007
Percentage of pixels with
ponds and streams
2.35
(0.79-6.98) 0.125
Table IV. Results of univariate analysis using exact logistic regression for variables
potentially associated with HPAI outbreaks at the farm level.
Variable Category Case
(mean)
Control
(mean)
OR 95% CI p value
General information on the farm
Presence of more than one species
in the farm yes 14/18 7/18 4.5 0.93-42.80 0.065
The different species are separated yes 2/14 0/8 1 0.03-inf 1
The farmer vaccinates against
Newcastle disease yes 9/17 9/18 1.33 0.22-9.10 1
The farmer vaccinates against the
main poultry diseases yes 16/18 16/17 2
0.10-
117.99 1
The farm used H5N1 vaccination yes 14/18 17/18 0.26* 0-0.41 0.25
Page 27 of 28 Transboundary and Emerging Diseases

farmer 2 2 1 Person in charge of the H5N1
vaccination veterinarian
or paravet. 12 15 0.5 0.01 -9.61 1
Trading activity of the farm
The farm is trading with a trader yes 10/14 17/18 0.25 0.01-2.53 0.375
The farm is trading with a market yes 2/16 2/18 1 0.07-13.80 1
Percentage of poultry product sold
to a collector
14
(59%)
18
(76%) 0.99 0.96-1.01
0.313
Percentage of poultry product sold
to another farmer 14
(29%)
18
(17%) 1.01 0.99-1.05 0.311
Percentage of poultry product sold
to a market 14
(4%)
18
(7%) 0.99 0.93-1.03 0.625
The farmer has a trading activity yes 0/18 1/18 1* 0-39 1
No. of laying and breeding flocks
in the farm in 2007 18
(0.5)
18
(0.5) 1 0.29-3.38 1
No.of broiler flocks in the farm in
2007 18
(1.9)
17
(1.7) 3.27 1-24.87 0.049
Total no. of flocks in the farm in
2007 18
(2.4)
18
(1.7) 1.98 0.92-5.51 0.089
No. of chicken flocks in the farm
in 2007 18
(0.9)
18
(0.7) 2.49 0.52-23.06 0.359
No. of duck flocks in the farm in
2007 18
(1.1)
18
(0.8) 3.36 0.74-31.09 0.148
No. of Muscovy duck flocks in the
farm in 2007 18
(0.4)
18
(0.3) 2 0.29-22.11 0.688
Total no. of birds in 2007
18
(954)
18
(406) 1 1-1.01 0.006
Total no. of production cycles in
2007 18
(2.8)
18
(2.2) 1.32 0.80-2.43 0.324
Housing and feeding system and water source
No. of flocks having housing
without access to water 18
(0.6)
18
(0.7) 0.86 0.22-3.07 1
No. of flocks having housing with
access to water 18
(1.7)
18
(1.1) 5.81
1.11-
236.82 0.027
well 11 15 1 Source of drinking water
pond or
river 7 3 5.28* 0.66-inf 0.125
* Median unbiased estimates (MUE) reported instead of the conditional maximum likelihood
estimates (CMLEs)
Page 28 of 28Transboundary and Emerging Diseases