Municipal Groundwater Monitoring in Waterloo Region - Solinst · Municipal Groundwater Monitoring...
45
Tammy Middleton, M.Sc. P.Geo. Senior Hydrogeologist Regional Municipality of Waterloo Municipal Groundwater Municipal Groundwater Monitoring in Waterloo Monitoring in Waterloo Region Region
Transcript of Municipal Groundwater Monitoring in Waterloo Region - Solinst · Municipal Groundwater Monitoring...

Tammy Middleton, M.Sc. P.Geo.
Senior Hydrogeologist
Regional Municipality of Waterloo
Municipal GroundwaterMunicipal GroundwaterMonitoring in WaterlooMonitoring in Waterloo
RegionRegion

Presentation OverviewPresentation Overview
• Waterloo Region
• Groundwater
monitoring programs
– Overview and
examples
• Clean Water Act
• Next Steps/Lessons
Learned

7 Municipalities
525,000 people
12.5 Billion Igal
17 water supply
systems
13 waste water
systems (2009)

Water SourcesWater Sources
• Surface Water
– Intake at Grand
River (Kitchener)
– Treatment at
Mannheim WTP
– 20%

Water SourcesWater Sources
Groundwater Wells
– 120 wells
– GUDI Wells (under
influence of surface
water)
– Aquifer Storage &
Recovery Wells
– Waterloo Moraine,
Fractured Rock, and
River Collector wells
– 80%

Water Sources
Rural
& Urban
Elmira
Cambridge
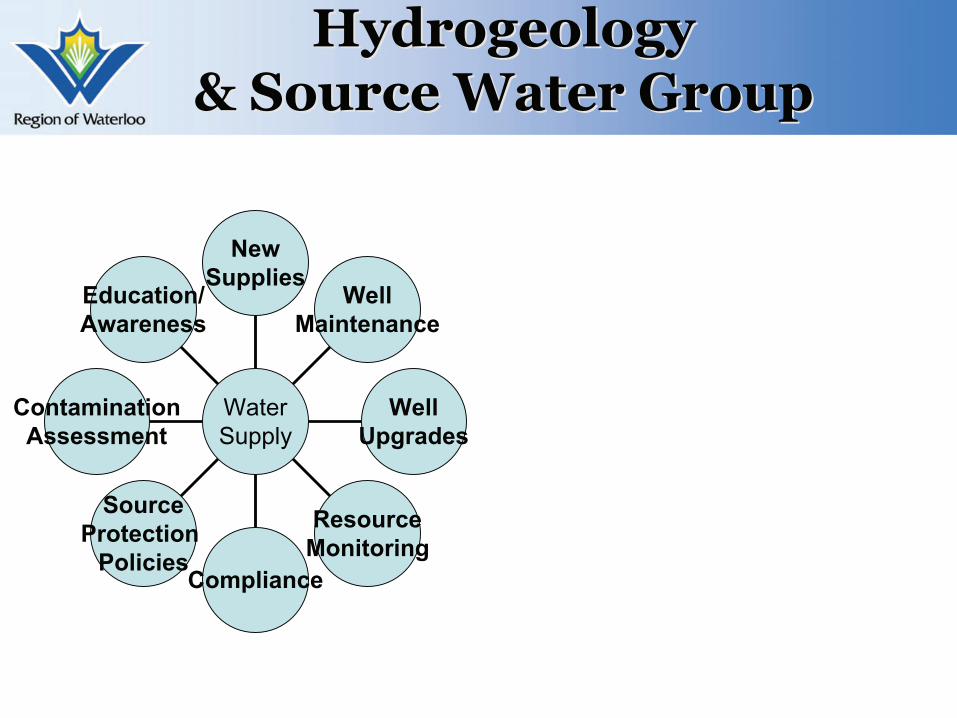
HydrogeologyHydrogeology
& Source Water Group& Source Water Group
Education/
Awareness
Contamination
Assessment
Source
Protection
PoliciesCompliance
Resource
Monitoring
Well
Upgrades
Well
Maintenance
New
Supplies
Water
Supply

Monitoring ProgramsMonitoring Programs
• 120 Production Wells
• 50 Monitoring Well nests (quality)
• 170 Monitoring Well nests (levels)
• RoW Laboratory
• On-line analyzers
• Monitoring Scope:
– Regulatory &
– “Beyond-Regulatory”

Monitoring Program ObjectivesMonitoring Program Objectives
Compliance with Legislation
Proactive monitoring - early warning of
supply or contamination issues
Sustainable management of groundwater
resources
Understanding the hydrogeological systems

Compliance with Compliance with
LegislationLegislation
$664,456
$880,627
$198,384
Labcharges*
139,05728,3692001
41,13611,1731999
131,37918,3112009
# tests# samples
* Not including Water Protection extra samples
Water samples and laboratory testing

Proactive Monitoring Proactive Monitoring
GreenbrookGreenbrook Wellfield Wellfield
• 5 overburden wells (Waterloo moraine)
• Park/residential area
• GUDI wellfield
• 2.5 million gal/day (125 L/s) production
• Fe, Mn treatment
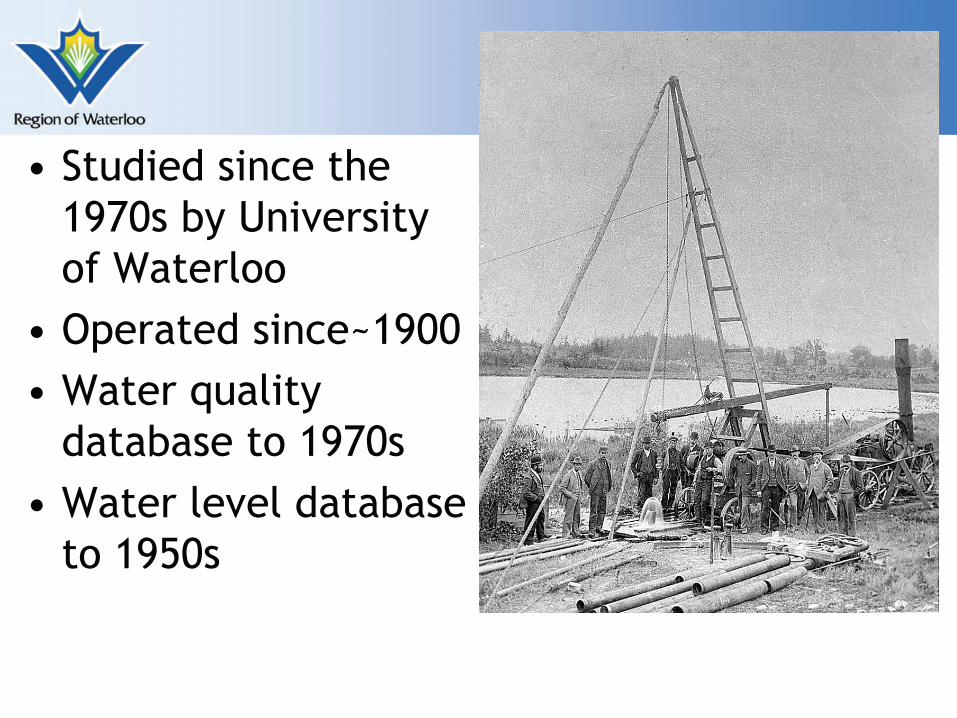
• Studied since the
1970s by University
of Waterloo
• Operated since~1900
• Water quality
database to 1970s
• Water level database
to 1950s

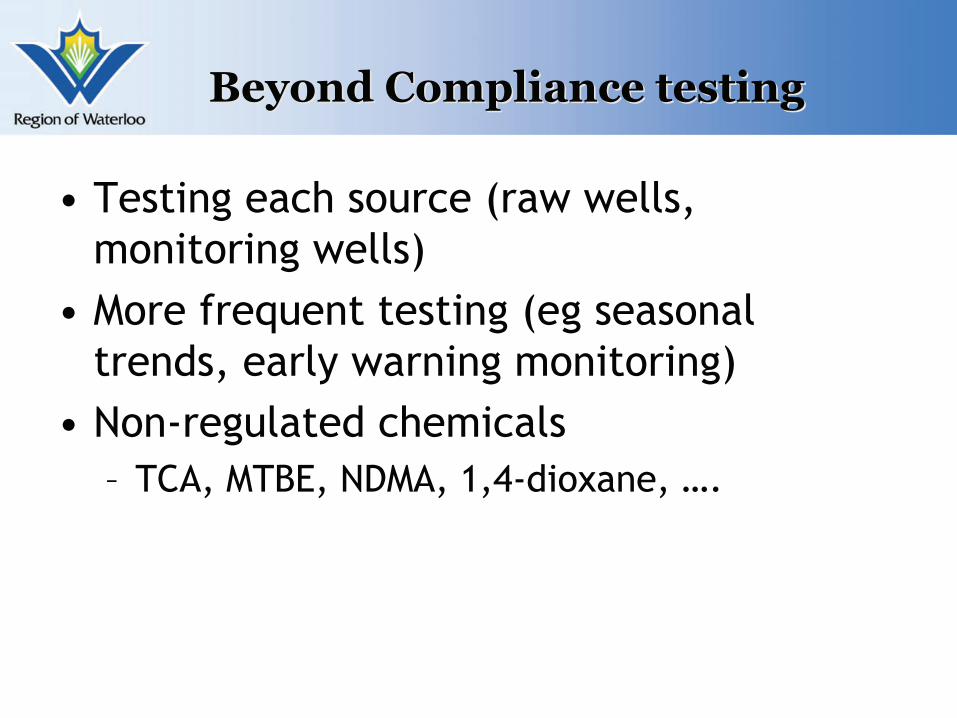
Beyond Compliance testingBeyond Compliance testing
• Testing each source (raw wells,
monitoring wells)
• More frequent testing (eg seasonal
trends, early warning monitoring)
• Non-regulated chemicals
– TCA, MTBE, NDMA, 1,4-dioxane, ….
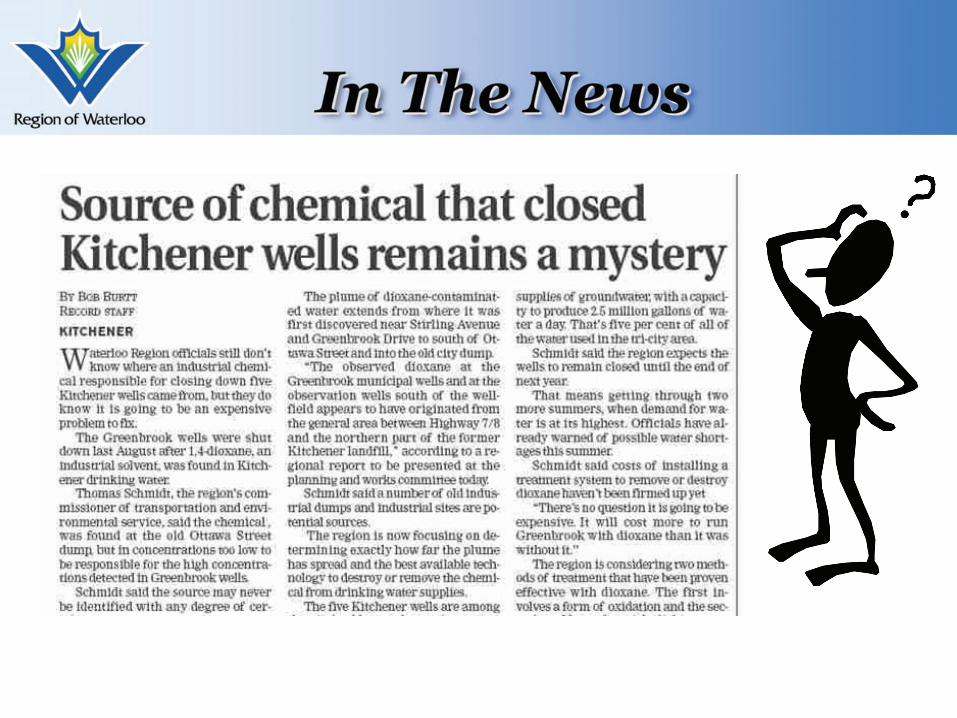
In The NewsIn The News
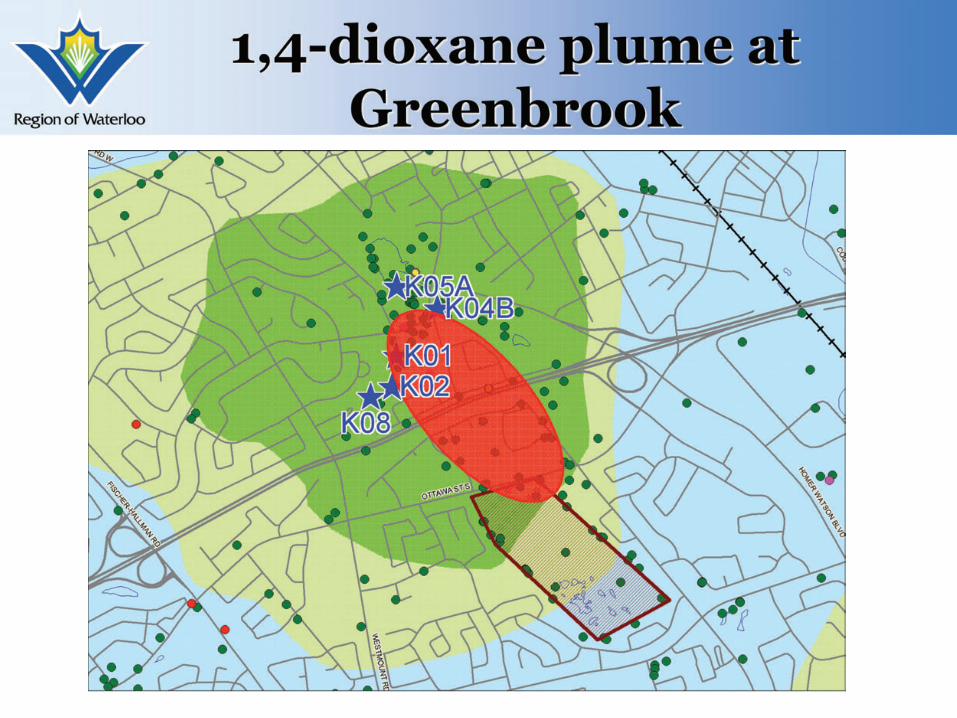
1,4-dioxane plume at1,4-dioxane plume at
GreenbrookGreenbrook

UV - Hydrogen Peroxide

Aside: The challenges of well fields in developed areas

SustainableManagement
Well/Aquifer
optimization
GUDI research
Well
decommissioning

Greenbrook Water Level Monitoring
300
305
310
315
320
325
330
1980
1985
1990
1995
2000
2005
2010
m A
SL
M4-94B OW1-76


Understanding HydrogeologicalUnderstanding Hydrogeological
Systems Systems - Middleton St. Wellfield- Middleton St. Wellfield
• 5 bedrock wells
(Guelph/Gasport fms)
• Residential/Industrial area,
Cambridge
• GUDI wellfield
• 5 mil gal/day (250 L/s), 40%
of Cambridge water supply
• Under construction for TCE
treatment
• Must ensure un-interrupted
wellfield operation

250
255
260
1-Sep-09
2-Sep-09
3-Sep-09
4-Sep-09
5-Sep-09
6-Sep-09
7-Sep-09
8-Sep-09
Ele
va
tio
n m
as
l
MW1A-08
MW1B-08
MW1C-08
• Importance of appropriate water level monitoring
to understand hydrogeology
• Cost effective
250
255
260
1-Sep-09
2-Sep-09
3-Sep-09
4-Sep-09
5-Sep-09
6-Sep-09
7-Sep-09
8-Sep-09
Ele
va
tio
n m
as
l
MW1A-08
MW1B-08
MW1C-08


• Regulatory requirement
to complete long-term
GUDI monitoring
• Operational constraints-
ensure continuous supply
AND manage TCE levels
in finished water
• Continuous turbidity
meters
• SCADA
• Electronic water level
measurements
GUDI monitoring at anGUDI monitoring at an
operating wellfieldoperating wellfield

• Continuous waterlevels, onlineturbidity, now akey component ofmanagementduring Middletonstationconstruction
• Reliable, cost-effective,minimuminterference withconstructionschedule
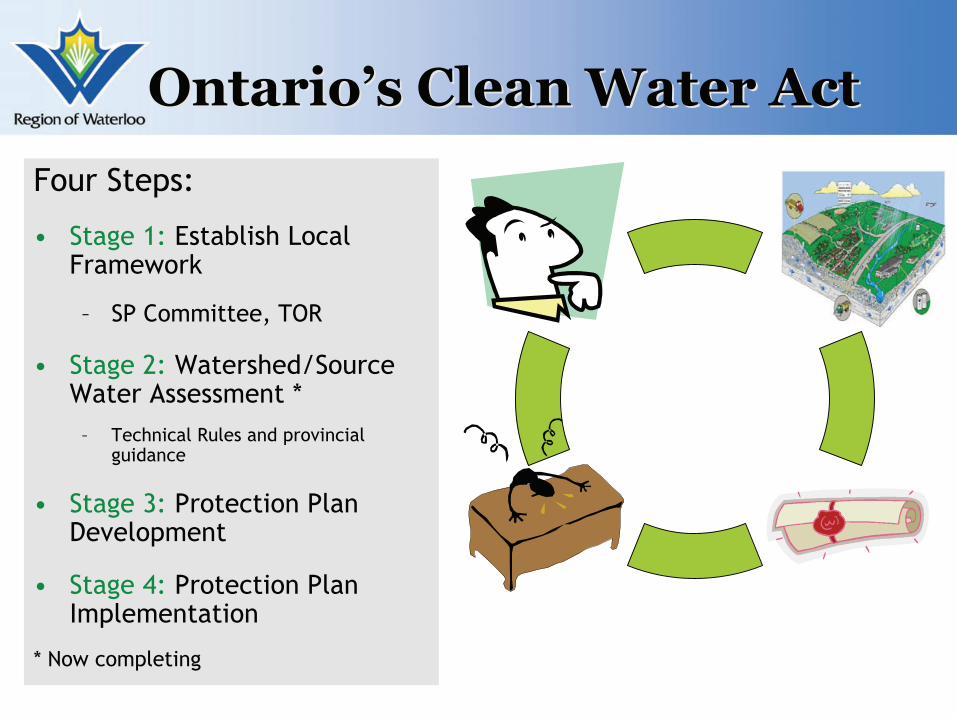
OntarioOntario’’s Clean Water Acts Clean Water Act
Four Steps:
• Stage 1: Establish LocalFramework
– SP Committee, TOR
• Stage 2: Watershed/SourceWater Assessment *
– Technical Rules and provincialguidance
• Stage 3: Protection PlanDevelopment
• Stage 4: Protection PlanImplementation
* Now completing

Grand River SourceGrand River Source
Protection AreaProtection Area


CWA CWA ““Threats & IssuesThreats & Issues””
• Threat: potential source of groundwater
contamination
• Condition: area that is already
contaminated
• Issue: documented contamination within
a water intake– According to Technical Rules- must use data to
identify contamination and/or trends

IssuesIssues Assessment Assessment
ResultsResults
• Issues at 13 wellfields
• Urban & rural
• “Issue Contributing
Areas” defined
• Related Threats
become significant
within ICAs
• Nitrate
• Salt (chloride,
sodium)
• Trichloroethylene
• ROW already
monitoring and
addressing these
issues

Example: TCEExample: TCE
TCE TRENDS
MIDDLETON STREET WELLFIELD
0
1
2
3
4
5
6
7
8
9
10
11
12
01-Ja
n-02
01-Ja
n-04
01-Ja
n-06
01-Ja
n-08
01-Ja
n-10
DATE
TC
E C
ON
CE
NT
RA
TIO
N (
ug
/L)
G01 G01A G02 G14 G03
Reservoir
Concentration =
~2.5 ppb

Example: SaltExample: Salt
0
100
200
300
400
1970
1975
1980
1984
1990
1995
2000
2005
2010
CH
LO
RID
E
mg
/L
G01 G01A G02 G03 G14
Chloride Trends- Middleton St. Wellfield

Salt Sources – Parking Lots

72 74 76 78 80 82 84 86 88 90 92 94 96 98 00 02 04 06 08Year
0
50
100
150
200
250
300
350
400m
g/L
LegendSodium Concentration
Chloride Concentration
Regional Supply Well G5
ODWS for Chloride
ODWS for Sodium‘94 ‘98

Example: NitrateExample: Nitrate
NITRATE -WILMOT CENTRE
0
2
4
6
8
10
19801984
19901995
20002005
2010
NIT
RA
TE
m
g/L
K50 K51

Next: Possible SPP ActivitiesNext: Possible SPP Activities
Financial Incentives for
improved farm
management
Land purchase of most
vulnerable areas
Business
inspections
Risk management
plans
Financial incentives
to reduce spill risk
Municipal road-salt
management plans
Smart about Salt
accreditation
Salt management
for new
development
Update Official
Plan
• Studies and
restrictions

Challenges/Lessons LearnedChallenges/Lessons Learned
• Large program- 38
wellfields
– Have monitoring objectives
and prioritize
– Look for technology,
efficiency, simplicity
– Allocate manpower,
resources
– I take suggestions!

Challenges/Lessons LearnedChallenges/Lessons Learned
Effective Monitoring– Set monitoring program
objectives
– Plan ahead - what datawill you need in 1 year?10 years?
– Tailor monitoring toyour objectives andreport accordingly
– Contingency plans torespond to monitoringdata

Challenges/Lessons LearnedChallenges/Lessons Learned
• Data
– Set procedures for data review
and management (SOPs)
– ROW datasets too large for usual
computer tools
– Team with data experts,
automate as much as possible
– Integrate with the lab
– Make QA/QC a priority
– New technology, GIS databases
– Avoid proprietary programs for
data storage
20,482
2,6913,572
21ppm
39
86%
3467
2
IPZ
6m bgs
OW1-90
Non-agricultural source
material
365.23 m asl
37
919
20
69
139
14%
6
818 Road salt
Condition
Solvent
TCE
Moderate
3
91
ODWS
2,691
13
39
86%
DNAPL
20
6.8
9
Condition
TCE
91
39685
Significant
919
13
14%
6
3
91
WHPA-A
13
9
Travel blank 91
turbidity


Challenges/Lessons LearnedChallenges/Lessons Learned
• Large and aging monitoring
network
– Regulatory burden: work
with MOE inspectors to
prioritize, anticipate
– Plan and carry out an
inspection/maintenance
program
– Technology- finding and
replacing/plugging aging
wells
– Limit new permanent
installations (technology?)

Challenges/Lessons LearnedChallenges/Lessons Learned
• Working in an increasingly
regulated environment
– Communicate with MOE, foster
professional relationships
– Get legal advice
– Comply, but don’t be afraid to
challenge, MOE will listen
– Be careful about communicating
monitoring results, to avoid
time-wasting “compliance”
misunderstanding, eg.
Preliminary results vs final
– Look ahead, stay educated for
new rules (eg Clean Water Act)

Questions?Questions?