
Munich Personal RePEc Archive - uni-muenchen.de Personal RePEc Archive ... The paper aimed at...
21
Munich Personal RePEc Archive Asymetric Effect of Oil Price Shocks on Exchange Rate Volatility and Domestic Investment in Nigeria Hodo B. Riman and Emmanuel S. Akpan and Amenawo I Offiong University of Calabar, Nigeria, University of Calabar, Nigeria, University of Calabar, Nigeria 26. February 2013 Online at http://mpra.ub.uni-muenchen.de/53282/ MPRA Paper No. 53282, posted 31. January 2014 13:30 UTC
-
Upload
duongtuyen -
Category
Documents
-
view
216 -
download
2
Transcript of Munich Personal RePEc Archive - uni-muenchen.de Personal RePEc Archive ... The paper aimed at...

MPRAMunich Personal RePEc Archive
Asymetric Effect of Oil Price Shocks onExchange Rate Volatility and DomesticInvestment in Nigeria
Hodo B. Riman and Emmanuel S. Akpan and Amenawo I
Offiong
University of Calabar, Nigeria, University of Calabar, Nigeria,University of Calabar, Nigeria
26. February 2013
Online at http://mpra.ub.uni-muenchen.de/53282/MPRA Paper No. 53282, posted 31. January 2014 13:30 UTC

____________________________________________________________________________________________
*Corresponding author: Email: [email protected];
British Journal of Economics, Management & Trade3(4): 513-532, 2013
SCIENCEDOMAIN internationalwww.sciencedomain.org
Assymetric Effect of Oil Price Shocks onExchange Rate Volatility and Domestic
Investment in Nigeria
Hodo B. Riman1*, Emmannuel S. Akpan1 and Amenawo I. Offiong1
1Department of Banking and Finance, University of Calabar, Nigeria.
Authors’ contributions
This work was carried out in collaboration between all the authors. All the authors proof readthe manuscript throughout all the stages of the review process.
Received 26th March 2013Accepted 21st August 2013
Published 3rd September 2013
ABSTRACT
Aim: The paper aimed at examining the asymmetric effect of oil price shock on exchangerate and domestic investment in Nigeria.Study Design: Country case study.Place and Duration of Study: Nigeria. Time series data ranging from 1970-2010.Methodology: This study utilised elaborate econometric analysis which tests thesensitivity of exchange rate, private investment, public investment, per capita income andindustrial production to oil price shocks, using the Impulse Response Functions (IRFs)and Variance Decomposition (VDC) techniques within a Vector Autoregressive (VAR)framework.Results: The result clearly revealed that while government expenditure exhibitedimmediate positive response to oil price shock, public investment, private investment andindustrial production exhibited negative response to oil price shock, further confirming theevidence of “Dutch disease” in Nigeria. The variance decomposition analysis furtherrevealed that exchange rate, government expenditure and domestic investment weremainly affected by oil shock, particularly, in the short run.Conclusion: The study concludes that volatility in crude oil prices has negative impact ondomestic investment and industrial development in Nigeria. It is recommended amongother things in this study that the usual practice of sharing oil windfalls to the three tiers ofgovernment should be discouraged; rather, the central government should allocate thesewindfalls to priority sectors of the economy to enhance development.
Research Article

British Journal of Economics, Management & Trade, 3(4): 513-532, 2013
514
Keywords: Impulse response function; variance decomposition analysis; vector auto-regression; oil price shock; domestic investment; government expenditure;exchange rate.
1. INTRODUCTION
The abundance of natural resources, particularly crude oil, has been described as a blessingto many nations since its presence is said to spur economic growth. However, theconsequences of oil price increase different amongst countries. All things being equal, oilprice increase should be considered positive in oil exporting countries and negative in oilimporting countries, while the reverse should be expected when the oil price decreases.Researchers have exposited on the channels through which oil price increase affects theeconomy [1]. Transmission mechanisms through which oil prices impact on real economicactivity include both supply and demand channels. The supply side effects are related to thefact that crude oil is a basic input to production, and consequently an increase in oil priceleads to a rise in production costs that induces firms to lower output. The demand-side effectof oil prices changes affects basically consumption and investment. These authors notedthat consumption is affected indirectly through its positive relationship with disposableincome. The magnitude of this effect is in turn stronger the more the shock is perceived to belong-lasting. Moreover, oil prices have an adverse impact on investment by increasing firms’costs.
[2].The wake of oil price increase supply suffers as production costs rise. Given substitutionbetween production factors, relative price changes result in a reallocation of the means ofproduction. However, these intersectoral reallocations also generate costs (trainingexpenses, irreversible investments, etc.) Thus, the actual impact on investment essentiallydepends on the expectations about the stability of oil price changes, which tend to vary overtime. On the demand side, oil price shocks drive up the general level of prices, whichtranslates into lower real disposable incomes and thus reduces demand [3]. Consumptionand investment is said to be affected due changes in the demand side. Consumption isaffected indirectly through its positive relationship with disposable income while investmentis adversely affected indirectly because such increase in oil price also affects firms’ inputprices and thereby increasing their costs. Oil price changes also influence foreign exchangemarkets and generate stock exchange panics, higher interest rate, produce inflation andeventually lead to monetary and financial instability.
The Nigerian economy is constantly exposed to oil price shocks since oil contributes over90% of the total revenue. The dependency of the country on crude oil revenue is amplifiedby the usual budgetary estimate based on forecast from the expected crude oil prices.Shortfall on oil revenue occasioned by fluctuations in international oil prices had often led todeficit in the country’s budget. Such deficits are usually financed by either external or internalborrowings or through downward adjustments in sectoral budgetary allocation. However onemay look at it, shortfalls from oil receipts have negative impact on the country’s economicgrowth.
The significant effect of oil price shocks is explained by the “Dutch Disease” syndrome, arelationship that explains the decline in manufacturing sector despite increase in theexploitation of natural resources [4]. Oil price shocks have become a very importantimpediment to the development of growing economies. The dependence on naturalresources (oil) revenues makes the national economy vulnerable to market prices. The oildependence and the volatility of oil prices in international markets lead to significant

British Journal of Economics, Management & Trade, 3(4): 513-532, 2013
515
problems in fiscal planning, reduction in quality of public spending, and lead to financialdisaster when oil prices collapse. When oil prices fall, however, fiscal budgets go into deficit,countries start taking loans leveraged against their reserves, and march unimpeded into debt[5]. Revenue generated when prices are high tends to cause “Dutch-Diseases”, high oilrevenue raises exchange rates, promotes an adverse balance of payments when prices fall,reduce the incentive to risk investment in non-oil sectors like agriculture and manufacturing.
Most studies investigating the links between real exchange rate and oil prices are actuallymotivated from the Dutch Disease phenomena. According to the Dutch Disease phenomena,shocks to booming sector (natural resource rich sectors such as oil) leading to increases inits price will lead to more investment in this sector. In turn, more labor is needed in thissector to produce more output, and this causes labor shift from agricultural andmanufacturing sector to the booming sector. As a result, competitiveness and exports ofother sectors will decrease. At the same time, increased labordem and in booming sector willplace an upward pressure on wages. Then, an increase in wages and price of non-tradablegoods in terms of tradable will cause an appreciation of real exchange rate of the country.Based on the above analysis one can say that oil producers and oil exporting countries mayhave different reaction to changes in oil prices, and also exchange rate can be an effectivepolicy instrument in managing oil price shock, especially in oil producing countries,particularly there is a no strong causal nexus from oil price to exchange rate [6].
The Dutch Disease is the most significant challenge that developing oil exporting countriesare grappling with. It is on this backdrop that this paper intends to empirically identify theasymmetric behavior of oil price shock on exchange rate and domestic investment inNigeria. Though several research abounds on the asymmetric impact of oil prices onexchange rate, output and prices in Nigeria [7, 8, 3, 9, 10] these researchers did notempirically test the asymmetric effect of oil price shock on domestic investment (public andprivate). This is the gap this work intends to fill since an understanding of the direction ofeffect of oil price on domestic investment will enable firms to determine their operationalbudgeting technique particularly, as it effect oil price speculation and decisions making.
1.1 Statement of Problem
Nigeria’s economy is heavily dependent on natural resources: oil and gas constitutes 98% oftotal exports, 80% of government revenues and around 20% of GDP [11]. In spite of theenormous economic potentials in Nigeria, it has largely failed to live up to the ambitiousgrowth projections that followed the first oil boom in the 1970s. Also, social indicators havedisplayed no specific tendency towards improvement such that in 2010, Nigeria was ranked142nd out of 169 countries by the United Nations Human Development Index. Furthermore,up to 70% of Nigerians are considered to be ‘poor’ – subsisting below the national povertyline [12]. Yet the country has been adjudged as the 6th largest exporter of crude oil in theworld.
Nigeria is a country suffering from the ‘Dutch Disease” where the country is suffering in themidst of plenty [13]. Higher oil prices have adverse effects on economic performance of oil-exporting countries as they change the structure of the economy in favor of the booming oiland non-traded sectors and against the traded manufacturing and agriculture sectors. Inaddition, higher oil revenues during an oil boom will lead to an appreciation of the localcurrency, increasing imports of intermediate and consumer goods. The heavy reliance of oil-exporting developing economies on imports will in turn harm domestic industries as theycannot compete with imported goods when oil prices are high and cannot sustain their

British Journal of Economics, Management & Trade, 3(4): 513-532, 2013
516
production levels when oil prices and imports decline. Therefore, according to Dutch diseasetheory, a temporary foreign exchange windfall will have a detrimental rather than beneficialeffect on the economy. Following the same transmission mechanism, a decline in oil priceworks in an opposite direction, that is contraction in the non-traded sectors and a strongertraded sector through exchange rate depreciation.
The bulk of the problems confronting oil producing developing countries like Nigeria can begrouped into – the Dutch disease and macroeconomic volatility; rent-seeking and weakgovernance; and conflicts and political instability [13]. The most relevant element of theresource curse, given the objectives of this project, is the Dutch Disease. The Dutch Diseaseis most significant and challenging for oil producing developing countries to grapple with inthe short term.
The paper will adopt the unrestricted vector autoregressive model using annual data from1970 to 2012. The purpose of the empirical analysis is to explore whether the relationshipbetween oil prices and economic activity exists and whether asymmetric transformations ofoil price changes such as oil price volatility affect this relationship. Under continuous oil pricechanges, an increase in oil price volatility may asymmetrically affect production,consumption and investment
1.2 Motivation of the Study
The study is motivated by conflicting observations from various researchers regarding theasymmetric effect of oil price on economic activities. First, some researchers have linked theconcept of the resource curse, especially for the real exchange rate appreciation to the“Dutch disease” further predicting strong connection between oil price and real exchangerate (RER) appreciation in oil-exporting countries [14,15,16,17]. Secondly, several studieshave also found a significant positive relationship between the RER and the price of oil in oil-exporting countries in Algeria, Venezuela, Canada, Norway, Saudi Arabia and Russia in nineOPEC countries [18,19,20,21,22,23].
Nigeria being not just an oil exporting country but also an importer of refined product couldbe said to suffer most due to volatility in oil prices. The objective of this paper is therefore to
1) Empirically investigate the asymmetric relationship of oil price shock on realexchange rate and domestic investment
2) Examine if Nigeria economy could be said to be affected by the “Dutch Disease”.3) Investigate the effect of government spending on domestic investment. That is to
say, what effect does government spending have in exacerbating the DutchDiseases? This is measurable if Government expenditure does not improvedomestic investment in Nigeria
2. LITERATURE REVIEW
Questions regarding the relationship between the price of oil and economic activity arefundamental empirical issues in macroeconomics. Particularly, adequate private and publicdomestic investments are essential conditions for increased output and improved growth indomestic economies.

British Journal of Economics, Management & Trade, 3(4): 513-532, 2013
517
While investigating the effect of oil price shock on real GDP growth on some OECDcountries [1]. They distinguished between net oil importing and exporting countries. Theirstudy focused on the relationship between oil prices and GDP growth, analyzed in terms ofvector auto-regressions by using four specifications, namely a linear model and threeleading non-linear specifications. Their study found evidence of non-linear effects of oil priceon real economic activity, with oil prices (or a transformation thereof) having differentimpacts on real output when they increase than when they fall. This result contrasts with thelinear approach in which oil prices are assumed to have symmetrical impacts on real activity.The results obtain from vector auto-regressions was broadly consistent with the expectationthat the real GDP growth of oil importing economies suffers from increases in oil prices inboth linear and non-linear models. These contrasting results for oil exporting countries canbe traced to a sharper real exchange-rate appreciation. In the case of net oil importercountries, the results obtained using the optimal order of the model (i.e. four lags) indicates apositive association between oil prices and real performance.
In a more recent study on the asymmetric effect of crude oil price and exchange rate onpetroleum product prices in selected sets of Northern Mediterranean Countries [24].observed that crude oil prices increase petroleum product prices more than exchange ratesdo in the long run. However, exchange rate prices were observed to increase petroleumproduct prices in the short run more than crude oil prices did. The effect of crude oil price onpetroleum product is unarguably regionally based. Prices in regional markets reflect thesupply and demand balance in each market as well as the relative quantity of eachcommodity. Thus, the price of crude oil is typically the largest determinant of the internationalprices for petroleum products which are processed or refined from crude oil. This explainswhy the authors could find the lowest short-run asymmetric effect of exchange rate (relativeto crude oil prices) in Turkey than in Greece.
While investigating the asymmetric effects of oil price shocks on economic growth of oil-exporting countries [25]: showed that oil price shocks have asymmetric effects on theireconomic growth; the adverse effects of higher oil prices are larger than the stimulatingeffects of lower prices. The paper further revealed that the effects of oil price shocks oneconomic performance and their transmission mechanism in oil-exporting countries aredifferent from those of oil-importing countries. The authors concluded that in oil exportingdeveloping countries, lower oil prices would lead to major revenue cuts and stagnation in theeconomy. However, higher oil prices and accompanying higher revenues do not translate toa sustained economic growth.
[8], the immediate effect of positive oil price shocks is to increase the cost of production foroil importing countries. This is likely to decrease output, and its magnitude depends on theshape of the aggregate demand curve. Higher oil prices lower disposable income and thisdecreases consumption. Once the oil price increases are perceived as permanent, privateinvestments also decrease. If the shocks are perceived as persistent, oil is used less inproduction, capital and labor productivity decreases and potential output falls [26].Accordingly, using a structural VAR model, [8], have empirically shown that the impact of oilprice shocks on output and prices is asymmetric in nature; with the impact of oil pricedecreasing significantly greater than oil price increase.
Using linear and non-linear specifications [3], assessed empirically the effects of oil priceshocks on the real macroeconomic activity in Nigeria using the Granger causality tests andmultivariate VAR analysis. The paper finds evidence of both linear and non-linear impact ofoil price shocks on real GDP. In particular, asymmetric oil price increase in the non-linear

British Journal of Economics, Management & Trade, 3(4): 513-532, 2013
518
models are found to have positive impact on real GDP growth of a larger magnitude thanasymmetric oil price decrease adversely affects real GDP. Furthermore, the authors utilizedthe Wald and the Granger multivariate and bi-variate causality tests. Results from the latterindicated that linear price change and all the other oil price transformations are significant forthe system as a whole. Their Wald test indicates that our oil price coefficients in linear andasymmetric specifications are statistically significant.
[6]. Investigated the role of country specific and global factors, particularly oil price, on thereal exchange rate (RER) in selected Commonwealth of Independent States (CIS),(Azerbaijan, Kazakhstan, Kyrgyzstan, Moldova, Russia, Turkmenistan, Ukraine, andUzbekistan) over the period from 2000 to 2011. Their analysis was based on panel smoothtransition autoregressive (PSTR) model, which takes into account the nonlinear dynamicadjustment of the real exchange rate towards equilibrium. Result from this study showed thatthere exists an asymmetric behavior of the real exchange rate when facing an over-orundervaluation of the domestic currency. The evidence also shows that oil price hassignificant impact on the appreciation of domestic currencies, particularly in oil and gasexporting relatively richer countries and the CIS countries has become vulnerable to globalshocks.
The Dutch disease theory has also been used to explain the effect of oil price change onoutput growth in oil-exporting countries. Empirical evidence on Dutch disease theory israther mixed. Although some studies provide evidence for Dutch disease in some oil-exporting countries, there are studies that do not support it. The Dutch disease mechanismis not responsible for poor economic performance in half of the countries investigated [27].There is also an argument that tradable manufacturing sector was not necessarily contractedin some oil-exporting countries after the oil booms of the 1970s and the 1980s [28].
[29], applied the methodology of unrestricted vector auto regression model (VAR) todetermine the asymmetric and symmetric effects of oil exports shock on non-tradable sectorof the Iranian economy. The result of their non-linear model revealed that oil exportmovement caused asymmetric reaction on construction, service and other variables in thestudy. Impulse function result showed that the shocks in oil exports growth significantlyincrease construction, imports, manufacturing, index of services and real effective exchangerate. The variance decomposition result suggests that negative oil shocks have a strongerrole on the economy compared to the positive one on construction. Overall, the oil richcountry of Iran suffered from weak and undiversified economies, which result in the DutchDisease.
[30], investigated the sources of macroeconomic fluctuations in oil exporting countries. Theirresult found that oil price shocks are the main source of output fluctuations in Saudi Arabiaand Iran, but not in Kuwait and Indonesia.
Some authors have posited that volatility of oil prices is inelastic in the short-run [31,32].Therefore, a small change in either demand or supply will require a large change in price torestore the equilibrium. Demand is inelastic since change in energy consumption requires achange in capital stock, which would take time to occur. Energy supply has a low elasticitysince energy production is capital intensive and producers need time to expand productionwhen prices rise. Indeed, it is oil price volatility that has led some countries to establish an oilreserve fund to alleviate the negative impact of volatility on their economic activities.

British Journal of Economics, Management & Trade, 3(4): 513-532, 2013
519
Furthermore, some researchers have investigated the changes in expenditure policy in oilexporting countries during boom-bust in commodity price circles and their implications forreal exchange rate movement [33]. The paper applied a Dutch Disease model withdownward rigidities in government spending to revenue shocks using a panel data for 32 oilexporting countries over a period 1992 to 2009. Their result revealed that, changes incurrent spending have a stronger impact on real exchange rate compared to capitalspending. Their result further revealed that current spending is downwardly sticky, butincreases in periods of boom, and conversely for capital spending. The result describedabove therefore raises concerns on potential adverse consequences of asymmetry on theeconomic performance in oil-exporting countries.
[34], used the VAR model with quarterly data from 1970 to 2003 to examine the effect of oilprice shock on aggregate economic activity in Nigeria. Their finding showed that while oilprices significantly influenced exchange rate, it does not have significant effect on inflationand output in Nigeria. The conclusion drawn from the study was that an increase in the priceof oil results in wealth effects which appreciates the exchange rate and increases thedemand for non-tradable, a situation that would result in “Dutch Disease:.
The extensive argument on the effect of oil price shock on real exchange rate prompted [35],to examine the relationship that exist between oil price and real exchange rate in Rusia. Thestudy which utilized the VAR model and cointegration technique revealed that Russianeconomy was influenced significantly by fluctuations in oil prices and the real exchange ratesthrough both the long-run equilibrium condition and short-run direct impacts.
[36], also explored the possibility of a non-linear relationship between oil prices and theNorwegian exchange rates. The result form this study indicated that oil price was negativelyrelated to the value of the Norwegian exchange rate when oil price was below US$14.0,contrary to other findings from related studies.
3. METHODOLOGY OF RESEARCH
The study utilizes annual data obtained from various issues of the Central Bank of NigeriaStatistical bulletin over a period of 1970 to 2012. The paper identified the major variables tobe specified in the model as Oil Price (defined in real terms, taking the ratio of the price of aninternationally traded variety of crude (UK Brent) in US dollars to the Nigeria Consumer PriceIndex. Real exchange rates (measurement of RER follows the approach by [37]. Both the oilprice volatility and exchange rate volatility were computed from their actual series as theannualized standard deviation of the percentage change of their values.
The methodology in this paper follows the step highlighted below
- Test unit root of four time series;- Construct seven-variable VAR model;- Johansen cointegration test;- Dynamic simulation (impulse response function and variance decomposition);
In order to check the time series properties of the variables used in the model, the paperapply the unit root tests. The paper utilizes the Augumented Dickey Fuller (ADF) and thePhillips Perron (PP) unit root test to investigate the order of integration of the variables in themodel. The Augmented Dickey-Fuller (ADF) unit root test consists of running a regression ofthe following form [38]:

British Journal of Economics, Management & Trade, 3(4): 513-532, 2013
520
If the estimated coefficient γis equal to zero, the equation is in first differences and containsa unit root. In the ADF test, the rejection of the null hypothesis implies stationarity. If thecalculated ADF statistic is higher than McKinnon's critical value then the null hypothesiscannot be rejected and it may be concluded that the considered variable is non-stationary,i.e. it has at least one unit root. Consequently, the procedure needs to be repeated aftertransforming the series into first differences [39].
Next, the study investigates the response of macroeconomic variables to symmetric andasymmetric innovations in oil prices, we use an unrestricted vector autoregressive model(VAR) [39, 40, 41]. According to the authors, the VAR model provides a multivariateframework where changes in a particular variable (oil price) are related to changes in its ownlags and to changes in other variables and the lags of those variables. The VAR treats allvariables as jointly endogenous and does not impose a priori restrictions on structuralrelationships. Because the VAR expresses the dependent variables in terms ofpredetermined lagged variables, it is a reduced-form model. Once the VAR has beenestimated, the relative importance of a variable in generating variations in its own value andin the value of other variables can be assessed (Forecast Error Variance Decomposition(VDC)). VDC assesses the relative importance of oil price shocks on the volatility of othervariables in the system. The dynamic response of macroeconomic variables to innovationsin a particular variable (e.g., here oil prices and oil market) can also be traced out using thesimulated responses of the estimated VAR system (Impulse Response Functions (IRF)).Thus, the IRF allows us to examine the dynamic effect of oil price shocks on the Nigerianeconomy. Our unrestricted vector autoregressive model of order p is presented in equation:
Where ytis a vector of endogenous variables, ztis a vector of exogenous variables, Ai and Bare coefficient matrices and p is the lag length. The innovation process "t is an unobservablezero-mean white noise process with a time invariant positive-definite variance-covariancematrix. The VAR system can be transformed into a moving average representation in orderto analyze the system response to real oil price shock. That is
where yt is a (n x 1) vector of endogenous variables, c is a n.1 vector of constants, Φ is a (nx n) matrix of coefficients, and i=1,…,p is the number of lags. is (n x 1) vector of error termswith zero mean and the variance Ω. The error terms in the above reduced form VAR modelcontain shocks to the endogenous variables in the structural VAR model. The advantage ofthe VAR model is that it allows for interactions among all endogenous variables capturingthe complex dynamics in the economy and estimates the impact and long run effects ofshocks to each variable on itself and other variables. This is particularly important in our
p∆yt = ao + γt-1 + a2t + ∑βi∆yt-i+1 + εt
i=2
p pWhere γ = - 1 - ∑ai , βi = ∑aj , p indicate the lag length and t represent the trend
i= 2 i=2
yt = A1yt +---- + Apyt-p + Bzt + εt
yt = c + Σ Φi yt-i + εt

British Journal of Economics, Management & Trade, 3(4): 513-532, 2013
521
context as oil price shocks can affect output growth directly and indirectly through othervariables such as inflation and real exchange rates.
Endogenous variables included in the model are growth in domestic investment (private andpublic) as the main variable of interest, real per capita, and real exchange rates, governmentexpenditure and index of industrial production. A change in oil price has a direct effect onGDP in oil-exporting countries through a shift in both aggregate demand and aggregatesupply [25]. The system of equations in the VAR model takes into account all direct andindirect effects of oil price changes on the output growth through estimation of interactionsamong endogenous variables.
In our unrestricted VAR models, the vector of endogenous variables, according to our firstCholesky ordering, consists of real oil price (oilp, oilp+, oilp-), real government expenditures(govexp),real industrial production,(lindp) real per capita (lrgdp), real effective exchangerate(reex), and real domestic public investment (ripp) and real domestic private investment(rdpvi)
The innovations of current and past one-step ahead forecast errors are orthogonalised usingCholesky decomposition so that the resulting covariance matrix is diagonal.
This assumes that the first variable in a pre-specified ordering has an immediate impact onall variables in the system, excluding the first variable and so on.
In the first set of ordering, the real oil price changes are ranked as a largely exogenousvariable, especially for the case of Nigerian economy. The export quantity for Nigeria crudeoil is determined by its level of domestic production which is significantly influenced by thefrequency of workers strikes, civil unrest, militancy in the Niger Delta region of the country,and oil bunkering activities while export quota are predetermined by the OPEC criteria,domestic consumption and investment in oil fields. Furthermore, demand for crude oil islargely determined by global economic growth, energy intensity within industrializedeconomies, speculator operations in oil markets, expectations of other key oil producersabout current and future developments of the market, international oil companies' decisionson liquidation of their stocks and finally, the policy of key oil consumers on strategicpetroleum reserves [40]. Therefore, oil prices are an exogenous factor for the Nigerianeconomy. We expect that significant shocks in oil markets affect contemporaneously theother key macroeconomic variables in the system.
The second variable in the ordering is government expenditures. Government expenditurescan be broadly defined as current and capital consumptions. Current expenditures coverrecurrent expenditures (e.g., payments of governmental employees, subsidies, and so on.),whereas capital expenditures aim to add, rather than maintain, the physical and materialassets of an economy. The relevance of government expenditure in the model originatesfrom the fact that Governments in most oil-exporting countries undertake large socialprograms; expand the public sector by increasing the number of government employees,and pay generous subsidies to different sectors when the oil market is favorable. However,they cannot cut back those programs quickly when their revenues fall as oil prices plummet.Government’s high expenditures during oil booms and its deficit, which is mostly financed bythe central banks, during oil busts, contribute to higher prices and inflation
yt = [roilp; govexp; rgdp; reex; lindp ripp, rdpvi]

British Journal of Economics, Management & Trade, 3(4): 513-532, 2013
522
To check whether the assumptions of our VAR model are met, it is necessary to carefullychoose the lag length in the model. The lag length is selected based on the AIC (Akaike’sInformation Criterion) [38]. The model will be misspecified when lag length is too small. Themore lags, the more parameters we need to estimate and the less biased our results wouldbe. The model will be over-parameterized if the number of lags is too large. Selecting the lagorder is simply to understand that we find p such that Ai =0 for all i > p in the VAR model.
To test the long-run cointegration of four time series, the study will implement the Johansencointegration test. Consider the following equation.
The number of cointegration vectors (r) is determined by the maximum eigenvalue test andthe trace test [38]. Both tests are based on the likelihood ratio test. When λ trace and λmaxconflict, we should choose the number of the cointegration vector based on λmax, because“the λmax test has the sharper alternative hypothesis.
Based on the methodology so far used, it is however still difficult to know whether oil priceshock has asymmetric effect on exchange rate and investment growth in Nigeria. Toovercome this difficulty, it is necessary to employ the impulse response and the variancedecomposition tests. An impulse response function traces the effect of a one-time shock toone of the innovations on current and future values of the endogenous variables, whilevariance decomposition separates the variation in an endogenous variable into thecomponent shocks to the VAR. In other words, the variance decomposition providesinformation about the relative importance of each random innovation in affecting the variationof the variables in the VAR.
4. RESULTS AND DISCUSSION
4. 1 Unit Root Tests
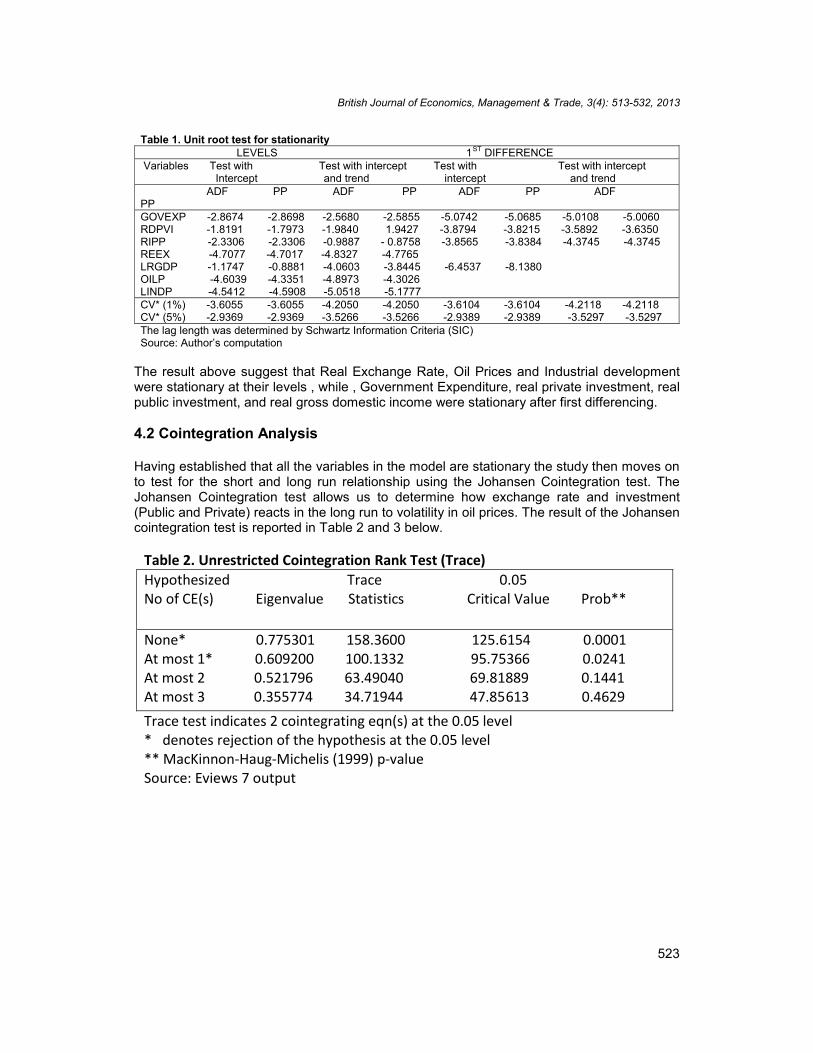
As mentioned above, the first step in performing the Granger causality test is to study thestationarity of the time series used in the analysis and to establish the order of theirintegration. the unit root test was performed using the ADF (Augumented Dickey-Fullar) andPhilips Perrone (PP) test. The result is presented in Table 1 below.
p∆yt = αo + αt-1 + ∑αi∆yt-i + εt
i=2
p pWhere α = - 1 - ∑ai , βi = ∑aj ,
i= 2 i=2
British Journal of Economics, Management & Trade, 3(4): 513-532, 2013
523
The result above suggest that Real Exchange Rate, Oil Prices and Industrial developmentwere stationary at their levels , while , Government Expenditure, real private investment, realpublic investment, and real gross domestic income were stationary after first differencing.
4.2 Cointegration Analysis
Having established that all the variables in the model are stationary the study then moves onto test for the short and long run relationship using the Johansen Cointegration test. TheJohansen Cointegration test allows us to determine how exchange rate and investment(Public and Private) reacts in the long run to volatility in oil prices. The result of the Johansencointegration test is reported in Table 2 and 3 below.
Table 1. Unit root test for stationarityLEVELS 1ST DIFFERENCE
Variables Test with Test with intercept Test with Test with interceptIntercept and trend intercept and trend
ADF PP ADF PP ADF PP ADFPPGOVEXP -2.8674 -2.8698 -2.5680 -2.5855 -5.0742 -5.0685 -5.0108 -5.0060RDPVI -1.8191 -1.7973 -1.9840 1.9427 -3.8794 -3.8215 -3.5892 -3.6350RIPP -2.3306 -2.3306 -0.9887 - 0.8758 -3.8565 -3.8384 -4.3745 -4.3745REEX -4.7077 -4.7017 -4.8327 -4.7765LRGDP -1.1747 -0.8881 -4.0603 -3.8445 -6.4537 -8.1380OILP -4.6039 -4.3351 -4.8973 -4.3026LINDP -4.5412 -4.5908 -5.0518 -5.1777CV* (1%) -3.6055 -3.6055 -4.2050 -4.2050 -3.6104 -3.6104 -4.2118 -4.2118CV* (5%) -2.9369 -2.9369 -3.5266 -3.5266 -2.9389 -2.9389 -3.5297 -3.5297The lag length was determined by Schwartz Information Criteria (SIC)Source: Author’s computation
Table 2. Unrestricted Cointegration Rank Test (Trace)Hypothesized Trace 0.05No of CE(s) Eigenvalue Statistics Critical Value Prob**
None* 0.775301 158.3600 125.6154 0.0001At most 1* 0.609200 100.1332 95.75366 0.0241At most 2 0.521796 63.49040 69.81889 0.1441At most 3 0.355774 34.71944 47.85613 0.4629Trace test indicates 2 cointegrating eqn(s) at the 0.05 level* denotes rejection of the hypothesis at the 0.05 level** MacKinnon-Haug-Michelis (1999) p-valueSource: Eviews 7 output

British Journal of Economics, Management & Trade, 3(4): 513-532, 2013
524
To consider the hypothesis that the variables are not cointgrated (r=0) against the alternativeof one or more cointegrating vectors (r>0), it is necessary to look at the values of λTRACE.The result of the trace statistics indicates the value of λTRACE equal to each number of thecointegrating vector: λTRACE (0) = 158.36, λTRACE (1) = 100.13, and λTRACE (2) = 63.49.Since the value of λTRACE (0) and λTRACE (1) exceeds the critical value of (125.61) and(95.75 (respectively, at the 0.05 significance level, we can reject the null hypothesis of twocointegrating vectors (r=2) and accept the alternative hypothesis of the existence of twocointegrating vectors (r>2) at the 0.05 level.
To ensure the reliability of the coefficient of the Normalized Cointegrating model, the studyemployed the AR root stability test. The estimated VAR will be assumed to be stable if all theroots have modules less than one and lies inside the unit circle. The result of the AR test ifthus presented in Table 4 below
Table 4. Stability test
Roots of Characteristic PolynomialEndogenous variables: OILP GOVEXP RDPVI RIPP LRGDP REEX LINDPExogenous variables:Lag specification: 1 2Date: 07/17/13 Time: 10:03Root Modulus-0.271406 + 0.874772i 0.915908-0.271406 - 0.874772i 0.9159080.423414 + 0.692297i 0.8115140.423414 - 0.692297i 0.8115140.764985 0.764985
-0.172893 - 0.688402i 0.709781-0.172893 + 0.688402i 0.709781-0.677956 - 0.127353i 0.689814-0.677956 + 0.127353i 0.689814-0.022952 + 0.596915i 0.597356-0.022952 - 0.596915i 0.597356-0.213417 - 0.522042i 0.563981-0.213417 + 0.522042i 0.563981-0.217109 + 0.121272i 0.248683-0.217109 - 0.121272i 0.248683
VEC specification imposes 6 unit root(s).
Table 3. Unrestricted Cointegration Max-Eigenvalue TestHypothesized Max-Eigen 0.05No of CE(s) Eigenvalue Statistics Critical Value Prob**
None* 0.775301 58.22678 46.23142 0.0017At most 1 0.609200 36.64282 40.07757 0.1160At most 2 0.521796 28.77096 33.87687 0.1802At most 3 0.355774 17.14850 27.58434 0.5672Max-eigenvalue test indicates 1 cointegrating eqn(s) at the 0.05 level* denotes rejection of the hypothesis at the 0.05 level** MacKinnon-Haug-Michelis (1999) p-valueSource: Eviews 7 output

British Journal of Economics, Management & Trade, 3(4): 513-532, 2013
525
The result of the AR stability test satisfies the stability condition of the module in Table 4since no root lies outside the unit circle.
The cointegrating equations of the normalised Johansen equation is presented in Table 5below.
The cointegrating equations of the normalised Johansen equation were derived among oilprice volatility, real domestic private investment, real public investment, industrial production,real exchange rate, real per capita income and real government expenditure. Thus, thenormalised cointegratingequation above becomes
Oilp = 279.12 + 12.136RDPVI + 0.200RIPP + 10.488LINDP – 0.569REEX + 0.193LRGDP –0.314GOVEXP
The analysis of this study will focus on the result obtained in equation 2 since it reflect thetheoretical expectation analysed previously in the study. The result indicates that a 10 percent decrease in international oil price volatility will cause the domestic exchange rate todecrease by 56 per cent. This result conforms to the result obtained previously by someauthors in Nigeria [7,]. This result further conforms to economic theory that a decrease in oilprice volatility should evoke a corresponding decrease in exchange rate volatility in everyeconomy. The result also observed that a 10 per cent decrease in oil price volatility will resultto an increase of 20 per cent and over 100 per cent increase in both domestic investmentand public investment respectively in Nigeria. The result is not surprising since it alsoconforms to[8], who both traced the effect of a reduction in investment to be usually througha reduction in disposable income of economic agents. When economic agent perceive thatthe volatility in oil prices might be long and permanent, they reduce their presentconsumption, capital and labor productivity decreases and potential output falls. Volatility inoil prices was observed to exert negative effect on government expenditure. A 10 percentincrease in oil price volatility will reduce government expenditure by 31 percent. This resultcannot be doubted since government often resorts to external borrowing or drawing from theexternal reserves to fund shortfall in budgetary expenditure. Volatility in oil prices has bothnegative and positive effect on government spending. Negative effect will arise if there existshort falls on expected receipt from crude oil sales, especially, when such shortfalls arebelow the budgetary forecast. In such circumstancesgovernment will either resort to externalor internal borrowings, drawings from the external reserve funds or internal readjustment ofbudgetary estimates to sectors, in other to meet up domestic demands. Positive effect of oilprice volatility will cause the government to experience windfalls in their receipt from crudeoil sales, which of course evoke increase spending by government.
Table 5 Normalised Johansen EquationsCointegrating coefficientsCointEq1OILP RDPVI RIPP LINDP REEX LRGDP GOVEXP1.000000 -3.696788 -1.395124 72.41920 -7.119779 6.145539 -0.438721
CointEq21.000000 -12.136061 -0.200427 -10.48859 0.569357 -0.193086 0.314551

British Journal of Economics, Management & Trade, 3(4): 513-532, 2013
526
4.3 Impulse Response Function Analysis
Impulse response functions are dynamic simulations showing the response of anendogenous variable over time to a given shock. In this regards Fig. 1 belowpresent theimpulse response function result of the dynamic response of Government Expenditure(GOVEXP), real exchange rate (REEX), public investment (RDPVI), private investment(RIPP), Industrial production (LINDP) and Real National Income (LRGDP) to oil price shocks(OILP) for a 12-year horizon.
Fig. 1. Impulse response function resultSource: Eviews 7 output.
The result indicates that government expenditure exhibited immediate positive response tooil shock but became negative after the second period. However, government expenditurecontinued to fluctuate negatively to oil shock until 7th-year when it became positive again.This result is a reverse of the result obtained by [42], where government expenditure wasobserved to be positive with oil price shock in Malaysia.
Public investment, private investmentand industrial production all exhibited negativeresponse to oil shock and deceasing further as the year went by. The result confirms the factthat Nigeria economy suffers from the “Dutch disease”, a situation where an increase in oilrevenue does not correspondingly reflect an increase in domestic growth. The “Dutchdisease” syndrome is also witnessed in the response of domestic growth (LRGDP) toinnovations in oil price. The study revealed that a one-standard deviation of symmetric
British Journal of Economics, Management & Trade, 3(4): 513-532, 2013
527
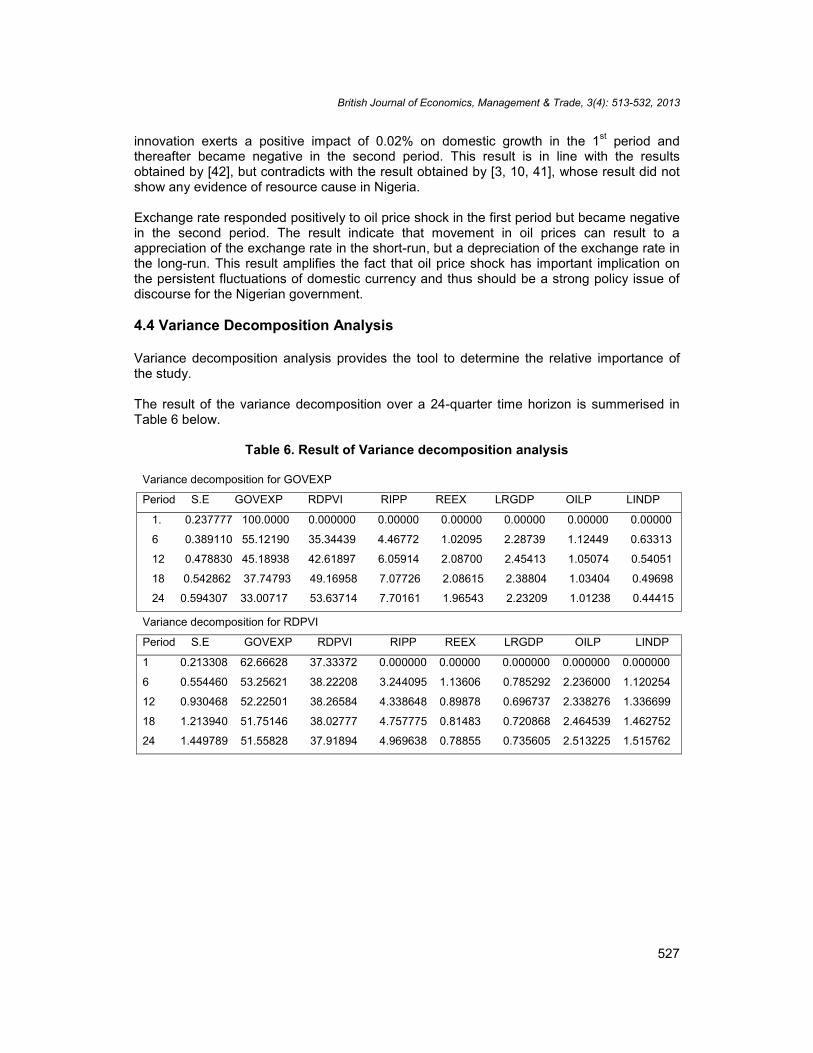
innovation exerts a positive impact of 0.02% on domestic growth in the 1st period andthereafter became negative in the second period. This result is in line with the resultsobtained by [42], but contradicts with the result obtained by [3, 10, 41], whose result did notshow any evidence of resource cause in Nigeria.
Exchange rate responded positively to oil price shock in the first period but became negativein the second period. The result indicate that movement in oil prices can result to aappreciation of the exchange rate in the short-run, but a depreciation of the exchange rate inthe long-run. This result amplifies the fact that oil price shock has important implication onthe persistent fluctuations of domestic currency and thus should be a strong policy issue ofdiscourse for the Nigerian government.
4.4 Variance Decomposition Analysis
Variance decomposition analysis provides the tool to determine the relative importance ofthe study.
The result of the variance decomposition over a 24-quarter time horizon is summerised inTable 6 below.
Table 6. Result of Variance decomposition analysis
Variance decomposition for GOVEXP
Period S.E GOVEXP RDPVI RIPP REEX LRGDP OILP LINDP
1. 0.237777 100.0000 0.000000 0.00000 0.00000 0.00000 0.00000 0.00000
6 0.389110 55.12190 35.34439 4.46772 1.02095 2.28739 1.12449 0.63313
12 0.478830 45.18938 42.61897 6.05914 2.08700 2.45413 1.05074 0.54051
18 0.542862 37.74793 49.16958 7.07726 2.08615 2.38804 1.03404 0.49698
24 0.594307 33.00717 53.63714 7.70161 1.96543 2.23209 1.01238 0.44415
Variance decomposition for RDPVI
Period S.E GOVEXP RDPVI RIPP REEX LRGDP OILP LINDP
1 0.213308 62.66628 37.33372 0.000000 0.00000 0.000000 0.000000 0.000000
6 0.554460 53.25621 38.22208 3.244095 1.13606 0.785292 2.236000 1.120254
12 0.930468 52.22501 38.26584 4.338648 0.89878 0.696737 2.338276 1.336699
18 1.213940 51.75146 38.02777 4.757775 0.81483 0.720868 2.464539 1.462752
24 1.449789 51.55828 37.91894 4.969638 0.78855 0.735605 2.513225 1.515762

British Journal of Economics, Management & Trade, 3(4): 513-532, 2013
528
Variance decomposition shows how much of the variation in exchange rate and domesticinvestment are due to the variations of the included variables in the model, including the oilshocks.
Variance decomposition for RIPP
Period S.E GOVEXP RDPVI RIPP REEX LRGDP OILP LINDP
1 0.237353 41.36272 31.66527 26.97200 0.00000 0.000000 0.000000 0.00000
6 0.712627 50.75010 21.88662 22.15417 2.44192 1.615099 0.454772 0.69731
12 1.130257 50.61449 24.01559 20.43534 1.95490 1.451142 0.679086 0.84945
18 1.446020 50.42131 24.46588 20.08802 1.81775 1.465097 0.793293 0.94865
24 1.712102 50.36789 24.65030 19.90357 1.77229 1.474407 0.840402 0.99113
Variance decomposition for REEX
Period S.E GOVEXP RDPVI RIPP REEX LRGDP OILP LINDP
1 0.916812 10.06289 0.151386 0.027997 89.75773 0.00000 0.000000 0.00000
6 1.541369 15.49667 10.18007 3.081771 66.80304 3.68786 0.245371 0.50321
12 2.167415 20.93584 13.38086 2.213989 59.99787 2.73536 0.311662 0.424586
18 2.582603 21.51161 14.10495 1.683435 59.56026 2.52208 0.269582 0.348079
24 2.897105 21.21625 14.11221 1.383236 60.40016 2.35970 0.239372 0.289063
Variance decomposition for LRGDP
Period S.E GOVEXP RDPVI RIPP REEX LRGDP OILP LINDP
1 0.037914 10.60761 9.093378 0.202541 5.02900 75.06746 0.000000 0.000000
6 0.082002 32.61304 8.640975 1.135018 5.83262 46.95665 4.330162 0.491529
12 0.102509 29.95112 7.422005 1.194986 4.41502 52.98678 3.613219 0.416859
18 0.118149 28.23316 6.548927 1.235037 3.69236 56.65909 3.250289 0.381158
24 0.131657 27.14778 6.015448 1.271271 3.25177 58.90797 3.040816 0.364940
Variance decomposition for OILP
Period S.E GOVEXP RDPVI RIPP REEX LRGDP OILP LINDP
1 0.583855 1.06E-05 3.504565 0.109242 18.01846 0.008550 78.35918 0.00000
6. 1.809331 60.43618 13.51697 1.284592 8.926687 6.109025 8.761862 0.96468
12 2.149986 59.35848 11.75552 1.710220 13.30651 6.398849 6.617687 0.85273
18 2.347963 57.75093 10.64681 2.022806 16.17801 6.967404 5.631351 0.80269
24 2.515626 57.13679 9.521969 2.192042 18.01750 7.437433 4.931182 0.76307
Variance decomposition for LINDP
Period S.E GOVEXP RDPVI RIPP REEX LRGDP OILP LINDP
1 0.008486 5.376458 3.551521 1.101829 18.11702 17.16386 31.84233 22.8469
6 0.035424 44.87716 21.57122 6.821388 4.879471 6.327931 6.978613 8.54421
12 0.059535 46.25637 23.86908 8.144287 2.409547 5.493707 6.208787 7.61822
18 0.078558 46.78934 24.78956 8.531031 1.581402 5.124737 5.886277 7.19765
24 0.094108 47.01319 25.24449 8.686947 1.379416 4.934425 5.740731 7.00079

British Journal of Economics, Management & Trade, 3(4): 513-532, 2013
529
A look at the table revealed that the fluctuations of GOVEXP are explained mainly byGOVEXP shocks and RDPVI shocks, in the long run. Government expenditure (GOVEXP)accounts for 100% in the 1st period. Its proportion decreases continually until it reaches 33 %in the 24th period. Public consumption expenditure (RDPVI) shock accounts for less that 1%in the first year. Its proportion increases over time and reaches 53.6% in the 24th period. Theresult shows that in the long run public consumption expenditure shock account for the majorvariation in government expenditure.
The fascinating fact about the result is that fluctuations in industrial development (LINDP) inNigeria are mostly accounted for by exchange rate shock and oil price shock. The resultshows that fluctuations in oil prices and exchange rate have immediate impact on industrialdevelopment in Nigeria. Exchange rate shock accounts for 18.12% variation in the 1st periodand decreases to 1% in the 24th period. Also oil price shock accounts for 31.84% in the 1st
period and decreases to 5% in the 24th period. This result depicts that exchange rate shockand oil price shock has a short-run effect on industrial development in Nigeria. Furthermore,we observe that variations in the economic growth were mostly accounted for Governmentexpenditure shock (GOVEXP) and Exchange rate (REEX). While Government expenditureshock accounted for 10.6% variation in the 1st period and increases to 27.14 in the 24th
period, exchange rate shock accounted for 5.02% in the 1st period and further decrease to3.25% in the 24th period. The result summerises that GOVEXP shock and REEX shock havemajor short term impact on economic growth. This result upholds the view of [1].
5. CONCLUSION
Oil revenue has been said to play contradictory role in the economic growth of oil exportingcountries. While researchers agree that higher oil prices bring in extensive capital, leading tohigher investment in physical and human capital in oil-exporting countries. On the otherhand, oil windfall can lead to an exchange rate appreciation and deindustrialization whichare harmful to growth. A decline in oil prices would also lead to a halt in investment projectsundertaken during the oil boom and stagnation in economic activities, monetized budgetdeficit, and inflation.
This paper had set forth to examine the asymmetric effect of oil price shock on exchangerate and domestic investment in Nigeria using the reduced form unrestricted VAR model.Preliminary test proved that all the variables in the model were stationary after firstdifferencing and the cointegration test revealed that a long-run relationship does existbetween the variables.
The impulse response function result clearly revealed that while government expenditureexhibited immediate positive response to oil shock, public investment, private investmentand industrial production all exhibited negative response to oil shock and decreasing furtheras the year went by. The result confirms the fact that Nigeria economy suffers from the“Dutch disease”, a situation where an increase in oil revenue does not correspondinglyreflect an increase in domestic growth.
The variance decomposition analysis revealed that variation in exchange rate and domesticinvestment (private and public consumption expenditure) were mainly affected by shock ofoil prices in Nigeria. Although the response was basically observed to be in the short-run, thespread of the effect in oil price shock was also witness in the depreciation in the country’scurrency and deterioration of the growth of the industrial sector.

British Journal of Economics, Management & Trade, 3(4): 513-532, 2013
530
The results above have the following policy implication for the country. Firstly, the continualdependence of the country on windfalls from oil revenue has negative and retarding effect onthe country, particularly as it affects the industrial sector. It is important that governmentshould be able to provide public goods without relying necessary on oil revenues.Dependence on oil revenue forecast in the preparation of the annual budget has oftenresulted deficit budgeting particularly during periods of uncertainty in oil receipts arising fromglobal crisis in oil production.
Secondly, it is imperative for the central government to transform excess crude oil revenuesinto physical capital and infrastructure rather than distribute the windfalls to the state andlocal government, who might not necessarily invest these funds into productive uses. Thiswill strengthen the industrial base of the economy, promote production of more tradablegoods for export and increase economic growth.
Thirdly, it might be necessary for the country to accumulate assets during periods of oilboom in a reserve fund and draw from it during bust seasons. This will serve as a buffer fundwherein the government can depend on without securing huge external borrowing fordomestic investment.
While we commend the government authorities in Nigeria for the recent sanitization of theNigeria National Petroleum Corporation (NNPC) and bringing to bare the sharp obnoxiouspractices in the fuel subsidy saga, the paper further recommend that the issue of corruptionin government, accountability and transparency in governance should be held in highregards. Without a competent bureaucracy and strong democratic institutions that safeguardthe interests of the citizenry, implementing policies that will improve the investment climatewould remain a challenging one.
COMPETING INTERESTS
Authors have declared that no competing interests exist.
REFERENCES
1. Jimenez-Rodriguez R, Sanchez M. Oil price shocks and real GDP growth: empiricalevidence for some OECD countries. Applied Economics. 2005;37(2):201-228.
2. Schneider M. The impact of oil price changes on growth and inflation. MonetaryPolicy & the Economy. 2005;Q2/04;27-36
3. Aliyu SUR, Oil Price Shocks and the Macroeconomy of Nigeria: A Non-linearApproach. MPRA Paper No. 18726, posted 20. November 2009.Available: http://mpra.ub.uni-muenchen.de/18726/.
4. Auty R. Political Man: The Social Basis of Politics. Maryland: John HopkinsUniversity Press; 2004.
5. Otaha JI. Dutch Disease and Nigeria Oil Economy. African Research Review.Ethiopia. 2012;6(1);82-90
6. Available: http://dx.doi.org/10.4314/afrrev.v6i1.7.7. Kucuk N. Nonlinear real exchange rate dynamics and oil price in the Commonwealth
of Independent States. International Conference on Eurasian Economies. 2012;60-67

British Journal of Economics, Management & Trade, 3(4): 513-532, 2013
531
8. Englama A, Duke OM, Ogunleye TS, and Isma FU. Oil prices and Exchange ratevolatility in Nigeria: An Empirical Investigation. Central Bank of Nigeria Economicand Financial Review. 2010:48(3);31-48.
9. Mordi CNO, Adebiyi MA. The asymmetric effects of oil price shocks on output andprices in Nigeria using a structural VAR model. Central Bank of Nigeria Economicand Financial Review. 2010;48(1):1-32
10. Madueme S, Nwosu OC. Oilp price Shocks and Macroeconomic Variables inNigeria. Society for Research and Academic Excellence. 2011.
11. Available:http//academicexcellencesociety.com/oil_price_shocks_andmacroeconomic_variables.pdf.
12. Chuku C, Effiong E, Sam N. Oil price distortion and their short-run and long-runimpacts on the Nigerian economy. MPRA paper 24434; 2010.
13. Central Bank of Nigeria. Annual Report and Statement of Accounts, Abuja. Nigeria:2010
14. National Bureau of Statistics. Annual Statistical Bulletin, Abuja, Nigeria; 2012.15. UshieV, AdeniyiO, Akongwale S. Oil Revenues, Institutions and Macroeconomic
Performance in Nigeria. CSEA Working Paper WPS/12/02.16. Corden WM, Neary JP. Booming sector and de-industrialization in a small open
economy. Economic Journal. 1982;92:825-848.17. Corden WM. Booming Sector and Dutch Disease Economics: Survey and
Consolidation. Oxford Economic Papers. 1984;36:359-380.18. Wijenbergen V. Inflation, employment, and the Dutch disease in Oil- exporting
countries: A short-run disequlibrium analysis, Quarterly Journal ofEconomics ;1984;99:233-250.
19. Buiter, W, Purvis D. Oil, Disinflation and Export Competitiveness: A Model of theDutch Disease. National Bureau of Economic Research Working Paper. 1983;592.(Cambridge, Mass: NBER).
20. Koranchelian T. The equilibrium real exchange rate in a commodity exportingcountry: Algeria’s experience. IMF Working Paper. 2005;135; Washington D.C.
21. Zalduendo, J. Determinants of Venezuela’s equilibrium real exchange rate.IMFWorking Paper 2006;74, Washington D.C.
22. Issa R, Lafrance R, Murray J. The Turning Black Tide: Energy Prices and theCanadian Dollar. Working Paper 2006;(29). Bank of Canada, Ottawa.
23. Habib M, Kalamova M. Are there oil currencies? The real exchange rate of oilexporting countries. European Central Bank, Working Paper Series No 839; 1987December.
24. Oomes N, Kalcheva K. Diagnosing Dutch Disease: Does Russia Have theSymptoms. BOFIT Discussion Paper. 2007;6.
25. Korhonen I, Juurikkala T. Equilibrium exchange rates in oil dependentcountries.BOFIT Discussion Papers.Bank of Finland, Institute for Economies inTransition. 2007;8.
26. Available:http//www.suomenpankki.fi/bofit_en/tutkimus/tutkimusjulkaisut/dp/Document/dp0807.
27. Berument HA, Sahin A, Sahin S. Crude oil price and Exchange Rate Effects ofAsymmetry on Petroluem Products prices: Evidence from a Set of NorthernMediterranean Countries. 2013,Available: http/ecgi.ssrn.com/delivery.php?ID=5601200860.
28. Moshiri S, Banihashem A. Asymmetric Effects of Oil Price Shocks on EconomicGrowth of Oil-Exporting Countries; 2012.Available: http://ssrn.com/abstract=2006763.

British Journal of Economics, Management & Trade, 3(4): 513-532, 2013
532
29. Berument SA, Ceylan BC, Dorgan N. The impact of oil price shock on the economicgrowth of selected MENA Countries.The Energy Journal. 2009;31(1):149-176.
30. Mikesell R. Explaining the resource curse, with special reference to mineral-exporting countries, Resources Policy. 1997;23(4).
31. Fardmanesh M. Dutch disease economics and the oil syndrome: an empirical study.World Development. 1991;19(6):711-717.
32. Shirinbakhsh S, Bayat MM. An evaluation of asymmetric and symmetric effects of oilexports shocks on non-tradable sector of Iranian economy. Romanian Journal ofEconomic Forecasting. 2011;1:106-124.
33. Mehrara MN, Oskoui K. The Sources Of Macroeconomic Fluctuations In OilExporting Countries: A Comparative Study Economic Modeling,2007;24:365-379.
34. Frankel JA. The Natural Resource Curse: A Survey, NBER working paper 15836;2010.
35. Poelhekke S, Van der Ploeg F. Volatility, Financial development and the naturalresource curse, CEPR DP6513, 2007; October.
36. Arezki R, Ismali K. Boom bust cycle, asymmetric fiscal response and the Dutchdisease.Journal of Development Economics. 2013;101:256-267
37. Olomoland PA, Adejumo AV. Oil price shock and macroeconomic activities inNigeria”. International Research Journal of Finance and Economics. 2006;3:28–34.
38. Rautava J. The Role of Oil Prices and the Real Exchange Rate in Russia’seconomy: A Cointegration Approach. Journal of Comparative Economics.2004;32:315-327.Available: bof.fi/NR/rdoniyres/E7B80101-DA1B-46988DC4…/0/DP0302.PDF.
39. Akram QF. Oil prices and exchange rates: Norwegian evidence. EconometricsJournal. 2004;7(2):476-504.Available: http://dx.doi.org/10.1111/j.1368-423X.2004.00140.x.
40. Clark PB, Macdonald R. Exchange rate and economic fundamentals: amethodological comparison of BEERs and FEERs. IMF Working paper 1998;98(67).
41. Enders W. Applied Econometric Time Series. Hoboken, NJ: Wiley 2005.42. Nguyen HT. Exports, Imports, FDI and Economic Growth. Discussion papers in
economics. Working paper No. 11-03. 2011;1-47.43. Farzanegan M, Markwardt G. The effects of oil price shocks on the Iranian
economy. Energy Economics. 2009;31(1):134-15144. Akpan, EO. Oil price shocks and Nigeria’s macro economy.
Available: www.csae.ox.ac.uk/conferences/2009-EDiA/papers/252-Akpan.pdf.45. Chang Y, Wong IF. Oil price fluctuation and Singapore economy. Energy policy:
2003;31._________________________________________________________________________© 2013 Riman et al.; This is an Open Access article distributed under the terms of the Creative CommonsAttribution License (http://creativecommons.org/licenses/by/3.0), which permits unrestricted use, distribution, andreproduction in any medium, provided the original work is properly cited.
Peer-review history:The peer review history for this paper can be accessed here:
http://www.sciencedomain.org/review-history.php?iid=247&id=20&aid=1972