Munich Personal RePEc Archive - uni- · PDF fileMunich Personal RePEc Archive Sovereign and...
25
Munich Personal RePEc Archive Sovereign and bank CDS spreads: two sides of the same coin? Davide Avino and John Cotter 2014 Online at http://mpra.ub.uni-muenchen.de/55208/ MPRA Paper No. 55208, posted 12. April 2014 10:52 UTC
Transcript of Munich Personal RePEc Archive - uni- · PDF fileMunich Personal RePEc Archive Sovereign and...

MPRAMunich Personal RePEc Archive
Sovereign and bank CDS spreads: twosides of the same coin?
Davide Avino and John Cotter
2014
Online at http://mpra.ub.uni-muenchen.de/55208/MPRA Paper No. 55208, posted 12. April 2014 10:52 UTC

Sovereign and bank CDS spreads: two sides of the same coin?*
Davide Avinoa and John Cotter
a
Current version: April 2014
Abstract
This paper investigates the relationship between sovereign and bank CDS spreads with reference to their
ability to convey timely signals on the default risk of European sovereign countries and their banking
systems. By using a sample of six major European economies, we find that sovereign and bank CDS
spreads are cointegrated variables at the country level. We then perform a more in-depth investigation of
the underlying price discovery mechanisms. By decomposing the noise and speed of adjustment
components of the price discovery, we find that both variables have an important price discovery role in
the period 2004-2013. Most developed countries (Germany, Sweden) show a clear leading role for bank
CDS spreads throughout the sample period, whereas most distressed European economies (Portugal and
Spain) are governed by a leading role for their sovereign CDS spreads during both the sub-prime crisis
and the subsequent European sovereign debt crisis.
JEL classification: G01; G12; G14; G20; D8
Keywords: Credit default swap spreads; price discovery; information flow; financial crisis; banks;
sovereign risk; bank capital
* We gratefully acknowledge financial support from Science Foundation Ireland (08/SRC/FMC1389). We also want
to thank Ajai Chopra, Tom Conlon, Greg Connor, Ogonna Nneji and Chardin Wese Simen for their useful
comments and suggestions. E-mail addresses: [email protected] (D. Avino), [email protected] (J. Cotter).
a UCD School of Business, University College Dublin, Carysfort Avenue, Blackrock, Dublin, Ireland.

2
1. Introduction
The study of the interlinkages between sovereigns and banking systems has drawn much attention since
the outbreak of the global financial crisis in mid-2007. Acharya et al. (2011) describe a two-way feedback
effect between sovereign risk and banking risk, where bank bailouts by governments produce a negative
effect on the sovereign’s public finances which, in turn, reduce the value of the implicit government
guarantees for bank debt. This process generates a strong co-movement between the CDS spreads of
sovereign countries and financial companies. Kallestrup et al. (2012) also show that the size of the
implicit guarantees that the sovereign may extend to the domestic banking system has a strong effect on
sovereign CDS spreads. Gerlach et al. (2010) indicate that the size of the banking sector is an important
determinant of European sovereign risk spreads. Sgherri and Zoli (2009) find that solvency concerns of
the national banking systems have become an important determinant of sovereign credit spreads during
the financial crisis of 2007-2009.
We make two main contributions to the literature. Firstly, we measure the price discovery role of bank
and sovereign CDS markets by disentangling the effects of noise and speed of adjustment to new
information. This follows the recent theoretical study of Yan and Zivot (2010) and the empirical work of
Putniņš (2013). This is especially important since miscrostructure and liquidity effects (transitory shocks)
in bank and sovereign CDS markets are very different and may have a confounding impact on how fast
each spread series is able to incorporate new fundamental information (permanent shocks).1 In particular,
Annaert et al. (2013) find that illiquidity plays a significant role in explaining bank CDS spreads whereas
Fontana and Scheicher (2010) find that bid-ask spreads are insignificant determinants of sovereign CDS
spreads. In line with these two studies, we also find that bank bid-ask spreads are much higher than
sovereign CDS spreads (especially since the start of the sub-prime crisis) and that liquidity conditions
between these two markets are not the same.
Secondly, unlike previous studies, we do not limit our analysis to crisis periods and investigate this
relationship during the tranquil period preceding the start of the sub-prime crisis (see, for instance,
Gerlach et al., 2010; Alter and Schüler, 2012; De Bruyckere et al., 2013).
As our main findings confirm, the interdependence of banks and sovereigns has existed since before the
start of the sub-prime crisis, and the subsequent European sovereign debt crisis. Since their introduction
in 1988, Basel rules on banks’ capital requirements have certainly favoured the development of these
1 Permanent shocks are the source of permanent movements in prices and are related to the efficient price (or
common factor) which is driven by news. On the other hand, transitory shocks do not have a permanent impact on
prices and are related to transient effects such as, for instance, bid-ask bounces and inventory adjustments (see
Baillie et al., 2002).

3
links, which, in the past 5 years, have appeared to be particularly strong. According to the first Basel
accord (Basel I), government bonds are given a zero risk weight. Basel II rules, introduced in 2004 to
remedy some of the pitfalls existing in the previous accord (in particular the poor risk sensitivity for a
bank’s capital allocation decisions), rely upon a ratings-based system (the standardised approach).2
According to this latter approach, AAA-rated and AA-rated government debt are assigned a zero risk
weight. Furthermore, relative to the computation of the risk weight for banks’ exposures, a bank is given
the option to classify its loans based on the rating assigned to the borrowing bank and the rating of the
country where the borrowing bank operates (Resti and Sironi, 2007).
Hence, based on the existing capital adequacy rules, government debt represents a cheap way for a bank
to get a financial instrument which can be widely used for risk and liquidity management purposes. In
particular, government bonds can be used as collateral for interbank loans, for repo transactions and to
access central bank liquidity through the discount window. According to Bolton and Jeanne (2011), data
on the 2010 European banks stress test show that, as of March 2010, on average, about 30% of
government debt was held by the banking sector. Higher shares (of about 50%) were observed for Spain
and Germany. Given the above evidence, it is then not surprising that a shock to a country’s banking
system may have sizeable effects on its sovereign (and vice versa).
In order to describe the linkages between European sovereigns and their respective banking systems, we
focus on sovereign and bank CDS spreads for six major European economies during the period 2004-
2013. The objective of this paper is the study of the credit risk price discovery process implied by bank
and sovereign CDS spreads.
As the CDS spreads are cointegrated variables, they share the same stochastic trend (or common factor).
We find that both bank and sovereign CDS spreads contribute to the price discovery of this common
factor over the period under analysis. However, their price discovery role varies both across time and
countries. In particular, the most developed EU countries (Germany and Sweden) show a leading role of
bank CDS spreads at all times. On the other hand, sovereign CDS spreads of Portugal, Spain and Italy
(countries with most distressed financial conditions) lead the price discovery during the sub-prime crisis
and, relative to Portugal and Spain, also during the subsequent sovereign debt crisis. Lastly, the tranquil
period preceding the sub-prime crisis is characterized by a leading role of bank CDS spreads.
2 Basel II rules allow banks to choose among two main methods for computing capital requirements for credit risk.
The first one is the standardised approach, which is based on credit ratings provided by external rating agencies. The
second one is the internal ratings based (IRB) approach, which allows banks the use of their internal estimates of the
loss given default, expected and unexpected losses to calculate the capital required for a given exposure (Basel
Committee on Banking Supervision, 2005).
4
The study of these interconnections also allows us to investigate whether the price discovery implied by
market CDS prices could have given timely signals about the financial risks of the European banking
systems, which have subsequently become the main subject of costly resolution mechanisms and
endangered the solvency of various European sovereigns. The recent examples of sovereign-funded bank
bailout packages adopted by a group of European Union countries have shown how governments’
attempts at restructuring their countries’ banking system have generated huge costs for the taxpayers,
which in turn have exacerbated recessionary spirals across European economies.
Our results show that sovereign CDS spreads may contain important credit risk information on a
country’s banking system. This is especially true for most distressed economies during recent crisis
periods, whereby an investor would have obtained a more timely indication of a bank’s default risk from
the CDS spreads of the sovereign country (where the bank operates) than the bank CDS spread itself. The
latter result can be explained, in part, by the extensive programmes of bank bailouts undertaken by
European governments that have shifted the credit risk from the banking sector to the sovereigns (see
Ejsing and Lemke, 2011; Dieckmann and Plank, 2011).3
Our conclusions are important for bank regulators. Information about the credit risk of a country’s
banking sector could be retrieved by analysing the sovereign credit risk. The latter could provide extra
information that can be used by bank supervisors to improve banking rules on capital requirements. The
early signals of a banking crisis could be obtained by observing sovereign credit spreads and this
information could be used to take more timely policy actions in order to prevent a country-specific
banking crisis from becoming systemic and affecting the whole European banking sector. Given the
convergence of bank risks across Europe documented by Poghosyan and Čihak (2011), our findings also
suggest that policymakers should adopt coordinated actions, especially in crisis periods when European
banking sectors are similarly affected by negative shocks. With regard to that, recent proposals for the
establishment of a banking union (Goyal et al., 2013) could help speed up the decision process at times
when timely decisions are much needed.
The rest of the paper is as follows: Section 2 reviews some of the literature on the determinants of
sovereign and bank credit spreads and the price discovery of credit spreads. Section 3 describes the
3 Based on the cointegration between bank and sovereign CDS spreads, price discovery triggers for bank resolution
mechanisms could be used in the future to raise banks’ equity buffers and their contingent capital. In retrospect, our
findings show that, at the end of 2009, these triggers would have suggested the need for capital buffers for most
European banks. As documented by Hart and Zingales (2011), CDS spreads capture the downside risk better than
equity prices (which are subject to limited liability), are more liquid than bond issues and lead the price discovery
process.

5
dataset. Section 4 presents the methodology. Section 5 analyses the main results of our study and Section
6 concludes.
2. Literature Review
Recent studies on the determinants of bank and sovereign CDS spreads show that these two time series of
spreads are driven by the same risk factors. Annaert et al. (2013) and Fontana and Scheicher (2010)
analyse the determinants of Euro area bank CDS spread changes and sovereign CDS spread changes,
respectively. Both studies are inspired by the theoretical credit risk models, introduced by the seminal
work of Merton (1974), in the selection of possible determinants of CDS spreads. Following Collin-
Dufresne et al. (2001) and Ericsson et al. (2009), which focussed on the determinants of credit spread
changes for corporates, Annaert et al. (2013) use both firm-specific variables (such as bank financial
leverage, asset volatility and liquidity) and market-wide variables (such as the risk free interest rate, the
slope of the yield curve, a stock index return, an implied volatility index, corporate bond risk premium) to
explain the changes of bank CDS spreads. Likewise, Fontana and Scheicher (2010) use a very similar set
of independent variables to explain sovereign CDS spread changes. Interestingly, Annaert et al. (2013)
show that bank CDS spreads are largely affected by CDS liquidity and market-wide liquidity. Differently,
Fontana and Scheicher (2013) find that sovereign CDS spreads are not significantly affected by market
liquidity conditions.
Despite this difference in liquidity effects, the studies above suggest that bank and sovereign CDS
markets are affected by the same risk factors and, for this reason, the evolution of bank and sovereign
CDS spreads would be expected to be driven by a shared common factor at any point in time. Indeed,
some other recent studies on the determinants of sovereign CDS spreads have investigated whether this
common factor is related to fundamental macroeconomic risk or to financial risk. For instance, Longstaff
et al. (2011) find that most of the sovereign CDS spread variation can be explained by US equity,
volatility and bond market risk premia. In another study, Ang and Longstaff (2011) find evidence that a
systemic common factor drives CDS spreads written on sovereign states in the US and European
countries. They also show that this systemic risk factor is affected by global financial factors rather than
macroeconomic factors.
Over the last decade, several papers have analysed the price discovery of corporate credit spreads. For
instance, Zhu (2004) and Blanco et al. (2005) find that CDS spreads have a greater price discovery role
than bond credit spreads. Longstaff et al. (2003), Norden and Weber (2009) and Forte and Peña (2009)

6
also show that equity-implied spreads and CDS spreads have a leading role over bond credit spreads.
Acharya and Johnson (2007) show that the CDS market leads the equity market. There has been a
proliferation of studies on the price discovery of European sovereign CDS and bond spreads. Varga
(2009) and Palladini and Portes (2011) find a leading role of sovereign CDS spreads over bond spreads.
Delatte et al. (2012), O’Kane (2012), Arce et al. (2011), Fontana and Scheicher (2010) find that CDS
spreads lead in some countries, whereas bond credit spreads lead in others.
More recently, De Bruyckere et al. (2013) show that contagion occurred between bank and sovereign
CDS spreads in Europe during the 2007-2012 period. Alter and Schüler (2012) also focus on the
interdependence between sovereign and bank CDS spreads for some European countries during the period
2007-2010. They find that before bank bailouts, contagion transferred from bank CDS spreads to
sovereign CDS spreads. However, after the implementation of bank bailout programs, sovereign CDS
spreads had an impact on bank CDS spreads. Similar to these studies, we also investigate the relationship
between bank and sovereign CDS spreads. Following a similar methodology to the price discovery
studies described above, our paper aims to analyse the price discovery of bank and sovereign CDS
spreads to the revelation of the common factor (or efficient price) which previous research has identified
as the main driver of the two series of CDS spreads. Our decision to focus on CDS spreads rather than
bond credit spreads derives from a greater evidence of a leading role of CDS spreads for both corporates
and sovereigns. Differently from these studies, our main objective is to separate the effect of transitory
and permanent shocks on the revelation of CDS prices for sovereigns and their banking system since the
start of sovereign CDS trading. Yan and Zivot (2010) have shown that two widely used price discovery
measures, namely the Gonzalo and Granger (1995) measure (GG, hereafter) and Hasbrouck (1995)’s
information share (IS, hereafter), account for noise trading and liquidity shocks in addition to the speed of
adjustment to new information.4 Most importantly, they show that a combination of these two measures
into a new measure can eliminate the confounding effects of the temporary shocks (such as noise and
liquidity issues) on the incorporation of the fundamental value. The empirical study of Putniņš (2013)
confirms Yan and Zivot (2010)’s main findings. The methodology used in our study is based on these two
papers and is described in Section 4.
4 For instance, a higher IS measure (hinting at a higher price discovery) can be due to a faster incorporation of new
information and/or less liquidity shocks.

7
3. Data
We use sovereign CDS and bank CDS daily mid-quotes from CMA (provided by Datastream) for six
major European economies, namely France, Germany, Italy, Portugal, Sweden and Spain. CMA data are
available from January 2004 until September 2010. Starting from October 2010 until March 2013,
Datastream provides CDS quotes obtained from Thomson Reuters.5 In accordance with previous studies,
we focus on the 5-year maturity for senior unsecured debt, as these contracts are regarded as the most
liquid in the market. The time series of bank CDS spreads for each country was created by averaging
individual bank CDS spreads at the country level. We have an overall sample of 28 banks spread across
the six countries (see Table 1). We focus on these specific six countries as they have continuous series of
CDS spreads starting from 2004. As highlighted in the introduction, we are interested in examining the
interdependence of bank and sovereign CDS markets prior to financial crisis periods, which has not been
investigated by previous studies.
Figure 1 and Figure 2 show the time series of CDS spreads both for the six countries and on aggregate,
respectively, over the whole sample period from January 2004 until March 2013. It is evident how the
level of both bank and sovereign CDS spreads started to rise dramatically since mid-2007, in
correspondence with the outbreak of the financial crisis. Clearly, the pair of spreads for each country are
very much interlinked over the whole sample period. We compute Pearson’s correlations (unreported) at
the country level and find that they range from about 0.90 to 0.98. However, the correlation between
sovereign and bank CDS spreads is 0.66 in Sweden, and an explanation for this lower value could derive
from the higher illiquidity of the sovereign CDS market in the early part of the sample.
Table 1 presents the summary statistics for the levels of bank CDS spreads (Panel A) and sovereign CDS
spreads (Panel B). We can note how bank CDS spreads show a higher mean and volatility than sovereign
CDS spreads. Median values are consistently lower than mean values, highlighting the presence of non-
normality features such as positive skewness. The range of values for the bank and sovereign CDS
spreads is very wide and this is reflected by the fact that the first part of our sample coincides with a very
tranquil period, whereas the second part includes both the global financial crisis and the European
sovereign debt crisis. As can be seen from the last row of the two panels, aggregate results show a similar
picture to the country-level summary statistics. With regard to the bank CDS spreads, the minimum
number of banks is found in Portugal (only 2), whereas the maximum number of banks is in Italy and
Spain (7 banks for each country).
5 CDS spreads for Sweden and Spain are only available starting from March 2004 and July 2004, respectively.

8
4. Methodology
The first step of our analysis is to check whether bank and sovereign CDS spreads are cointegrated at the
country-level. Two non-stationary variables are cointegrated if there exists a linear combination of them
which is stationary. In this case, both variables share the same stochastic trend. The evidence that the two
variables under investigation are driven by the same risk factors (see the studies of Annaert et al., 2013;
Fontana and Scheicher, 2010; Longstaff et al., 2011; Ang and Longstaff, 2011) suggests the existence of a
long-run relationship between the two time series of CDS spreads. Shared common patterns can also be
observed graphically in Figures 1 and 2.
In order to test for cointegration, we implement the Johansen (1991) test for each country’s pair of
sovereign and bank CDS spreads. Indeed, as discussed in the next section, cointegration is found for all
six countries. This finding is very important for the choice of the appropriate econometric model to be
used to describe the time series behaviour of the bank and sovereign CDS spreads. In particular, the
following analysis is based on the vector error correction model (VECM). The latter model is best suited
to represent the dynamic interactions of cointegrated variables (see, for instance, Blanco et al., 2005). Our
general model is applied separately for each country and is given below:
t
p
j
jtj
p
j
jtjt SovereignBankCEBank 1
1
1
1
111
(1)
t
p
j
jtj
p
j
jtjt SovereignBankCESovereign 2
1
2
1
222
(2)
where and are i.i.d. error terms and p is the number of lags selected based on the Akaike criterion.
We define the cointegrating equation as follows:
1101 tt SovereignBankCE (3)
Bank and Sovereign represent bank CDS mid-quote and sovereign CDS mid-quote, respectively. The β
and δ coefficients represent the short run dynamics of the system, whereas the ϕ coefficients describe the
long run dynamics. The λ coefficients are the error correction terms which define the adjustment of each
series of spreads towards the long run equilibrium implied by the model. This general representation
allows us to investigate the price discovery process between bank and sovereign CDS spreads. In order to
do so, we study the statistical significance of the error correction coefficients, namely λ1 and λ2. For
example, for the bank CDS spreads to be leading the price discovery process λ2 has to be positive and
statistically significant and, at the same time, λ1 has to be statistically insignificant. This would mean that

9
sovereign CDS spreads have to adjust when they deviate from bank CDS spreads in order to meet the
long-run equilibrium defined in equation (3). As bank CDS spreads would not be responsible for the latter
adjustment, they would be leading the price discovery process. On the other hand, bank CDS spreads
would not lead the price discovery if λ1 is negative and statistically significant and λ2 is not statistically
different from zero. If both λ1 and λ2 are correctly signed (as indicated above) and statistically significant,
then both bank and sovereign CDS spreads would contribute to the price discovery process. Another way
to quantify which market leads the price discovery is via the implementation of common factor models,
which are based on the works of Gonzalo and Granger (1995) and Hasbrouck (1995). The latter are used
to generate a price discovery measure for each market. We use both the Gonzalo and Granger (1995) and
information share (Hasbrouck, 1995) measures of price discovery. According to Gonzalo and Granger
(1995), the contribution of bank CDS spreads to the price discovery can be defined by the following
expression:
12
2
BankGG (4)
where BankGG stands for the Gonzalo and Granger measure for bank CDS spreads. Differently, the IS
measure weighs the error correction terms by the variances and covariance of each market’s VECM
innovations. Due to the existence of a non-zero correlation between the VECM residuals in (1)-(2),
Habrouck (1995) suggests to use the Cholesky decomposition to remove this contemporaneous
correlation. The Cholesky orthogonalization produces two bounds of price discovery which are given by
the following relations (see Blanco et al., 2005):
2
2
2
11221
2
1
2
2
2
2
2
122
1
2
2
1_2
BankIS , 2
2
2
11221
2
1
2
2
2
1
12112
2_2
BankIS , (5)
where 2
1 , 12 and 2
2 represent the covariance matrix of and . Following Baillie et al. (2002),
we take the midpoint of the two bounds ( BankIS ) as a measure of the price discovery occurring in bank
CDS spreads.
The recent study by Yan and Zivot (2010) has shown that both the GG and IS measures capture each
price series’ level of noise and liquidity shocks in addition to its informational leadership in reflecting
innovations in the fundamental value. They show that combining the GG and IS metrics would eliminate

10
the noise component and give a clean measure of price discovery which only reflects the informational
leadership (IL) of a price series:
Bank
Sov
Sov
BankBank
GG
GG
IS
ISIL , (6)
where BankSov ISIS 1 and BankSov GGGG 1 both representing the price discovery attributed to the
sovereign CDS spread series by the IS and GG measures, respectively. Unlike the GG and IS measures,
the IL measure is not bounded between 0 and 1. In particular, BankIL has the range [0, ∞), whereby values
higher (lower) than 1 indicate that bank CDS prices lead (do not lead) the price discovery process. In
order to facilitate both the interpretation of the IL metric and the comparison with the IS and GG
measures, we follow Putniņš (2013) and define the information leadership share (ILS) of a price series as
follows:
SovBank
BankBank
ILIL
ILILS
(7)
Hence, all three measures of price discovery are bounded between 0 and 1 and can be compared. For
instance, a BankGG (or BankIS or BankILS ) value of 0.80 can be interpreted as evidence that 80% of the
price discovery takes place in bank CDS spreads, whereas the remaining 20% of price discovery is
attributed to sovereign CDS spreads. In the next section we mainly rely on the ILS measure to interpret
our results, as this measure has been shown to be superior in the identification of the informational role of
a given price series when comparing price series characterized by different levels of noise (Putniņš,
2013).
5. Results
According to the Augmented Dickey Fuller (ADF) test, both bank and sovereign CDS spreads are non-
stationary at the 5% significance level for France, Germany, Italy, Portugal and Spain. The sovereign
CDS spreads for Sweden are non-stationary at the 10% significance level. Instead, CDS changes result to
be stationary. We also check whether sovereign CDS spreads are, on aggregate, non-stationary in the

11
period preceding the start of the sub-prime crisis and indeed, we find evidence of non-stationarity which
supports the use of our methodology throughout our sample period.6
We then examine whether sovereign and bank CDS spreads are cointegrated by using the Johansen
cointegration test. The results of the cointegration test are reported in Table 2. Trace test statistics show
that one cointegrating equation is found for each of the six countries under analysis. Hence, a long-run
relationship exists between bank and sovereign CDS spreads in each country. Cointegration is also found
on aggregate between the mean sovereign CDS spreads and the mean bank CDS spreads.7
Based on this finding, we estimate both a country-level and an aggregate VECM – as defined in equations
(1) to (3) – which is used to study the price discovery process between bank and sovereign CDS spreads.
In Table 3, we report the estimated error correction coefficients (λ1 and λ2), their significance and the GG,
IS and ILS measures of price discovery for different sub-periods.8 Panel A describes results for the whole
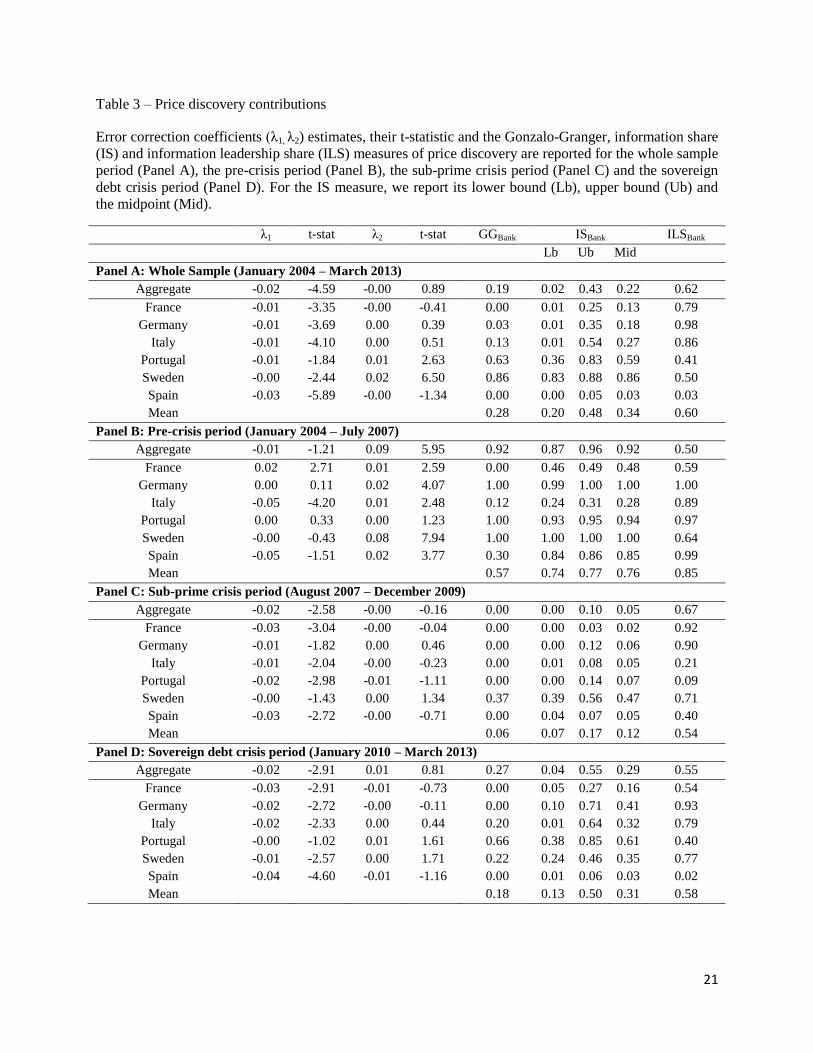
sample period. If we focus our attention on the error correction coefficients, we can note that λ1 is highly
significant in 5 out of 6 cases, whereas λ2 is significant in 2 out of 6 cases. Hence, there is greater
evidence that sovereign CDS spreads lead bank CDS spreads than vice versa. This finding is confirmed
by the GG values, reported in the last column of the table. Indeed, sovereign CDS spreads dominate the
price discovery in 4 countries (France, Germany, Italy, and Spain), whereas bank CDS spreads have a
leading role in Portugal and Sweden only. Similar results are given by the IS measure. However, as
highlighted in previous sections, both the GG and IS measures include liquidity effects and noise in their
representation of price discovery. For this reason, we focus on the ILS measure and find very different
results. In particular, the ILS metric suggests a leading role of bank CDS spreads for France, Germany
and Italy; it also suggests a leading role of sovereign CDS spreads for Spain (in line with the GG and IS
measures) and a pretty similar price discovery contribution of both bank and sovereign CDS spreads for
Portugal and Spain.
In order to better capture the time variation of the price discovery, we split the sample into 3 sub-periods:
a pre-crisis period (January 2004 to July 2007), a sub-prime crisis period (August 2007 to December
2009) and a sovereign debt crisis period (January 2010 to March 2013). The splitting points for the sub-
periods are selected based on the fact that the cost of insurance against corporate defaults doubled in
August 2007 and we take this as a strong signal for the start of the sub-prime crisis. We also choose
6 See Dickey and Fuller (1981). Results on the ADF test are available on request.
7 Note that both the mean sovereign and bank CDS spreads are weighed by the number of banks operating in each
country. This makes sure that we do not overstate the role of a country’s CDS market for which we have very few
banks. 8 In some cases, we find that GG values are lower than zero or higher than 1. We follow Blanco et al. (2005) and
replace these numbers with zero and one, respectively.

12
January 2010 as the starting point of the sovereign debt crisis as Eurostat reported at this time that Greek
debt data could not be relied upon, causing concerns among financial market participants, of a possible
Greek default on its foreign borrowing.9
Panel B of Table 3 shows results for the pre-crisis period. We observe that λ1 is significant in 2 cases (for
France and Italy), whereas λ2 is highly significant in 5 out of 6 cases. This would suggest a greater leading
role for bank CDS spreads. The GG measure shows that a clear leading role of bank CDS spreads occurs
in Germany, Portugal and Sweden, whereas in the other countries sovereign CDS spreads lead the price
discovery. These results are confirmed by the IS measure, except for Spain for which a greater price
discovery role is given to bank CDS spreads. On the other hand, the ILS measure attributes a clear leading
role of bank CDS spreads for Germany, Italy, Portugal and Spain which all show ILS values close to 90%
or higher. Bank CDS spreads also lead in France and Sweden but the price discovery values are closer to
50% (0.59 and 0.64, respectively) showing that sovereign CDS spreads in these two countries also have a
significant price discovery role before the start of the financial crisis.
Panel C analyses the sub-prime crisis period, for which λ1 is negative and significant for 5 countries out of
6, while λ2 is never significant at conventional significance levels. Hence, we find overwhelming evidence
of the leading role of sovereign CDS spreads, and this is confirmed also by the values assumed by both
the GG and IS measures, which are generally very low for bank CDS spreads. However, differently from
the GG and IS, the ILS measure suggests that bank CDS spreads assume informational leadership in
France, Germany and Sweden (ILS values of 0.92, 0.90 and 0.71, respectively).
Finally, Panel D summarizes estimation results for the sovereign debt crisis period. Similar to the sub-
prime crisis results, λ1 is negative and significant in 5 cases out of 6, whereas λ2 is never significant at the
5% significance level. Again, these findings support a leading role of sovereign CDS spreads over bank
CDS spreads. The latter is also confirmed by bank GG and IS values which are always lower than 0.50
except for the case of Portugal (GG and IS of 0.66 and 0.61, respectively). Except for the case of Spain,
the ILS values show a different picture. In particular, bank CDS spreads lead in Germany, Italy and
Sweden showing ILS values of 0.93, 0.79 and 0.77, respectively. Both bank and sovereign CDS spreads
have an important role in the price discovery for France and Portugal for which we find ILS values of
0.54 and 0.40, respectively.
Overall, our results show that the period preceding the start of the financial crisis of 2007-2009 is
characterized by a dominant price discovery role of bank CDS spreads for all countries, although
9 Note that for the estimation of the VECM for the different sub-periods, we impose the cointegration equations
obtained from the VECM implemented over the whole sample period.

13
sovereign CDS spreads also play a significant contribution in France and Sweden with ILS values of
about 40%. The role of sovereign CDS spreads in the price discovery increased substantially during the
sub-prime crisis period. In particular, they have a leading role in Italy, Portugal and Spain with ILS values
of 0.79, 0.91 and 0.60, respectively. Its contribution is reduced but still relevant in the sovereign debt
crisis period, where sovereign CDS spreads are dominant in Spain (ILS of 0.98) and, to a lesser extent, in
Portugal (ILS of 0.60) and share a similar level of price discovery to bank CDS spreads in France (ILS of
almost 0.50).
Separating the effects of noise and liquidity from the informational role of a price series is crucial. This is
especially true when the price series being compared show heterogeneous liquidity conditions such as the
case of sovereign and bank CDS markets analysed in this paper. For instance, Annaert et al. (2013) find
evidence of illiquidity in bank CDS spreads as CDS protection sellers raised the ask price in order to
balance their increased hedging difficulties. On the other hand, Fontana and Scheicher (2010) find that
liquidity proxies are insignificant to explain changes in sovereign CDS spreads. We find that bid-ask
spreads (often used as a liquidity proxy) are much higher for bank CDS contracts. In particular, they are
about 1.3 basis points (bp) higher than sovereign CDS contracts in the pre-crisis period, but they
significantly increase during the sub-prime crisis and the sovereign debt crisis, where they exceed
sovereign CDS bid-ask spreads by 4.3 bp and 7.4 bp, respectively.
Some of the reasons underlying the increase of the price discovery of sovereign CDS spreads during the
sub-prime crisis could be related to (1) the emergence of counterparty risk in the settlement of CDS
contracts during the crisis periods that may have affected the CDS market more for banks than for
sovereigns. This may have kept investors from trading bank CDS spreads and favoured sovereign CDS
trading;10
(2) the existence of explicit and implicit guarantees may have taken attention away from banks
and directed it to sovereigns, which took on full responsibility for the survival of a country’s banking
system and burdened their public finances with excessive debt. Hence, investors willing to bet on bank
credit risk have done so by trading sovereign CDS spreads as the latter were seen as the main source of
banking risk. The drop in the price discovery of bank CDS spreads that occurred during the financial
10
What is special about bank CDS contracts is the fact that banks may constitute the buyers, the sellers and the
reference entities of the contract, such that if a credit event occurs (e.g., bank default) there is a high probability that
other banks (which could be protection sellers) may default as well. This circumstance is especially possible in times
of distress (such as the recent financial crisis) if banks are highly interconnected (and they were) because of
financial innovation and globalization, the extensive use of securitization and substantial use of the interbank market
for funding purposes. Hence, from this point of view, bank CDS contracts bear higher systemic risk than sovereign
CDS contracts. In the latter, banks still appear as buyers and sellers but the reference entity is a sovereign. The
failure of a sovereign is less likely to spill over to banks unless several banks hold substantial holdings of
government debt of the defaulted country. The CDS settlement in case of the Greek default was smooth (see Coudert
and Gex, 2013) as the Greek debt was not considered as systemic, but the question remains whether the sovereign
CDS market would have functioned as smoothly in case, for instance, of a German default.

14
crisis shows how traders had already factored in the credit risk transfer from banks to sovereigns in the
period 2007-2009, that is well in advance of the actual government bailouts that occurred in May 2011 for
Portugal and July 2012 for Spain. The decline in the price discovery role of sovereign CDS spreads
occurred in the sovereign debt crisis period for all countries but France and Spain may possibly be
associated with the decisions taken by European governments on banning naked sovereign CDS
positions.11
Duffie (2010) argues that banning sovereign CDS trading would have a negative effect on the
public information flow about a borrower’s credit quality.
Table 3 also shows average (based on country-level estimates) and aggregate bank price discovery
measures for each sample period. Based on ILS estimates, while 85% (50% based on aggregate results) of
the price discovery occurs in bank CDS spreads before the start of the financial crisis, 54% (67% based
on aggregate results) of the price discovery is due to bank CDS spreads during the financial crisis of
2007-2009. The share of bank CDS spreads’ price discovery is equal to 58% (55% based on aggregate
results) during the sovereign debt crisis period. The former results are consistent with the theoretical
evidence discussed in Section 2, according to which both bank and sovereign CDS spreads are driven by
the same fundamental factors and hence are both expected to contribute significantly, to a greater or lesser
extent, to the price discovery of the common factor. Very low values of price discovery for either bank or
sovereign CDS spreads indicate a sign of inefficiency in the price formation of the “true” CDS spreads
inherent in their CDS spreads. A price discovery measure (such as the ILS measure) could generate early
signals of increased default risk for banks.
Finally, we also run the analysis assuming the German sovereign CDS spreads as a benchmark. In fact,
German government bonds have been a target investment among investors all over Europe during the
recent years as they are regarded as the safest market for government bonds. Hence, German sovereign
CDS spreads and bank CDS spreads for each of the six countries are used for the VECM analysis in
equations (1)-(3). Results reported in Table 4 are very similar to those presented in Table 3 for the pre-
crisis period. However, some differences arise in the sub-prime crisis period (Italy and Portugal show a
leading role of bank CDS spreads with respect to the German sovereign CDS spreads, whereas the latter
lead Swedish bank CDS spreads) and during the sovereign debt crisis period (bank CDS spreads in
Portugal and Spain lead German sovereign CDS spreads). These findings highlight how price discovery
patterns were similar across EU countries during the pre-crisis period but became increasingly
11
On May 19, 2010, the German financial regulator banned naked sovereign CDS positions (Augustin, 2012). In the
same period, similar decisions were taken by the financial regulators in Italy, Spain, Portugal and France. On March
25, 2012 the European Commission published the “Regulation on short selling and certain aspects of CDS” which
introduced permanent restrictions on the EU sovereign CDS market, with effect starting from November 1, 2012.
The full text of the regulation can be found at http://ec.europa.eu/internal_market/securities/short_selling/

15
heterogeneous and dependant on the financial conditions of individual governments which were very
much committed to safeguard the health of their banking systems.
6. Conclusions
Based on the evidence provided by previous research on the existence of a common factor responsible for
the time variation of both bank and sovereign CDS spreads, this paper investigates the price discovery
process to this common factor of bank and sovereign CDS spreads for six major European economies
during the 2004-2013 period. Unlike previous studies which also analysed the relationship between bank
and sovereign CDS markets, we disentangle the effects of noise and liquidity shocks (which substantially
characterize these two markets) from those related to the speed of adjustment to new information. We
find that not accounting for the separate influence of these two components would produce biased price
discovery estimates.
We show that both sovereign and bank CDS spreads contribute to the price discovery during the time
period analysed. However, their contribution changes at the country-level and across sub-periods. Bank
CDS spreads lead the price discovery in the early part of our sample corresponding to the start of
sovereign CDS trading. On average, 85% of the price discovery occurs in bank CDS spreads. A
substantial increase in the price discovery of sovereign CDS spreads is observed during the sub-prime
crisis period (on average, almost 50% of the price discovery is due to the sovereign market) and a
decrease during the subsequent sovereign debt crisis period (on average, about 40% of the price discovery
occurs in the sovereign market). Most developed economies (such as Germany and Sweden) show a
dominant role of bank CDS spreads throughout the sample period, whereas most distressed European
economies (such as Portugal and Spain) are characterized by a leading role of their sovereign CDS
spreads during both the sub-prime crisis and the subsequent European sovereign debt crisis.
Possible reasons underlying the increase in the sovereign CDS price discovery role during the sub-prime
crisis and its slight reduction in the sovereign debt crisis may be partly motivated by the credit risk
transfer from the banking sector to the sovereigns that occurred in the European countries either through
bank bailouts or implicit guarantees provided by the European governments. This credit risk transfer was
anticipated by credit traders in 2009, as shown by the price discovery dominance of sovereign CDS
spreads over bank CDS spreads for Italy, Portugal and Spain. Additional explanations of these findings
could be linked to greater counterparty risk inherent in bank CDS contracts and the decisions taken by
European governments on banning naked sovereign CDS trading from May 2010.

16
Our conclusions support the hypothesis that bank and sovereign CDS markets have been interconnected
since the start of their CDS trading. Our findings suggest that, especially during crisis periods, sovereign
CDS spreads may incorporate more timely information on the default probability of European banks than
their corresponding bank CDS spreads. Hence, sovereign CDS spreads should be considered by both bank
regulators and monetary authorities to provide early signals on the default risk of a country’s banking
system.
17
References
Acharya, V.V., Johnson, T.C., 2007. Insider trading in credit derivatives. Journal of Financial Economics
84, 110-141.
Acharya, V.V., Drechsler, I., Schnabl, P., 2011. A pyrrhic victory? Bank bailouts and sovereign credit
risk. NBER Working Paper.
Alter, A., Schüler, Y.S., 2012. Credit spread interdependencies of European states and banks during the
financial crisis. Journal of Banking and Finance 36, 3444-3468.
Ang, A., Longstaff, F.A., 2011. Systemic sovereign credit risk: lessons from the US and Europe. NBER
Working Paper.
Annaert, J., De Ceuster, M, Van Roy, P., Vespro, C., 2013. What determines Euro area bank CDS
spreads? Journal of International Money and Finance 32, 444-461.
Arce, O., Mayordomo, S., Peña, J.I., 2011. Do sovereign CDS and bond markets share the same
information to price credit risk? An empirical application to the European monetary union case. SSRN
Working Paper.
Augustin, P., 2012. Sovereign credit default swap premia. SSRN Working Paper.
Baillie, R.T., Booth, G.G., Tse, G.Y., Zabotina, T., 2002. Price discovery and common factor models.
Journal of Financial Markets 5, 309-321.
Basel Committee on Banking Supervision, 2005. Basel II: international convergence of capital
measurement and capital standards: a revised framework. Bank for International Settlements, Basel.
Blanco, F., Brennan, S., Marsh, I.W., 2005. An empirical analysis of the dynamic relationship between
investment grade bonds and credit default swaps. Journal of Finance 60, 2255-2281.
Bolton, P., Jeanne, O., 2011. Sovereign default risk and bank fragility in financially integrated economies.
NBER Working Paper.
Collin-Dufresne, P., Goldstein, R.S., Martin, S.J., 2001. The determinants of credit spread changes.
Journal of Finance 56, 2177-2207.
Coudert, V., Gex, M., 2013. Why the Greek CDS settlement did not lead to the feared meltdown. Banque
de France Financial Stability Review 17, 135-150.
De Bruyckere, V., Gerhardt, M., Schepens, G., Vennet, R.V., 2013. Bank/sovereign risk spillovers in the
European debt crisis. Journal of Banking and Finance 37, 4793-4809.
Delatte, A., Gex, M., Lopez-Villavicencio, A., 2012. Has the CDS market influenced the borrowing cost
of European countries during the sovereign crisis? Journal of International Money and Finance 31, 481-
497.
Dickey, D.A., Fuller, W.A., 1981. Likelihood ratio statistics for autoregressive time series with a unit
root. Econometrica 49, 1057-1072.

18
Dieckmann, S., Plank, T., 2011. Default risk of advanced economies: an empirical analysis of credit
default swaps during the financial crisis. Review of Finance 16, 903-934.
Duffie, D., 2010. Is there a case for banning short speculation in sovereign bond markets? Banque de
France Financial Stability Review 14, 55-59.
Ejsing, J., Lemke, W., 2011. The Janus-headed salvation: sovereign and bank credit risk premia during
2008-2009. Economics Letters 110, 28-31.
Ericsson, J., Jacobs, K., Oviedo, R., 2009. The determinants of credit default swap premia. Journal of
Financial and Quantitative Analysis 44, 109-132.
Fontana, A., Scheicher, M., 2010. An analysis of euro area sovereign CDS and their relation with
government bonds. ECB Working Paper.
Forte, S., Peña, J.I., 2009. Credit spreads: An empirical analysis on the informational content of stocks,
bonds, and CDS. Journal of Banking and Finance 33, 2013-2025.
Gerlach, S., Schulz, A., Wolff, G.B., 2010. Banking and sovereign risk in the euro area. Deutsche
Bundesbank Discussion Paper.
Gonzalo, J., Granger, C.W.J., 1995. Estimation of common long-memory components in cointegrated
systems. Journal of Business and Economics Statistics 13, 27-36.
Goyal, R., Brooks, P.K., Pradhan, M., Tressel, T., Dell’Ariccia, G., Leckow, C., Pazarbasioglu, C., 2013.
A banking union for the Euro area. International Monetary Fund Staff Discussion Note.
Hart, O., Zingales, L., 2011. A new capital regulation for large financial institutions.American Law and
Economic Review 13, 453-490.
Hasbrouck, J., 1995. One security, many markets: determining the contributions to price discovery.
Journal of Finance 50, 1175-1199.
Johansen, S., 1991. Estimation and hypothesis testing of cointegration vectors in Gaussian vector
autoregressive models. Econometrica 59, 1551-1580.
Kallestrup, R., Lando, D., Murgoci, A., 2012. Financial sector linkages and the dynamics of bank and
sovereign credit spreads. SSRN Working Paper.
Longstaff, F.A., Mithal, S., Neis, E., 2003. The credit-default swap market: is credit protection priced
correctly? Working Paper, UCLA.
Longstaff, F.A., Pan, J., Pedersen, L.H., Singleton, K., 2011. How sovereign is sovereign credit risk?
American Economic Journal: Macroeconomics 3, 75-103.
Merton, R., 1974. On the pricing of corporate debt: the risk structure of interest rates. Journal of Finance
29, 449-470.
Norden. L., Weber, M, 2009. The co-movement of credit default swap, bond and stock markets: an
empirical analysis. European Financial Management 15, 529-562.

19
O’Kane, D., 2012. The link between Eurozone sovereign debt and CDS prices. EDHEC Working Paper.
Palladini, G., Portes, R., 2011. Sovereign CDS and bond pricing dynamics in the euro-area. NBER
Working Paper.
Poghosyan, T., Čihak, M., 2011. Determinants of bank distress in Europe: evidence from a new data set.
Journal of Financial Services Research 40, 163-184.
Putniņš, T.J., 2013. What do price discovery metrics really measure? Journal of Empirical Finance 23, 68-
83.
Resti, A, Sironi, A., 2007. Risk management and shareholders’ value in banking: from risk measurement
models to capital allocation policies. Wiley.
Sgherri, S., Zoli, E., 2009. Euro area sovereign risk during the crisis. IMF Working Paper.
Varga, L., 2009. The information content of Hungarian sovereign CDS spreads. Central Bank of Hungary
Working Paper.
Yan, B., Zivot, E., 2010. A structural analysis of price discovery measures. Journal of Financial Markets
13, 1-19.
Zhu, H., 2004. An empirical comparison of credit spreads between the bond market and the credit default
swap market. Journal of Financial Services Research 29, 211-235.

20
Table 1 – Summary statistics
This table reports, for each country, summary statistics (expressed in basis points) for the time series of
bank CDS spreads (Panel A) and sovereign CDS spreads (Panel B) over the whole sample period, which
starts from January 2004 until March 2013. The number of banks for each country are also reported.
No. Banks Mean Median Minimum Maximum Std Deviation
Panel A: Summary statistics for bank CDS spreads
France 5 94.10 88.37 5.88 366.3 89.46
Germany 3 87.44 76.75 7.88 364.3 79.52
Italy 7 140.8 71.39 8.33 691.8 167.7
Portugal 2 282.1 95.76 8.43 1485 382.3
Sweden 4 70.69 70.34 8.25 238.7 54.78
Spain 7 150.9 106.9 5.39 644.4 149.2
ALL 28 135.9 97.11 8.18 549.8 139.4
Panel B: Summary statistics for sovereign CDS spreads
France - 49.06 14.75 1.50 249.6 61.04
Germany - 27.05 9.50 0.60 119.2 29.56
Italy - 123.6 43.85 5.30 591.5 150.7
Portugal - 240.0 40.50 1.90 1527 357.5
Sweden - 33.34 29.52 1.40 160.8 29.46
Spain - 134.4 65.77 2.55 641.0 159.8
ALL - 99.11 26.09 3.29 457.4 125.3
Table 2 – Johansen cointegration test
This table reports Johansen trace test statistics for the existence of a cointegrating vector relating bank
CDS spreads and sovereign CDS spreads. A constant is included in both the cointegrating equation and
the VAR. The number of lags is optimized according to the Akaike criterion. *, ** and *** indicate
significance at the 10%, 5% and 1% level, respectively.
Number of Cointegrating Vectors
None At Most 1
France 17.44** 2.52
Germany 24.09*** 2.93*
Italy 38.52*** 2.00
Portugal 20.60*** 1.20
Sweden 53.47*** 3.09*
Spain 37.18*** 2.63
Aggregate 38.77*** 2.14
21
Table 3 – Price discovery contributions
Error correction coefficients (λ1, λ2) estimates, their t-statistic and the Gonzalo-Granger, information share
(IS) and information leadership share (ILS) measures of price discovery are reported for the whole sample
period (Panel A), the pre-crisis period (Panel B), the sub-prime crisis period (Panel C) and the sovereign
debt crisis period (Panel D). For the IS measure, we report its lower bound (Lb), upper bound (Ub) and
the midpoint (Mid).
λ1 t-stat λ2 t-stat GGBank ISBank ILSBank
Lb Ub Mid
Panel A: Whole Sample (January 2004 – March 2013)
Aggregate -0.02 -4.59 -0.00 0.89 0.19 0.02 0.43 0.22 0.62
France -0.01 -3.35 -0.00 -0.41 0.00 0.01 0.25 0.13 0.79
Germany -0.01 -3.69 0.00 0.39 0.03 0.01 0.35 0.18 0.98
Italy -0.01 -4.10 0.00 0.51 0.13 0.01 0.54 0.27 0.86
Portugal -0.01 -1.84 0.01 2.63 0.63 0.36 0.83 0.59 0.41
Sweden -0.00 -2.44 0.02 6.50 0.86 0.83 0.88 0.86 0.50
Spain -0.03 -5.89 -0.00 -1.34 0.00 0.00 0.05 0.03 0.03
Mean 0.28 0.20 0.48 0.34 0.60
Panel B: Pre-crisis period (January 2004 – July 2007)
Aggregate -0.01 -1.21 0.09 5.95 0.92 0.87 0.96 0.92 0.50
France 0.02 2.71 0.01 2.59 0.00 0.46 0.49 0.48 0.59
Germany 0.00 0.11 0.02 4.07 1.00 0.99 1.00 1.00 1.00
Italy -0.05 -4.20 0.01 2.48 0.12 0.24 0.31 0.28 0.89
Portugal 0.00 0.33 0.00 1.23 1.00 0.93 0.95 0.94 0.97
Sweden -0.00 -0.43 0.08 7.94 1.00 1.00 1.00 1.00 0.64
Spain -0.05 -1.51 0.02 3.77 0.30 0.84 0.86 0.85 0.99
Mean 0.57 0.74 0.77 0.76 0.85
Panel C: Sub-prime crisis period (August 2007 – December 2009)
Aggregate -0.02 -2.58 -0.00 -0.16 0.00 0.00 0.10 0.05 0.67
France -0.03 -3.04 -0.00 -0.04 0.00 0.00 0.03 0.02 0.92
Germany -0.01 -1.82 0.00 0.46 0.00 0.00 0.12 0.06 0.90
Italy -0.01 -2.04 -0.00 -0.23 0.00 0.01 0.08 0.05 0.21
Portugal -0.02 -2.98 -0.01 -1.11 0.00 0.00 0.14 0.07 0.09
Sweden -0.00 -1.43 0.00 1.34 0.37 0.39 0.56 0.47 0.71
Spain -0.03 -2.72 -0.00 -0.71 0.00 0.04 0.07 0.05 0.40
Mean 0.06 0.07 0.17 0.12 0.54
Panel D: Sovereign debt crisis period (January 2010 – March 2013)
Aggregate -0.02 -2.91 0.01 0.81 0.27 0.04 0.55 0.29 0.55
France -0.03 -2.91 -0.01 -0.73 0.00 0.05 0.27 0.16 0.54
Germany -0.02 -2.72 -0.00 -0.11 0.00 0.10 0.71 0.41 0.93
Italy -0.02 -2.33 0.00 0.44 0.20 0.01 0.64 0.32 0.79
Portugal -0.00 -1.02 0.01 1.61 0.66 0.38 0.85 0.61 0.40
Sweden -0.01 -2.57 0.00 1.71 0.22 0.24 0.46 0.35 0.77
Spain -0.04 -4.60 -0.01 -1.16 0.00 0.01 0.06 0.03 0.02
Mean 0.18 0.13 0.50 0.31 0.58

22
Table 4 – Price discovery contributions using German CDS spreads as benchmark
The information leadership share (ILS) measure of price discovery is reported for the whole sample
period, the pre-crisis period, the sub-prime crisis period and the sovereign debt crisis period. Results are
derived by implementing the VECM in equations (1)-(3) using German CDS spreads and each country’s
mean bank CDS spread.
Whole Sample Pre-crisis Sub-prime
crisis
Sovereign debt
crisis
Aggregate 0.93 1.00 0.96 0.92
France 0.92 0.79 0.85 0.96
Italy 0.94 0.99 0.93 0.95
Portugal 1.00 0.93 0.94 1.00
Sweden 0.67 0.83 0.36 0.75
Spain 0.94 1.00 0.98 1.00

23
Figure 1 – Time series of bank and sovereign CDS spreads
This figure shows the evolution of the time series of bank and sovereign CDS spreads (in basis points) for
the six European economies under analysis, namely France, Germany, Italy, Portugal, Sweden and Spain.
0
100
200
300
4000
1/0
4
01
/05
01
/06
01
/07
01
/08
01
/09
01
/10
01
/11
01
/12
01
/13
(a) France
bank_cds_spread
sovereign_cds_spread
0100200300400
01
/20
04
01
/20
05
01
/20
06
01
/20
07
01
/20
08
01
/20
09
01
/20
10
01
/20
11
01
/20
12
01
/20
13
(b) Germany
bank_cds_sprerad
sovereign_cds_spread
0
200
400
600
800
01
/04
01
/05
01
/06
01
/07
01
/08
01
/09
01
/10
01
/11
01
/12
01
/13
(c) Italy
bank_cds_spread
sovereign_cds_spread
0
500
1000
1500
2000
01
/04
01
/05
01
/06
01
/07
01
/08
01
/09
01
/10
01
/11
01
/12
01
/13
(d) Portugal
bank_cds_spread
sovereign_cds_spread
0
100
200
300
03
/04
03
/05
03
/06
03
/07
03
/08
03
/09
03
/10
03
/11
03
/12
03
/13
(e) Sweden
bank_cds_spread
sovereign_cds_spread
0
200
400
600
800
07
/04
07
/05
07
/06
07
/07
07
/08
07
/09
07
/10
07
/11
07
/12
(f) Spain
bank_cds_spread
sovereign_cds_spread

24
Figure 2 – Time series of average bank and sovereign CDS spreads across the six European economies
This figure shows the evolution of the time series of average bank and sovereign CDS spreads (in basis
points). Data from the six European economies have been aggregated and mean values are weighted by
the number of banks operating in each country.
0
100
200
300
400
500
600
01
/04
06
/04
11
/04
04
/05
09
/05
02
/06
07
/06
12
/06
05
/07
10
/07
03
/08
08
/08
01
/09
06
/09
11
/09
04
/10
09
/10
02
/11
07
/11
12
/11
05
/12
10
/12
03
/13
Aggregate EU
mean_sovereign_cds_spread mean_bank_cds_spread