Munich Personal RePEc Archive - uni-muenchen.de · Munich Personal RePEc Archive Do changes in...
28
Munich Personal RePEc Archive Do changes in shariah screening methodology make islamic indices substitutes or complements? an application of MGARCH-DCC and markov switching analysis. Mohammed Mahmoud Mantai and Mansur Masih INCEIF, Malaysia, INCEIF, Malaysia 21 June 2016 Online at https://mpra.ub.uni-muenchen.de/72166/ MPRA Paper No. 72166, posted 23 June 2016 06:41 UTC
Transcript of Munich Personal RePEc Archive - uni-muenchen.de · Munich Personal RePEc Archive Do changes in...

MPRAMunich Personal RePEc Archive
Do changes in shariah screeningmethodology make islamic indicessubstitutes or complements? anapplication of MGARCH-DCC andmarkov switching analysis.
Mohammed Mahmoud Mantai and Mansur Masih
INCEIF, Malaysia, INCEIF, Malaysia
21 June 2016
Online at https://mpra.ub.uni-muenchen.de/72166/MPRA Paper No. 72166, posted 23 June 2016 06:41 UTC

Do changes in shariah screening methodology make islamic indices substitutes or
complements? an application of MGARCH-DCC and markov switching analysis.
Mohammed Mahmoud Mantai1 and Mansur Masih*
Abstract: Many studies have examined the portfolio diversification opportunity of the Shariah
compliant indices returns and markets including Malaysia. For the case of Malaysia, most of the
recent studies have found lesser possibilities of diversification due to the trading partnerships and
regional market contingencies. However, in this study, we apply MGARCH-DCC and use the MS-
AR technique, for the first time to the best of our knowledge, to investigate the impact of the newly
introduced Shariah screening methodology taking the Malaysian shariah FTEM index as a case
study together with other 5 Islamic indices to assess the extent of portfolio diversification
particularly after the new change as well as to identify the periods of stable and high volatilities.
The findings of this study are consistent with the recent findings of (Najeeb et.al (2015); Rahim
and Masih (2016)) with regards to portfolio diversification despite recent changes in the Shariah
screening methodology. Nonetheless, with regards to the regime change and the probability
duration of FTEM, we found that the shift from the stable to volatile regime normally takes place
after 9 weeks with the probability of staying in each regime 66 and 75 weeks respectively.
Therefore, the new screening methodology has yet to shift Islamic indices from being a substitute
to a complement. Finally, the findings of this paper may provide some insights to both Islamic
equity investors and policy makers of the Islamic finance industry.
Key Words: Shariah, Screening Methodology, Islamic Indices, MGARCH-DCC, Markov Switching
1Graduate research student in Islamic finance at INCEIF, Lorong Universiti A, 59100 Kuala Lumpur, Malaysia.
*Corresponding author, Professor of Finance and Econometrics, INCEIF, Lorong Universiti A, 59100 Kuala Lumpur, Malaysia.
Phone: +60173841464 Email: [email protected]

Page 1 of 27
1. Introduction: The Issue Motivating the Study
The fast growth in the Islamic finance industry and its resilience to the recent global financial crisis
compared to its conventional counterparts is not only the mere prohibition of riba but largely due
to the impacts of the Shariah screening methodologies that scrutinize the industry against the
unethical investment practices as well as curbing the investors’ appetite from taking unnecessary
risks. A vast number of empirical studies as mentioned in the literature section below have shown
the superiority of Islamic finance in contrast to the conventional finance particularly in the case of
portfolio diversification using the Islamic indices. However, the superiority of the Islamic indices
comes from their Shariah compliance. Hence, the first Shariah screening methodology has been
initiated by the Malaysian security commission (SC) in the mid-1990s in which they have
introduced two quite relaxed qualitative and quantitative benchmarks taking into consideration the
necessity for the Muslim investors to participate in the creation of wealth through their investment
in the shariah compliant equities as well as the infancy of the Islamic finance industry which is in
need of sustainable growth. Meanwhile, nine years later, the Dow Jones index has created a more
stringent shariah screening methodology in 1999 (Nur Hamizah, 2014). Nevertheless, since then
the number of the Shariah compliant stocks have increased both through different markets,
industries and countries such as Pakistan which has introduced her own screening criteria called
the Karachi-Meezan index that has the highest interest bearing debt to total asset of 37% (Nur
Hamizah, 2014) . The Dow Jones screening methodology for the shariah compliant companies
must pass all product, business activities, debt levels and interest and expenses to be eligible.
Nevertheless, in November 2013, Malaysia SC has revised the old Shariah screening methodology
and has adopted the two-tire quantitative benchmarks that represent the business activity and the
new financial ratio besides the already existing qualitative benchmarks. So far a great deal of

Page 2 of 27
studies have been conducted in assessing the efficiency of shariah compliant stocks compared to
the conventional or the non-shariah compliant stocks and their benefits in the diversification of the
investors’ portfolio. To the best of our knowledge, there is no empirical studies that have
investigated the impacts of this Shariah screening revision with respect to its peer Islamic indices.
Therefore, the aim of this paper is to examine using the MGARCH-DCC approach whether the
current change in the Shariah screening methodology by SC in Malaysia makes Islamic indices
returns substitute or complement as well as to identify the regime changes of the Malaysian Islamic
index FTEM using the Markov switching test. This study is the first empirical attempt that
investigates this new issue of the change in the Shariah screening methodology using these
relatively advanced econometric tools. It is crucial for both institutional investors and individuals
to take the right decisions in constructing their diversified portfolios. Moreover, the findings of
this study may provide some insightful information concerning the issue of global Shariah
screening harmonization.
2. Objective of the Study
Malaysia is the first Muslim country that has introduced the Shariah screening methodology in the
1990s and followed by Dow Jones in 1999. The implementation of the screening criteria even
though had been opposed by some Shariah scholars considering it as a means to Sada Al dharai.
However, it was well accepted -as a first initiative- by the other group of scholars based on the
principles of public interest (Maslaha) and Juristic preference (Istihsan). Indeed, despite the critics
and allegations of the previous relaxed methodology, it was a good approach for both Muslim and
non-Muslim investors who seek portfolio diversification. As a result of that, there has been this
rapid growth in Islamic finance. Nevertheless, conservative Muslim investors have been skeptical
due to their concern of indulging in harmful investment even though it might be minimum.

Page 3 of 27
Therefore, this concern which originated from rich individual, large companies and countries, it
was utilized by the Dow Jones and has offered a stricter Shariah screening criteria methodology.
The current existing literature mainly concentrates on the permissibility and prohibitions from the
shariah issues perspective, and from the diversification of portfolio in the case of investors. In
these regards, the views of the different schools of jurisdictions were thoroughly discussed
including the contemporary views which support the Shariah screening methodologies as the only
available option irrespective of the views of the proponents. Meanwhile, from the point of view of
the portfolio investors, it is more advantageous the more the Islamic indices are different from
their conventional counterparts since this will create the negative correlation which is beneficial
for their portfolio diversification. Nevertheless, a new revision has been introduced by SAC in
November 2013 in the case of the Malaysian Shariah screening methodology which makes it more
stringent compared to its previous criteria. To the best of our knowledge, with regards to this
revised criteria, there is no empirical study that analyses its impacts and its relationship with the
other major equity indices as well as studies that assess the change of regimes and duration of this
change. Therefore, the objective of this paper is to empirically examine the portfolio diversification
benefits before and after the newly introduced revision of the Shariah screening methodology using
MGARCH-DCC approach. Furthermore, we employ the Markov switching AR technique to
investigate the probabilities of regime change and their durations for the Malaysian FTEM index
after the revision of the shariah screening methodology. Hence, the findings of this study is
important for policy makers, practitioners and individual investors in the following ways: First,
the results of MGARCH-DCC would give good insight to the shariah-compliant investors in their
investment strategy of portfolio diversification within the Islamic stock indices. Second, policy
makers, particularly, the different Shariah authorities that set the shariah resolutions will obtain a

Page 4 of 27
more realistic information feedback with regards to the effects and influences of their resolution.
Third, practitioners could also infer the extent to which Shariah rules amendments affect the
Islamic indices and investors’ decisions thereby adjust their funds’ portfolios to avoid the Shariah
risks and maximize their returns. Finally, the regime shift findings of the Markov switching AR
and its duration may provide some crucial information that could assist fund managers in
identifying the durations and probabilities of changes between the two regimes given the current
environment of economic regime uncertainty.
3. Literature Review
Every activity in Islam is considered as a form of worship particularly, the economic activities.
Therefore, it must be compliant with Islamic Shariah law to be accepted. Due to this condition and
the forbiddance of interest rate and since the inception of the Islamic Banks by the late dedicated
Islamic economist Dr. Ahmed Al-Najar, the industry has grown from one Islamic Bank in the
1970s into more than 300 in more than 75 countries with a high annual growth rate that exceeds
15% mainly in East and South Asia (El-Qorchi, 2005). The reasons behind this fast development
was attributed to the positive impacts of the industry to the economic development and its
resilience to the global financial crises compared to its conventional counterparts; a theory that
have been identified by Ibn Khaldun in his book Al Muqaddimah (Nab, 2013).The theory of Ibn
Khaldun as mentioned by the latter emphasizes the great role of investment that leads to more
development which subsequently creates higher wealth and larger savings. However, the
realization of the sustainable development and financial stability requires from Muslim and non-
Muslim investors to strongly uphold Islamic finance principles such as the application of profit
and loss sharing and the prohibition of riba and abandon other immoral activities. Nevertheless, in
a comparative analysis of the Islamic banking and conventional banks in terms of businesses

Page 5 of 27
model, efficiency and stability, Thorsten Beck et.al (2012) have found that Islamic banks to have
higher asset quality, better capitalized and less likely to be hit during crises and thereby having
high stock performance. This claim is clearly verified by Dhankar and Mosab (2014) who
mentioned that since its emergence in 1963 in Egypt, its importance has greatly much recognized
after the 2008 financial crisis. The most important causes of the rapid growth of Islamic finance,
its positive effects on the economy and the stability of the financial system are due to the shariah
compliance of this industry as well as in investing in Shariah compliant portfolios of financial
assets and indices. With regards to the contagion effects at the regional level in Asia, (Masih A.
M., 1999) argued that the fluctuations in all the Asian stock markets are mostly explained by their
regional markets rather than advanced markets. Meanwhile, (M. Shabri Abd. Majid, 2009) found
that Asian stock markets in the ASEAN region to be cointegrated in both pre-and post- 1997
financial crises. However, in the case of the GCC emerging stock markets, (Hkiri, 2014)
documented a strong increasing dependence among the GCC stock markets during the 2007/2008
financial crisis despite the frequent changes their co-movements after the 2007. Nevertheless, on
the financial contingency effects on the emerging markets versus the US during the subprime
crisis, (Celık, 2012) found that emerging markets to be the most influenced by the contagion
effects. However, in the case of which market moves Malaysia, (Majid, 2006) highlighted that the
Japanese stock market had significantly moves the latter compared to the U.S. due to the regional
trade agreement of Malaysia with Japan.
However, in examining, the efficiency of the major global Islamic equity indices, Kabir Sarkar
et.al (2014) has found that Islamic indices to have the same level of (in)efficiency as their
mainstream indices, and the indices of MSCI and FTSE families turns to be more efficient.
Meanwhile, the authors have found the existence of the long-run diversification benefits, in the

Page 6 of 27
case of Dow Jones and S&P Islamic due to the absence of cointegration. However, in analyzing,
the return performance and leverage effect on the DJI and FTSE, Ahmad and Albaity (2011) have
found no significant differences in the returns of these assets as well as the absence of risk premium
in each index, nonetheless, leverage effect was reported on all the screened indices which
highlights the greater effects of bad news to price volatility compared to the good news. However,
in investigating the performance superiority between Islamic and conventional indices using the
DJI indices, Osamah Al-Khazali et.al (2014), have found that, during the recent global financial
crisis, the Islamic equity indices of DJI to outperform the conventional ones. Meanwhile, in
assessing the DJI indices exposure to the risk of interest rate, Shamsuddin (2014) has found that
the overall Islamic indices portfolio immune to the risks of interest rate compared to the
conventional portfolio of indices. Nevertheless, at the sectorial level the interest rate risk exposure
is quite pronounced. In examining the degree of performance of FTSE Islamic in comparison to
the FTSE All-World index, it has been found that while in the bull period the FTSE Islamic renders
an abnormal returns, it, however, underperforms its counterparts in the bear market period
(Hussen, 2004).
4. Overview of the selected Shariah Indices
In order to assess the recent changes in the shariah screening methodology in Malaysian, we have
taken the FTSE Bursa Malaysia EMAS Shariah index which is solely screened according to the
Malaysian Shariah Advisory council (SAC) screening methodology. The index was launched on
22nd, January 2007, with a base date of 31st, March 2006 and is reviewed semiannually in June and
December. Meanwhile, the FTSE Bursa Malaysia Hijra Shariah index is also under the same index
universe of FTEM and the same base year and review dates but it was launched in the 21st of May
2007. However, it has been formulated to be used as a Shariah compliant investment product that

Page 7 of 27
meets the international investors’ requirements, and it has been screened through both the SAC
and the global Shariah Consultancy, Yassar Ltd. Nevertheless, the FTSE SGX Asia Shariah 100
index was created through the collaporation of the FTSE group and the Singapore Exchange in
order to reflect the performance of the stocks of the companies in the Asian pacific region that
their businesses comply with the Islamic principles of Shariah. The index comprise of the 100
largest companies from Japan, Singapore, Taiwan, Korea and Hong Kong, and it is screened by
the Yassar Ltd. The index was launched on the 20th of February 2006 with the base year of 30th
December 2005, and is reviewed quarterly in March, June, September and December (1).
Furthermore, in addition to the three FTSE Shariah indices, we have included three of the Dow
Jones Islamic indices that were established on the 24th of May 1999 with the base date on 29th of
December, 1995. These three indices are the DJI world emerging markets, DJI Asia / Pacific and
the DJI world developed. The reason we selected these indices is that firstly they are some of the
largely used set of Shariah compliant indices as well as overseen by some of the prominent shariah
scholars with a wealthy of experiences in Shariah and Shariah compliant equity products. In
addition to the stringent screening methodology and the great scholars that oversee the indices,
these indices are broad-market indices intended to measure the global universe of investible
equities at the regional, country, industry and market capitalization under the Dow Jones Islamic
Market World Index (indices, 2015).
1 - FTSE- www.ftserussell.com

Page 8 of 27
5. Data and Methodology
5.1. Data Sources and Description
All the data for this study are sourced from DataStream at the INCEIF terminal. The collected
data is for a family of six indices: three from FTSE and the other three from the Dow Jones
Islamic family indices. The indices of FTSE are FTSE Bursa Malaysia EMAS which was
established on 3rd, April 2006; FTSE Bursa Malaysia Hijra Shariah on 28th, April, 2007 and
FTSE SGX Asia Shariah 100 on 29/12/2000. Meanwhile, the Dow Jones Islamic are the Dow
Jones Islamic World Emerging Markets on 29 /12/ 1995; Dow Jones Islamic Asia/ Pacific on
01/01/1996 and the Dow Jones Islamic World Developed on 01/01/1996. Given into
consideration the requirement of our models, we have collected a daily long time series data
for all the six indices that extends for six years starting from 01/01/2010 to 31/12/2015.
However, for analyzing Markov of switching for FTEM, we have again collected a weekly
data from 01/01/2013 to 31/12/2015 due to the support of the literature. The reason for
analyzing two types of data set is because we are interested into two types of results: first, the
volatility and correlation of FTEM index compared to the other five indices using the
MGARCH-DCC, and the respective regimes of FTEM in the periods during the whole period
and before and after the screening revision which will be analyzed using the Markov Switching
model. To maintain the homogeneity and to avoid the possibility of errors and inconsistencies,
we have taken the indices that are denominated in the United States Dollar. Nonetheless, Table
1 presents the selected indices for this research paper together with their symbols and
definitions.

Page 9 of 27
Table 1. Selected Indices for Research
Symbol Definition
FTEM
FTSE BURSA MALAYSIA EMAS $ -
PRICE INDEX
FTHJ
FTSE BURSA MALAYSIA HIJRAH SHARIAH $ -
PRICE INDEX
FSAS
FTSE SGX ASIA SHARIAH 100 - PRICE
INDEX
DJIE
DJ ISLAMIC WORLD EMERGING MKTS.
- PRICE INDEX
DJID
DJ ISLAMIC WORLD DEVELOPED -
PRICE INDEX
DJIA
DJ ISLAMIC ASIA/PACIFIC -
PRICE INDEX
5.2. Methodology
5.2.1. Multivariate GARCH-Dynamic Conditional Correlation
Globalization and the development in technology in today’s world has made the interaction
between global financial markets to be very fast to the extent that the impacts in one market either
positively or negatively could be transmitted to the other markets in a matter of minutes. Therefore,
understanding of this transmitting of how volatilities and correlations between asset returns change
over time whether positively or negatively is very important for both national and international
investors to diversify their portfolios and hedge themselves against the unfavorable risks. Syed
Faiq et.al (2015) have mentioned that the MGARCH-DCC is the appropriate model because it
enables us to determine the nature of the shocks to the volatilities whether are substitutes or

Page 10 of 27
complements and it pinpoints the changes between the financial variables in the different markets.
However, in this study we employ the Pesaran and Pesaran (2009) MGARCH model as adopted
by (Nazrol Kamil, 2012). Hence the using the Microfit, we compute the conditional cross-asset
correlation as follows:
………………………………………………………………… (1)
Where the qij,t-1 in equation one is given by the next equation 2.
………………………………… (2)
Where �̅�𝑖𝑗 is the (i, j)th unconditional; and Ф1 𝑎𝑛𝑑 Ф2 are parameters in which Ф1 𝑎𝑛𝑑 Ф2 < 1,
and �̅�𝑖,𝑡−1 the standardized indices returns.
In addition to the above mentioned advantages, the DCC approach allows asymmetries and time
variation in both the mean and variance equation2. Meanwhile, we take the assumption based on
the (Pesaran and Pesaran (2009); Chapter 20) that returns are normally distributed and therefore,
consider the t-distribution return. However, the DCC model that captures the dynamics of time
varying conditional correlation г𝑡were reported by (Masih A. M., 2016) as proposed by
Engle(2002) and Tse and Tsui(2002) as in equation (3) below. The DCC model scalar parameters
𝜃1 and 𝜃2 captures the effects of previous shocks and conditional correlations on the current
DCC.
г𝑡 = (1 − 𝜃1 − 𝜃2)г + 𝜃1 ᵑ𝑡−1ᵑ𝑡−1 + 𝜃2г𝑡−1 ………………………………………………………….. (3)
2 - This information has been mentioned and retrieved from SH-Khabir’s Notes, Advanced Econometrics tutorial.

Page 11 of 27
5.2.2. Markov Switching Autoregressive Model
Together with the MGARCH-DCC, in this paper, we employ the Markov of switching
autoregressive model (MSARM) for the FTEM which has recently gone under the new Shariah
screening revision. The reason we incorporated this model is because it is the only model that can
provide us with the accurate information of the stable and volatile regimes together with their
probabilities. Therefore, we use the two-stage MSAR that has been developed by Hamilton (1989)
as (Heriqbaldi, 2012) as depicted bellow in equation (3) and we formulate our univariate model
for FTEM with reference to the latter Univariate model for EMPI as follows in equation (4).
𝑌𝑡 = µ𝑆𝑡 + [∑ 𝛼𝑖(𝑌𝑡−𝑖4𝑖=1 − µ(𝑆𝑡−𝑖)]+ µ𝑡 ……………………………………………………… (4)
Where: 𝜇𝑡/𝑆𝑡 ~ 𝑁𝐼𝐷(0, 𝛿2 ) 𝑎𝑛𝑑 𝑆𝑡 = 1, 2. Hence based on (Heriqbaldi, 2012) the changes
between the regimes occurs in the mean parameter, µ. For reasons of brevity and space, we
excluded the Markovian transition matric P and probability equations that can be found in
(Heriqbaldi, 2012) and we included the equation of the regime switching univariate model of
FTEM as presented below in equation (4) that may confirm the presence of non-linearity in FTEM.
𝐹𝑇𝐸𝑀𝑡 = 𝛼0𝑆𝑡 + ∑ 𝛼𝑖𝐹𝑇𝐸𝑀𝑡−𝑖𝑝𝑖=1 + 휀𝑡 ……………………………………………............. (5)
Where: 휀𝑡 ~ 𝐼𝐼𝐷(0, 𝛿2 (𝑠𝑡 )). In nut shell, the purpose of running the MSARM is to identify both
the stable and volatile regimes of FTEM.
6. Empirical Results Discussions
In this study, the main index is the FTSE Bursa Malaysia EMAS Shariah index returns as the main
principal which represents the overall Malaysian Sariah compliant stock indices returns in the
Malaysian equity market. Meanwhile, all the indices returns were calculated using the logarithmic

Page 12 of 27
daily closing prices by { ln(Pt)-ln(Pt-1)} in which P is the index value. However, as we observe the
in the descriptive statistics Table 2. below, while FTHJ and FTEM have shown the highest standard
deviation respectively, DJIA turned out be the least volatile index of all which is a clear indication
of absolute returns of the returns volatility. With regards to the concentration of data around the
mean of the distribution the Kurtosis result is shown values which are less than 3 which sparingly
indicates a normal distribution and thereby of having low risks. Meanwhile, concerning the
asymmetry property of the data distribution while 3 has negatively skewed the DJIE and DJID
indices have shown a positive Kewness indicating the nonsymmetrical property of high variability
and risk. Moreover, FSAS has revealed a zero result and the Jarque-Bera results did not reported
from the excel analysis descriptive toolkits. Finally, the reported descriptive statistics is of the
original data of the indices as the differenced returns cannot produce the descriptive statistics
because of the negative values.
Table 2. Descriptive Statistics
FTEM FTHJ FSAS DJIE DJID DJIA
Mean 12655.45 13858.37 5428.78 2092.10 1417.53 1438.03
Standard Error 40.11 47.88 12.60 3.89 5.76 2.64
Median 12923.69 13959.14 5437.12 2086.49 1357.36 1440.87
Mode 9134.63 10007.92 5070.97 2098.38 1043.36 1253.10
Standard Deviation 1586.69 1894.08 498.38 153.95 227.81 104.50
Sample Variance 2517570.25 3587551.00 248385.82 23699.95 51899.08 10919.96
Kurtosis -0.52 -0.91 -0.93 -0.23 -1.33 -0.65
Skewness -0.54 -0.28 0.00 0.16 0.12 -0.04
Range 6391.55 7609.73 2228.12 814.42 810.43 525.26
Minimum 8902.98 9620.20 4343.89 1694.44 992.46 1170.62
Maximum 15294.53 17229.93 6572.01 2508.86 1802.89 1695.88

Page 13 of 27
Sum
19805780.8
7
21688342.4
7
8496044.0
8
3274132.7
3
2218428.9
9
2250518.3
2
Count 1565 1565 1565 1565 1565 1565
6.1. MGARCH - DCC Result Discussions
Before we analysis the MGARCH- DCC model, the first step is to compare the Gausian DCC
model and the t-DCC model to identify the relatively more significant model as stated by (Masih
A. M., 2016). Hence, the panel below in (Table 3) summarizes the Gaussian DCC model maximum
likelihood estimates for the returns on the 6 Shariah compliant indices returns as well as the λ1i and
λ2i . Furthermore, the volatility parameters are highly significant and the estimates of λ1i, i = 1, 2,
3,4,5,6 are close to unity which is a good indication of volatility decay. However, the estimated
conditional correlation and volatilities are reported in Table 5. Meanwhile, Table 4.below presents
the results of the t-DCC model maximum likelihood estimates of the Shariah complaint indices
returns. Similar to the Gausian DCC model, the t-DCC model volatility estimates are statistically
significant and near to unity reflecting the gradual decay in the volatility under the t-DCC model.
Table 3. Maximum likelihood estimates of the Gausian DCC Model on daily retuns of stock indices
Parameter Estimate Standard Error T-Ratio [Prob]
lambda1_FTEM 0.87719 0.016494 53.183 [.000]
lambda1_FTHJ 0.89009 0.016228 54.8491 [.000]
lambda1_FSAS 0.88159 0.014272 61.7724 [.000]
lambda1_DJIE 0.83706 0.01732 48.3284 [.000]
lambda1_DJID 0.84214 0.019858 42.4085 [.000]
lambda1_DJIA 0.88833 0.012982 68.4278 [.000]
lambda2_FTEM 0.068809 0.0081105 8.4839 [.000]
lambda2_FTHJ 0.058995 0.0078373 7.5274 [.000]
lambda2_FSAS 0.08082 0.0090503 8.9301 [.000]
lambda2_DJIE 0.11437 0.010483 10.9104 [.000]
lambda2_DJID 0.12348 0.014547 8.4888 [.000]
lambda2_DJIA 0.0772 0.0081278 9.4983 [.000]
delta1 0.92683 0.0068194 135.9119 [.000]
delta2 0.02554 0.0020037 12.746 [.000]
Maximized Log-Likelihood = 35200.7

Page 14 of 27
Meanwhile, the maximized log-likelihood of the t-DCC is 35455.4 compared to the 35200.7 of the
Gausian DCC and its degree of freedom as well is below 30 which clearly suggests that t-DCC as
the appropriate model. Hence, by choosing the t-DCC follow our further discussions by referring
to Table 4. As we can observe from Table 4 all the volatility parameters are highly significant
which shows the gradual decay of the volatilities confirming the elimination of the risks after the
exerted shocks in the market. More importantly, for instance, the summation of the
lambda1_FTEM and lambda2_FTEM (0.87743+0.074018 = 0.951448) and the rest of indices
which are less than unity conveys the information that the volatilities of these indices do not follow
the IGARCH and therefore are not permanent (Masih A. M., 2016). Nevertheless, the implication
of such phenomena is that according to Kabir et.al (2013) as documented by the former, despite
the short run benefits of high profits, in the long-run both investors and fund managers may incur
huge loss besides the speculative attaches which may only be avoided by investing in the Islamic
equities.
Table 4. Maximum likelihood estimates of t-DCC Model on daily retuns of stock indices
Parameter Estimate Standard Error T-Ratio [Prob]
lambda1_FTEM 0.87743 0.019879 44.1377 [.000]
lambda1_FTHJ 0.88436 0.020763 42.5927 [.000]
lambda1_FSAS 0.89487 0.015865 56.4061 [.000]
lambda1_DJIE 0.87562 0.021481 40.7625 [.000]
lambda1_DJID 0.87168 0.020527 42.4654 [.000]
lambda1_DJIA 0.89811 0.015595 57.5903 [.000]
lambda2_FTEM 0.074018 0.010246 7.2242 [.000]
lambda2_FTHJ 0.063357 0.009775 6.4816 [.000]
lambda2_FSAS 0.065142 0.0089926 7.2439 [.000]
lambda2_DJIE 0.079788 0.011754 6.7883 [.000]
lambda2_DJID 0.094945 0.014353 6.6149 [.000]
lambda2_DJIA 0.063834 0.0084226 7.579 [.000]
delta1 0.88807 0.02741 32.3992 [.000]
delta2 0.027472 0.0032265 8.5146 [.000]
df 8.9222 0.63159 14.1265 [.000]
Maximized Log-Likelihood = 35455.4

Page 15 of 27
The on-diagonal results on Table 6 above shows the unconditional volatilities of the indices.
Hence, while the lower unconditional volatilities near the zero implies the least volatility of the
index, on the contrast those near to unity illustrates the higher volatility levels. Nevertheless, for
an easier observation, we have ranked all the 6 indices returns on the following Table 7, which
clearly shows the very low conditional volatilities that range from 0.0089557 to 0.0098782. These
Table 5. Unconditional Correlation and Volatilites
FTEM FTHJ FSAS DJIE DJID DJIA
FTEM 0.0089557 0.96665 0.5757 0.6372 0.318 0.65331
FTHJ 0.96665 0.008896 0.54201 0.6062 0.31136 0.6165
FSAS 0.5757 0.54201 0.0098782 0.69193 0.38863 0.91674
DJIE 0.6372 0.6062 0.69193 0.0098553 0.6517 0.82775
DJID 0.318 0.31136 0.38863 0.6517 0.009092 0.49839
DJIA 0.65331 0.6165 0.91674 0.82775 0.49839 0.0091426
Table 6. Unconditional Correlation and Volatilites
FTEM FTHJ FSAS DJIE DJID DJIA
FTEM 0.0089557 0.96665 0.5757 0.6372 0.318 0.65331
FTHJ 0.96665 0.008896 0.54201 0.6062 0.31136 0.6165
FSAS 0.5757 0.54201 0.0098782 0.69193 0.38863 0.91674
DJIE 0.6372 0.6062 0.69193 0.0098553 0.6517 0.82775
DJID 0.318 0.31136 0.38863 0.6517 0.009092 0.49839
DJIA 0.65331 0.6165 0.91674 0.82775 0.49839 0.0091426
No. Indices Unconditional Volatility
1 FTSE BURSA MALAYSIA EMAS $ - PRICE INDEX 0.0089557
2 FTSE BURSA MALAYSIA HIJRAH SHARIAH $ - PRICE INDEX0.0088958
3 DJ ISLAMIC WORLD DEVELOPED - PRICE INDEX 0.0090921
4 DJ ISLAMIC ASIA/PACIFIC - PRICE INDEX 0.0091426
5 DJ ISLAMIC WORLD EMERGING MKTS. - PRICE INDEX 0.0098553
6 FTSE SGX ASIA SHARIAH 100 - PRICE INDEX 0.0098782
Table 7. Ranks of the unconditional Volatilities of the six Shariah indices returns

Page 16 of 27
low levels are simply reveals the lower volatility of all the shariah indices returns under this study.
Furthermore, we notice that FTSE Bursa Malaysia EMAS is relatively the lowest in terms of
volatility compared to all of the remaining indices returns. This low volatility of FTEM was
attributed to the developed Islamic capital market and the low amount of leverage according to
(Kabir et.al (2013) and (Masih A. M., 2016)). Moreover, this could be due to the impact of the
revised Shariah screening methodology and the good perception of the investors and fund
managers in investing in this index.
However, with regards to the off-diagonal unconditional correlations as shown in Table 6, we
observe that the correlations between FTEM Sariah index returns and FTHJ Bursa Malaysia is
almost highly correlated of 0.96665; followed by FSAS and DJIA of 0.91674 and DJIA and DJIA
of 0.82775. Meanwhile, FTEM has the lowest correlation with DJID of 0.318, and at the same
time DJID is relatively showing the medium correlation associations with all the indices returns
as well. These high positive correlations between the indices returns is reasonable and could be
illustrated as follows: First, in the case of FTEM and FTHJ is due to the incorporation of the FTEM
the 30 constituents of FTHJ index3. Therefore, it is advisable for the Malaysian investors to choose
either of them for the benefit of their portfolio diversification.
Second, for the case of FSAS and DJIA is not a surprise as the FSAS index returns reflects the
Asian Pacific Shariah complaint companies stocks. It is clearly stated in the report of FTSE on the
29th, February, 2016, that from the 100 companies, 50 are of the largest Japanese companies
whereas the other 50 are as well large companies from Singapore, Taiwan, Korea and Hong Kong.
Therefore, such a correlation is expected and therefore either of them is good to be considered for
3 - FTSE Factsheet report, 29th February, 2016.

Page 17 of 27
portfolio diversification and not both. Third, with regards to the low correlation between FTEM
and DJIA, it also makes an economic sense and in agreements with the findings of (Masih A. M.,
2016).
Moreover, the DJID measure components is from the US which is not a major trade partner as the
rest of Asia Pacific. Finally, the medium correlations of DJID with the rest of the indices returns
except FTEM and FTHJ reflects the realities of the economic facts in terms of trade volume and
capital market developments. Therefore, there is good chances of portfolio diversification for
Malaysia investors to invest in the DJID index compared to the rest of the indicators.
Giving our results above, we proceed analyzing the time varying properties in the volatilities and
correlations using the dynamic conditional correlations for the whole period and the period after
the announcement of the revision of the Shariah screening methodology in the case of Malaysia to
investigate whether the newly introduced criteria made the index i.e. FTEM complement or
substitute as well as examine the possibility of the shariah screening methodologies harmonization;
the long debated unsettled issue to both the shariah scholars and Islamic finance practitioners alike.
Figure 1. Conditional Volatilities- FTEM, FTHJ, FSAS, DJIE, DJID, DJIA

Page 18 of 27
Figure 2. Conditional Volatilities- FTEM, FTHJ, FSAS, DJIE, DJID, DJIA
Figure 1 and 2, both tell us the same information, however, we added Figure 2 to identify more
clearly the impact of the newly introduced revision of the Malaysian Shariah screening
methodology. However, the conditional volatilities of the all indices returns move almost
simultaneously with the exception of the years 2010, 2011, 2013 and 2015 and the extremely high
volatility of DJIE in 2013. The reason of the smooth following of the indices returns is due the
arbitrage activities that occurs because of the presence of mispricing between markets and indices
prices as well as due to the emerging markets contingencies. However, major events such those
that had occurred in the above mentioned years shows the persistent high volatility impacts in all
of the indices returns. For instance, the high volatilities in 2010 was due to the Federal Reserve
announcement of QE2 and the European debt crises. However, while the 2011 event might be due
to the incidents of the tsunami and earthquake as mentioned by (Masih A. M., 2016), the 2013
event is the turmoil in the emerging markets that made stocks, bonds and currencies extremely
volatile4. Finally, the 2015 high volatilities on the indices returns could be attributed to the current
oil price crisis. Nonetheless, with regards to FTEM in Figure 2, the volatility patter show the same
4 - Source: http:// money.CNN.com

Page 19 of 27
as the results of the two recent studies that have shown the low volatility of it. Hence, the result of
this paper which includes the period of the revision of the Shariah screening methodology by SAC.
Therefore, though it is true that there is quite marginal volatilities, the change might be huge when
it comes to portfolio diversification.
However, in order to examine the portfolio diversification of these indices returns, we plot the
conditional correlation as in Figure 3 & 4 as shown below. In both Figure 3 &4, the correlations
Figure 3. Conditional Correlations of FTEM with FTHJ, FSAS, DJIE, DJID, DJIA
Figure 4. Conditional Correlations of FTEM with FTHJ, FSAS, DJIE, DJID, DJIA

Page 20 of 27
graphs show the high correlation between FTEM and FTHJ, and the low correlation of DJID, in
addition to close movements of the remaining indices returns which as well confirms and is
consistent with the results of the unconditional correlations in Table 6. Hence, once again, the
effect of the new revision of the shariah screening methodology neither evident in volatilities nor
in correlation. Therefore, we can conclude that what is known as the Shariah risk in Islamic finance
is not of much concern as long as Islamic indices could easily be adjusted to comply with Shariah.
6.2. Markov Switching Result discussions
It is clear that from the analysis of the MGARCH-DCC above, though we have obtained the
information with regards to correlations and volatilities, it is still not known how far and to what
extent FTEM is volatile and stable after the newly introduced Shariah screening methodology.
Therefore, to answer this we run the univaraite Markov switching analysis. Therefore, the period
of the study using this technique could be divide into 2 regimes for which the system can provide
us with the expected probabilities and duration. For our analysis, we consider regime 1 to be the
stable regime where regime 2 to be the volatile regime. Table 8 summarizes the MS model results.
Cofficient Z-Value Prob
C(0) -0.013147 -2.577389 0.0100
C(1) 0.007938 1.921183 0.0547
AR-1 0.032088 0.318082 0.7504
AR-2 -0.064436 -0.671579 0.5019
AR-3 -0.067572 -0.704412 0.4812
AR-4 -0.053634 -0.563683 0.5730
P_{0/0} 4.173984 2.881643 0.0040
P_{0/1} -4.309664 -3.150824 0.0016
Table 8. Regression results: MSFTEM specification
Regime-dependent intercepts
Autoregressive coefficients
Page 21 of 27
According to (Chaker Aloui, 2015) the MSAR model has been used extensively on the financial
markets to capture the regime shift behavior and the time varying correlations between the
financial time series during the different states of markets. Furthermore, as documented in the
same paper, Hamilton and susmel (1994) as well have asserted the appropriateness of the MS
model for the low frequency data weekly or monthly. Thus, for this study, we have used weekly
data to be consistent with the provided theory. Moreover, the determination of the stable and the
volatile regimes is decided based on the mean and variance of the regimes. Hence, regimes with
the higher mean and low variances are the stable ones where the vise versa is the volatile regime.
Nonetheless, from Table 8, based on the means, the first regime C (0) is the volatile regime whereas
the second regime C (1) is the stable regime. Meanwhile, while the positive autoregressive
coefficient estimates indicates the appropriate specification of the autoregressive model in
examining the behavior of the FTEM. Hence, in the results of the model only AR-1 is positive but
not statistically significant.
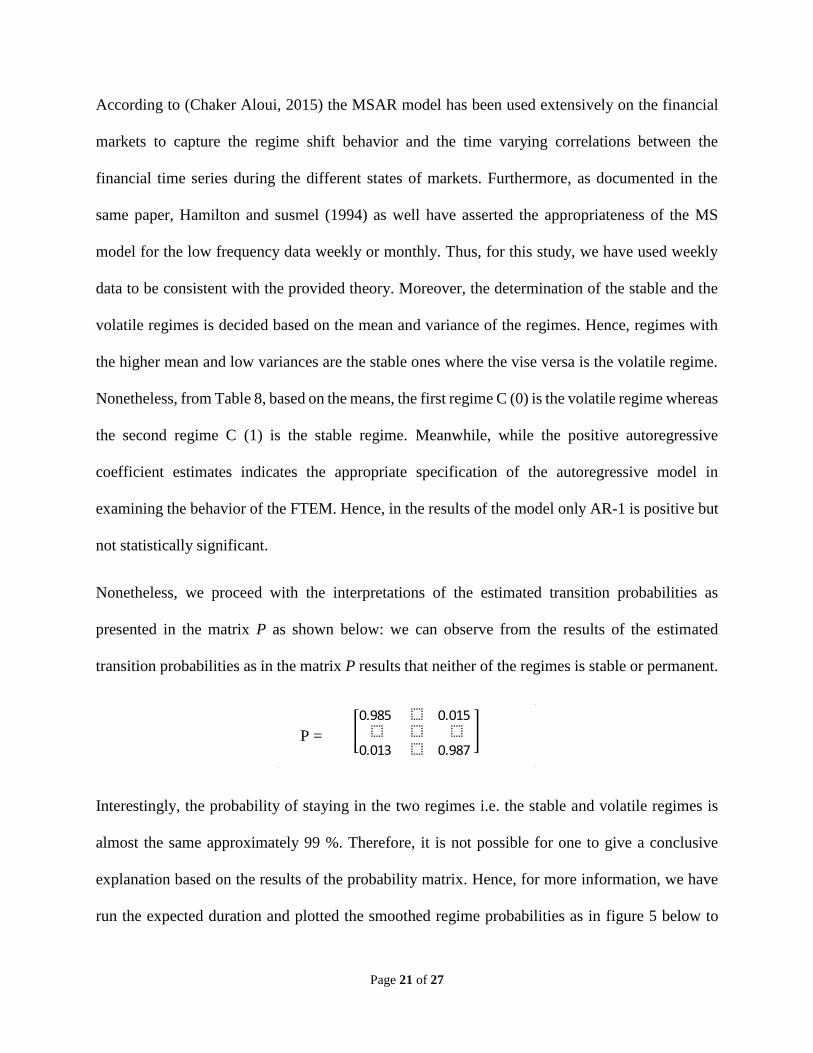
Nonetheless, we proceed with the interpretations of the estimated transition probabilities as
presented in the matrix P as shown below: we can observe from the results of the estimated
transition probabilities as in the matrix P results that neither of the regimes is stable or permanent.
Interestingly, the probability of staying in the two regimes i.e. the stable and volatile regimes is
almost the same approximately 99 %. Therefore, it is not possible for one to give a conclusive
explanation based on the results of the probability matrix. Hence, for more information, we have
run the expected duration and plotted the smoothed regime probabilities as in figure 5 below to
P =
Page 22 of 27
examine further the results of the probabilities and to draw the conclusion on the results.
Surprisingly, the expected duration of the stable regime, i.e. the probability of staying in regime 1
is turns out to be 66 weeks whereas the probability of staying in regime 2 is 75 weeks as it clearly
evident in figure 5.
0.0
0.2
0.4
0.6
0.8
1.0
IV I II III IV I II III IV
2014 2015
P(S(t)= 1) P(S(t)= 2)
Smoothed Regime Probabilities
Figure 5. Smoothed regimes probability graphs.
The expected duration together with the smoothed regime graphs conveys an important
information that the expected duration of the shifts between the stable regime and the volatile
regime is only about 9 weeks. This is intuitive that the shift between the regimes takes 2 months,
and the period of staying in each is quite long, approximately 1 year and 3 months, and 1 and 7
months for regime 1 and 2 respectively. We can also understand from graphs above in Figure 5,
the Shariah risk transmission impacts is not immediate as it is shown in the case of the newly
revised Shariah screening methodology by the Malaysian SAC. Therefore, giving the flexibility in
the investment holding period, investors and fund managers may safely adjust their portfolio
diversification strategies. In this stance, our result is in consistency with the performance report of
Page 23 of 27
the returns of FTEM and FTHJ5 in which the returns FTEM index has been declining compared to
the FTHJ since the announcement of the implementation of the Shariah screening methodology.
7. Conclusions and Policy implications
The purpose of this study is to investigate the impact of the newly introduced revision of the
Shariah screening methodology for the case study of Malaysia from the view point of portfolio
diversification and the persistence of the Shariah risk that originates from the implementation of
the new screening criteria. We have collected daily data from 01/01/2010 to 31/12/ 2015 for 6
indices returns of FTSE Islamic (FTEM, FTHJ & FSAS) and Dow Jones Islamic (DJIE, DJID &
DJIA) as well as a weekly data for FTEM from 05/11/2013 to 22/12/2015, and we employed the
MGARCH-DCC and the Markov switching AR techniques. The findings of this study have shown
on an average a very low benefit of portfolio diversification for the Malaysian investors except for
the DJID. This is due to the regional trade partnership and the contingency among the emerging
capital markets particularly in Asia. Nevertheless, the implementation of the new Shariah
screening methodology so far does not have any significant effect on the risk-returns of FTEM
consistent with the findings of Masih et al (2016). However, the findings of this study may provide
some insights to both the investors and the policy makers. For the investors, they may only consider
investing in DJID due to low correlation but also better consider other Islamic indices to gain better
portfolio diversification. With regards to policy makers it may give an empirical feedback for the
newly implemented criteria which could assist on the decision of harmonization of methodologies.
5 - FTSE group factsheet performance report as of 29th February, 2016.
Page 24 of 27
References
Ahmad, M. A. (2011). Return performance and leverage effect in Islamic and socially
responsible stock indices evidence from Dow Jones (DJ) and Financial Times Stock
Exchange (FTSE). African Journal of Business Management, 5(16), 6927-6939.
Celık, S. (2012). The more contagion effect on emerging markets: The evidence of DCC-
GARCH model. Economic Modelling, 29, 1946-1959.
Chaker Aloui, S. H. (2015). Price discovery and regime shift behaviour in the relationship
between shariah stocks and sukuk: A two-state Markov switching analysis. Pacific-Basin
Finance Journal, 121-135.
Dhankar, M. I. (2014). The flow of Islamic finance and economic growth: An empirical evidence
of Middle East . Journal of Finance and Accounting, 11-19.
El-Qorchi, M. (2005). Islamic Finance Grears Up. Finance & Development, December, 42(4), 1-
7.
Heriqbaldi, U. (2012). Exchange Market Pressure in Idonesia: A Uni Variate Makrov Switching
Analysis. Asian Economic and Financial Review , 603-616.
Hkiri, C. A. (2014). Co-movements of GCC emerging stock markets: New evidence from
wavelet coherence analysis. Economic Modelling, 36, 421-431.
Hussen, K. A. (2004). Ethical Investment: Empirical Evidence from FTSE Islamic Index. Islamic
Economic Studies Vol. 12, No. 1, 21- 40.
indices, S. D. (2015). Dow Jones Islamic Market Indices Methodology. Report , 1-43.
Kabir Sarkar, M. A. (2014). Are Islamic Equity Indices More Efficient Than Their Conventional
Counterparts? Evidence From Major Global Index Families. The Journal of Applied
Business Research, Volume 30, Number 4, 1137-1150.
M. Shabri Abd. Majid, M. M. (2009). Dynamic linkages among ASEAN-5 emerging stock
markets. International Journal of Emerging Markets, Vol. 4 No.2, 160-184.
Majid, R. M. (2006). Who Moves the Malaysian stock Market- The U.S. or Japan? Empirical
Evidence from the pre-, during, and post -1997 Asian Fnancial Crisis . Gadjah Mada
International Journal of Business, Vol.8, No.3 , 367-406.
Masih, A. M.M. and R. Masih (1999). Are Asian stock market fluctuations due mainly to intra-
regional contagion effects? Evidence based on Asian emerging stock markets. Pacific-
Basin Finance Journal 7, 251-282.
Nab, M. S. (2013). Role of Islamic Finance in Promoting Inclusive Economic Development.
Global Sustainable Finance Conference 2013 (pp. 1-39), Karlsruhe-Germany: IRTI and
IDB.

Page 25 of 27
Najeeb, F., Bacha, O. and Masih.M. (2015). Does Heterogeneity in Investment Horizons Affect
Portfolio Diversification? Some insights Using M-GARCH-DCC and Wavelet
Correlation Analysis. Emerging Markets Finance and Trade , 51(1), 188-208.
Nazrol Kamil, O. B. (2012). Do 'Sin Stocks' Deprive Islamic Stock Portfolios of Divesification?
Some Insights from the Use of MGARCH-DCC. Capital Markets Review Vol. 20. No.1
& 2, 1-20.
Nur Hamizah, I. R. (2014). The Comparision of Shariah Screening Methodology for Stocks
Between Malaysia Security Commission Criteria and Dow Jones Method: A critical
Assessment. Conference Paper, 1-13.
Osamah Al-Khazali, H. H. (2014). Do Islamic stock indexes outperform conventional stock
indexes? A stochastic dominance approach. Pacific-Basin Finance Journal 28, 29-46.
Rahim, A. and Masih, M. (2016). Portfolio Diversification benefits of Islamic Investors with
their major trading Partners: Evidence from Malaysia Based on MGARCH-DCC and Wavelet
Approach. Economic Modelling, 54, 425-438.
Shamsuddin, A. (2014). Are Dow Jones Islamic equity indices exposed to interest rate risk?
Economic Modelling 39, 273–281.
Thorsten Beck, s. D.-K. (2012). Islamic vs. conventional banking: Business model, efficiency
and stability. Journal of Banking & Finance, 433-447.

Page 26 of 27