Munich Personal RePEc Archive - mpra.ub.uni … · Our analysis suggests that individualistic...
40
Munich Personal RePEc Archive Historical Prevalence of Infectious Diseases, Cultural Values, and the Origins of Economic Institutions Boris Nikolaev and Raufhon Salahodjaev Baylor University, Westminster International University in Tashkent February 2017 Online at https://mpra.ub.uni-muenchen.de/78435/ MPRA Paper No. 78435, posted 16 April 2017 19:29 UTC
Transcript of Munich Personal RePEc Archive - mpra.ub.uni … · Our analysis suggests that individualistic...

MPRAMunich Personal RePEc Archive
Historical Prevalence of InfectiousDiseases, Cultural Values, and theOrigins of Economic Institutions
Boris Nikolaev and Raufhon Salahodjaev
Baylor University, Westminster International University in Tashkent
February 2017
Online at https://mpra.ub.uni-muenchen.de/78435/MPRA Paper No. 78435, posted 16 April 2017 19:29 UTC

Historical Prevalence of Infectious Diseases,
Cultural Values, and the Origins of Economic
Institutions
Boris Nikolaev ∗
Oxford College of Emory University
Rauf Salahodjaev†
University of South Florida
May 26, 2016
Abstract
It is widely believed that economic institutions such as competitive markets, the banking system,
and the structure of property rights are essential for economic development. But why economic
institutions vary across countries and what are their deep origins is still a question that is widely
debated in the developmental economics literature. In this study, we provide an empirical test for
the provocative hypothesis that the prevalence of infectious diseases influenced the formation of
personality traits, cultural values, and even morality at the regional level (the so called Parasite-
Stress Theory of Values and Sociality), which then shaped economic institutions across countries.
Using the prevalence of pathogens as an instrument for cultural traits such as individualism, we
show in a two-stage least squares analysis that various economic institutions, measured by different
areas of the index of Economic Freedom by the Heritage Foundation, have their deep origins in
the historical prevalence of infectious diseases across countries. Our causal identification strategy
suggests that cultural values affect economic instutituions even after controlling for a number of
confounding variables, geographic controls, and for different sub-samples of countries. We further
show that the results are robust to four alternative measures of economic and political institutions.
Keywords: Economic Freedom, Institutions, Pathogens, Parasite-Stress.
JEL Classification Numbers: I0, J24, I21, I31.
∗Address: 110 Few Circle, Oxford, GA 30054, Phone: 813.401.9756, E-mail:[email protected], Website: www.borisnikolaev.com†E-mail: [email protected]

1 Introduction
What makes some countries rich and others poor? In 1776, Adam Smith (1776), widely
considered the father of modern economic thought, asked this question in his celebrated
book “An Inquiry into the Nature and Causes of the Wealth of Nations.” More than two
hundred years later, this question still remains one of the central topics in the developmental
economics literature.
Smith’s theory of growth inspired much of the earlier neoclassical growth models, which
explained cross-country differences in economic performance in terms of different paths of
factor accumulations (Solow, 1956), preferences (Cass, 1965; Koopmans, 1965), externalities
associated with physical and human capital accumulation (Romer, 1986; Lucas, 1988), or
investment in new technologies (Romer, 1990). Yet, many of these determinants of economic
growth such as innovation, education, or capital accumulation are what most economists
describe as economic growth on the first place (Acemoglu et al., 2005). Thus, more recent
papers have emphasized the importance of institutions as a fundamental explanation for
economic progress (Baumol, 1996; Acemoglu et al., 2005; Dort et al., 2014; Gwartney et al.,
2006)
Institutions, as North (1990) defines them, are “the rules of the game in a society, or,
more formally, ... the humanly devised constraints that shape human interaction.” In that
sense, they “structure incentives in human exchange, whether political, social, or economic.”
Economic institutions such as competitive markets, the banking system, or the structure
of property rights are especially important for economic progress because they determine
the relative rewards from different productive and non-productive economic activities. In
this way, they fundamentally influence how society invests in physical and human capital
as well as technology, and organizes its production.1
Despite the growing body of empirical research that shows that institutions have a strong
influence on economic development, it is by now also clear that high quality institutions
are as much a result of economic development as they are the cause of it, i.e., they are
1Baumol (1996), for example, suggests that the allocation of entrepreneurial talent — e.g., to productiveactivities such as technological innovation or unproductive ones such as rent seeking — is largely determinedby the relative rewards defined by economic institutions.
1

endogenous. Better institutions can explain why some countries are richer than others, but
richer countries are also the type of places where citizens have the resources and voice to
demand better institutions and influence the distribution of political and economic power
(Rodrik, 2004; Acemoglu et al., 2005). But how economic institutions evolved on the first
place and why they vary across countries is still hotly debated in the field of economic growth
and development. Previous theories have explained the variation in economic institutions
with differences in ideology (Piketty, 1999), geography (Levine, 2005), settler mortality
(Acemoglu et al., 2001, 2005), ethnic fractionalization (Easterly and Levine, 1997), legal
origins (La Porta et al., 2000), and social conflict (North, 1981).
In this paper, we offer another possible explanation for the deep origins of economic
institutions – the historical prevalence of infectious diseases. Specifically, we contribute to
the literature by empirically testing the provocative hypothesis that regional variation in
infectious diseases influenced cultural traits such as xenophobia, openness, and ethnocen-
trism, which led to the formation of social values associated with collectivism-individualism
(Fincher et al., 2008), which, in the next stage, shaped economic institutions at the regional
level. In that sense, our theory relies on a causal mechanism that is rooted in evolutionary
theory and is based on a rich literature in psychology and biology that has identified the
instrument a priori (Thornhill and Fincher, 2014).
Our analysis suggests that individualistic values are strongly and positively correlated
with economic freedom. In our 2SLS analysis, we further show that parasitic stress is
strongly and negatively correlated with individualistic values, which, in the next stage, are
a strong determinant of economic freedom and its various sub-areas. These results hold even
when we control for a number of confounding factors such as the current health of nations,
geographic dummies, other cultural values, and for different sub-samples of countries. We
also show that the findings are robust to four alternative measures of institutional and
political institutions including the rule of law, expropriation risk, executive constraints,
and a democracy index.
Thus, this paper contributes to the literature on the determinants of economic institu-
tions in three ways. First, while previous studies use settler mortality as an instrument for
economic institutions, to the best of our knowledge, we are the first to test if the historical
2

prevalence of infectious diseases, which influenced mortality rates, shaped the formation of
economic institutions through the channel of collective cultural values. In this way, our story
enriches previous theories and provides a deeper understanding of the processes that lead to
the formation of different types of economic institutions. Second, we provide evidence for
a number of economic institutions – from the structure of property rights and corruption
to financial and labour freedoms. Finally, we advance the literature methodologically by
suggesting a potential new instrument that can be used to examine the effect of a wide
range of cultural values (e.g., social trust, religiosity, ethnolinguistic fractionalization) on
numerous economic, social, and political outcomes. This is important since many recent
studies document a strong correlation between institutions and cultural values such as social
trust (Berggren and Nilsson, 2013), morality (James, 2015) or attitudes toward fertility and
childbearing (Basso, 2015), to mention a few.
2 The Parasite-Stress Theory of Values
Parasitic (infectious=pathogenic) stress is the most important cause of evolutionary change,
accounting for more evolutionary action across the human genome than any other environ-
mental factor including climate, geography, diet or subsistance strategies (Fumagalli et al.,
2011). In human evolutionary history, infectious diseases were a major source of morbidity
and thus of natural selection (Volk and Atkinson, 2013; Wolfe et al., 2007). There are
two ways in which humans adapted to pathogenic stress. The first one is the physiological
immune system at the cellular level. The second one is the adaptation of the behavioral
immune system, which consisted of changes in psychology and behavior that helped humans
avoid infectious diseases and manage their contagion (Schaller and Duncan, 2007; Fincher
and Thornhill, 2008).2 Examples of adaptation in the behavioral immune system include
adaptive feelings (e.g., disgust), cognition (e.g., worry about contagion), and values about
the behavior towards out-group and in-group members (e.g., prejudice against people who
are perceived unfamiliar, unhealthy, or unclean) (Thornhill and Fincher, 2014).
2A growing body of empirical evidence suggests that selection pressures by pathogens have had aninfluence on the psychology and social behavior of many species, including primates and humans (Mølleret al., 1993; Loehle, 1995).
3

Xenophobia, ethnocentrism, and other specific form of interpersonal prejudice, for in-
stance, appear to be at least to some extent a result from these pathogen-avoidance strate-
gies. One line of evidence comes from lab experiments and suggests that individuals who
perceive themselves to be more exposed to infectious diseases are more likely to develop
traits that are associated with avoidance of outsiders. For example, Faulkner et al. (2004)
provide experimental evidence from a random sample of undergraduate students at the
University of British Columbia and document that participants who are shown slideshows
“that conveyed the ease with which bacteria and germs are transmitted in everyday life”
tend to respond more negatively to questions regarding potential outsiders such as immi-
grants. In a number of experiments, Navarrete and Fessler (2006) furthermore suggest that
ethnocentric attitudes increase as a function of perceived disease vulnerability. In another
experiment, they show that in-group attraction increases as a function of disgust sensitivity,
both when measured as an individual difference variable and when experimentally primed.
Experiments by Park et al. (2007) even suggest that people who are chronically concerned
about pathogen transmission have more negative attitudes toward obese people, with this
effect especially pronounced following a visual exposure to obese individuals.
There is by now convincing evidence that host-parasite arm races were geographically
localized (Fincher et al., 2008). One implication of this phenomenon is that host defense
works most effectively against local parasite genotypes and less so against those evolving in
out-group hosts. Thus, particular forms of social behavior that serve as pathogen-avoidance
strategies, and the psychological mechanisms underlying these behaviors, are likely to char-
acterize not just individual differences, but also cultural populations that have been exposed
historically to greater prevalence of infectious diseases. Prior research, for example, suggest
that cross-country differences in pathogen prevalence successfully predict specific kinds of
cultural differences such as parenting practices (Quinlan, 2007), food preparation (Sherman
and Billing, 1999), marriage structures Low (1990), and mate preferences (Gangestad et al.,
2006).
In this paper, we focus on the multi-faceted value system of individualism and collec-
tivism (I-C) for two reasons. First, previous studies suggest that the I-C dimension is the
most significant driver of cultural differences across societies (Heine and Ruby, 2010; Oy-
4

serman et al., 2002; Markus and Kitayama, 1991). It is also most commonly used in the the
social sciences to describe cross-country cultural differences (Oyserman et al., 2002; Hofstede
and Hofstede, 2001). Second, emerging research in business and economics suggests that,
among a variety of cultural dimensions, the individualism-collectivism dimension, based on
Hofstede and Hofstede (2001) data, is the most important cultural dimension that has the
strongest and most robust and significant effect of culture on long-run economic growth
and innovation (Gorodnichenko and Roland, 2011). Furthermore, the authors argue that
other cultural dimensions , such as power distance, that have significant effect are generally
strongly correlated with individualism and convey similar information. Zheng et al. (2013)
provide further empirical evidence that the I-C cleavege, among others, is the most strongly
correlated cultural dimension with corruption. Studies in cross-cultural psychology sup-
port this observation and suggest that collectivism and conformity mediate the relationship
between pathogens and economic outcomes such as innovation (Murray, 2014).
Although research in this area is still in its infancy, there is intitial evidence that the his-
torical prevalence of infectious diseases predict cross-sectional differences in individualism-
collectivism.The so called parasite-stress theory of values (PSTV), which was first intro-
duced by Thornhill and Fincher (2014), suggests that regions with high prevalence of infec-
tious diseases (parasitic stress) are more likely to favor the natural selection of personality
traits such as xenophobia, ethnocentrism, and, more generally, values that disregard the
rights, liberties, and well-being of out-group members, including those at the lower end of
the socio-economic ladder.3 Societies with high prevalence of infectious diseases would then
be more likely to develop cultural values and ideologies associated with collectivist values
(Fincher et al., 2008) that view negatively ideas that threaten the established social norms
and legitimize authoritarian social outcomes (Thornhill et al., 2009). From an evolution-
ary standpoint, this strategy played an important role to prevent the spread of infectious
diseases.
On the other hand, low parasite stress promotes the development of a value system
associated with tolerance, validity, and trust of out-groups (Fincher et al., 2008). Societies
3Xenophobia, for example, reduces economic transactions between groups and across-regions, and neo-phobia rewards conformity and obedience of traditional values and discourages new ideas. As a consequence,corruption, in-group favoritism, and authoritarianism are more likely social outcomes (Thornhill et al., 2009)
5

Figure 1: Individualism and Historical Prevalence of Infectious Diseases
with low parasite stress develop values that favor inclusiveness and emphasize the rights and
freedoms not only of the ruling majority, but also of those with differences in social class,
religion, or ethnicity. This ideology is associated with openness to new ideas, even if the
ideas come from out-groups. In evolutionary history, this strategy was successful because
it provided benefits by encouraging the free exchange of goods and services, promoting
specialization of labor, and increasing the formation of social alliances for cooperation with
out-groups that promoted the diffusion of new knowledge. Figure 1 shows the strong corre-
lation between the historical prevalence of infectious diseases and individualistic values (r=
- .63; p = 0.000).
As Fincher et al. (2008) argue, there are at least two defining features of collectivism
(versus individualism) that provide logical basis for the PSTV hypothesis. First, collectivist
values make a sharp distinction between in-groups and out-groups while the in- and out-
group distinction is much weaker in individualistic cultures (Fincher et al., 2008; Gelfand
et al., 2004). One consequence is that collectivist are more cautious and anxious when
interacting with out-group members such as foreigners or minorities (Sagiv and Schwartz,
6

1995). Such xenophobic attitudes can help in-group members avoid exposure to novel
pathogens. Second, and equally important, is the distinction these two values systems
place on achievement, conformity, and tolerance for deviance. Collectivism encourages con-
formity and discourages individuals from standing out from the group. Variety of restrictive
social norms undermine individual achievement in favor of solidarity, the status quo, and
traditional order (Oishi et al., 1998; Sagiv and Schwartz, 1995). Many of these specific
social norms such as non-tolerance for deviance serve as a pathogen-avoidance strategy. On
the other hand, more individualism values such as non-conformity and deviance from the
status quo may pose contagion risk to self and others. Overall, collectivist values may serve
as a successful strategy to contain the spread of diseases and prevent from the risks posed
by pathogens.
Previous studies, for example, have successfully linked the prevalence of infectious dis-
eases to individualistic-collectivistic values. Cashdan and Steele (2013), using pathogen
and ethnographic data for 186 cultures, show that societies in areas with rampant levels
of infectious diseases are more likely to socialize children toward collectivist values. van
Leeuwen et al. (2012) show that, using global data, tge historicalprevalence of infectious
diseases robustly predicts cultural practices that belong to collectivist (in-group) foundation
even after controlling for the level of economic development and political regimes. Similarly,
Fincher et al. (2008) show that the regional prevalence of pathogens has a strong positive
correlation with collectivism and negative correlation with individualism. Murray et al.
(2011) present four empirical tests in which they find that the origins of cultural conformity
reflect historical variability in the prevalence of disease-causing pathogens. In a separate
paper, Murray et al. (2013) provide further evidence that parasite prevalence predicts au-
thoritarianism. An indirect evidence for the hypothesis that the prevalence of infectious
diseases is linked to the cultural dimension of individualism-collectivism comes from the
observation that equatorial regions, where infectious diseases tend to be more prevalent
(Guernier et al., 2004), also tend to have more collectivist values than societies at higher
latitudes (Hofstede and Hofstede, 2001).
Our hypothesis, then, is that high parasite stress will be conductive to the development
of cultural values that favor economic institutions that are inconsistent with the principles of
7

economic freedom [e.g., personal choice, voluntary exchange, freedom to enter markets and
compete, and security of privately owned property (Gwartney et al., 2014)]. Low parasite
stress societies, on the other hand, will be more likely to promote the natural selection of
personality traits that favor more inclusive institutions that are characterized by respect
for the rights, liberties, and well-being of all members of society. We demonstrate this
mechanism with a simple schematic below:
(1) High Parasitic (= infectious = pathogenic) stress ⇒
(2) Cultural Values (e.g., xenophobia, ethnocentrism, collectivism) ⇒
(3) Economic Institutions (protection of private property, free markets)
To test our hypothesis, we use a two stage least squares (2SLS) model in which the preva-
lence of infectious diseases is used as a source of regional exogenous variation for cultural
values, which then predict differences in economic institutions across countries. We proxy
cultural values by a multifaceted value system of individualism-collectivism. Collectivism
is characterized by strong values placed on tradition and conformity while individualism is
defined by greater tolerance for deviations from the status quo (Oishi et al., 1998). As a
measure of economic institutions we use the index of Economic Freedom (EF) published
by the Heritage Foundation and its various sub-areas such as rule of law and regulatory
efficiency. Since the index of EF is a complex composite indicator that has ten sub-areas,
we further investigate how different economic institutions are affected by the historical
prevalence of pathogenic stress.
3 Data
In this section, we provide a brief description of the main variables used in this study
and discuss our main data sources. Table 1 provides descriptions, sources, and summary
statistics for the main variables used in this study.
8

3.1 Economic Freedom
The dependent variable of interest is the degree to which a country’s institutions and poli-
cies are consistent with the concept of economic freedom, which is based on the principles
of personal choice, voluntary exchange, freedom to enter markets and compete, and security
of privately owned property. We use the 2014 Index of Economic Freedom (EF) published
by the Wall Street Journal and the Heritage Foundation. EF is measured using 10 quanti-
tative and qualitative factors, which are grouped into four broader categories, or pillars, of
economic freedom: (1) Rule of Law (property rights, freedom from corruption), (2) Limited
Government (fiscal freedom, government spending), (3) Regulatory Efficiency (business free-
dom, labor freedom, monetary freedom), and (4) Open Markets (trade freedom, investment
freedom, financial freedom). Overall, the index of EF measures these 10 different freedoms
in 186 countries. Each one of these areas is rated on a scale of 0-100 that reflects the distri-
bution of the underlying data. A country’s level of economic freedom is then calculated by
averaging these ten economic freedoms, with equal weight given to each freedom. The data
and complete methodology are freely available online at http://www.heritage.org/index/
Figure 2: Historical Prevalence of Infectious Diseases
9

3.2 Historical Prevalence of Infectious Diseases
Our main independent variable is the historical prevalence of infectious diseases from Mur-
ray and Schaller (2010). In their work, the authors create an index that assesses the intensity
of the historical prevalence of disease-causing pathogens for more than 155 countries. The
index is based on the prevalence of nine diseases that are destructive to the human re-
productive health: leishmanias, trypanosomes, leprosy, schistosomes, filariae, tuberculosis,
malaria, dengue, and typhus. In estimating their historical pathogen prevalence index, the
authors use epidemiological maps of infectious diseases before the introduction of modern
medicine that are presented in Simmons et al. (1944). Therefore, Murray and Schaller
(2010) dataset provides robust deep-rooted measures of the historical prevalence of infec-
tious diseases. Previous studies on the relationship between cultural values and economic
growth have used this index as an instrument for the I-C cleavege (Gorodnichenko and
Roland, 2016). A number of studies in biology and evolutionary and cross-cultural psychol-
ogy have also used this variable successfully [for a review, please see Thornhill and Fincher
(2014)].
The pathogen scores for each one of these diseases are then standardized by converting
them to z scores. The composite pathogen prevalence index is estimated as the average of
the individual disease z-scores included in the index. Thus, positive values for each coun-
try indicate above average disease prevalence while negative values denote that pathogen
prevalence is below the mean. The authors show that their index is strongly correlated
with a similar index of disease prevalence by Gangestad and Buss (1993). Although the
index by Gangestad and Buss (1993) is estimated for only 29 countries, the correlation with
the Murray and Schaller (2010) index is 0.87. Fig. 2 shows a heat map of the historical
prevalence of infectious diseases for 155 countries.
3.3 Individualism-Collectivism
Contemporary research on the economic and political consequences of individualism-
collectivism stems largely from Hofstede (1980) who carried out one of the most compre-
hensive studies of how values in the workplace are shaped by culture. In this and follow up
10

work (Hofstede and Hofstede, 2001), Hofstede conducted surveys with more than 100,000
IBM employees worldwide. Based on responses for 14 “work goal” questions, he estimated
national Individualism-Collectivism (IC) scores for approximately 50 nations. He defined
individualistic societies as those ”in which the ties between individuals are loose: everyone
is expected to look after himself or herself and his or her immediate family.” Contrary, col-
lectivism is attributed to “societies in which people from birth onwards are integrated into
strong, cohesive in-groups, which throughout people’s lifetime continue to protect them in
exchange for unquestioning loyalty” (Hofstede et al., 1991, p.51).
Figure 3: Individualism-Collectivism Values
The related literature has successfully linked individualism/collectivism with social cap-
ital (Allik and Realo, 2004), economic development (Ball, 2001) and antecedents of long
run economic growth (Gorodnichenko and Roland, 2011). In this study, we rely on the
most recently updated dataset of IC scores for more than 100 countries from Hofstede et al.
(1991). The IC scores are standardized and rescaled from 0 (most collectivistic) and 100
(most individualistic). Figure 3 shows a heat map for IC scores around the world.
3.4 Other Controls
To address potential omitted variable bias we add a vector of control variables that have
previously been found to be correlated with economic freedom. These additional controls
11

include GDP per capita, legal origins, and various geographical controls (Rodrik, 2004;
Acemoglu et al., 2005; Piketty, 1999; Levine, 2005; La Porta et al., 2000; Easterly, 2007;
Johnson, 1998; Ashby and Sobel, 2008; Nattinger and Hall, 2012). Descriptive statistics are
presented in Table 1.
[Table 1 around here]
4 Empirical Results
In this section we report our empirical estimates. First, we present some descriptive evidence
using ordinary least squares (OLS) models in which we estimate the relationship between
economic institutions and cultural values. Next, we repeat our analysis using a two stage
least squares analysis (2SLS) in which we use pathogens as an instrument for cultural values
of individualism-collectivism at the country level.
4.1 Cultural Values and Economic Institutions: OLS Estimates
We start our analysis by estimating reduced form cross-country OLS equations of the fol-
lowing form:
EFc = µ+ αIndividualismc + Controlsc + εc (1)
where EFc represents the index of EF, Individualismc represents our main variable of
interest, which captures cultural values associated with greater tolerance for deviation from
the status quo and loose family ties where everyone is expected to look after herself or
himself, and εc is a random error term. The coefficient of interest in this section is α, the
effect of individualism on economic freedom.
[Table 2 around here]
The results from this exercise are reported in Table 2. Column (1) presents a parsi-
monious model in which we use individualism as the only regressor for economic freedom
and find a strong positive correlation between the two–more individualistic societies are
12

more likely to have institutions consistent with the principles of economic freedom. Figure
4 shows this relationship for our base sample of 95 countries. The R-squared in the regres-
sion of column 1 suggests that individualism alone explains approximately 22 percent of the
variation in economic freedom. If causal, the estimated coefficient on individualism suggests
that one standard deviation increase in the individualism index is associated with close to
one half standard deviation increase in the index of EF. The results remain unchanged
qualitatively when we add additional controls for legal origins (column 2) latitude (column
3), log of GDP per capita (column 4), and ethnolinguistic fractionalization (column 5). It
is important to note that while the variable on individualism does not change qualitatively,
it drops more than a half when we control for logged GDP per capita. This decrease can
also be observed in our 2SLS analysis later. This quantitative change of the coefficients in
the text show the importance of GDP in explaining the variation in economic institutions.
Since GDP is highly endogenous itself, it can serve as a catch-all variable.
Figure 4: Economic Freedom and Individualism
13

Overall, the results in Table 2 show a strong correlation between cultural values of
individualism and economic institutions. However, these results should not be interpreted
as casual for variety of important reasons. For example, countries with higher level of
economic freedom naturally promote economic and social institutions that emphasize more
individualistic values. In such societies people also have more opportunities to succeed
on their own and it might be more natural for individualistic values to develop. More
importantly, however, there could be many important omitted variables that are correlated
with both individualism and economic freedom. Thus, the analysis introduces a positive
bias which can be solved if we had an instrument for individualism. Such an instrument
should be a strong determinant of cultural values but have no direct effect on economic
institutions.
4.2 Two Stage Least Squares Regressions
In this section, we use the historical prevalence of infectious diseases as an instrument for
cultural values of individualism, which then predict economic freedom in the second stage.
Section 2 provides an overview of the Parasite-Stress Theory of Values, which suggests
that the historical prevalence of infectious diseases can influence economic institutions but
through the channel of cultural values. It is also highly unlikely that the level of economic
freedom today will have an effect on the prevalence of infectious diseases in the past. The
exclusion restriction implied by our instrumental variable estimation is that, conditional
on other controls in our model, the historical prevalence of infectious disease has no effect
on economic institutions today other than its effect through the individualism-collectivism
dimension of cultural values. There are two major concerns here. First, it is possible that
pathogens could be correlated with the current level of health of nations which can have
a direct effect on economic institutions. It is also likely that pathogens may affect other
cultural values which can also influence the development of economic institutions. As we
show later in our analysis, however, even when we control for the current level of the health
of nations and five additional cultural dimensions, individualism is still significantly and
positively correlated with economic institutions. This seems to support the findings of a
number of previous studies described in section 2.
14

Equations (2) and (3) describe the first and second-stages of our model, where Controlsc
is a set of control variables such as legal origins, geography, and log GDP per capita that po-
tentially impact economic institutions, V aluesc is the predicted value for the individualism
index from the first stage estimates.
V aluesc = βPathogensc + Controlsc + εc (2)
∑EFWc = αV aluesc + Controlsc + νc (3)
The 2SLS results are reported in Table 3. In these regressions, individualism is treated
as an endogenous correlate of economic freedom and instrumented with the historical preva-
lence of infectious diseases, which provide exogenous variation for cultural values. Panel
A of Table 3 shows the second stage regression estimates while Panel B provides the first
stage results. In all models we find evidence that supports our hypothesis: pathogens are
significantly and negatively correlated with individualistic values in the first stage, which
then are a strong and significant determinant of economic freedom in the second stage.
[Table 3 around here]
Column (1) shows the results for a bivariate regression where only the instrumented in-
dividualism index is included on the right hand side. As before, individualism is statistically
significantly and positively correlated with economic freedom. If causal, the results suggest
that one standard deviation increase in the individualism index increases overall economic
freedom by close to one standard deviation. Similar to the OLS results in Table 2, we next
add dummy variables for legal origins in column 2. The estimates for the instrumented
individualism index do not change, while majority of the legal origins dummy variables are
statistically insignificant. Columns (3) and (4) further include two important antecedents
of economic institutions to the vector of control variables: latitude and the log of GDP
per capita. The IC index remains statistically significant as well as the pathogens index in
the first stage, which is a strong predictor of individualistic values. Finally, in column (5)
we control for ethnolinguistic fractionalization and find that our results remain unchanged
15

qualitatively.
At the bottom of Table 3, we report the IV F-test statistic for the relevance of the
instruments. In the case of a single instrument and a single endogenous regressor, the
t-value of the instrument should be greater than 3.2, i.e., the rule of thumb is that the
F-statistic of a joint test whether all excluded instruments are significant should be greater
than 10. This is the case in all five models, which provides confidence for the choice of
instrument in our study.
4.3 Decomposing the Index of Economic Freedom
Since the index of Economic Freedom is a complex composite indicator, in this section we
re-estimated our main model from Table 3 (column 4) to examine the effect of individualism
on the main sub-components of the index: property rights, freedom from corruption, fiscal
freedom, business freedom, labor freedom, monetary freedom, trade freedom, investment
freedom and financial freedom. We report these results in Table 4. In most instances,
individualism is strongly and positively correlated with the various economic freedom sub-
areas. The only notable exception is the coefficient on individualism in column 3, which is
negatively correlated with fiscal freedom. This is a puzzling result since more individualistic
societies should, in theory, prefer smaller government. We furthermore find that individual-
ism has the strongest impact on property rights and corruption, which are two institutions
that change slowly over time. Overall, our results are consistent with our findings in the
previous section.
[Table 4 around here]
4.4 Robustness with Additional Controls
Next, in Table 5 we test the robustness of our results by re-estimating our main model (Ta-
ble 3) by including a number of additional and alternative variables in a stepwise fashion.
First, we re-estimate our baseline model from Table 3 by using GDP growth as a proxy
for successful implementation of economic policies instead of the level of GDP (column 1).
Next, we add an additional control for trade openness, which measures the sum of exports
16

and imports of goods and services measured as a share of gross domestic product (column
2). Since recent studies document the interrelationship between democracy, economic in-
stitutions, and growth (Peev and Mueller, 2012), in column 3, we add an additional control
for democracy, which is a simple average of civil rights and political freedoms. In column
4, we add continental/regional dummies for Asia, Europe, Oceania, and North and South
America. In the final column 5, we include all variables from the previous regressions. In all
regressions, individualism remains strongly correlated with the index of economic freedom
and pathogens is negatively and significantly correlated with individualism in the first stage.
[Table 5 around here]
In a similar fashion in Table 6 we add additional controls for life expectancy, share
of the population living in tropics, the prevalence of malaria, and early settler mortality.
All of these variables have previously been found to be correlated with institutions. For
example, Acemoglu et al. (2001) argue that Europeans adopted very different colonization
strategies in different colonies based on differences in settler mortality rates. In places where
Europeans faced high mortality rates, they were more likely to set up extractive institutions.
The two major sources of mortality facing potential settlers were malaria and yellow fever,
which accounted for more than 80 percent of European deaths in the tropics (Curtin, 1989).
The results in Table 6 are consistent with our previous findings. Even after controlling for
early settler mortality and objective health today proxied by life expectancy, individualism
is still positively and strongly correlated with economic freedom. Once we control for all
of these additional controls in the same regression (column 6), however, the coefficient on
individualism loses its significance, but so do the rest of the variables in our model. Here
it is important to note that our sample loses close to two-thirds of its observations. In
addition, as could be expected, early settler mortality is highly correlated with pathogens
(0.72, p=0.000).
[Table 6 around here]
17

4.5 Robustness with Sub-samples
As another robustness test, we re-estimate our main model (Table 3) for different sub-
samples of countries and excluding influential observations. In columns (1) and (2) of
Table 7, we drop 3 countries with the highest and lowest levels of EF. Column (3) reports
the results when we exclude countries with a population of less than 3 million citizens. In
column (4) we remove the countries that are “lying outside” the typical relationship between
individualism and economic freedom: Singapore and Luxembourg. We then re-estimate our
main model by excluding African (column 5), Asian (column 6) and European (column 7)
countries. Again, the results are very similar to our baseline estimates.
[Table 7 around here]
4.6 The Effect of Other Cultural Dimensions
It is likely that the historical prevalence of infectious diseases affected other cultural values,
which then influenced the development of economic institutions. In this case, our IV vari-
able, pathogens, will be correlated with the error term in the second stage of our structural
model and the estimated coefficients will not reflect the true causal effect of individualism.
For example, societies with high level of infectious diseases may be more likely to develop
higher power distance relationships, which could be negatively correlated with economic
institutions.
Therefore, in Table 8, we first use five additional cultural dimensions from Hofstede et al.
(1991)–Power Distance, Masculinity, Uncertainty Avoidance, Long Term Orientation, and
Indulgence–as alternative instruments in our model. The footnote in this table describes
how these variables are measures and what they mean. The results, which are presented in
Table 8, suggest that only the cultural dimension of power distance, which represents the
extent to which less powerful members of society accept and expect power to be distributed
unequally, is significantly and negatively correlated with economic freedom in addition to
individualism. In our sample of countries, however, individualism and power distance are
strongly correlated with each other (-0.79, p=0.000), which suggests that they may be
capturing similar cultural values. For example, in societies with low power distance, people
18

demand justification for inequalities of power. Similarly, individualistic societies reward
personal achievement with higher social status, but such achievements should be earned.
On the other hand, collectivism encourages conformity and discourages individuals from
standing out from the group through variety of restrictive social norms that undermine
individual achievement in favor of group solidarity, the status quo, and traditional order
(Hofstede et al., 1991). In that sense, more collectivist societies embrace more hierarchical
structure in which unequal distribution of power may be justified. This finding is similar to
Gorodnichenko and Roland (2011) who find that the I-C dimension has the strongest and
most robust impact on economic growth while other dimensions such as the power distance
one are likely to be strongly correlated and capture similar values.
Once we control for all five cultural values in the same regression (column 7) and close
these other cultural channels through which pathogens can possibly affect economic institu-
tions, we still find that individualism is positively and statistically significantly correlated
with economic freedom at conventional levels. It is possible, of course, that pathogens may
work through other cultural dimensions which are omitted from the analysis and thus our
IV violates the exclusion restriction. We believe, however, as most previous studies in cross-
cultural psychology do, that the most important cultural dimension in the context of the
PSTV is the I-C one. Future studies are likely to provide further empirical tests for the
validity of our choice of instrument.
[Table 8 around here]
4.7 Alternative Measures of Economic Institutions
As a final robustness check, we use four alternative measures of economic and political in-
stitutions: (1) rule of law index, (2) executive constraints, (3) expropriation risk, and (4)
democracy index. The rule of law index comes from the World Bank Worldwide Governance
Indicators and captures perceptions of the extent to which agents have confidence in and
abide by the rules of society, and in particular the quality of contract enforcement, property
rights, the police, and the courts, as well as the likelihood of crime and violence. The index
ranges from -2.5 (weak) to 2.5 (strong) governance. The executive constraints variable is
19

a measure of the extent of institutionalized constraints on the decision makings powers of
chief executives and takes values from 1 to 7, with higher values indicating greater extent of
institutionalized constraints. This variable was collected from the Polity IV Project. The
expropriation risk index measures the risk of ”outright confiscation and forced nationaliza-
tion” of property. This variable ranges from 0 to 7 with higher numbers indicating higher
probability of expropriation. Finally, the democracy index ranges from 0 to 6, with higher
values indicating a higher degree of institutionalized democracy. The index was created by
the Fraser Institute and the data reflects values for 2013.
In all of our estimations, we find that pathogens are strongly correlated with individual-
istic values, which then predict in an expected way these various measures of economic and
political institutions. For example, higher level of individualism is associated with stronger
legal system and better protection of private property rights, higher levels of executive
constraint, lower risk of expropriation, and higher degree of democracy. These results are
consistent with those in Table 2 and provide further confidence in our findings.
[Table 9 around here]
5 Concluding Remarks
It is by now widely accepted that high quality institutions have a strong and positive
impact on economic development and can explain the large differences in income per capita
across countries. But how economic institutions evolved on the first place and why they
vary across countries is still debated in the developmental economics literature. Previous
studies explain the variation in economic institutions with differences in ideology (Piketty,
1999), geography (Levine, 2005), settler mortality (Acemoglu et al., 2001, 2005), ethnic
fractionalization (Easterly and Levine, 1997), legal origins (La Porta et al., 2000), and
social conflict (North, 1981).
In this paper, we contribute to the literature by empirically testing another possible hy-
pothesis for the deep origins of economic institutions, namely, that the historical prevalence
of infectious diseases influenced cultural traits such as xenophobia, openness, and ethno-
centrism, which then shaped cultural values associated with collectivism (Fincher et al.,
20

2008), which, in turn, led to the development of economic institutions that are inconsistent
with the principles of economic freedom–protection of privately owned property, voluntary
exchange, free trade, etc. Our theory relies on a causal mechanism that is rooted in evolu-
tionary theory and is based on a rich literature in psychology and biology that has identified
the instrument a priori (Thornhill and Fincher, 2014).
Our findings provide suggestive evidence that parasitic stress is strongly correlated with
economic institutions through the channel of cultural values. Specifically, using a 2SLS
analysis we show that the historical prevalence of infectious diseases is strongly and signifi-
cantly correlated with collectivist values, which, in the next stage, are a strong determinant
of economic freedom and its various sub-areas. These results hold even when we control
for a number of confounding factors such as the current health of nations, numerous geo-
graphical controls, other cultural values, and for different sub-samples of countries. They
are also robust to fouralternative measures of economic and political institutions including
the rule of law, expropriation risk, executive constraint, and democracy.
These findings enrich previous theories and provide a deeper understanding of the pro-
cesses that lead to the formation of different types of economic institutions and advance the
literature methodologically by suggesting a potential new instrument that can be used to
examine the effect of a wide range of cultural values (e.g., social trust, religiosity, ethnolin-
guistic fractionalization) on numerous economic, social, and political outcomes.
It is important to note that our findings do not imply that institutions today are pre-
determined by the historical prevalence of infectious diseases alone. Rather, our results
suggest that the prevalence of pathogens is only one of the many factors that could have
shaped the cross-country differences in institutional quality today. Many other studies treat
institutions as a“black box,” i.e., institutions lead to faster economic growth, but how to
improve institutions is not often discussed in the literature. Our study suggests one possible
channel–societies with lower level of pathogenic stress are more likely to promote the natu-
ral selection of personal traits that favor more inclusive institutions that are characterized
by respect for the rights, liberties and well-being of all members of society.
21

6 Bibliography
Acemoglu, Johnson, and Robinson (2001). The colonial origins of comparative development:
An empirical investigation. The American Economic Review, 91(5):1369–1401.
Acemoglu, D., Johnson, S., and Robinson, J. A. (2005). Institutions as a fundamental cause
of long-run growth. Handbook of Economic Growth, 1:385–472.
Allik, J. and Realo, A. (2004). Individualism-collectivism and social capital. Journal of
cross-cultural psychology, 35(1):29–49.
Ashby, N. J. and Sobel, R. S. (2008). Income inequality and economic freedom in the us
states. Public Choice, 134(3-4):329–346.
Ball, R. (2001). Individualism, collectivism, and economic development. The Annals of the
American Academy of Political and Social Science, 573(1):57–84.
Basso, A. (2015). Does democracy foster the fertility transition? Kyklos, 68(4):459–474.
Baumol, W. J. (1996). Entrepreneurship: Productive, unproductive, and destructive. Jour-
nal of Business Venturing, 11(1):3–22.
Berggren, N. and Nilsson, T. (2013). Does economic freedom foster tolerance? Kyklos,
66(2):177–207.
Cashdan, E. and Steele, M. (2013). Pathogen prevalence, group bias, and collectivism in
the standard cross-cultural sample. Human Nature, 24(1):59–75.
Cass, D. (1965). Optimum growth in an aggregative model of capital accumulation. The
Review of Economic Studies, pages 233–240.
Curtin, P. D. (1989). Death by migration: Europe’s encounter with the tropical world in the
nineteenth century. Cambridge University Press.
Dort, T., Meon, P.-G., and Sekkat, K. (2014). Does investment spur growth everywhere?
not where institutions are weak. Kyklos, 67(4):482–505.
22

Easterly, W. (2007). Inequality does cause underdevelopment: Insights from a new instru-
ment. Journal of Development Economics, 84(2):755–776.
Easterly, W. and Levine, R. (1997). Africa’s growth tragedy: policies and ethnic divisions.
The Quarterly Journal of Economics, pages 1203–1250.
Faulkner, J., Schaller, M., Park, J. H., and Duncan, L. A. (2004). Evolved disease-avoidance
mechanisms and contemporary xenophobic attitudes. Group Processes & Intergroup Re-
lations, 7(4):333–353.
Fincher, C. L. and Thornhill, R. (2008). A parasite-driven wedge: infectious diseases may
explain language and other biodiversity. Oikos, 117(9):1289–1297.
Fincher, C. L., Thornhill, R., Murray, D. R., and Schaller, M. (2008). Pathogen prevalence
predicts human cross-cultural variability in individualism/collectivism. Proceedings of the
Royal Society of London B: Biological Sciences, 275(1640):1279–1285.
Fumagalli, M., Sironi, M., Pozzoli, U., Ferrer-Admettla, A., Pattini, L., and Nielsen, R.
(2011). Signatures of environmental genetic adaptation pinpoint pathogens as the main
selective pressure through human evolution. PLoS Genet, 7(11):e1002355.
Gangestad, S. W. and Buss, D. M. (1993). Pathogen prevalence and human mate prefer-
ences. Ethology and sociobiology, 14(2):89–96.
Gangestad, S. W., Haselton, M. G., and Buss, D. M. (2006). Evolutionary foundations of
cultural variation: Evoked culture and mate preferences. Psychological Inquiry, 17(2):75–
95.
Gelfand, M. J., Bhawuk, D. P., Nishii, L. H., and Bechtold, D. J. (2004). Individualism and
collectivism. Culture, leadership, and organizations: The GLOBE study of, 62:437–512.
Gorodnichenko, Y. and Roland, G. (2011). Which dimensions of culture matter for long-run
growth? The American Economic Review, 101(3):492–498.
Gorodnichenko, Y. and Roland, G. (2016). Culture, institutions and the wealth of nations.
Technical report.
23

Guernier, V., Hochberg, M. E., and Guegan, J.-F. (2004). Ecology drives the worldwide
distribution of human diseases. PLoS Biol, 2(6):e141.
Gwartney, J., Lawson, R., and Block, W. (2014). Economic freedom of the world. Cato
Institute.
Gwartney, J. D., Holcombe, R. G., and Lawson, R. A. (2006). Institutions and the impact
of investment on growth. Kyklos, 59(2):255–273.
Heine, S. J. and Ruby, M. B. (2010). Cultural psychology. Wiley Interdisciplinary Reviews:
Cognitive Science, 1(2):254–266.
Hofstede, G. (1980). Culture?s consequences: National differences in thinking and organiz-
ing. Beverly Hills, Calif.: Sage.
Hofstede, G., Hofstede, G. J., and Minkov, M. (1991). Cultures and organizations: Software
of the mind, volume 2. Citeseer.
Hofstede, G. H. and Hofstede, G. (2001). Culture’s consequences: Comparing values, be-
haviors, institutions and organizations across nations. Sage.
Jaggers, K. and Marshall, M. G. (2000). Polity iv project. Center for International Devel-
opment and Conflict Management, University of Maryland, 174.
James, H. S. (2015). Generalized morality, institutions and economic growth, and the
intermediating role of generalized trust. Kyklos, 68(2):165–196.
Johnson, J. P. (1998). Do cultural values explain economic growth? Journal of World
Business, 1(33):4.
Koopmans, T. C. (1965). On the concept of optimal economic growth.
Kyriacou, A. P. (2015). Individualism-collectivism, governance and economic development.
European Journal of Political Economy.
La Porta, R., Lopez-de Silanes, F., Shleifer, A., and Vishny, R. (2000). Investor protection
and corporate governance. Journal of Financial Economics, 58(1):3–27.
24

Levine, R. (2005). Law, endowments, and property rights. Technical report, National
Bureau of Economic Research.
Loehle, C. (1995). Social barriers to pathogen transmission in wild animal populations.
Ecology, pages 326–335.
Low, B. S. (1990). Marriage systems and pathogen stress in human societies. American
Zoologist, 30(2):325–340.
Lucas, R. E. (1988). On the mechanics of economic development. Journal of Monetary
Economics, 22(1):3–42.
Markus, H. R. and Kitayama, S. (1991). Culture and the self: Implications for cognition,
emotion, and motivation. Psychological review, 98(2):224.
Møller, A. P., Dufva, R., and Allander, K. (1993). Parasites and the evolution of host social
behavior. Advances in the Study of Behavior, 22(65102):60405–2.
Murray, D. R. (2014). Direct and indirect implications of pathogen prevalence for
scientific and technological innovation. Journal of Cross-Cultural Psychology, page
0022022114532356.
Murray, D. R. and Schaller, M. (2010). Historical prevalence of infectious diseases within 230
geopolitical regions: A tool for investigating origins of culture. Journal of Cross-Cultural
Psychology, 41(1):99–108.
Murray, D. R., Schaller, M., and Suedfeld, P. (2013). Pathogens and politics: Further
evidence that parasite prevalence predicts authoritarianism. PloS One, 8(5):e62275.
Murray, D. R., Trudeau, R., and Schaller, M. (2011). On the origins of cultural differences
in conformity: Four tests of the pathogen prevalence hypothesis. Personality and Social
Psychology Bulletin, 37(3):318–329.
Nattinger, M. C. and Hall, J. C. (2012). Legal origins and state economic freedom. Journal
of Economics and Economic Education Research, 13(1):25.
25

Navarrete, C. D. and Fessler, D. M. (2006). Disease avoidance and ethnocentrism: The
effects of disease vulnerability and disgust sensitivity on intergroup attitudes. Evolution
and Human Behavior, 27(4):270–282.
Nikolaev, B. and Salahodjaev, R. (2016). Historical prevalence of infectious diseases, cultural
values, and the origins of economic institutions.
North, D. C. (1981). Structure and change in economic history. Norton.
North, D. C. (1990). Institutions, institutional change and economic performance. Cam-
bridge University Press.
Oishi, S., Schimmack, U., Diener, E., and Suh, E. M. (1998). The measurement of values
and individualism-collectivism. Personality and Social Psychology Bulletin, 24(11):1177–
1189.
Oyserman, D., Coon, H. M., and Kemmelmeier, M. (2002). Rethinking individualism and
collectivism: evaluation of theoretical assumptions and meta-analyses. Psychological bul-
letin, 128(1):3.
Park, J. H., Schaller, M., and Crandall, C. S. (2007). Pathogen-avoidance mechanisms and
the stigmatization of obese people. Evolution and Human Behavior, 28(6):410–414.
Peev, E. and Mueller, D. C. (2012). Democracy, economic freedom and growth in transition
economies. Kyklos, 65(3):371–407.
Piketty, T. (1999). The information-aggregation approach to political institutions. European
Economic Review, 43(4):791–800.
Quinlan, R. J. (2007). Human parental effort and environmental risk. Proceedings of the
Royal Society of London B: Biological Sciences, 274(1606):121–125.
Rodrik, D. (2004). Getting institutions right. CESifo DICE Report, 2(2004):2–4.
Romer, P. M. (1986). Increasing returns and long-run growth. The Journal of Political
Economy, pages 1002–1037.
26

Romer, P. M. (1990). Human capital and growth: theory and evidence. In Carnegie-
Rochester Conference Series on Public Policy, volume 32, pages 251–286. Elsevier.
Sagiv, L. and Schwartz, S. H. (1995). Value priorities and readiness for out-group social
contact. Journal of personality and social psychology, 69(3):437.
Schaller, M. and Duncan, L. A. (2007). The behavioral immune system: Its evolution and
social psychological implications. Evolution and the social mind: Evolutionary psychology
and social cognition, pages 293–307.
Sherman, P. W. and Billing, J. (1999). Darwinian gastronomy: Why we use spices spices
taste good because they are good for us. BioScience, 49(6):453–463.
Simmons, J. S., Whayne, T. F., Anderson, G. W., and Horack, H. M. (1944). Global
Epidemiology: pt. 1. India and the Far East.-pt. 2. The Pacific area.-v. 3. The Near and
Middle East, volume 1. JB Lippincott.
Smith, A. (1776). An inquiry into the nature and causes of the wealth of nations. London:
George Routledge and Sons.
Solow, R. M. (1956). A contribution to the theory of economic growth. The Quarterly
Journal of Economics, pages 65–94.
Thornhill, R. and Fincher, C. L. (2014). The parasite-stress theory of values and sociality:
Infectious disease, history and human values worldwide. Springer.
Thornhill, R., Fincher, C. L., and Aran, D. (2009). Parasites, democratization, and the
liberalization of values across contemporary countries. Biological Reviews, 84(1):113–131.
van Leeuwen, F., Park, J. H., Koenig, B. L., and Graham, J. (2012). Regional variation
in pathogen prevalence predicts endorsement of group-focused moral concerns. Evolution
and Human Behavior, 33(5):429–437.
Volk, A. A. and Atkinson, J. A. (2013). Infant and child death in the human environment
of evolutionary adaptation. Evolution and Human Behavior, 34(3):182–192.
27

Wolfe, N. D., Dunavan, C. P., and Diamond, J. (2007). Origins of major human infectious
diseases. Nature, 447(7142):279–283.
Zheng, X., El Ghoul, S., Guedhami, O., and Kwok, C. C. (2013). Collectivism and corrup-
tion in bank lending. Journal of International Business Studies, 44(4):363–390.
28

7 Appendix Table 1: Summary Statistics
Variable Description Source / Year Mean Std. Dev. Min Max Economic freedom Index of economic freedom evaluates countries on broad
dimensions of economic environment over which governments typically exercise policy control. Values range from 0 (least free) to 100 (most free).
Heritage Foundation / 2014 60.70 10.34 29.6 89.6
Property rights Sub index of economic freedom which measures the degree to which a country’s laws protect private property rights and the extent to which those laws are respected.
Heritage Foundation /2014 42.23 24.87 5 95
Freedom from corruption Sub index of economic freedom which measures the extent to which corruption prevails in a country.
Heritage Foundation /2014 42.02 19.64 6.7 91
Fiscal freedom The fiscal freedom component is a composite measure of the burden of taxes that reflects both marginal tax rates and the overall level of taxation, including direct and indirect taxes imposed by all levels of government
Heritage Foundation /2014 77.81 12.03 39.6 99.9
Business freedom Sub index of economic freedom which measures the extent to which the regulatory and infrastructure environments constrain the efficient operation of businesses.
Heritage Foundation / 2014 64.25 15.98 18.2 100
Labor freedom Sub index of economic freedom that takes into account various aspects of the legal and regulatory framework of a country’s labor market.
Heritage Foundation / 2014 61.64 16.41 20 98.5
Monetary freedom Sub index of economic freedom that measures sound monetary policy and price stability.
Heritage Foundation /2014 75.38 7.37 42.8 89.5
Trade freedom Trade freedom is a sub index of economic freedom that measures of the extent of tariff and non-tariff barriers that have impact on bilateral trade.
Heritage Foundation / 2014 75.75 10.79 41.4 90
Investment freedom Sub index of economic freedom that evaluates a variety of regulatory restrictions that typically are imposed on investment.
Heritage Foundation / 2014 55.00 23.94 0 95
Financial freedom Sub index of economic freedom that measures banking system efficiency.
Heritage Foundation / 2014 48.66 19.06 10 90
Individualism Index that measures the degree to which a society accepts and reinforces individualist or collectivist values. The index ranges from 0 (most collectivistic) and 100 (most individualistic)
Hofstede et al. (2010) / 2010 39.17 22.07 6 91

Pathogens Index measuring the historical prevalence of infectious diseases in a particular country. When available the pathogen index is derived from epidemiological maps of infectious diseases before the introduction of modern medicine. Therefore, Murray and Schaller's (2010) dataset provides a robust deep-rooted measure of the historical prevalence of infectious diseases. These epidemiological maps and summaries presented in Simmons et al. (1944).
Murray and Schaller (2010) 0.15 0.66 -1.31 1.17
Legal origins dummies Legal origins dummies for UK, France, Socialist, German, and Scandinavian = 1 if legal origin; 0 otherwise
La Porta et al. (2000) - - 0 1
Latitude Value of the latitude of a country's approximate geodesic centroid
La Porta et al. (2000) 19.06 24.22 -41.81 74.73
GDP per capita (log) GDP per capita, PPP World Bank / 2013 9.19 1.22 6.34 11.81
Ethnic fractionalization Index that captures the probability that two individuals, selected at random from a country's population, will belong to different ethnic groups
Alesina et al. (2003) 0.44 0.26 0 0.93
Economic growth rate, % Growth rate of GDP, % World Bank / 2000-2012 4.06 2.75 -10.05 15.30
Democracy index Index that is measured as average of civil rights and political liberties.
Fraser Institute / 2013 3.67 1.97 0 6
Continental dummies Continental dummies for Africa, Asia, Europe, Oceania, North and South America = 1 if continent; 0 otherwise.
Ashraf & Galor (2013) - - 0 1
Rule of Law Index that captures perceptions of the extent to which agents have confidence in and abide by the rules of society, and in particular the quality of contract enforcement, property rights, the police, and the courts, as well as the likelihood of crime and violence
World Bank Worldwide Governance Indicators/
2015
0 0.99 -2.39 2.12
Executive constraints Index that captures the extent of institutionalized constraints on the decision making powers of chief executives, whether individuals or collectivities.
Polity IV Project / 2015 5.22 1.94 1 7
Expropriation index Index that captures the risks of expropriation, breach of contract by the government, a possible negative change of attitude towards foreign investors, and also risks related to the functioning of the judiciary system. Countries are classified into seven categories: from 1 (low risk) to 7 (high risk)
Credendo Group / 2015 3.57 1.94 1 7

Table 2: OLS Estimates
Dependent Variable: Index of Economic Freedom Variables (1) (2) (3) (4) (5) Individualism 0.215*** 0.179*** 0.179*** 0.092** 0.090**
(0.036) (0.038) (0.046) (0.045) (0.045) Legal origins: Socialist -8.869*** -8.870*** -4.827** -4.463*
(2.156) (2.196) (1.983) (2.252) Legal origins: French -10.181*** -10.176*** -7.232*** -6.653***
(2.090) (2.086) (1.894) (2.090) Legal origins: UK -6.637*** -6.630** -3.579 -2.665
(2.191) (2.755) (2.214) (2.705) Legal origins: Scandinavian -3.789** -3.792** -1.214 -1.428
(1.646) (1.772) (1.697) (1.880) Latitude 0.000 -0.085** -0.088**
(0.057) (0.037) (0.035) Log GDP 5.388*** 5.073***
(1.047) (1.010) Ethno -4.067
(3.806) Constant 55.660*** 64.974*** 64.968*** 15.770* 20.027**
(1.908) (2.366) (2.631) (9.245) (9.173)
Observations 95 95 95 94 94 Adj. R-squared 0.222 0.255 0.247 0.480 0.481 Note: All models are estimated with OLS with robust standard errors (reported in parentheses). See Table 1 for description and sources of variables. “Legal Origins: German” is used as a reference group. *** p<0.01, ** p<0.05, * p<0.1

Table 3: Two Stage Least Squares (2SLS) Estimates
(1) (2) (3) (4) (5) Panel A: 2SLS Results Dependent Variable: Index of Economic Freedom 2014
Individualism 0.364*** 0.364*** 0.407*** 0.219** 0.230**
(0.067) (0.074) (0.088) (0.097) (0.095) Legal origins: Socialist -7.189 -6.559 -4.368 -4.078
(4.707) (4.872) (3.680) (3.710) Legal origins: French -7.055 -8.512* -7.227** -6.741*
(4.586) (4.758) (3.580) (3.641) Legal origins: UK -4.624 -6.688 -4.427 -3.851
(4.486) (4.780) (3.719) (3.845) Legal origins: Scandinavian -6.855 -6.101 -2.63 -2.931
(5.919) (6.082) (4.656) (4.672) Latitude -0.0787 -0.118*** -0.123***
(0.056) (0.046) (0.045) Log GDP 4.450*** 4.096***
(1.157) (1.171) Ethno -3.031
(3.885)
Observations 92 92 92 91 91 IV F-stat 68.88 56.31 42.88 19.92 21.05
Panel B: First Stage Dependent Variable: Individualism Index
Pathogens -22.41*** -23.66*** -21.67*** -19.13*** -19.82***
(2.700) (3.153) (3.309) (4.286) (4.320) Legal origins: Socialist -7.758 -8.338 -6.957 -6.223
(8.419) (8.322) (8.574) (8.581) Legal origins: French -1.817 1.184 1.422 3.127
(8.219) (8.292) (8.335) (8.450) Legal origins: UK 5.167 8.769 9.776 12.09
(8.256) (8.402) (8.477) (8.699) Legal origins: Scandinavian 5.481 3.544 4.338 3.473
(10.570) (10.500) (10.620) (10.620) Latitude 0.154* 0.167* 0.156*
(0.087) (0.092) (0.093) Log GDP 1.845 0.707
(2.410) (2.602) Ethno -10.32
(8.988)
Observations 92 92 92 91 91 R-squared 0.434 0.479 0.498 0.506 0.513 Note: Panel A reports the two-stage least squares estimates with the index of Economic Freedom in 2014. Panel B reports the corresponding first stage. See Table 1 for description and sources of variables. “Legal Origins: German” is used as a reference group. *** p<0.01, ** p<0.05, * p<0.1

Table 4: Decomposing the Index of Economic Freedom
Dependent Variables (Sub-area of the Index of Economic Freedom) Prop Rights Corruption Fiscal Business Labor Monetary Trade Investment Financial
Panel A: 2SLS Results
Individualism 0.698*** 0.559*** -0.257** 0.327** -0.00902 0.140 0.227** 0.647** 0.475**
(0.202) (0.156) (0.122) (0.140) (0.160) (0.0923) (0.103) (0.281) (0.199) Legal origins: Socialist -25.70*** -15.07** 15.03*** -6.270 -0.479 -2.668 6.079 -7.398 -3.815
(7.712) (5.984) (4.670) (5.369) (6.140) (3.534) (3.927) (10.73) (7.593) Legal origins: French -23.44*** -16.90*** 6.614 -10.39** -10.92* -5.375 0.112 -9.228 -7.223
(7.482) (5.793) (4.531) (5.198) (5.944) (3.421) (3.810) (10.41) (7.368) Legal origins: UK -19.75** -14.09** 13.57*** -4.241 5.013 -8.062** -4.408 -16.00 -7.948
(7.794) (6.044) (4.720) (5.423) (6.202) (3.570) (3.969) (10.85) (7.675) Legal origins: Scandinavian -2.893 8.317 -5.934 4.031 -3.880 -1.885 1.315 -6.064 -3.187
(9.756) (7.571) (5.908) (6.793) (7.769) (4.472) (4.968) (13.57) (9.606) Latitude -0.184* -0.202*** 0.0129 -0.0770 -0.172** -0.0821* -0.0721 -0.163 -0.170*
(0.0955) (0.0736) (0.0578) (0.0660) (0.0755) (0.0435) (0.0486) (0.133) (0.0940) Log GDP 9.061*** 7.025*** 1.171 5.506*** 7.253*** 1.831* 3.618*** 4.356 5.751**
(2.424) (1.879) (1.468) (1.686) (1.928) (1.110) (1.234) (3.373) (2.387)
Observations 92 93 92 93 93 93 92 92 92 IV F-stat 20.18 20.59 20.18 20.59 20.59 20.59 20.18 20.18 20.18
Panel B: First Stage Dependent Variable: Individualism Index
Pathogens -19.13*** -19.10*** -19.13*** -19.10*** -19.10*** -19.10*** -19.13*** -19.13*** -19.13***
(4.258) (4.210) (4.258) (4.210) (4.210) (4.210) (4.258) (4.258) (4.258) Controls � � � � � � � � �
Observations 92 93 92 93 93 93 92 92 92 R-squared 0.506 0.507 0.506 0.507 0.507 0.507 0.506 0.506 0.506
Note: Panel A reports the two-stage least squares estimates with the index of Economic Freedom in 2014. Panel B reports the corresponding first stage. See Table 1 for description of variables. “Legal Origins: German” is used as a reference group. *** p<0.01, ** p<0.05, * p<0.1
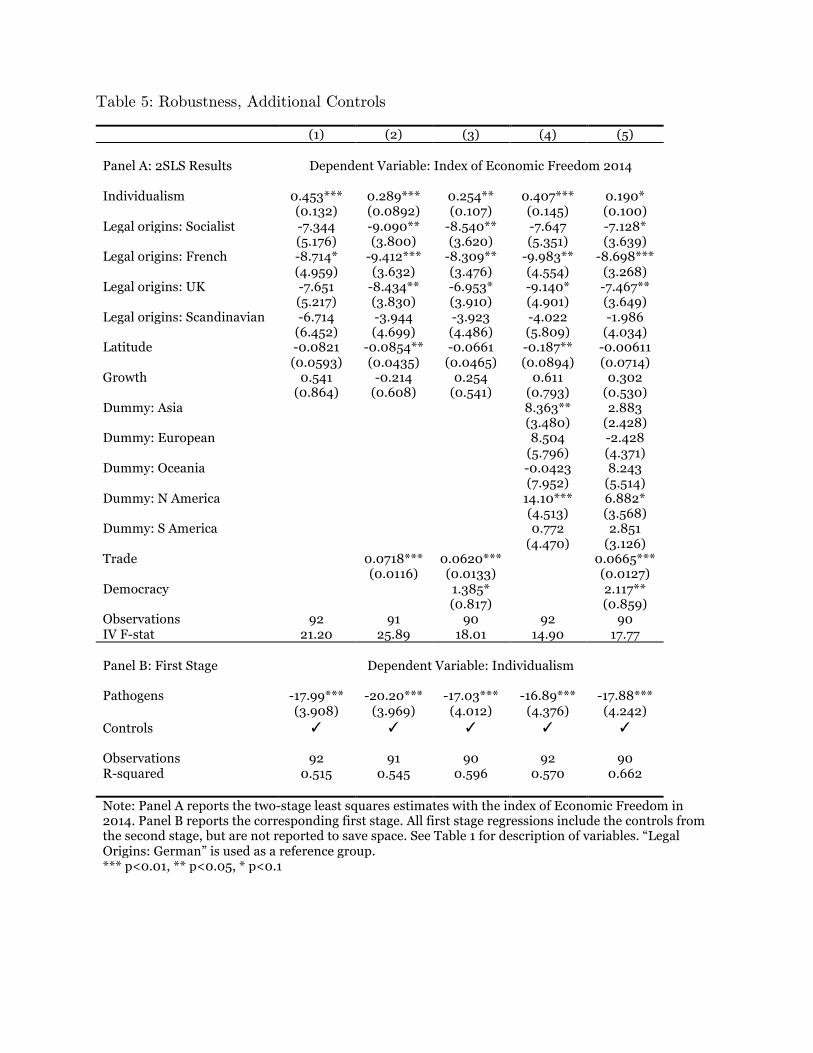
Table 5: Robustness, Additional Controls
(1) (2) (3) (4) (5) Panel A: 2SLS Results Dependent Variable: Index of Economic Freedom 2014
Individualism 0.453*** 0.289*** 0.254** 0.407*** 0.190*
(0.132) (0.0892) (0.107) (0.145) (0.100) Legal origins: Socialist -7.344 -9.090** -8.540** -7.647 -7.128*
(5.176) (3.800) (3.620) (5.351) (3.639) Legal origins: French -8.714* -9.412*** -8.309** -9.983** -8.698***
(4.959) (3.632) (3.476) (4.554) (3.268) Legal origins: UK -7.651 -8.434** -6.953* -9.140* -7.467**
(5.217) (3.830) (3.910) (4.901) (3.649) Legal origins: Scandinavian -6.714 -3.944 -3.923 -4.022 -1.986
(6.452) (4.699) (4.486) (5.809) (4.034) Latitude -0.0821 -0.0854** -0.0661 -0.187** -0.00611
(0.0593) (0.0435) (0.0465) (0.0894) (0.0714) Growth 0.541 -0.214 0.254 0.611 0.302
(0.864) (0.608) (0.541) (0.793) (0.530) Dummy: Asia 8.363** 2.883
(3.480) (2.428) Dummy: European 8.504 -2.428
(5.796) (4.371) Dummy: Oceania -0.0423 8.243
(7.952) (5.514) Dummy: N America 14.10*** 6.882*
(4.513) (3.568) Dummy: S America 0.772 2.851
(4.470) (3.126) Trade 0.0718*** 0.0620*** 0.0665***
(0.0116) (0.0133) (0.0127) Democracy 1.385* 2.117**
(0.817) (0.859) Observations 92 91 90 92 90 IV F-stat 21.20 25.89 18.01 14.90 17.77
Panel B: First Stage Dependent Variable: Individualism
Pathogens -17.99*** -20.20*** -17.03*** -16.89*** -17.88***
(3.908) (3.969) (4.012) (4.376) (4.242) Controls � � � � � Observations 92 91 90 92 90 R-squared 0.515 0.545 0.596 0.570 0.662 Note: Panel A reports the two-stage least squares estimates with the index of Economic Freedom in 2014. Panel B reports the corresponding first stage. All first stage regressions include the controls from the second stage, but are not reported to save space. See Table 1 for description of variables. “Legal Origins: German” is used as a reference group. *** p<0.01, ** p<0.05, * p<0.1

Table 6: Robustness, More Controls
(1) (2) (3) (4) (5) (6) Panel A: 2SLS Results Dependent Variable: Index of Economic Freedom 2014 Individualism 0.294*** 0.623*** 0.337*** 0.398*** 0.534** 1.256 (0.111) (0.213) (0.125) (0.154) (0.260) (1.238) Legal origins: Socialist -5.769 -6.996 -8.710* -5.745 -9.401 -1.868 (4.176) (5.861) (4.681) (4.574) (13.56) (23.62) Legal origins: French -7.933** -9.963* -9.297** -8.513* (3.990) (5.627) (4.517) (4.352) Legal origins: UK -3.684 -10.73* -6.311 -5.557 -2.085 16.93 (4.294) (6.323) (4.719) (4.901) (6.499) (23.79) Legal origins: Scandinavian -3.680 -9.715 -5.191 -5.537 (5.229) (7.677) (6.185) (6.176) Latitude -0.0874* -0.0689 -0.0675 -0.0717 0.0005 0.0055 (0.0477) (0.0655) (0.0512) (0.0485) (0.0934) (0.134) Economic Growth 0.827 0.897 0.806 1.263 1.485 2.277 (0.700) (1.068) (0.919) (0.927) (2.112) (4.133) Life expectancy 0.572*** 0.634*** 0.0431 (0.142) (0.208) (0.877) Share of population in tropics 0.106* 0.0761* 30.43 (0.0576) (0.0425) (33.22) Malaria Prevalence -7.553** 0.878 -0.364 (3.654) (4.945) (14.54) Early settlers mortality -0.00483 -0.00342 (0.00701) (0.0124) Observations 92 92 86 86 40 37 IV F-stat 19.08 11.45 19.68 12.93 8.166 0.769 Panel B: First Stage Dependent variable: Individualism Pathogens -18.36*** -13.57*** -19.43*** -15.84*** -18.41*** -6.958 (4.204) (4.012) (4.379) (4.403) (6.442) (7.936) Controls � � � � � � Observations 92 92 86 86 40 37 R-squared 0.515 0.562 0.558 0.602 0.517 0.660 Note: Panel A reports the two-stage least squares estimates with the index of Economic Freedom in 2014. Panel B reports the corresponding first stage. All first stage regressions include the controls from the second stage, but are not reported to save space. See Table 1 for description of variables. “Legal Origins: German” is used as a reference group. *** p<0.01, ** p<0.05, * p<0.1

Table 7: Robustness, Sub-Samples
(1) (2) (3) (4) (5) (6) (7) Panel A: 2SLS Results Dependent Variable: Index of Economic Freedom 2014
Individualism 0.525*** 0.493*** 0.449*** 0.423*** 0.431*** 0.441*** 0.606**
(0.139) (0.162) (0.151) (0.123) (0.136) (0.106) (0.286) Legal origins: Socialist -7.087 -6.659 -9.834* -7.030 -7.799 -3.260 -16.85
(5.160) (4.805) (5.625) (4.767) (5.302) (5.537) (13.99) Legal origins: French -7.202 -8.820* -8.708* -8.653* -10.10** -4.528 -11.59
(4.962) (4.576) (5.217) (4.607) (5.090) (5.518) (9.745) Legal origins: UK -9.222* -9.742** -8.352 -8.050* -6.841 -6.882 -13.13
(5.252) (4.893) (5.602) (4.810) (5.379) (5.674) (10.47) Legal origins: Scandinavian -6.855 -6.734 -7.157 -6.425 -5.544 -2.945
(6.439) (5.966) (7.152) (5.956) (6.525) (6.175) Latitude -0.136** -0.117 -0.0708 -0.0733 -0.123* -0.0676 -0.0371
(0.0641) (0.0817) (0.0586) (0.0544) (0.0669) (0.0548) (0.0783) Growth 0.788 0.443 0.913 0.268 0.706 0.703 0.637
(0.883) (0.811) (1.207) (0.798) (0.977) (0.806) (1.435)
Observations 89 88 78 90 77 69 59 IV F-stat 18.54 13.65 19.54 20.30 18.33 25.03 6.735
Panel B: First Stage Dependent Variable: Individualism
Pathogens -17.24*** -14.35*** -17.46*** -18.33*** -19.35*** -22.24*** -13.51**
(4.003) (3.885) (3.949) (4.068) (4.520) (4.445) (5.205) Controls � � � � � � �
Observations 89 88 78 90 77 69 59 R-squared 0.516 0.545 0.603 0.511 0.505 0.606 0.306 Excluded Countries
Lowest Economic Freedom
Highest Economic Freedom
Population below 3 million
Outliers: Singapore
&Luxemburg
No Africa
No Asia
No Europe
Note: Panel A reports the two-stage least squares estimates with the index of Economic Freedom in 2014. Panel B reports the corresponding first stage. See Table 1 for description of variables. “Legal Origins: German” is used as a reference group. *** p<0.01, ** p<0.05, * p<0.1

Table 8: Robustness, the Effect of Other Cultural Dimensions (1) (2) (3) (4) (5) (6) (7) Panel A: Second Stage Dependent Variable: Index of Economic Freedom 2014
Individualism 0.230** 0.319*
(0.0946) (0.185) Power Distance -0.291** 0.114
(0.119) (0.150) Masculinity 3.961 -0.128
(14.07) (0.0842) Uncertainty 2.671 -0.0680
(7.212) (0.0564) Long Term -1.151 -0.0144
(1.404) (0.0734) Indulgence 0.602 -0.0413
(0.493) (0.0586)
Controls � � � � � � � Observations 91 91 91 91 76 72 72 IV F-stat 21.05 12.74 0.0729 0.133 0.747 2.118 8.962
Panel B: First Stage Dependent Variable: Individualism
individualism -19.82*** 15.67*** -1.152 -1.708 3.857 -7.921 -14.19***
(4.320) (4.389) (4.264) (4.675) (4.462) (5.444) (4.738)
Controls � � � � � � � Observations 91 91 91 91 76 72 72 R-squared 0.513 0.441 0.308 0.417 0.561 0.439 0.707
Note: Panel A reports the two-stage least squares estimates with the index of Economic Freedom in 2014. Panel B reports the corresponding first stage. See Table 1 for description of variables. “Legal Origins: German” is used as a reference group. All models include the controls from our main specification in Table 3. All cultural variables came from Hofstede (2001). The Power Distance index measures the extent to which the less powerful members of organizations and institutions (in society and the family) accept and expect that power is distributed unequally, with higher values reflecting higher acceptance of inequality in the distribution of power by those below. The Masculinity index reflects dominance of men over women and to the dominance of “male” values such as assertiveness and competitiveness versus norms of caring and modesty. The Uncertainty Avoidance index refers to society's tolerance for uncertainty and the extent to which members of society feel either uncomfortable or comfortable in situations that are novel, unknown, surprising, different from usual. The Long Term Orientation index measures the extent to which societies maintain links with their own past while dealing with the challenges of the present and future. Societies who score low on this index prefer to maintain time-honored traditions and norms while viewing societal changes with suspicion. Finally, the Indulgence index measures the degree to which societies allow free gratification of basic and natural human drives related to enjoying life and having fun, with higher values of this index reflecting more indulgent societies with less restrictive social norms. *** p<0.01, ** p<0.05, * p<0.1

Table 9: Robustness, Alternative Measures of Institutions (1) (2) (3) (4)
Rule of law
Executive
Constraints Expropriation
Risk Democracy
Index Panel A: 2SLS results Individualism 0.0303*** 0.0541*** -0.0450** 0.0744*** (0.00744) (0.0190) (0.0175) (0.0204) Legal origins: Socialist -0.764*** -0.312 -0.181 -0.543 (0.293) (0.708) (0.711) (0.759) Legal origins: French -0.916*** -0.831 0.887 -1.005 (0.287) (0.699) (0.705) (0.744) Legal origins: UK -0.683** -1.524** 0.942 -1.868** (0.303) (0.753) (0.736) (0.808) Legal origins: Scandinavian -0.110 -0.528 0.594 -0.616 (0.369) (0.951) (0.892) (0.958) Latitude -0.00816** -0.0120 0.0177** -0.0234** (0.00356) (0.00868) (0.00838) (0.00934) GDP per capita (log) 0.293*** -0.264 -0.615*** -0.120 (0.0926) (0.234) (0.225) (0.251) Ethno -0.568* 0.331 1.559** -0.340 (0.301) (0.770) (0.735) (0.800) Observations 93 89 87 92 IV F-stat 21.73 19.07 23 19.66 Panel B: First Stage Pathogens -19.80*** -19.06*** -20.66*** -18.95*** (4.248) (4.364) (4.307) (4.273) Controls � � � � Observations 93 89 87 92 R-squared 0.514 0.519 0.520 0.523 Note: Panel A reports the two-stage least squares estimates with the index of Economic Freedom in 2014. Panel B reports the corresponding first stage. All first stage regressions include the controls from the second stage, but are not reported to save space. See Table 1 for description of variables. “Legal Origins: German” is used as a reference group. The rule of law index comes from the World Bank Worldwide Governance Indicators and captures perceptions of the extent to which agents have confidence in and abide by the rules of society, and in particular the quality of contract enforcement, property rights, the police, and the courts, as well as the likelihood of crime and violence. The index ranges from -2.5 (weak) to 2.5 (strong) governance. The executive constraints variable is a measure of the extent of institutionalized constraints on the decision makings powers of chief executives and takes values from 1 to 7, with higher values indicating greater extent of institutionalized constraints. The expropriation risk index measures the risk of "outright confiscation and forced nationalization" of property. This variable ranges from 0 to 7 with higher numbers indicating higher probability of expropriation. Finally, the democracy index ranges from 0 to 6, with higher values indicating a higher degree of institutionalized democracy. *** p<0.01, ** p<0.05, * p<0.1