Munich Personal RePEc Archive - mpra.ub.uni- · PDF fileOhkawa, Masayuki Okawa, Rui Ota, Yuki...
35
Munich Personal RePEc Archive Leapfrogging Cycles in International Competition Yuichi Furukawa Chukyo University June 2012 Online at http://mpra.ub.uni-muenchen.de/56717/ MPRA Paper No. 56717, posted 18. June 2014 00:28 UTC
Transcript of Munich Personal RePEc Archive - mpra.ub.uni- · PDF fileOhkawa, Masayuki Okawa, Rui Ota, Yuki...
MPRAMunich Personal RePEc Archive
Leapfrogging Cycles in InternationalCompetition
Yuichi Furukawa
Chukyo University
June 2012
Online at http://mpra.ub.uni-muenchen.de/56717/MPRA Paper No. 56717, posted 18. June 2014 00:28 UTC
Leapfrogging Cycles in International Competition�
Yuichi Furukaway
Chukyo University
June 2014
Abstract
Technological leadership has shifted at various times from one country to another.We propose a mechanism that explains this perpetual cycle of technological leapfrog-ging in a two-country model including the dynamic optimization of an in�nitely-livedconsumer. In the model, each country accumulates knowledge stock over time becauseof domestic innovation and spillovers from foreign innovation. We show that if the in-ternational knowledge spillovers are reasonably e¢ cient, technological leadership mayshift �rst from one country to another, and then alternate between countries along anequilibrium path.
JEL Classi�cation Numbers: E32; F44; O33Keywords: Perpetual leapfrogging; innovation and growth cycles; endogenous innovation;
knowledge spillovers
�The author acknowledges the hospitality and support of Simon Fraser University, where some of thework in this paper was completed. He would like to thank the two anonymous referees and Timothy Kehoe(Co-Editor) for their helpful suggestions and valuable advice. He is also grateful to Taro Akiyama, GadiBarlevy, Eric Bond, Kenneth Chan, Fumio Dei, Patrick Francois, Takamune Fujii, Sam Gamtessa, TetsugenHaruyama, Jun-ichi Itaya, Ronald Jones, Kozo Kiyota, Takashi Komatsubara, Yoshimasa Komoriya, JiangLi, Yan Ma, Sugata Margit, Junya Masuda, Tsukasa Matsuura, Hiroshi Mukunoki, Takeshi Ogawa, TakaoOhkawa, Masayuki Okawa, Rui Ota, Yuki Saito, Hitoshi Sato, Kenji Sato, Yasuhiro Takarada, Hirokazu Tak-izawa, Yoshihiro Tomaru, Eiichi Tomiura, Makoto Yano, Taiyo Yoshimi, Eden Yu, Ryuhei Wakasugi, andconference/seminar participants at the European Economic Association Annual Congress 2013, the West-ern Economic Association International Paci�c Rim Conference 2013, the Canadian Economics AssociationAnnual Conference 2014, Chukyo University, Chuo University, Kobe University, and Yokohama NationalUniversity for their helpful comments and advice on earlier versions of the paper. The partial �nancialsupport of a Grant-in-Aid for Young Scientists (B) #23730198/26780126 is gratefully acknowledged.
yEmail address: [email protected].
1
1 Introduction
Throughout history, technological leadership has shifted at various times from one countryto another. For instance, during the early 17th century, Venice and Spanish Lombardy wereamong the technologically most advanced regions in Europe (Davids 2008, p. 2). Over thecenturies, the �technological center of gravity of Europe then moved, residing at various timesin Italy, southern Germany, the Netherlands, France, England, and then again in Germany�(Mokyr 1990, p. 207). Some economic historians even claim that the US had begun to loseits technological leadership as early as the early 1990s (Nelson and Wright 1992).An important question is why such economic and technological leapfrogging takes place.
An equally fundamental question is why technological leapfrogging has repeatedly occurred.The �rst question has been investigated in existing literature, in which technological leapfrog-ging is seen as been triggered by major exogenous changes in technology (Brezis, Krugman,and Tsiddon 1993).1 In contrast, the cause of perpetual cycles in technological leapfrogginghas scarcely been studied. While we may regard the perpetual cycles of leapfrogging asresponses to the perpetual exogenous changes in technology, this explanation is essentiallybased on exogenous macro shocks in technology. The present paper o¤ers an alternativeexplanation.This paper develops a theory that explains the perpetual cycle in technological leader-
ship as a market-driven equilibrium phenomenon that is free from exogenous shocks. Forthis purpose, we develop a new growth model that can capture in a tractable manner theprocess by which national technological leadership moves between countries along an equi-librium dynamic path. In doing so, we focus on endogenous innovation and internationalspillovers in a two-country setting with the dynamic optimization of consumption and savingby an in�nitely-lived consumer. As the �rms in a country develop innovations by investingresources, a knowledge stock accumulates in the home country, and this subsequently butonly partially contributes to the accumulation of foreign knowledge because of internationalspillovers through foreign direct investment (FDI).2
By regarding technological leadership as the state whereby a given country develops themost innovations among all countries, we demonstrate that technological leadership by thatcountry may shift to another country and then may alternate perpetually between countries.Speci�cally, we obtain two main results. (a) If the fundamental pro�tability of innovation islow, only the leading country innovates in equilibrium. In this case, leapfrogging never takesplace. (b) If the fundamental pro�tability of innovation is su¢ ciently high, both leading andlagging countries engage in innovation. In this case, technological leadership can shift overtime and will perpetually move back and forth between countries along an equilibrium pathif international knowledge spillovers are reasonably e¢ cient.
1See also Ohyama and Jones (1995), Motta, Thisse, and Cabrales (1997), Brezis and Tsiddon (1998),van de Klundert and Smulders (2001), and Desmet (2002). The present paper essentially di¤ers from thoseanalyses in its focus on perpetual cycles of leapfrogging, thus complementing these works by clarifying theintrinsically cyclical nature of national technological leadership.
2As argued by Brezis (1995), foreign capital plays a role in industrialization and development processes.We may also accept that international capital �ows, as well as imports, are important channels for inter-national knowledge spillovers, as discussed in the literature (Grossman and Helpman 1991; Feenstra 1996).See Branstetter (2006) for recent empirical evidence.
2
What we call the fundamental pro�tability of innovation is a composite of parametersthat positively a¤ects the equilibrium pro�t a �rm earns from an innovation. This compositeparameter completely determines into which case the world economy falls in equilibrium,namely, case (a), wherein only the leader innovates, or case (b), wherein both countries caninnovate. We may think that we have experienced both regimes and transitions from oneto the other. If we use the theory developed in the present paper to explain this, we mayregard such regime transition as the result of an exogenous change in the parameters a¤ectingthe fundamental pro�tability of innovation. The implication is that a lagging country canleapfrog the leading country only when the fundamental pro�tability of innovation is high,which is when the lagging country can innovate in equilibrium.The key driving force behind perpetual leapfrogging is the ability of a country to learn
from foreign innovations. For example, a lagging country may learn much more from for-eign innovations developed in a leading country than the leading country learns from thosedeveloped in the lagging country. Meanwhile, domestic innovations occur and build eachcountry�s knowledge stock. The analysis formally shows that leapfrogging is possible onlywhen both countries innovate, where the lagging country has a dual engine of knowledgegrowth consisting of domestic innovation and foreign innovation di¤used by spillovers. If acountry can learn e¢ ciently from di¤used foreign innovations, technological leadership willperpetually alternate between countries. We can easily elaborate on why both countriesinnovate in equilibrium; the fundamental pro�tability of innovation can be su¢ ciently high,so that innovation pays even for the technologically lagging country. When the fundamen-tal pro�tability is low, however, the lagging country does not innovate but simply receivesspillovers from foreign innovation, resulting in a scenario where no leapfrogging occurs. Thisimplies that the spillovers themselves can, at most, make the lagging country as innovativeas, but not more innovative than, the leading country.In addition to the leapfrogging cycles, leadership in (outward) FDI also shifts between
countries since the technologically leading country is a foreign direct investor country inequilibrium in the model. Such a cycle in FDI, accompanied by leapfrogging cycles intechnology, can be regarded as consistent with the fact that leadership in FDI has continuallyshifted in the real world. For example, the UK was the most active foreign direct investorcountry at the beginning of the 20th century, a role that shifted to the US by the middle ofthe century (Twomey 2000, p. 33, Table 3.2). Regarding an estimate for foreign investmentsincluding portfolios as a proxy of the amount of FDI (given that historical data on FDIs arenot widely available), we can con�rm that such foreign-investment leapfrogging took place byreferring to Obsfeld and Taylor (2004, p. 52�3, Table 2.1). In addition, given that �the �owof capital from Holland to Great Britain, particularly in the second half of the eighteenthcentury, is well documented�(Brezis 1995), we can conjecture that the Netherlands wouldexhibit foreign-investment leadership before the UK. On the basis of these facts, one mightthink that leadership in FDI also �uctuates between countries. It is also worth noting thathistorically, the directions of technological leadership movement may seem similar to thatof foreign-investment leadership movement (e.g., the UK to the US). This is consistent withour theoretical prediction.3
3A time lag can be seen in history, in which the technologically leading country is not necessarily themost active foreign direct investor country in the same period. A formal investigation of such a time lag is
3
The endogenous occurrence of perpetual leapfrogging is not new in the context of pricecompetition between �rms. For instance, the important paper by Giovannetti (2001) con-siders a duopoly in which �rms considering in�nite technological adoption set prices withBertrand competition in the product market. Using this model, Giovannetti identi�es theconditions whereby �rms alternate in adopting the new technology, thereby representing aleapfrogging process. He shows that demand conditions, such as price elasticities, play a rolein determining whether leapfrogging can be perpetual in Bertrand competition. Lee, Kim,and Lim (2011) have provided recent empirical support for this contention. In addition,some studies in the �eld of economic geography address both the theory of and empiricalevidence for technological leapfrogging at the regional level (for example, Quah 1996a, b).4
Di¤erent from the context of price competition, the present paper assumes that �rms aremonopolistically competitive as in the standard endogenous growth model (Romer 1990).Thus, there is no strategic interaction in the process of innovation, FDI, and pricing.5
The present study relates to the literature on innovation and growth cycles. In order tocapture the cyclical growth phenomena in the simplest fashion, we follow Shleifer (1986),Deneckere and Judd (1992), Gale (1996), Francois and Shi (1999), and Matsuyama (1999,2001) by assuming that patents last only for a single period in a discrete time model. Thisassumption implies that a single period is su¢ ciently long, which can be somewhere around20 years. Given that in reality, many innovated consumption goods become obsolete beforetheir patents expire, for the sake of simplicity, we assume that innovations become obsoletewithin a single period (which is fairly long). In line with these studies, which address neitherleapfrogging nor its cycle, we assume the temporary nature of the monopoly enjoyed byinnovators, which plays a role in explaining leapfrogging cycles in the growth process.6
In relation to this, in the present study, we view leapfrogging cycles as a discrete phe-nomenon.7 This is in line with the literature on nonlinear equilibrium dynamics, in whicha discrete-time growth model is commonly used for explaining complicated, real-world cy-cles (Nishimura and Yano 2008). Given that innovations often come in a cluster (Shleifer1986), we believe that the discrete-time model can be a reasonable choice for explaininginnovation-driven cycles such as leapfrogging in our model, although it is also essential toaddress this issue in a continuous-time setting as in Francois and Lloyd-Ellis (2003), whoexplain endogenous growth cycles in a continuous-time model of Schumpeterian growth.8
This study makes an important contribution to the theoretical literature by developinga new growth model with the dynamic optimization of an in�nitely-lived consumer that can
left for future work.4See Athreye and Godley (2009), Giovannetti (2013), and Petrakos, Rodríguez-Pose, and Rovolis (2005)
for more recent research. In the political economy literature, Krusell and Ríos-Rull (1996) provide anendogenous explanation for a long cycle of stagnation and growth, similar to perpetual leapfrogging in thepresent paper, by focusing on vested interests in determining policies. See also Aghion, Harris, Howitt, andVickers (2001) for perpetual leapfrogging at the �rm level.
5See, for example, Hall (2008) and Harrington, Iskhakov, Rust, and Schjerning (2010) for research ondynamic strategic interaction in the competitive process.
6See also Iwaisako and Tanaka (2012) for endogenous cycles in a North�South product-cycle model withoverlapping generations, in which innovation and imitation interact with each other to generate perpetual�uctuations in the world growth rate. However, leapfrogging does not exist in their model.
7See the discussion at the end of Section 3.3 on the use of a discrete-time model. See also footnote 14.8See also Francois and Lloyd-Ellis (2008, 2009, 2013) for related studies.
4

explicitly capture how the (relative) national leadership in cutting-edge technology movesbetween countries over time along an equilibrium path. The beauty of the present model liesin its theoretical tractability and its ability to capture the main insights of the leapfroggingcycles in a simple setup, in which the equilibrium dynamical system is derived from the modelas an autonomous one-dimensional system that allows us to track and explicitly illustrate anentire equilibrium path of national technological leadership between countries for any initialcondition by means of a tractable phase diagram analysis. We achieve this by developinga new growth model that combines four standard elements: endogenous innovation, FDI,knowledge spillovers, and one-period patent length. In addition, the result is also novel tothe existing literature on leapfrogging in demonstrating the intrinsically cyclical nature ofnational technological leadership; in our model, technological leadership perpetually �uctu-ates between countries on an equilibrium path. No research has addressed the equilibriumtrajectory of national technological leadership or demonstrated the existence of perpetualcycles between countries.
2 Model
Time is discrete and extends from �1 to +1. Consider two countries, A and B; whichhave identical preferences and production and R&D technologies, di¤ering only in their initiallevels of innovation productivity. The countries are denoted by i or f (i = A; B; f = A; B),using a superscript for variables pertaining to the production side and a subscript for thosepertaining to the consumption side.There is a continuum of di¤erentiated consumption goods in each period t. Each good
is indexed by j. We follow the research and development (R&D)-based endogenous growthmodel with expanding variety (Romer 1990, Grossman and Helpman 1991) by assuminginnovation as generating new varieties of goods. Given that we later allow for FDI, thecountry where a particular �rm innovates and manufactures may change. Let �i(t) be theset of goods that are innovated in country i in period t, and let �i(t) be the set of goodsmanufactured in country i in period t.
2.1 Consumption
In each country, an in�nitely lived representative consumer inelastically supplies L units oflabor for production and R&D in every period. Note that the two countries are assumed tohave equal labor forces, L. Each consumer is endowed with the same intertemporal utilityfunction
Ui =1Xt=0
�t lnui(t);
where � 2 (0; 1) is the time preference rate. Temporary utility ui(t) is de�ned on the setf�A(t) [ �B(t)g of goods manufactured in both countries (free trade), taking the standardDixit�Stiglitz form:
ui(t) =
�Zj2f�A(t)[�B(t)g
xi(j; t)1��dj
� 11��
; (1)
5
where xi(j; t) is the consumption of good j in country i. Parameter � 2 (0; 1) denotes an in-verse measure of the elasticity of substitution. Let Ei(t) �
Rj2f�A(t)[�B(t)g p(j; t)xi(j; t)dj be
the spending in country i, where p(j; t) denotes the price of good j: Solving the utility maxi-mization problem in (1) leads to the demand function for good j, xi(j; t) = p(j; t)�(1=�)Ei(t)=P (t)
1�(1=�),where P (t) is the price index.9 Aggregating these expressions, we obtain the derived aggre-gate demand, xA(j; t) + xB(j; t) � x(j; t), as
x(j; t) =E(t)p(j; t)�(1=�)
P (t)1�(1=�); (2)
where E(t) = EA(t) + EB(t) is the aggregate spending in period t. The price elasticity ofdemand is constant at ��1 for any j.Solving the dynamic optimization of the consumer�s utility for consumption and saving
decisions under the intertemporal budget constraint results in the usual Euler equationEi(t+ 1)=Ei(t) = �(1 + r(t)), where r(t) is the interest rate in period t. We obtain
E(t+ 1)
E(t)= �(1 + r(t)): (3)
2.2 Innovation, FDI, and manufacture
A single �rm innovates and monopolistically supplies each di¤erentiated consumption good,following the standard endogenous growth framework (Romer 1990).10 Innovating a newgood takes one period. In each period, say t � 1; a �rm in country i can innovate onetechnology to produce a new di¤erentiated good at the end of the period; t� 1; by investing1=Ki(t � 1) � ki(t � 1) units of domestic labor in R&D activity.11 Here Ki(t � 1) denotesthe technology level in innovation for country i in period t � 1; and innovation is achievedentirely via domestic labor resources (no R&D outsourcing). In the subsequent period t; the�rm will set up a production plant. In doing this, the �rm can choose the country in which tomanufacture the good in order to maximize monopolistic pro�ts. In equilibrium, as foreignpro�ts may be greater, the �rm may transfer production to a foreign country through FDI.This is the channel for innovation di¤usion in our model.12
9As is well known, the index is de�ned as P (t) =�R
j2f�A(t)[�B(t)g p(j; t)1�(1=�)dj
� 11�(1=�)
.10As Romer (1990) explains, this simpli�ed setting is only a convenience since �(w)hether the owner of the
patent manufactures the good itself or licenses others to do so, it can extract the same monopoly pro�t.�Onepotential oversimplifying factor here is the lack of explicit and costly adoption of innovation, which shouldbe a limiting factor for the analysis in a broader context. While a complete analysis on costly innovationadoption is beyond the scope of this paper, we can incorporate a process of costly adoption of innovationwithout essentially changing the results by using a very simple setting; see Appendix C (not for publication).11Following the literature (Romer 1990, Matsuyama 1999), we consider a deterministic innovation process
for the sake of simplicity, although without any qualitative change in our results, we can consider a simplestochastic innovation process in which success probability for a �rm to innovate a new good is endogenousand increases with the �rm�s R&D investment (see Appendix C (not for publication)). However, if we assumethat the time for each innovation to be completed was not �xed at one period but was stochastic, the analysisbecomes intractable. We leave the question of how such stochastic timing of innovation impacts leapfroggingfor future research.12In line with the literature on international trade and growth (Lai 1998), we do not distinguish between
the various forms of production transfer, including fully and partly owned subsidiaries and licensing.
6
We assume a simple production technology. There are constant returns to scale in theproduction of any good j and the productivity of labor is the same in both countries, whichis normalized to be one.13 The marginal cost in country i is thus equal to the wage rate incountry i, wi(t). When the �rm chooses to manufacture in country i in period t; capturedby j 2 �i(t); it produces x(j; t) units of good j by using labor in country i: The standardpro�t maximization problem is written as
max(p(j;t); x(j;t))
�(j; t) = p(j; t)x(j; t)� wi(t)x(j; t)
subject to the market demand function (2). Since, by (2), the price elasticity of each goodj is constant at 1=�; the �rm sets a monopolistic price of p(j; t) = wi(t)=(1� �) � pi(t). Bysubstituting this into (2), we obtain the demand and pro�t functions as
x(j; t) =E(t)pi(t)�(1=�)
P (t)1�(1=�)� xi(t) (4)
and
�(j; t) = �E(t)
�pi(t)
P (t)
�1�(1=�)� �i(t) (5)
for j 2 �i(t) (i = A; B). As �rms prefer the country where pro�ts are higher, the discountedpresent value of the �rm innovating in country i in period t� 1 is expressed as
V i(t� 1) = maxf�A(t); �B(t)g1 + r(t� 1) � wi(t� 1) ki(t� 1): (6)
In order to capture cyclical phenomena in the simplest fashion, we follow Shleifer (1986),Deneckere and Judd (1992), Gale (1996), Francois and Shi (1999) and Matsuyama (1999,2001) by assuming that patents last only for one period.14 This assumption implies thatthe length of a unit period is su¢ ciently long, which can be around 20 years, in keepingwith the duration of real-world patents. Given that in reality, many innovated consumptiongoods become obsolete before their patents expire, we may assume that innovations are madeobsolete within a single period (which in our model is fairly long).15 As shown below, this
13Here we simply consider that e¢ ciency in manufacturing normalizes across countries. We can extendthis simple setting by allowing for country-speci�c manufacturing e¢ ciency and endogenous technologicalprogress. In such an extended model, we can easily verify that the comparative advantage between R&Dand manufacturing (rather than the absolute advantage in R&D) plays an important role in perpetualleapfrogging, although there is no fundamental change in the results and their implications for perpetualleapfrogging.14This assumption implies that all patents start and expire at the same time, although in reality patents
overlap. We may deal with this undesirable property by interpreting the length of a period as very long(e.g., 40 years) and dividing each period into subperiods (e.g., two 20-year periods), although we need acontinuous-time model to completely �x this problem. In the present paper, we view leapfrogging as adiscrete-time phenomenon and leave this issue for future work.15This assumption may also be justi�ed if each innovation is interpreted as fairly speci�c. For example,
�innovation� in this model would be represented by the speci�c innovation associated with iPhone 4S orsmartphones instead of cell phones or information technology more generally.
7
assumption makes the analysis tractable without any fundamental change in the results.16
Finally, free entry guarantees that the net value of a �rm is not positive in equilibrium:V i(t� 1) � 0 for each i.
2.3 Knowledge accumulation and spillovers
Technology in innovation Ki(t) advances with knowledge accumulation. Following Romer(1990), we assume intertemporal knowledge spillovers in innovation: current innovationscontribute to the accumulation of the stock of knowledge Ki(t), with which the cost ofinnovation, ki(t) = 1=Ki(t); reduces over time. Here, as is standard, the technology level ininnovation Ki(t) is interpreted as the knowledge stock in innovation.The knowledge stock of a country consists of cumulative innovations of two types: home
and foreign innovations. De�ne
N i(t) �Z�i(t)
dj and M i(t) �Zj2�f (t�1)\�i(t)
dj: (7)
Here, N i(t) denotes the number of innovations developed in country i in period t and M i(t)denotes the number of products that are innovated in period t� 1 in country f (f 6= i) andthen �ow into country i from country f in period t. Following Romer (1990), we assumethat the knowledge stock Ki(t) linearly depends on the sum of domestic innovations that aredeveloped up to the beginning of period t; i.e., N i(t� 1) +N i(t� 2) + � � �; where N i(s) is afamiliar proxy for the �ow of knowledge generated as a by-product of the innovations achievedin period s. We also assume that the international knowledge spillovers as an externalityaccompany FDI, such that each country learns from its foreign innovation in�ows. Hence theknowledge stock of country i also depends on the sum,M i(t�1)+M i(t�2)+���: Accordingly,we describe the knowledge stock using
Ki(t) =tX
s=�1
�N i(s� 1) + �M i(s� 1)
�with � � 1; (8)
where the parameter � 2 [0; 1] captures the e¢ ciency of the contribution of internationalknowledge spillovers through foreign innovation in�ows to knowledge accumulation and thustechnological progress occurs. The e¢ ciency of international knowledge spillovers increaseswith �. If � = 1, spillovers are as e¢ cient as domestic spillovers; if � = 0, there is nolearning at all from foreign innovations. For the sake of explanation, we rewrite (8) as a �owas follows
Ki(t+ 1)�Ki(t) = N i(t) + �M i(t): (9)
Considering (9), one may conjecture that spillovers M i(t) by themselves can cause areversal of Ki(t) > Kf (t): Ki(t + 1) < Kf (t + 1) might hold by taking a su¢ ciently largeM f (t): Leapfrogging may be able to occur simply through spilloverM f (t) from country i to f:However, this conjecture is not the case with the present model because the example (of such
16Note that, in the next subsection, we assume that obsolete innovations stay �alive� in the sense thatthey continue to contribute to the current knowledge stock, although they are not explicitly traded in themarketplace. Whether they are traded or not is not important for our main story explained later.
8
a large M f (t)) is not consistent with (8) and (9) for the following reason. Equation (8) saysthat innovation in country i; N i(t�1); not only contributes to the foreign knowledge; Kf (t+1); through spillovers ofM f (t)(= N i(t�1)) but also increases the domestic knowledge Ki(t)in the previous period. Therefore, it is not possible to arbitrarily take a large M f (t) withKi(t) constant. As M f (t) becomes large, by (8), Ki(t) and Ki(t+1) must also become largeat a higher rate than, or at least the same rate as, Kf (t + 1) does. We cannot arti�ciallymake Ki(t + 1) < Kf (t + 1) by controlling M f (t) only. As we will see later, a su¢ cientnumber of domestic innovations, N f (t); is essential for the reversal of Ki(t) > Kf (t) (i.e.,leapfrogging). In summary, so long as we choose an identical equilibrium path, spilloversM f (t) by themselves cannot cause a reversal of Ki(t) > Kf (t):It is also worth pointing out that in (8) and (9), we assume that knowledge develops
horizontally, rather than vertically. That is, we assume that knowledge accumulates asinnovations are added to old innovations, not as innovations replace old innovations. Underthis horizontal modeling of knowledge accumulation, a country�s knowledge stock can berelated to a collection of �blueprints� for the country, i.e., how many goods the countryknows how to produce. In addition, di¤erent countries innovate along di¤erent lines. Thiscaptures the fact that technologies or products made in di¤erent countries are sometimesat least slightly di¤erentiated. Thus, the knowledge stock of country i can accumulate asforeign innovations (M i(t)) simply add to, rather than replace, domestic innovations (N i(t)).Although the results would become richer if the model also included the replacement oftechnologies or a knowledge stock as a vertical ladder, in this study, we focus on the above-mentioned horizontal aspect of knowledge with (8) and (9), which can help us highlight ourmain point.17
3 Technological Leadership in Equilibrium Dynamics
In this section, we prove the main result that technological leadership may endogenously�uctuate over time, thereby perpetually moving back and forth between countries along anequilibrium path. Before proceeding, we provide a formal de�nition of the concept of tech-nological leadership. Taking into account the notion in economic history (Davids 2008),18
we refer to a country that develops the most innovations among the countries as the techno-logical leader, and to a country that develops few innovations as a lagging country. In thepresent model, and as will be made apparent later, this de�nition implies leadership as thestate whereby a given country has the highest innovation productivity among the countries,which is consistent with the de�nition in existing literature. Thus, in equilibrium, country
17One method for vertically capturing knowledge accumulation within the present setting is to considerobsolescence of knowledge by assuming that knowledge accumulates as innovations partially replace oldinnovations, rather than simply being added to old innovations as in (8). For example, we can introduce arate of knowledge destruction, say � 2 [0; 1]; into (8), with which (9) would be revised to Ki(t+1)�Ki(t) =N i(t) + �M i(t)� �Ki(t): As long as the two countries have identical �; we can demonstrate that our mainresult is robust to this extension. Otherwise, it would be possible to show a result similar to that of thepresent paper in a quality-ladder variant of the present model; see Appendix D (not for publication) for aformal explanation.18Davids (2008) considered that a country that has technological leadership plays an initiating role in the
development of new technologies across a wide variety of �elds.
9
i innovates more if and only if its innovation productivity is higher; N i(t) > N f (t) if andonly if Ki(t) > Kf (t): For simplicity, we use Ki(t) > Kf (t) to designate country i as thetechnological leader, and we refer to any reversal of the leading position as technologicalleapfrogging.Without loss of generality, we assume that country A is the leading country in period
t, KA(t) > KB(t) (and thus NA(t) > NB(t) to be shown in equilibrium), and we refer tothis situation as regime A. If KA(t) < KB(t) (and thus NA(t) < NB(t) to be shown inequilibrium), we refer to it as regime B.In any period, this model can be regarded as a variant of a conventional two-good Ri-
cardian model, where the two outputs considered are innovation and production. GivenKA(t) > KB(t), there are potentially three possible specialization patterns in period t:19
(1) one in which both countries engage in manufacturing and only one country engages inR&D, (2) one in which both countries engage in R&D and only one country engages inmanufacturing, and (3) one in which both countries are specialized. It is useful to de�ne anew variable, N(t) =
Rj2f�A(t)[�B(t)g dj; which is the total number of goods manufactured in
t, satisfying N(t) = NA(t� 1) +NB(t� 1):Let us explain the essential role of FDI in how the economy endogenously falls into
each pattern in the pre-equilibrium process, that is, the process through which the economyreaches equilibrium. Suppose that a wage di¤erential between the countries exists on ano¤-equilibrium path, say wA(t) > wB(t): In lagging country B; wages are lower and thuspro�ts are higher. This gives rise to an arbitrage opportunity; �rms in leading country Asequentially engage in FDI and move to lagging country B for higher pro�ts. This graduallyincreases the labor demand by manufacturing in lagging country B; which in turn generatesa continual increase in the wage rate in lagging country B, wB(t):Three possibilities exist. (1) One possibility is that wB(t) continues to increase until
it is equal to the wage rate in leading country A; wA(t); in which case wages are inter-nationally equated in equilibrium wA(t) = wB(t); whereupon some �rms stay and pro-duce goods in leading country A; while the other �rms shift their production to laggingcountry B: This situation corresponds to pattern (1), in which both countries engage inmanufacturing and R&D investment is always unpro�table for lagging country B becausethe technological gap KA(t) > KB(t) with wA(t) = wB(t) generates an R&D cost gapwA(t)=KA(t) < wB(t)=KB(t): (2) Another possibility is that the wage di¤erential remainswhen all �rms move to lagging country B. In this case, leading country A�s wage rate ishigher even in equilibrium, wA(t) > wB(t): Lagging country B uses this cost advantage toengage in R&D if the technology gap KA(t) > KB(t) is not too large, in which case bothcountries engage in R&D. This represents the specialization pattern (2).20 Finally, in case(3), if the technology gap KA(t) > KB(t) is su¢ cient, the net bene�t of innovation cannotbe positive for lagging country B despite it having the cost advantage, wA(t) > wB(t). Thiscorresponds to the last possibility relating to pattern (3). In what follows, we formally con-�rm those processes by deriving the necessary and su¢ cient conditions for the pattern into
19The model contains no zero-innovation equilibrium because the so-called Inada property is assumed inthe constant elasticity of substitution utility function (1), which is standard in the literature.20Specialization pattern (2) implies that in equilibrium, the technology gap (KA(t)=KB(t)) is exactly
equal to the wage ratio (wA(t)=wB(t)); otherwise, the countries would not be both engaging in R&D.
10
which the economy falls in equilibrium.
3.1 No Leapfrogging
We investigate the specialization pattern (1) where both countries produce goods in equilib-rium. First, we will derive a necessary and su¢ cient condition under which both countriesmanufacture goods in equilibrium. Then, we will demonstrate that leapfrogging can nevertake place in this equilibrium.When both countries produce goods in equilibrium, as explained above, the wage rates
must be equated in equilibrium since any manufacturing �rm would go to either countrythrough FDI if there remains a wage di¤erential. Thus, wA(t) = wB(t) = w(t) must holdin equilibrium for the pattern (1), implying pi(t) = p(t) and thus xi(t) = x(t) by (4).Then, due the technology gap KA(t) > KB(t); the cost for innovation is always lower inleading country A; i.e., w(t)=KA(t) < w(t)=KB(t). As a result, only leading country Ainnovates; �A(t) 6= ; and �B(t) = ;: By (7), we have NA(t) > 0 and NB(t) = 0. ByN(t + 1) = NA(t) + NB(t); we also have N(t + 1) = NA(t): As this situation is similar tothe North�South product-cycle model à la Krugman (1979) and Helpman (1993) where onlythe North innovates and both the North and the South manufacture, we may refer to thispattern as a �North�South regime.�21
Because leading country A innovates in equilibrium, the free-entry condition requiresV A(t) = 0 in equilibrium. By incorporating wA(t) = wB(t) = w(t) into (6), it also requiresV B(t) < 0 in equilibrium. Since pi(t) = p(t); using (5), the discounted present value of aninnovation in country i in (6) can be expressed as
V i(t) =1
1 + r(t)
�E(t+ 1)
N(t+ 1)� wi(t) ki(t): (10)
Substituting into (10) the Euler equation 1+r(t) = E(t+1)= (�E(t)) from (3), the free-entrycondition V A(t) = 0 > V B(t) becomes
��E(t)
N(t+ 1)= w(t) kA(t) < w(t) kB(t): (11)
The �rst equality in (11) ensures that the discounted value of an innovation (��E(t)=NA(t))and the cost (w(t) kA(t)) are balanced in leading country A. The second inequality in (11)simply means that the cost of an innovation is lower in the leading country (w(t)kA(t)) thanin the lagging country B (w(t)kB(t)).The labor market-clearing conditions for country i is given by
L =
Z�i(t)
ki(t)dj +
Z�i(t)
xi(t)dj: (12)
21Here, we assume that the North is a country that innovates; however, if the North (the South) was de�nedas a country where the wage rate is higher (lower) as is also usual in the literature, these North/South labelscould be misleading. Nevertheless, we use these labels because we can easily control the international wagedi¤erential in the present model by incorporating into the model an international di¤erential in manufacturingproductivity.
11

The quantity of a good, xi(t); can be derived from (4) and (7) as xi(t) = (1��)E(t)= (w(t)N(t))for each i: Together with this, by eliminating the country index i from (12),22 we can obtainthe world labor constraint as
2L = NA(t) kA(t) + (1� �)E(t)
w(t); (13)
in which �B(t) = ; is used. The left-hand side in (13) is the world supply of labor, and theright-hand side is the world demand for labor from both the innovation sector in leadingcountry A and the manufacturing sectors in both countries.In order to determine the equilibrium �ow of innovation made in period t; we will elim-
inate the term E(t)=w(t) from the world labor market-clearing condition (13), using thefree-entry condition (11). Then, noting kA(t) = 1=KA(t) and N(t+ 1) = NA(t), the �ow ofinnovation in period t is derived as
NA(t) = KA(t)2L�
1 + �and NB(t) = 0; (14)
where � is a composite of the parameters � and �: The formal de�nition of � is given by
� � ��
1� �: (15)
The parameter � captures the discounted present value of a markup ratio (i.e., the ratio ofprice to marginal cost) for the �rm,23 which increases with time preference � and decreaseswith the elasticity of substitution ��1:24 Since parameter � positively a¤ects equilibriumpro�ts from innovating a good, we refer to it as an innovation�s fundamental pro�tability.Note that the equilibrium pro�t itself is endogenously determined with other endogenousvariables, and it changes over time, although fundamental pro�tability� is exogenously givenby (15). Equation (14) shows that the innovation �ow NA(t) increases with the knowledgestock KA(t) and an innovation�s pro�tability.Now, we can derive the number of goods that are manufactured in each country. Noting
(12) with �B(t) = 0; we have L =R�B(t)
xB(t)dj: Then, by (11) and (14), we obtain�Z�A(t)
dj
�=1��2
N(t) and�Z
�B(t)
dj
�=1 + �
2N(t): (16)
To ensure that leading country A manufactures goods in equilibrium, i.e.,R�A(t)
dj > 0; itmust hold that
� < 1: (17)
The parameter condition (17) is more likely to hold when the time preference � is smallerand the price elasticity of substitution ��1 is higher. The condition (17) can be shown asnecessary and su¢ cient for an economy to fall within the North�South regime.22We do this by summing both sides of (12) over i:23Note that the constant elasticity of substitution ��1 is equal to the price elasticity of each good j; which
determines the markup ratio as 1=(1� �).24Li (2001) argues that the evidence regarding whether there is any conventional value or a range of values
for the elasticity of substitution is inconclusive. For example, Broda and Weinstein (2006) show that theelasticity of substitution is, on average, greater than two, but tends to decline over time and is actually lessthan two in some sectors (e.g., motor vehicles).
12

Lemma 1 The economy falls in the North�South regime if and only if � < 1; in which bothcountries produce goods and only the leading country innovates.
Proof. See Appendix A.Why do both countries manufacture for � < 1? In other words, why are the equilibrium
wages internationally equated for � < 1? Recall the essential role of FDI explained at thebeginning of this section. An international wage di¤erential such as wA(t) > wB(t) couldexist, because the only source of an international wage di¤erential in the model is leadingcountry A�s advantage in R&D productivity, KA(t) > KB(t): As long as wA(t) > wB(t); a�rm in leading country A engages in FDI to shift their production to lower-wage country B;which tightens labor resource scarcity in country B: As a result, the wage rate in laggingcountry B; wB(t); gradually rises as the economy reaches equilibrium. Lemma 1 impliesthat when the fundamental pro�tability of innovation � is small (i.e., � < 1), the potentialfor an international wage gap is also small,25 and international wages can become equatedat the point in time at which some (not all) �rms in leading country A move to laggingcountry B through FDI. Ultimately, both countries manufacture, and only leading countryA innovates, as wA(t) = wB(t) naturally creates an R&D cost advantage for leader A; suchas wA(t)=KA(t) < wB(t)=KB(t):Thus far, we have three important conditions. Inequality (17) is the necessary and su¢ -
cient condition for an economy to fall within the North�South regime in equilibrium, underwhich both countries produce goods and only the leading country innovates in equilibrium.Equations (14) and (16) determine the innovation �ow and the fractions of manufacturedgoods, respectively, in the North�South regime.In what follows, we demonstrate that in the North�South regime, leapfrogging never
occurs even if spillovers are completely e¢ cient (� = 1). By (14) and (9), the growth ofknowledge can be expressed as follows:
KA(t+ 1) =
�2L�
1 + �+ 1
�KA(t) (18)
andKB(t+ 1) = �MB(t) +KB(t); (19)
where MB(t) =R�B(t)
dj = (1 + �)N(t)=2 by (16).As KA(t) is given by history, (18) fully determines the growth of knowledge in leading
country A. Apparently, (19) does not determine KB(t+ 1) without additional historical as-sumptions because the amount of spilloversMB(t) = (1 + �)N(t)=2 depends on the numberof goods N(t) = NA(t� 1)+NB(t� 1); which is determined by innovation activities under-taken in the previous period, t�1. Nevertheless, as shown in our �rst theorem, regardless ofpast innovation activities, N i(s) for s � t� 1, leapfrogging never occurs in the North�Southregime.
25It is important to elaborate why the potential for an international wage di¤erential is larger when �is larger. Given that the countries are identical except for Ki(t); the productivity gap in R&D (KA(t) >KB(t)) is the only source for an international wage di¤erential in our model. Thus, the potential fora wage di¤erential is is enhanced by a larger share of R&D investment, which naturally increases withthe fundamental pro�tability of innovation �: The larger the value of �; the larger the potential for aninternational wage di¤erential.
13
Theorem 1 (No leapfrogging with lower pro�tability) Suppose that the fundamentalpro�tability of an innovation � falls below 1: Then, under the in�nitely lived agent�s dynamicoptimization, only the leading country innovates in equilibrium (the North-South regime). Inthis case, leapfrogging never takes place.
Proof. By Lemma 1, the parameter restriction � < 1 ensures that only the leading countryinnovates. By (16), MB(t) = (1 + �)N(t)=2: (a) Assume KA(t � 1) > KB(t � 1): By theexpression of NA(t� 1) in (14), with KA(t� 1) = NA(t� 1) +KA(t) from (9), substitutingN(t) = NA(t� 1) into (19) derives
KB(t+ 1) = KA(t)�L�(1 + �)
(2L+ 1)� + 1+KB(t): (20)
From (18) and (20), we can show thatKA(t+1) > KB(t+1) holds so long asKA(t) > KB(t);noting � < 1 and � < 1: (b) Assume KA(t � 1) < KB(t � 1): By symmetry, notingN(t) = NB(t� 1), the analogous procedures derive
KB(t+ 1) =
��L�(1 + �)
(2L+ 1)� + 1+ 1
�KB(t): (21)
From (18) and (21), KA(t + 1) > KB(t + 1) holds so long as KA(t) > KB(t); given � < 1and � < 1: This proves that KA(t) > KB(t) cannot be reversed for the subsequent periodwhen � < 1; regardless of whether either country was a leader in the previous period t� 1:
We now elaborate upon the theories of why economies with lower fundamental pro�tabil-ity of innovation cannot experience leapfrogging. Leapfrogging can stem from two sources:knowledge growth from domestic innovation and spillovers from foreign innovation. In thisregime, however, the lagging country (country B) only receives spillovers from MB(t); theforeign innovations developed in the leading country (country A). No domestic innovationsare produced in the lagging country. Given that the leading country also gains from in-novations MB(t) (which are included in KA(t)) even more e¢ ciently than, or at least ase¢ ciently as, the lagging country, the spillovers alone can only make the lagging country asinnovative as, but not more innovative than, the leading country. Thus, leapfrogging neveroccurs. As shown later, leapfrogging is possible only if the lagging country not only receivesspillovers from the leading country but also innovates by itself.Why does only the leading country innovate when the fundamental pro�tability is low
such that � < 1? We have already answered this question formally in this section; thus, itnow su¢ ces to provide an intuitive explanation. Since � = ��= (1� �) ; lower � is associatedwith lower � and higher ��1: A lower time preference � results in a higher interest rate r(t);which decreases the discounted value of pro�t �(t). A higher elasticity of substitution ��1
implies a lower markup ratio (1=(1 � �)) and a lower pro�t �(t): The inequality condition� < 1 intuitively requires an innovation�s discounted value to be fairly low. That is, thevalue is too low for lagging country B to innovate by itself. In other words, where thefundamental pro�tability of an innovation � (depending on time preference rate � andelasticity of substitution ��1) is higher, the discounted bene�t from an innovation wouldbe higher and thus innovation would be pro�table, even for �rms in the lagging country.Finally, we may summarize this by stating that when an innovation has low fundamentalpro�tability, leapfrogging does not take place because the lagging country does not innovate.
14
3.2 An illustration
To further illustrate the international dynamics of knowledge in the North�South regime, weassume that leading country A has retained leadership in the past; i.e., NA(s) > 0 = NB(s)and thus KA(s) > KB(s) for s = t; t � 1; � � �: This consideration is reasonable given thatTheorem 1 shows that leapfrogging never takes place. The growth of knowledge follows(18) and (20) for any s � t: De�ne (t) = KA(t)=(KA(t) + KB(t)); which stands for theknowledge ratio for country A:We can derive the dynamic system for (t) as follows. NotingKA(t) > KB(t),
(t+ 1) =(a1 + 1) (t)
1 + (a1 + �a2) (t)for (t) 2 (0:5; 1); (22)
where a1 and a2 are positive numbers determined by �; �; and L:26 By applying the aboveprocedures to the case of (t) 2 (0; 0:5) where country B is the leading country, we caneasily derive the following dynamic system:
(t+ 1) =(1� �a2) (t) + �a2
1 + (1� (t)) (a1 + �a2)for (t) 2 (0; 0:5): (23)
Note that a1 < 1 and a2 < 1 if � < 1: We thus can verify that so long as � < 1; the steadystate is unique and higher than 0:5 for (22) and lower than 0:5 for (23).Figure 1 illustrates the phase diagram for systems (22) and (23) with their steady states,
�A and �B. As shown, any path starting in the situation where country A (B) is the leading
country stably converges to a steady state; (s) > (<)0:5 for all s > t if (t) > (<)0:5: Thus,this phase diagram shows that no leapfrogging occurs in the case where the fundamentalpro�tability of an innovation is lower.
3.3 Leapfrogging cycles
We now consider situations where only the lagging country manufactures (specializationpatterns (2) and (3)). We demonstrate that these patterns are realized in equilibrium if andonly if the parameters satisfy � > 1. Then, we show that in this case, leapfrogging can takeplace in equilibrium.By Lemma 1, it is implied that only one country manufactures in equilibrium if and only
if � > 1. We can easily exclude the case where only leading country A manufactures.27
Therefore, in equilibrium, only the lagging country manufactures if and only if � > 1;where a wage di¤erential such as wA(t) � wB(t) must exist as manufacturing �rms inlagging country B would go to leading country A if wA(t) < wB(t); thus, �A(t) < �B(t)held. Because this gives the lagging country a cost advantage, there are two possibilities:one where both countries innovate (pattern (2)) and another where only leading country Ainnovates (pattern (3)).
26The formal de�nitions are:a1 � 2L�
1+� and a2 � L�(1+�)1+�(2L+1) :
27Only leading country A produces goods if and only if wA(t) < wB(t): This implies wA(t)=KA(t) <wB(t)=KB(t) with KA(t) > KB(t) in which only leading country A innovates. No labor demand exists inlagging country B; which is inconsistent with the market clearing condition.
15
We �rst investigate pattern (3), where only leading country A innovates and only lag-ging country B produces goods. For the sake of explanation, we may refer to this as afull North�South regime. Since innovation takes place only in leading country A in equi-librium, the free entry condition must hold as 0 = V A(t) > V B(t): Since manufacturingtakes place only in lagging country B in equilibrium, a wage di¤erential must remain aswA(t) < wB(t): Using these conditions (see the proof of Lemma 1 in Appendix A for de-tails), the wage rate in the lagging country is derived by its labor market-clearing condi-tion as wB(t) = (1� �)E(t)=L; the wage rate in the leading country by the free entrycondition as wA(t) = ��KA(t)E(t)=NA(t); the innovation �ow in leading country A asNA(t) = LKA(t); and the innovation �ow as NB(t) = 0. On the one hand, the free en-try condition V A(t) > V B(t) implies wA(t)=KA(t) < wB(t)=KB(t) in equilibrium, whichcan be rewritten as KA(t)=KB(t) > �: On the other hand, the wage di¤erential conditionwA(t) > wB(t) can be rewritten as � > 1: Combining these two yields
KA(t)
KB(t)> � > 1: (24)
Lemma 2 The economy falls in the full North�South regime if and only if KA(t)=KB(t) >� > 1; in which only the leading country innovates and only the lagging country producesgoods.
Proof. See Appendix A.Lemma 2 implies that so long as � > 1; innovation is more pro�table and the potential for
an international wage di¤erential is greater (see footnote 25); the wage di¤erential wA(t) >wB(t) must remain in equilibrium, in contrast with that in the North�South case with� < 1.28 By using this wage di¤erential wA(t) > wB(t), lagging country B can enter theinnovation market; however, this is not the case as long as leading country A�s technologicaladvantage KA(t)=KB(t) is larger than �; so that the R&D cost is still lower in leadingcountry A; i.e., wA(t)=KA(t) < wB(t)=KB(t):Incorporating NA(t) = LKA(t) and NB(t) = 0 into (9), knowledge accumulation in the
full North�South regime (where country A is assumed to be a leading country) is as follows:
KA(t+ 1) = (L+ 1)KA(t) and KB(t+ 1) = KB(t) + �LKA(t): (25)
Using (24), we can demonstrate that the full North�South regime is unstable in the followingsense.
Theorem 2 Suppose that the pro�tability of an innovation � exceeds 1 and that the inter-national technological gap KA(t)=KB(t) is larger than �. Then, under dynamic optimizationby the in�nitely lived agent, only the leading country innovates and only the lagging countrymanufactures (the full North�South regime). In this case, leapfrogging never takes place inequilibrium. Moreover, any equilibrium path of KA(t)=KB(t) starting from this regime con-verges to the steady state within the regime if � < 1=� and eventually moves beyond thisregime (i.e., KA(t)=KB(t) eventually becomes below �) if � > 1=�:
28The answer to the question of why the equilibrium wage di¤erential between countries exists for � < 1is similar and symmetric to that of the question why of the wages are equated for � < 1: See the discussionafter Lemma 1.
16
Proof. By (24), the equilibrium system can be derived as
(t+ 1) =(L+ 1) (t)
1 + (1 + �)L (t): (26)
(t + 1) > 0:5 always holds because (t) > 0:5 by assumption, showing no leapfrogging inthis regime. Then, system (26) has a unique steady state equal to 1=(1 + �): The conditionKA(t)=KB(t) > � (Lemma 2) is equivalent to (t) > �=(1 + �). Therefore, if 1=(1 + �) >�=(1 + �); then the steady state exists in the full North�South regime, which can be easilyshown as stable through a usual phase diagram analysis. Similarly, we can show that if1=(1+�) < �=(1+�); the steady state does not exist within the regime; (t) decreases overtime and eventually becomes below �. Note that 1=(1 + �) > �=(1 + �) implies � < 1=�:
Next, we investigate the most important case (2), in which both countries innovate andonly the lagging country produces goods. Since innovation takes places in both countries,the free-entry condition requires V A(t) = V B(t) = 0 in equilibrium, which directly implieswA(t)=KA(t) = wB(t)=KB(t) by (6). In this case, it holds that NA(t) > 0; NB(t) > 0, andN(t + 1) = NA(t) + NB(t): For convenience�s sake, we refer to this specialization patternas a North�North regime. Substituting the Euler equation (3) into the value of innovation(10), the free-entry condition V A(t) = V B(t) = 0 implies
��E(t)
N(t+ 1)= wA(t)kA(t) = wB(t)kB(t): (27)
The interpretation of (27) is similar to that of (11). The second equality in (27) indicatesthat the cost of an innovation becomes internationally equated in equilibrium.To determine the innovation �ows in the present case,we apply �A(t) = ; to the labor
condition (12) in order to obtain
NA(t) = LKA(t): (28)
By using (4) and monopolistic pricing pB(t) = wB= (1� �), we obtain xB(t) = (1��)E(t)=(N(t)wB(t)).Substituting this into the labor market condition (12) with (27), we can determine the in-novation �ow for lagging country B as
NB(t) =1
1 + �
��LKB(t)� LKA(t)
�: (29)
Equation (29) shows that the innovation �ow in the lagging country NB(t) increases withdomestic knowledge stock KB(t) but decreases with foreign knowledge stock KA(t): Toensure that the lagging country also innovates in equilibrium, i.e., NB(t) > 0; by (29), itmust hold that
� >KA(t)
KB(t): (30)
This condition means that the international technological gapKA(t)=KB(t) is not very large.Since, by assumption, KA(t) > KB(t); (30) implies
� > 1: (31)
17

Lemma 3 The economy falls in the North�North regime if and only if � > KA(t)=KB(t) >1; in which both countries innovate and only the lagging country produces goods.
Proof. See Appendix A.Lemma 3 shows that if and only if leading countryA�s technological advantage,KA(t)=KB(t);
is not excessively large (condition (30)), then lagging country B can innovate in equilibriumby using the wage di¤erential, which, as described above, exists in equilibrium so long as thefundamental pro�tability � of innovation is su¢ ciently large (condition (31)).Using a numerical exercise, we examine how likely it is that the parameter condition (31)
holds. From (15), the fundamental pro�tability of innovation is more likely to exceed 1 ifconsumers� time preference rate � is higher and/or the markup ratio for monopoly �rms1=(1 � �) is higher. As already discussed, the length of one period in our model is fairlylong (around 20 years), meaning that the time preference rate would be signi�cantly lowerthan a standard value such as 0:98: Roughly, let us consider � = 0:7(' (0:98)20), in whichcase the condition becomes 1=(1� �) > 2:427: This is higher than the industry average butis included in the estimates by Hall (1986), who �nds that in many industries, the markupratio is above 1:5; and in some industries in the US between 1949 and 1978, it was higherthan 2:5. One may think that although the condition � > 1 holds for a moderate range ofparameter values, it is not very likely.Along with Lemmata 1�3, we demonstrate when and how the economy falls within a
particular regime, which could be compared to reality as follows. Countries in the North�North regime could be related to developed countries, given the reality of higher R&Dexpenditure in developed countries. Countries in the (full) North�South regime could alsobe seen as developed and developing countries, given the standard consideration that adeveloped country has a higher income than a developing country. Note that in our model,the leading North�s national income is typically higher than the lagging South�s.29
Finally, we prove that leapfrogging may take place in equilibrium. To achieve this, wesuppose that country A retains leadership for two consecutive periods in the North-Northregime. That is, � > KA(s)=KB(s) > 1 holds for two periods, s = t and t� 1: This impliesthat spillovers MB(t) are equal to NA(t � 1) = LKA(t � 1) because innovations developedby country A in period t� 1 all �ow to lagging country B:By substituting (28) and (29) into (9), with MA(t) = 0 and MB(t) = LKA(t � 1); the
growth of knowledge follows
KA(t+ 1) = LKA(t)| {z }NA(t): domestic innovation
+KA(t); (32)
KB(t+ 1) =�LKB(t)� LKA(t)
1 + �| {z }NB(t): domestic innovation
+�L
L+ 1KA(t)| {z }
MB(t): spillovers
+ KB(t): (33)
In (33), lagging country B has two sources of knowledge growth, namely, domestic innovationNB(t) and spillovers from foreign innovationMB(t); which sharply contrast with the North�29See Appendix B (not for publication) for the formal proof. In Appendix B, we also derive growth rates in
the three regimes, which are all di¤erent in general. Speci�cally, the growth rate in the North�North regimecan be higher or lower than the rates in other regimes, depending on the parameters and internationaltechnology ratio (t).
18
South regime, wherein the lagging country does not innovate. By combining (32) and (33),we derive the international dynamics of knowledge as
(t+ 1) =(L+ 1) (t)
�LL+1
(t) +��L1+�
+ 1� ; (34)
given 0:5 < (s) < �1+�
for s = t; t� 1; which is equivalent to 1 < KA(t)=KB(t) < �:Using (34), the following theorem formally proves the perpetual cycle of leapfrogging as
an equilibrium phenomenon.
Theorem 3 (Leapfrogging cycles with higher pro�tability) Suppose that the funda-mental pro�tability of an innovation � exceeds 1 and that the international technologicalgap KA(s)=KB(s) is lower than � for s = t; t � 1: Then, under dynamic optimizationby the in�nitely lived agent, both the leading and lagging countries innovate in equilibrium(North�North regime). In this case, neither country may successfully retain its technologi-cal leadership for in�nite sequential periods; i.e., leapfrogging may take place repeatedly andperpetually along an equilibrium path. Speci�cally, this occurs if and only if
� 2�2 (L+ 1)
1 + �; 1
�: (35)
Proof. First, by Lemma 3, � > KA(s)=KB(s) > 1 ensures that both countries innovatebut only the lagging country produces goods. The steady state of system (34) is uniquelygiven by
� =1
�
L+ 1
1 + �;
which is stable. The steady state �is less than 0:5 if and only if (35) holds. Then, if and onlyif � < 0:5; given (34), (t) will stably decrease and eventually fall below 0:5; where countryA loses its technological leadership. This means that when country A has leadership for twoperiods (t and t � 1), it can never retain its leadership for an in�nite number of sequentialperiods if and only if (35) holds. In other words, technological leadership is always temporary.By symmetry, it is straightforward to show the opposite case where country B initially hasleadership for two periods. This proves the perpetual occurrence of leapfrogging, taking intoaccount the fact that when a country initially has leadership for only one period, it eitherretains leadership for two periods or is immediately leapfrogged.By combining Theorems 1�3, we reach our main result as follows:
Corollary 1 If and only if (35) holds, the economy will eventually experience leapfroggingand its cycles along an equilibrium path for any initial condition on (KA(t); KB(t)).
Proof. For su¢ ciency: If (35) holds, � > 1=� and � > 1 must hold. Since � > 1; byLemmata 2 and 3, the economy falls within the full North�South regime or the North�Northregime. In the case where the economy is in the full North�South regime (i.e.,KA(t)=KB(t) >�), since � > 1=�; a path of KA(t)=KB(t) eventually becomes below �; entering the North�North regime (Theorem 2). In the case where the economy is in the North�North regime
19
(i.e., � > KA(t)=KB(t)), since (35) holds, leapfrogging eventually occurs (Theorem 3). Fornecessity: If (35) does not hold, leapfrogging does not occur, regardless of whether � > 1(see Theorems 2 and 3) or � < 1 (see Theorem 1).One notable feature in the main result is that (35) is the necessary and su¢ cient condi-
tion for leapfrogging to occur in equilibrium. Therefore, it would be fruitful to discuss theeconomic implications of this condition in further detail. Condition (35) is more likely tohold if the spillovers � are more e¢ cient, if the country size L is smaller, and/or if the fun-damental pro�tability of innovation � is larger. It is straightforward that the possibility ofleapfrogging is increased by a rise in the e¢ ciency of spillovers �. More importantly, even ifthe lagging country can learn from the leading country�s innovations with the same e¢ ciencywith which the leading country itself learns (i.e., � = 1), leapfrogging may not always occur.The key parameters are L and �; which relate to the two engines of knowledge accumula-tion, as explained below: country size L relates to �learning from foreign innovations�andfundamental pro�tability � relates to �domestic innovations.�To explain the role of country size L; we rewrite the spillovers the lagging country receives
as
MB(t) = NA(t� 1) = LKA(t� 1) = LKA(t)
L+ 1| {z }KA(t�1)
;
where the last equality comes from (28).30 The essential element here is that the laggingcountry learns from the past innovations made by leading country A; NA(t� 1); which aremanufactured in the present period t. The term 1
L+1captures the fact that the leading
country�s knowledge grows at the rate of L + 1 through KA(t) = (L + 1)KA(t � 1): Asthe country size L is large, the leader�s innovations grow more sharply from t � 1 to t;the intertemporal gap KA(t) �KA(t � 1) is also larger. This intertemporal gap creates anintercountry gap of knowledge accumulation: while the leading country can learn from itscurrent innovation NA(t) = LKA(t); the lagging country can only learn from the leader�spast innovation NA(t�1) = LKA(t)
L+1; which is depreciated by the growth rate L+1:When the
country size L is large, this depreciation is also large, reducing the chance of leapfrogging.Next, we explain the role of fundamental pro�tability �: Regardless of the e¢ ciency
of the spillovers �, leapfrogging cannot take place if � < 1: This limit re�ects the factthat the lagging country does not innovate for itself if � < 1. That is, the spilloversfrom foreign innovations alone can never bring about leapfrogging. Coexistence of domesticinnovation and learning from foreign innovation is essential in the lagging country, which isthe case in equilibrium if � > 1: However, even in this case, leapfrogging does not occurwhen � is not su¢ ciently large to satisfy (35). When � becomes su¢ ciently large, thelagging country responds by developing more innovations (see (33)), while the leading countrydoes not change its equilibrium behavior because it has already developed innovations at amaximum (see (32)). For a su¢ ciently large �; leapfrogging becomes inevitable. Note that� � ��=(1� �) is increasing in the time preference rate � and the markup 1=(1� �): Thatis, when consumers are more patient, in that they prefer saving for future consumption (i.e.,investment in innovation) to current consumption, and/or the monopolist can earn more
30Country A is assumed to be a leading country in period t� 1: Since we focus on an identical equilibriumpath, KA(t� 1) must satisfy KA(t) = (L+ 1)KA(t� 1) by (28), given KA(t):
20
from an innovation owing to a higher markup, the lagging country innovates more activelyin equilibrium, resulting in a higher possibility of leapfrogging.Thus far, we have characterized the cyclical occurrence of leapfrogging with four para-
meters, �; �; L; and �: Finally, we brie�y discuss how these relate to policy. Subjectivetime preference � and country size L should be seen as core parameters in the present con-text; from the descriptive perspective, leapfrogging cycles exist in equilibrium if and onlyif consumers are su¢ ciently patient and the country size is su¢ ciently small for the above-mentioned reason. The spillover e¢ ciency � is naturally related to the so-called absorptivecapability (Cohen and Levinthal 1989) of �rms in the host country to FDI, consistent withthe empirical evidence that spillovers through FDI increase with the host country �rms�de-gree of absorptive capability (see, for example, Borenszteina, Gregorio, and Lee 1998). In theempirical literature, the absorptive capability of a host country is often measured by its stockof human capital, which crucially depends on a country�s educational system. In addition,absorptive ability depends on literacy and foreign language skills (Rogers 2004). Thus, wemay relate the spillover parameter � to general and foreign language education policy; thegovernment would be able to raise � by investing more in education, for instance, througha lump-sum tax, which increases the possibility of leapfrogging in our model. In a di¤erentcontext, we may relate the markup ratio 1=(1 � �) to patent protection. Following the op-timal patent policy literature (Gilbert and Shapiro 1990), we focus on a patent�s breadth,interpreted as the patentee�s ability to raise price, as a measure of patent protection. Toformally model patent breadth, we need another parameter denoting an upper bound on themarkup; see, for example, Li (2001), Goh and Oliver (2002), Chu (2011), and Iwaisako andFutagami (2013) for research in this line. With this limitation in mind, we consider that ahigher markup ratio 1=(1��) captures a larger patent breadth. Hence, a tightening of patentprotection in the sense of a larger patent breadth increases �rms�pro�t, which encouragesthe lagging country to innovate more actively, raising the possibility of leapfrogging.We summarize the implication of our result as a proposition.
Proposition 1 An economy will eventually experience leapfrogging and its cycles over timeif and only if (a) the consumers are patient and prefer saving to current consumption, (b) thecountry�s size is small, (c) the e¢ ciency of international knowledge spillovers is reasonablyhigh, and (d) the markup ratio is high. Condition (c) could be related to a larger absorptivecapability of �rms, while condition (d) could be related to stronger patent protection.
The key driving force behind leapfrogging cycles is a lagging country�s dual growth engine.In the North�North regime, the lagging country both innovates and manufactures. Thus,the lagging country�s knowledge accumulates not only through its own innovations but alsothrough the �ow of spillovers from the leading country�s innovations. In this sense, thegrowth engine of knowledge in the lagging country is twofold: innovating autonomouslyand learning from abroad. Although the leading country innovates faster than the laggingcountry, knowledge growth in the leading country is driven only by domestic innovations,which creates the possibility of leapfrogging. This mechanism of leapfrogging works under(35) and is enhanced by the four factors, (a)�(d), in Proposition 1.
21
3.4 An illustration
To illustrate, we again use a phase diagram. However, the con�guration of the phase diagramdepends on the history, i.e., which country was a leading country in the previous period. Asthis is simply a problem of visual complication, to clarify the illustration, we assume thatinnovation activities are completed within one period. Thus, the innovation value in (6)should be replaced by
V i(t) = maxf�A(t); �B(t)g � wi(t)ki(t): (36)
In this modi�ed setting, the necessary and su¢ cient condition for the North-North (fullNorth-South) regime given in Lemma 3 (Lemma 2) is simpli�ed to � > (t) > 0:5 ( (t) >� > 0:5). Recall that � is the parameter that determines the elasticity of substitution. Then,we can describe the international dynamics of knowledge as follows.31
(t+ 1) = �( (t)) �
8>>>><>>>>:�L+(1��L) (t)1+(1+�)L(1� (t)) for (t) 2 (0; 1� �)
(��(1��))L+(1+(1��)L) (t)�L+1+�L(1� (t)) for (t) 2 (1� �; 0:5)
(L+ 1) (t)1+�L+�L (t)
for (t) 2 (0:5; �)(L+ 1) (t)
1+(1+�)L (t)for (t) 2 (�; 1)
: (37)
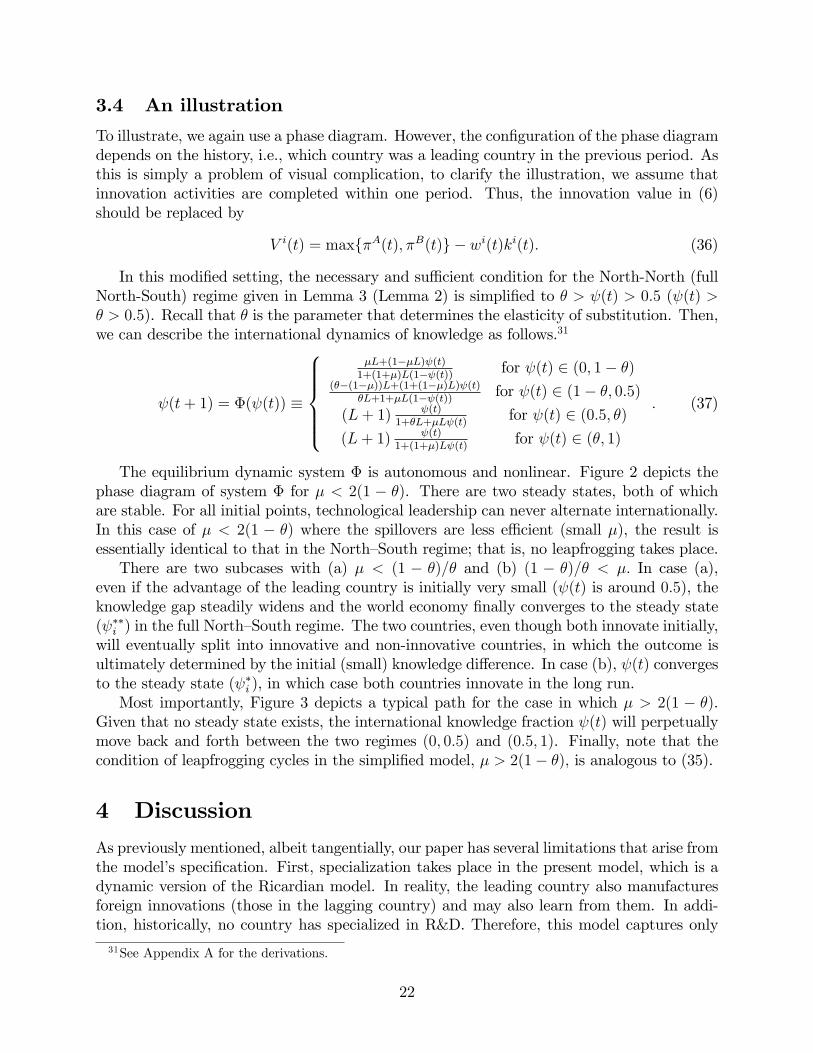
The equilibrium dynamic system � is autonomous and nonlinear. Figure 2 depicts thephase diagram of system � for � < 2(1 � �). There are two steady states, both of whichare stable. For all initial points, technological leadership can never alternate internationally.In this case of � < 2(1 � �) where the spillovers are less e¢ cient (small �), the result isessentially identical to that in the North�South regime; that is, no leapfrogging takes place.There are two subcases with (a) � < (1 � �)=� and (b) (1 � �)=� < �: In case (a),
even if the advantage of the leading country is initially very small ( (t) is around 0:5), theknowledge gap steadily widens and the world economy �nally converges to the steady state( ��i ) in the full North�South regime. The two countries, even though both innovate initially,will eventually split into innovative and non-innovative countries, in which the outcome isultimately determined by the initial (small) knowledge di¤erence. In case (b), (t) convergesto the steady state ( �i ), in which case both countries innovate in the long run.Most importantly, Figure 3 depicts a typical path for the case in which � > 2(1 � �).
Given that no steady state exists, the international knowledge fraction (t) will perpetuallymove back and forth between the two regimes (0; 0:5) and (0:5; 1). Finally, note that thecondition of leapfrogging cycles in the simpli�ed model, � > 2(1� �); is analogous to (35).
4 Discussion
As previously mentioned, albeit tangentially, our paper has several limitations that arise fromthe model�s speci�cation. First, specialization takes place in the present model, which is adynamic version of the Ricardian model. In reality, the leading country also manufacturesforeign innovations (those in the lagging country) and may also learn from them. In addi-tion, historically, no country has specialized in R&D. Therefore, this model captures only
31See Appendix A for the derivations.
22

a certain aspect of real-world behavior. That is, lagging countries may have an advantagein international technological competition with the leading country because they can learnfrom the leader�s active innovation as well as their own innovation experience. We can easilyremove this unrealistic aspect concerning specialization from the model by assuming, forinstance, a strictly concave production function in manufacturing. As this would make theanalysis intractable without adding new insights, we adopt the present setting for simplicity.Second, given the historical fact that technological leadership has often shifted between
countries, it is important to provide an extended case comprising more than two countries.We can demonstrate that three or more countries on an equilibrium path can perpetually ex-perience various forms of leapfrogging, including, for example, growth miracles (Matsuyama2007), in which the least productive country leapfrogs all rival countries having higher pro-ductivity levels in a single burst. Such growth miracles may take place sporadically orconsecutively or in some complex combination; see Furukawa (2012) for a formal analysis.Third, to clearly explain the mechanism through which leapfrogging occurs along an
equilibrium path, we assume that countries are basically homogeneous. Allowing for countryheterogeneity, we can demonstrate that leapfrogging may take place �nite times in the modelwhere countries have di¤erent labor endowments and/or e¢ ciency levels of spillovers.32
Fourth, because the model assumes discrete time, it is implicitly assumed that the leadingcountry takes a long time to exploit its technological advantage, a delay that allows thelagging country to leapfrog it. One may wonder why the leading country waits so long. Thesimple answer is that, in each period, �rms in the leading country only pursue a one-periodmonopoly; thus, they do not worry about whether the leadership of their home countrypersists. For example, if we introduce into the model a welfare-maximizing government thatgives subsidies to innovating �rms, a policy game between international governments maylead to a di¤erent situation where the leading country does not wait so long. However,because innovations often take a very long time from startup to implementation and emergein bunches,33 asymmetric information prevents the government in the leading country fromseeing in real time what is happening in the lagging country. Given this, the leading countrycan only wait and see what happens in the lagging country.Of course, it is potentially necessary to extend our discrete-time analysis to continuous
time. In a continuous-time setting, it is essential to consider what happens as the technologylevels of two countries become equal in the process of leapfrogging. One way forward wouldbe to focus on technological complementarity between countries. Spillovers from the leadingcountry then combine with the backward technology of the lagging country, meaning that ourleapfrogging mechanism should work in a continuous-time setting. We leave this fundamentalissue associated with discrete time for future research.Fifth, we should revisit the lack of factors such as stochastic innovation, costly adoption
of innovation, and strategic interactions, which should be a limiting factor in a broadercontext. As we previously mentioned, if we implement a very simple setting, we can considera stochastic innovation process or a costly adoption process without essentially changing theresults.34 Meanwhile, although an introduction of stochastic timing of innovation or strategic
32The formal analysis is available from the author upon request.33This issue is intensively investigated in the literature on innovation cycles (see Shleifer 1986).34See Appendix C (not for publication).
23
interactions between �rms could be interesting, it makes the analysis intractable.Sixth, we consider FDI �ows as the only spillover channel. In the model, FDI is allowed
to �ow in both directions but takes place only from the leader to the laggard in equilibrium;as a result, knowledge �ows in that direction only. One might regard this equilibriumcharacteristic of one-way knowledge spillovers as unrealistic, given that the two countriesare identical except for their knowledge stock for innovation. However, if we allowed amore general spillover function, including laggard-to-leader knowledge spillovers, our mainmechanism would not cease and the results would still hold under original condition (35)with one extra condition. Speci�cally, we can extend the model by adding spillovers thatare not based on FDI to the present setting. In such an extended model, knowledge �ows inboth directions in equilibrium; under (35), we can demonstrate that leapfrogging occurs ifthe e¢ ciency of non-FDI spillovers is not very large.35 Therefore, we can say that our simplespeci�cation on spillovers in (8) captures a general aspect of the leapfrogging phenomenon.Finally, the mechanism of leapfrogging cycles shown here is endogenous in that it de-
pends on an endogenous process of knowledge accumulation, which is based on Romer�s(1990) setting. However, it should be noted that it is not endogenous in a strict sensesince the knowledge accumulation process we consider does not explicitly incorporate anyeconomic incentive or pro�t motive but rather assumes externalities of past innovations oncurrent technological productivity, so that the learning mechanism itself is essentially ex-ogenous. In a complete model of fully endogenous leapfrogging cycles, we would considervoluntary investment activity by �rms to learn from foreign innovations; we leave this forfuture research.
5 Concluding Remarks
In this paper, we developed a two-region endogenous innovation model with dynamic opti-mization of the in�nitely lived consumer, in which knowledge di¤uses internationally throughFDI. The major �nding is that technological leadership may shift internationally, perpetu-ally moving back and forth between countries if the pro�tability of an innovation is higherand the spillovers are relatively e¢ cient. Speci�cally, if the pro�tability of an innovation islower, in equilibrium, only the leading country innovates. In this case, leapfrogging neverarises. If the pro�tability of an innovation is higher, in equilibrium, both countries innovate.In this case, leapfrogging perpetually takes place along an equilibrium path if internationalspillovers are reasonably e¢ cient. In a big picture, we may say that the growth process ofan international economy can be intrinsically cyclical depending on the factors such as thepro�tability of innovation and the e¢ ciency of international spillovers.Our result shows the possibility that lagging countries leapfrog in spite of innovating less,
by focusing on learning from foreign innovation as a missing link. In this sense, the presentpaper is close to Glass (1999) in spirit. With some examples from Asian countries includingSouth Korea or China,36 Glass (1999) considers whether learning from foreign innovationthrough imitation can serve as a stepping stone enabling �rms from lagging countries toundertake innovation. The present paper extends Glass�s (1999) view by demonstrating that
35We show this in Appendix C (not for publication).36See Carolan, Singh, and Talati (1998).
24
the e¤ectiveness of learning may be a key factor in enabling the lagging country to leapfrogthe leading country by shifting to a more innovative economy.
References
[1] Aghion, Philippe, Christopher Harris, Peter Howitt, and John Vickers. �Competition,imitation and growth with step-by-step innovation,�Review of Economic Studies, 68:467�92 (2001).
[2] Athreye, Suma, and Andrew Godley. �Internationalization and technological leapfrog-ging in the pharmaceutical industry,� Industrial and Corporate Change, 18: 295�323(2009).
[3] Borensztein, Eduardo, Jose De Gregorio, and Jong-Wha Lee. �How does foreign directinvestment a¤ect economic growth?,�Journal of International Economics, 45: 115�135(1998).
[4] Branstetter, Lee. �Is foreign direct investment a channel of knowledge spillovers? Evi-dence from Japan�s FDI in the United States,�Journal of International Economics, 68:325�44 (2006).
[5] Brezis, Elise S. �Foreign capital �ows in the century of Britain�s industrial revolution:new estimates, controlled conjectures,�Economic History Review, 48: 46�67 (1995).
[6] Brezis, Elise S., and Daniel Tsiddon. �Economic growth, leadership and capital �ows:The leapfrogging e¤ect,�Journal of International Trade and Economic Development, 7:261�77 (1998).
[7] Brezis, Elise S., Paul R. Krugman, and Daniel Tsiddon. �Leapfrogging in internationalcompetition: a theory of cycles in national technological leadership,�American Eco-nomic Review, 83: 1211�19 (1993).
[8] Broda, Christian and David E. Weinstein. �Globalization and the gains from variety,�Quarterly Journal of Economics, 121: 541�85 (2006).
[9] Carolan, Terrie, Nirvikar Singh, and Cyrus Talati. �The composition of U.S.-East Asiatrade and changing comparative advantage,� Journal of Development Economics 57,361�89 (1998).
[10] Chu, Angus C. �The welfare cost of one-size-�ts-all patent protection,�Journal of Eco-nomic Dynamics and Control, 35: 876�890 (2011).
[11] Cohen, Wesley M., and Daniel A. Levinthal. �Innovation and learning: The two facesof R&D,�Economic Journal, 99: 569�596 (1989).
[12] Davids, Karel. The Rise and Decline of Dutch Technological Leadership, Leiden, Nether-lands: Brill (2008).
25
[13] Deneckere, Raymond and Kenneth Judd. �Cyclical and chaotic behavior in a dynamicequilibrium model,� in Cycles and Chaos in Economic Equilibrium, ed. by Jess Ben-habib. Princeton: Princeton University Press (1992).
[14] Desmet, Klaus. �A simple dynamic model of uneven development and overtaking,�Economic Journal, 112: 894�918 (2002).
[15] Feenstra, Robert C. �Trade and uneven growth,�Journal of Development Economics,49: 229�56 (1996).
[16] Francois, Patrick, and Huw Lloyd-Ellis. �Animal spirits through creative destruction,�American Economic Review, 93: 530�550 (2003).
[17] Francois, Patrick, and Huw Lloyd-Ellis. �Implementation cycles, investment andgrowth,�International Economic Review, 49: 901�942 (2008).
[18] Francois, Patrick, and Huw Lloyd-Ellis. �Schumpeterian business cycles with pro-cyclical R&D,�Review of Economic Dynamics, 12: 567�591 (2009).
[19] Francois, Patrick, and Huw Lloyd-Ellis. �Implementation cycles, growth andthe labour market,�mimeo, http://faculty.arts.ubc.ca/fpatrick/documents/bejm14-2-13.pdf (2013).
[20] Francois, Patrick, and Shouyong Shi. �Innovation, growth, and welfare-improving cy-cles,�Journal of Economic Theory, 85: 226�57 (1999).
[21] Furukawa, Yuichi. �Growth miracles and leapfrogging cycles in a many-country model,�mimeo, Chukyo University (2012).
[22] Gale, Douglas. �Delay and cycles,�Review of Economic Studies, 63: 169�98 (1996).
[23] Gilbert, Richard, and Carl Shapiro. �Optimal patent length and breadth,�RAND Jour-nal of Economics, 21: 106�112 (1990).
[24] Giovannetti, Emanuele. �Perpetual leapfrogging in Bertrand duopoly,� InternationalEconomic Review, 42: 671�96 (2001).
[25] Giovannetti, Emanuele. �Catching up, leapfrogging, or forging ahead? Exploring thee¤ects of integration and history on spatial technological adoptions,�Environment andPlanning A, 45: 930�946 (2013).
[26] Glass, Amy. �Imitation as a stepping stone to innovation,�Working Papers 99-11, OhioState University, Department of Economics (1999).
[27] Goh, Ai-Ting, and Jacques Olivier. �Optimal patent protection in a two-sector econ-omy,�International Economic Review, 43: 1191�1214 (2002).
[28] Grossman, Gene M., and Elhanan Helpman. Innovation and Growth in the Global Econ-omy, Cambridge, MA: MIT Press (1991).
26
[29] Hall, Robert E. �Market structure and macroeconomic �uctuations,�Brookings Paperson Economic Activity, 2: 285�322 (1986).
[30] Hall, Robert E. �Potential competition, limit pricing, and price elevation from exclu-sionary conduct,�Issue in Competition Law and Policy 433, ABA Section of AntitrustLaw: 433�448 (2008).
[31] Harrington, Joseph, Jr. Fyodor Iskhakov, John Rust, and Bertel Schjerning. �A dynamicmodel of leap frogging investments and Bertrand price competition,�mimeo (2010).Available at: http://econweb.umd.edu/~davis/eventpapers/RustDynamicModel.pdf(accessed on 10 March, 2014).
[32] Helpman, Elhanan. �Innovation, imitation, and intellectual property rights.�Economet-rica, 61: 1247�80 (1993).
[33] Iwaisako, Tatsuro, and Koichi Futagami. �Patent protection, capital accumulation, andeconomic growth,�Economic Theory, 52: 631�668 (2013).
[34] Iwaisako, Tatsuro, and Hitoshi Tanaka. �Product cycles and growth cycles,�mimeo,Osaka University (2012).
[35] Krugman, P. �A model of innovation, technology transfer, and the world distributionof Income.�Journal of Political Economy, 87: 253�66 (1979).
[36] Lai, Edwin L.-C. �International intellectual property rights protection and the rate ofproduct innovation,�Journal of Development Economics, 55: 133�53 (1998).
[37] Lee, Jeongsik, Byung-Cheol Kim, and Young-Mo Lim. �Dynamic competition in techno-logical investments: An empirical examination of the LCD panel industry,�InternationalJournal of Industrial Organization, 29: 718�28 (2011).
[38] Li, Chol-Won. �On the policy implications of endogenous technological progress,�Eco-nomic Journal, 111: C164�79 (2001).
[39] Matsuyama, Kiminori. �Growing through cycles,�Econometrica, 67: 335�47 (1999).
[40] Matsuyama, Kiminori. �Growing through cycles in an in�nitely lived agent economy,�Journal of Economic Theory, 100: 220�34 (2001).
[41] Matsuyama, Kiminori. �Credit traps and credit cycles,�American Economic Review,97: 503�16 (2007).
[42] Mokyr, Joel. The Lever of Riches. Technological Creativity and Economic Progress,Oxford: Oxford University Press (1990).
[43] Motta, Massimo, Jacques-Francois Thisse, and Antonio Cabrales. �On the persistenceof leadership or leapfrogging in international trade,� International Economic Review,38: 809�24 (1997).
27
[44] Nelson, Richard R. and Gavin Wright. �The rise and fall of American technologicalleadership: The postwar era in historical perspective,�Journal of Economic Literature,30: 1931�64 (1992).
[45] Nishimura, Kazuo, and Makoto Yano. �Introduction to the special issue on nonlinearmacroeconomic dynamics,�International Journal of Economic Theory, 4: 1�2 (2008).
[46] Ohyama, Michihiro, and Ronald W. Jones. �Technology choice, overtaking and com-parative advantage,�Review of International Economics, 3: 224�34 (1995).
[47] Petrakos, George, Andrés Rodríguez-Pose, and Antonis Rovolis. �Growth, integration,and regional disparities in the European Union,� Environment and Planning A, 37:1837�1855 (2005).
[48] Quah, Danny. �Regional convergence clusters across Europe,�European Economic Re-view, 40: 951�958 (1996a).
[49] Quah, Danny. �Empirics for economic growth and convergence,�European EconomicReview, 40: 1353�1375 (1996b).
[50] Rogers, Mark. �Absorptive capability and economic growth: How do countries catch-up?,�Cambridge Journal of Economics, 28: 577�596 (2004).
[51] Romer, Paul. M. �Endogenous technological change,�Journal of Political Economy, 98:S71�S102 (1990).
[52] Shleifer, Andrei. �Implementation cycles,�Journal of Political Economy, 94: 1163�1190(1986).
[53] van de Klundert, Theo, and Sjak Smulders. �Loss of technological leadership of ren-tier economies: A two-country endogenous growth model,� Journal of InternationalEconomics, 54: 211�31 (2001).
28
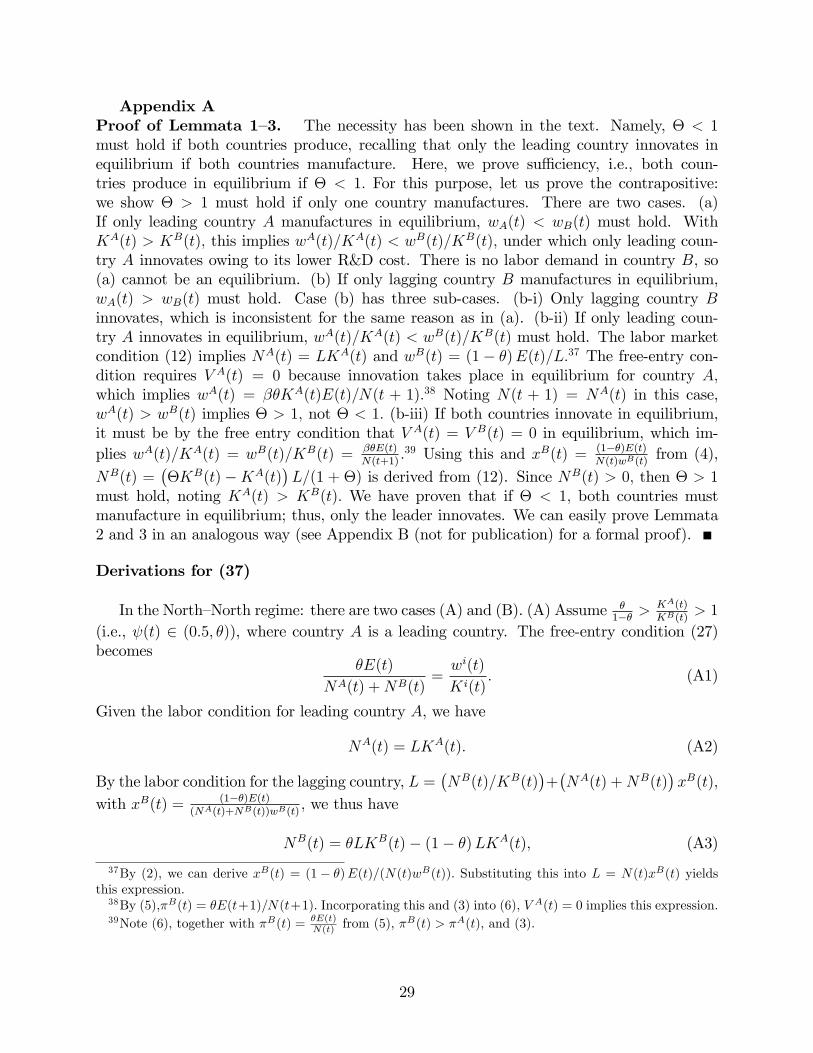
Appendix AProof of Lemmata 1�3. The necessity has been shown in the text. Namely, � < 1must hold if both countries produce, recalling that only the leading country innovates inequilibrium if both countries manufacture. Here, we prove su¢ ciency, i.e., both coun-tries produce in equilibrium if � < 1: For this purpose, let us prove the contrapositive:we show � > 1 must hold if only one country manufactures. There are two cases. (a)If only leading country A manufactures in equilibrium, wA(t) < wB(t) must hold. WithKA(t) > KB(t); this implies wA(t)=KA(t) < wB(t)=KB(t); under which only leading coun-try A innovates owing to its lower R&D cost. There is no labor demand in country B, so(a) cannot be an equilibrium. (b) If only lagging country B manufactures in equilibrium,wA(t) > wB(t) must hold. Case (b) has three sub-cases. (b-i) Only lagging country Binnovates, which is inconsistent for the same reason as in (a). (b-ii) If only leading coun-try A innovates in equilibrium, wA(t)=KA(t) < wB(t)=KB(t) must hold. The labor marketcondition (12) implies NA(t) = LKA(t) and wB(t) = (1� �)E(t)=L:37 The free-entry con-dition requires V A(t) = 0 because innovation takes place in equilibrium for country A;which implies wA(t) = ��KA(t)E(t)=N(t + 1):38 Noting N(t + 1) = NA(t) in this case,wA(t) > wB(t) implies � > 1; not � < 1: (b-iii) If both countries innovate in equilibrium,it must be by the free entry condition that V A(t) = V B(t) = 0 in equilibrium, which im-plies wA(t)=KA(t) = wB(t)=KB(t) = ��E(t)
N(t+1):39 Using this and xB(t) = (1��)E(t)
N(t)wB(t)from (4),
NB(t) =��KB(t)�KA(t)
�L=(1 + �) is derived from (12). Since NB(t) > 0; then � > 1
must hold, noting KA(t) > KB(t): We have proven that if � < 1; both countries mustmanufacture in equilibrium; thus, only the leader innovates. We can easily prove Lemmata2 and 3 in an analogous way (see Appendix B (not for publication) for a formal proof).
Derivations for (37)
In the North�North regime: there are two cases (A) and (B). (A) Assume �1�� >
KA(t)KB(t)
> 1
(i.e., (t) 2 (0:5; �)), where country A is a leading country. The free-entry condition (27)becomes
�E(t)
NA(t) +NB(t)=wi(t)
Ki(t): (A1)
Given the labor condition for leading country A, we have
NA(t) = LKA(t): (A2)
By the labor condition for the lagging country, L =�NB(t)=KB(t)
�+�NA(t) +NB(t)
�xB(t);
with xB(t) = (1��)E(t)(NA(t)+NB(t))wB(t)
; we thus have
NB(t) = �LKB(t)� (1� �)LKA(t); (A3)
37By (2), we can derive xB(t) = (1� �)E(t)=(N(t)wB(t)): Substituting this into L = N(t)xB(t) yieldsthis expression.38By (5),�B(t) = �E(t+1)=N(t+1): Incorporating this and (3) into (6), V A(t) = 0 implies this expression.39Note (6), together with �B(t) = �E(t)
N(t) from (5), �B(t) > �A(t), and (3).
29
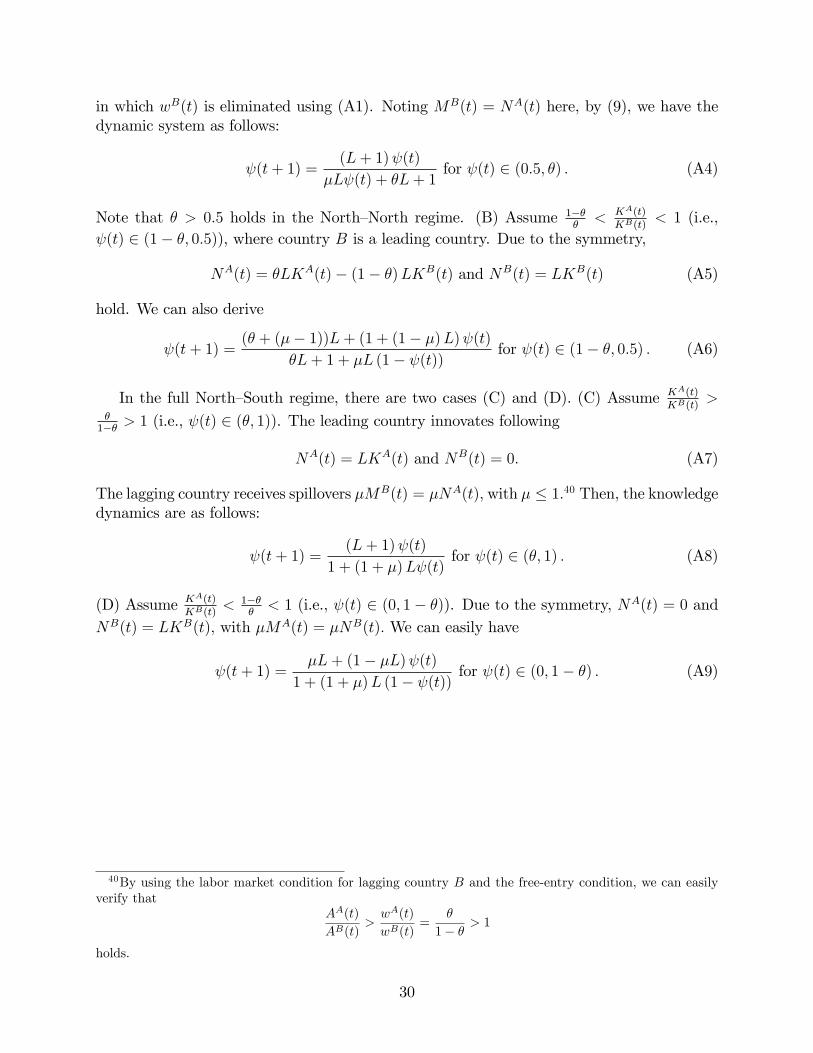
in which wB(t) is eliminated using (A1). Noting MB(t) = NA(t) here, by (9), we have thedynamic system as follows:
(t+ 1) =(L+ 1) (t)
�L (t) + �L+ 1for (t) 2 (0:5; �) : (A4)
Note that � > 0:5 holds in the North�North regime. (B) Assume 1���
< KA(t)KB(t)
< 1 (i.e., (t) 2 (1� �; 0:5)), where country B is a leading country. Due to the symmetry,
NA(t) = �LKA(t)� (1� �)LKB(t) and NB(t) = LKB(t) (A5)
hold. We can also derive
(t+ 1) =(� + (�� 1))L+ (1 + (1� �)L) (t)
�L+ 1 + �L (1� (t))for (t) 2 (1� �; 0:5) : (A6)
In the full North�South regime, there are two cases (C) and (D). (C) Assume KA(t)KB(t)
>�1�� > 1 (i.e., (t) 2 (�; 1)). The leading country innovates following
NA(t) = LKA(t) and NB(t) = 0: (A7)
The lagging country receives spillovers �MB(t) = �NA(t); with � � 1:40 Then, the knowledgedynamics are as follows:
(t+ 1) =(L+ 1) (t)
1 + (1 + �)L (t)for (t) 2 (�; 1) : (A8)
(D) Assume KA(t)KB(t)
< 1���< 1 (i.e., (t) 2 (0; 1� �)). Due to the symmetry, NA(t) = 0 and
NB(t) = LKB(t); with �MA(t) = �NB(t): We can easily have
(t+ 1) =�L+ (1� �L) (t)
1 + (1 + �)L (1� (t))for (t) 2 (0; 1� �) : (A9)
40By using the labor market condition for lagging country B and the free-entry condition, we can easilyverify that
AA(t)
AB(t)>wA(t)
wB(t)=
�
1� � > 1
holds.
30
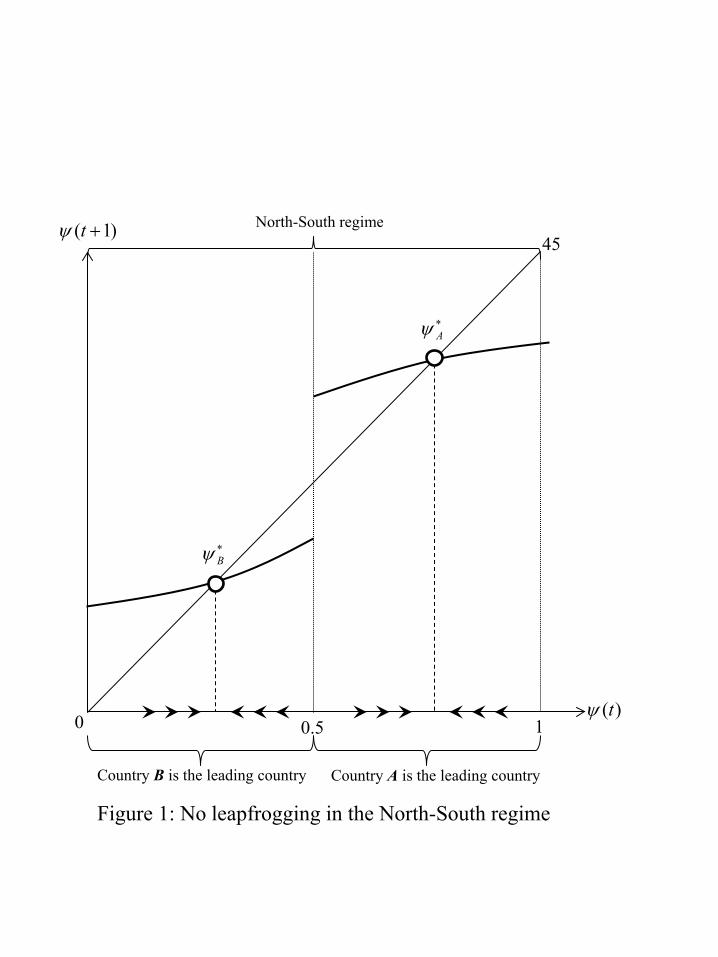
45
)(tψ
)1( +tψ
0.5 0
Figure 1: No leapfrogging in the North-South regime
∗Aψ
∗Bψ
1
North-South regime
Country B is the leading country Country A is the leading country
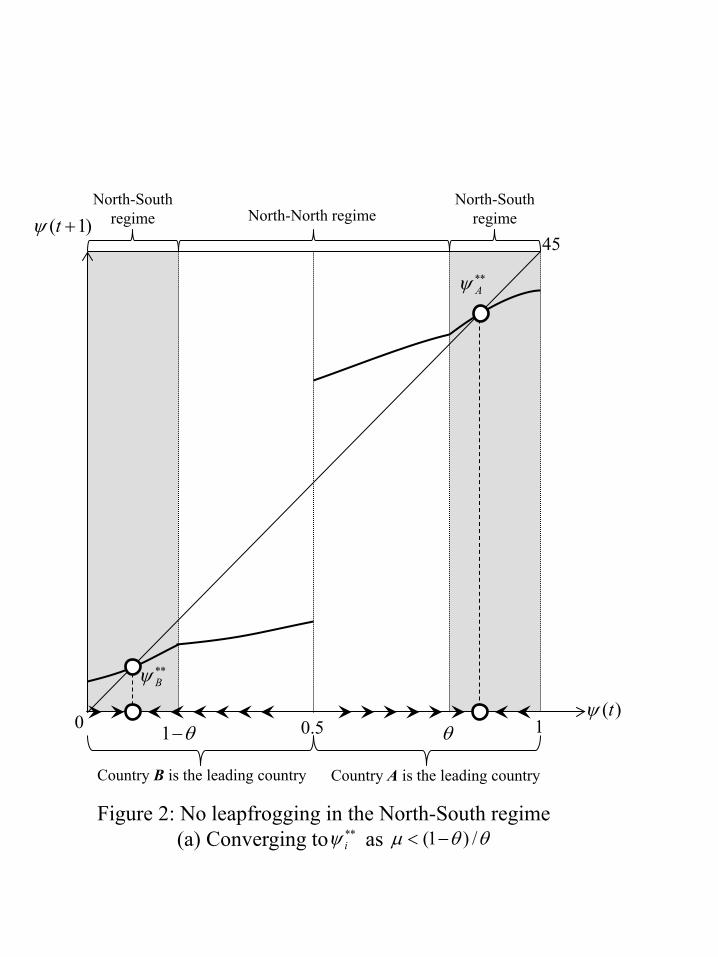
45
)(tψ
)1( +tψ
0.5 0
Figure 2: No leapfrogging in the North-South regime (a) Converging to as
∗∗Aψ
∗∗Bψ
North-North regime North-South
regime North-South
regime
1
θθµ /)1( −<∗∗iψ
θθ−1
Country B is the leading country Country A is the leading country
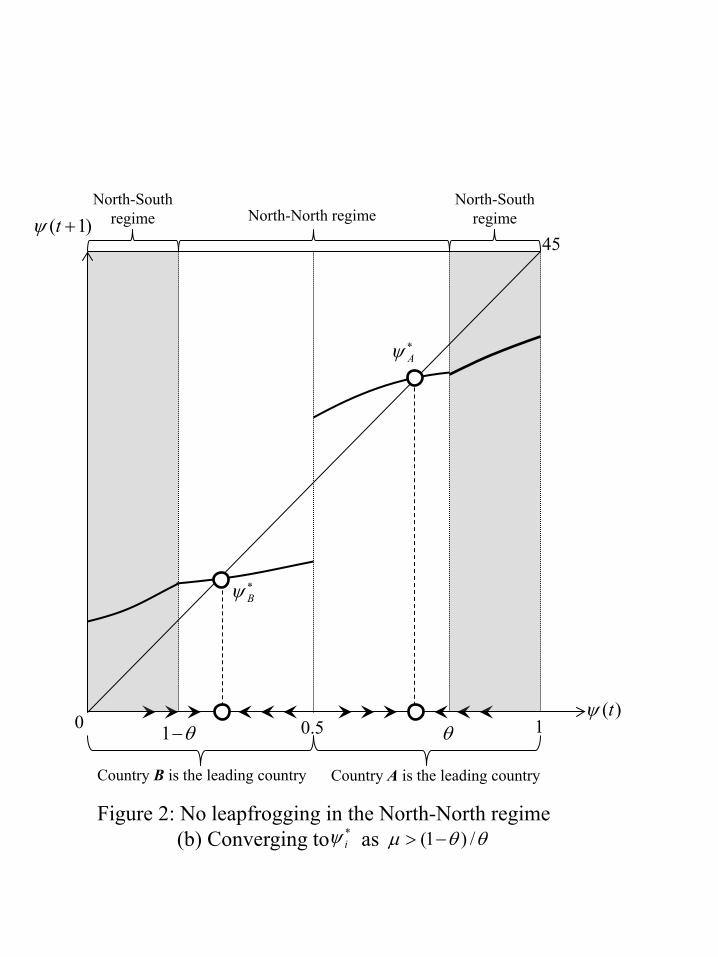
45
)(tψ
)1( +tψ
0.5 0
Figure 2: No leapfrogging in the North-North regime (b) Converging to as
∗Aψ
∗Bψ
1
θθµ /)1( −>∗iψ
θθ−1
North-North regime North-South
regime North-South
regime
Country B is the leading country Country A is the leading country
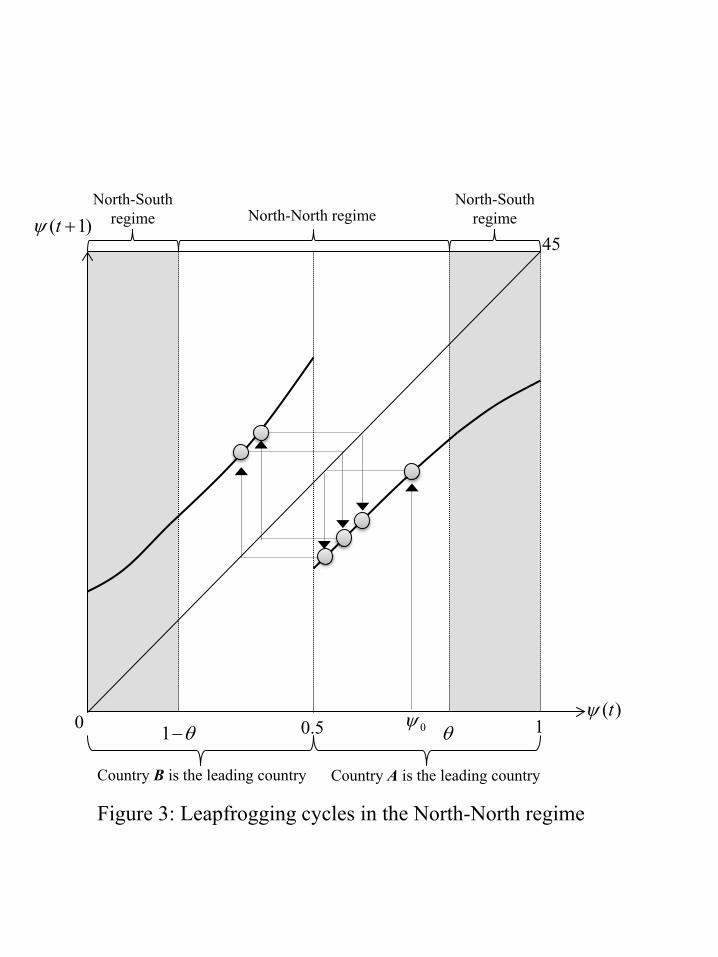
45
)(tψ
)1( +tψ
0.5 0
Country B is the leading country Country A is the leading country
Figure 3: Leapfrogging cycles in the North-North regime
1 0ψθθ−1
North-North regime North-South
regime North-South
regime