Multivariate Time Series Classification Using …Multivariate Time Series Classification Using...
8
Multivariate Time Series Classification Using Dynamic Time Warping Template Selection for Human Activity Recognition Skyler Seto* Department of Statistical Science Cornell University Ithaca, NY, USA Email: [email protected] Wenyu Zhang* Department of Statistical Science Cornell University Ithaca, NY, USA Email: [email protected] Yichen Zhou* Department of Statistical Science Cornell University Ithaca, NY, USA Email: [email protected] Abstract—Accurate and computationally efficient means for classifying human activities have been the subject of extensive research efforts. Most current research focuses on extracting complex features to achieve high classification accuracy. We propose a template selection approach based on Dynamic Time Warping, such that complex feature extraction and domain knowledge is avoided. We demonstrate the predictive capability of the algorithm on both simulated and real smartphone data. I. I NTRODUCTION Wearable sensors have widespread applications in aca- demic, industrial and medical fields. Examples of some current uses are fall detection in medical or home settings [1], and Hu- man Activity Recognition (HAR) for smart health-monitoring systems [2]. A substantial amount of research has been done with professional on-body wearable sensors. However, these devices are usually large, impractical or inconvenient for general commercial purposes. One viable alternative is smartphone sensors. Smartphones are equipped with accelerometers and gyroscopes, which provide rich motion data on their users. Although these sensors are less accurate than professional ones, the prevalence and convenience of smartphones suggests their potential for far-reaching applications. Possible benefits include a decreased need for human supervision in medical set- tings, more complex human-machine interaction, and complex activity recognition on smartphone applications. Our objective is an offline implementation of smartphone motion data classification that has comparable classification accuracy and computational efficiency with current techniques, and does not require domain knowledge of HAR. In this paper, we propose a method based on Dynamic Time Warping (DTW). DTW has recently been widely used and integrated with other methods such as decision trees [3] in machine learning. Although DTW suffers from high computa- tional costs and Dynamic Time Warping Distance (DTWD) is not a distance metric because it lacks the triangle inequality, DTW still has the potential to be a feasible answer to the above task by providing a flexible, easily interpretable time * All authors contributed equally in this work. series similarity measure. By modifying DTW to improve on computational efficiency and similarity measure accuracy, we proceed to use it for motion data clustering, activity template construction and classification for our problem. Each template is the time series average representing a cluster. It has the benefit of providing visual representations of a human activity and does not require HAR knowledge for construction. As such, the primary contributions of this paper are: 1) Modification of DTW as a similarity measure for time series, 2) Procedure for template extraction in place of feature extraction. Our implementation enhances the quality of prediction, avoids high dimensionality, and is robust to noise. For demon- stration, we use real human activity data, as well as synthetic data constructed from human activity data. In Section II, we proceed by discussing existing meth- ods for classifying human activities using feature extraction, hierarchical divide-and-conquer strategies, and multi-modal- sequence classification. Section III formally defines Dynamic Time Warping and Section IV describes our proposed modifi- cations to increase prediction accuracy. Section V discusses our template selection and classification approach which utilizes the modified DTW. In Sections VI and VII, we apply our algorithm to both real world data and synthetic data. Finally, in Section VIII and onwards, we compare the results of our algorithm with existing algorithms, and conclude. II. RELATED WORK Considerable work has been done on classifying human activities. We consolidate works on both professional on-body sensors and smartphone sensors, while taking note that data from the latter may need different pre-processing steps due to higher noise tendencies. Furthermore, on-body sensors can be placed at more assigned locations on the body such as arms and ankles, and may include more components such as magnetometer [1]. An essential step in many papers is feature extraction. Pop- ular features for such tasks include mean, standard deviation, maximum, peak-to-peak, root-mean-square, and correlation 978-1-4799-7560-0/15/$31 c 2015 IEEE arXiv:1512.06747v1 [cs.AI] 21 Dec 2015
Transcript of Multivariate Time Series Classification Using …Multivariate Time Series Classification Using...
Multivariate Time Series Classification UsingDynamic Time Warping Template Selection for
Human Activity Recognition
Skyler Seto*Department of Statistical Science
Cornell UniversityIthaca, NY, USA
Email: [email protected]
Wenyu Zhang*Department of Statistical Science
Cornell UniversityIthaca, NY, USA
Email: [email protected]
Yichen Zhou*Department of Statistical Science
Cornell UniversityIthaca, NY, USA
Email: [email protected]
Abstract—Accurate and computationally efficient means forclassifying human activities have been the subject of extensiveresearch efforts. Most current research focuses on extractingcomplex features to achieve high classification accuracy. Wepropose a template selection approach based on Dynamic TimeWarping, such that complex feature extraction and domainknowledge is avoided. We demonstrate the predictive capabilityof the algorithm on both simulated and real smartphone data.
I. INTRODUCTION
Wearable sensors have widespread applications in aca-demic, industrial and medical fields. Examples of some currentuses are fall detection in medical or home settings [1], and Hu-man Activity Recognition (HAR) for smart health-monitoringsystems [2].
A substantial amount of research has been done withprofessional on-body wearable sensors. However, these devicesare usually large, impractical or inconvenient for generalcommercial purposes. One viable alternative is smartphonesensors. Smartphones are equipped with accelerometers andgyroscopes, which provide rich motion data on their users.Although these sensors are less accurate than professionalones, the prevalence and convenience of smartphones suggeststheir potential for far-reaching applications. Possible benefitsinclude a decreased need for human supervision in medical set-tings, more complex human-machine interaction, and complexactivity recognition on smartphone applications.
Our objective is an offline implementation of smartphonemotion data classification that has comparable classificationaccuracy and computational efficiency with current techniques,and does not require domain knowledge of HAR.
In this paper, we propose a method based on DynamicTime Warping (DTW). DTW has recently been widely usedand integrated with other methods such as decision trees [3] inmachine learning. Although DTW suffers from high computa-tional costs and Dynamic Time Warping Distance (DTWD) isnot a distance metric because it lacks the triangle inequality,DTW still has the potential to be a feasible answer to theabove task by providing a flexible, easily interpretable time
* All authors contributed equally in this work.
series similarity measure. By modifying DTW to improve oncomputational efficiency and similarity measure accuracy, weproceed to use it for motion data clustering, activity templateconstruction and classification for our problem. Each templateis the time series average representing a cluster. It has thebenefit of providing visual representations of a human activityand does not require HAR knowledge for construction.
As such, the primary contributions of this paper are:
1) Modification of DTW as a similarity measure for timeseries,
2) Procedure for template extraction in place of featureextraction.
Our implementation enhances the quality of prediction,avoids high dimensionality, and is robust to noise. For demon-stration, we use real human activity data, as well as syntheticdata constructed from human activity data.
In Section II, we proceed by discussing existing meth-ods for classifying human activities using feature extraction,hierarchical divide-and-conquer strategies, and multi-modal-sequence classification. Section III formally defines DynamicTime Warping and Section IV describes our proposed modifi-cations to increase prediction accuracy. Section V discusses ourtemplate selection and classification approach which utilizesthe modified DTW. In Sections VI and VII, we apply ouralgorithm to both real world data and synthetic data. Finally,in Section VIII and onwards, we compare the results of ouralgorithm with existing algorithms, and conclude.
II. RELATED WORK
Considerable work has been done on classifying humanactivities. We consolidate works on both professional on-bodysensors and smartphone sensors, while taking note that datafrom the latter may need different pre-processing steps dueto higher noise tendencies. Furthermore, on-body sensors canbe placed at more assigned locations on the body such asarms and ankles, and may include more components such asmagnetometer [1].
An essential step in many papers is feature extraction. Pop-ular features for such tasks include mean, standard deviation,maximum, peak-to-peak, root-mean-square, and correlation978-1-4799-7560-0/15/$31 c©2015 IEEE
arX
iv:1
512.
0674
7v1
[cs
.AI]
21
Dec
201
5
between values of modality axes [4]. Another suggested optionis using autoregressive modeling to form augmented-featurevectors [5].
Following feature extraction, algorithms used for classi-fication include Hidden Markov Models [2], Support VectorMachines [4], Multi-layer Perceptron, Naive Bayes, BayesianNetwork, Decision Table, Best-First Tree, and K-star [6].Although the strategy can increase classification accuracy, itrequires manual grouping of the activities into meaningfulcategories. Comparative study across these algorithms has alsobeen done [7].
While feature extraction is quite popular in HAR forachieving high accuracy rates, there are a few problems withfeature extraction. First, it is dependent on domain expertiseas achieving high accuracy through feature extraction is onlypossible with the correct features. Second, feature extractionis prone to high dimensionality as a large number of featuresare needed. Finally computing some of these features such asautoregression coefficients can be computationally intensive.
Current DTW methods on HAR involve aligning humanbehavior in video data [8]. These methods use a generalizedtime warping mechanism to extend DTW to aligning multi-modal sequences [9]. While our proposed method discussed inSection IV uses DTW, we recognize that we cannot translatethese methods directly for our approach since the data modalityis different, and sequences extracted from video data may havedifferent properties from raw sensor readings.
III. DEFINITIONS
In this section, we state our definition and assumptions oftime series. We also introduce DTW.
A. Time Series
A p-dimensional multivariate time seriesXi = Xi(tl) ∈ Rp; l = 1, . . . ,m is a sequence of datapoints where:
1) tl < tl′ for l < l′,
2) tl ∈ T = [a, b], ∀l = 1, . . . ,m,
3) Xi(t) ∈ Rp,∀t ∈ T .
We assume our training and test data are time seriessatisfying the assumptions above, with the additional conditionthat ∆ti = ti−ti−1 = b−a
m−1 . We assume that all series have thesame length as observed in most data sets, but the followingDTW algorithms can be easily extended to the alternate case.
In the rest of this paper, we will refer to the length of atime series as m and the dimension of each point in the timeseries as p.
B. Dynamic Time Warping (DTW)
DTW is an algorithm for computing the distance andalignment between two time series. It is used in applicationssuch as speech recognition, and video activity recognition [8].
Definition 3.1: [10] A warping path is a sequence w =(w1, . . . , w|w|) where for k ∈ 1, . . . , |w|, wk = (pk, qk)with pk, qk ∈ 1, . . .m, satisfying the following conditions:
1) Boundary condition: w1 = (1, 1), w|w| = (m,m)
2) Monotonicity condition: pk|w|k=1, qk|w|k=1 aremonotonously non-decreasing sequences
3) Continuity condition:wk+1 − wk ∈ (1, 0), (0, 1), (1, 1)for k ∈ 1, . . . , |w| − 1
For simplicity, we write w = (p, q) as a path in accordancewith Definition 3.1
Definition 3.2: For time series Xi and Xj with distancematrix D as calculated in Algorithm 1, for a path w = (p, q),we define the cost c as:
c(w) =
|w|∑k=1
D[pk, qk]
Definition 3.3: The Dynamic Time Warping Distance(DTWD) is the sum of the pointwise distances along theoptimal path w∗, for the cost function defined in Definition3.2.
w∗ = argminw
c(w), DTWD (Xi, Xj) = c(w∗) = D[m,m].
DTW can be optimized through a bandwidth parameter bw,where it computes only values of the matrix close to the diago-nal. This version of DTW is called FastDTW [11]. Algorithm1 denotes the procedure to compute DTWD(Xi, Xj ; bw). Asmall bandwidth should be employed if the two time seriesdemonstrate the same shape and frequency, since a smallerbandwidth brings the computational time closer to O(m).
Data: time series Xi, Xj , bandwidth bwResult: DTWD(Xi, Xj ; bw)Initialize distance matrix D = 0m×mD[1, 1] = |Xi(1)−Xj(1)| for s ∈ 2, . . . ,m do
D[s, 1] = D[1, s] =∞endfor s ∈ 2, . . . ,m do
for t ∈ max(2, s− bw),min(m, s+ bw) docost=min (D[s− 1, t], D[s, t− 1], D[s− 1, t− 1])
D[s, t] = |Xi (s)−Xj (t)|+ cost
endendreturn D[m,m]
Algorithm 1: Fast DTW
One time series Xj can be aligned to another Xi by usingthe optimal path defined in Definition 3.3. The basic concept ofDTW alignment is illustrated in Figure 1. DTW first creates amatrix D of pointwise distances depicted as a black and whitegrid in the image on the right. The algorithm then runs throughD from the first index (bottom left) to the last index (top right),enumerates all paths w, and finds an optimal warping path w∗as specified in Definition 3.3. The optimal warping path isshown as the darkened line in the image on the right, and the
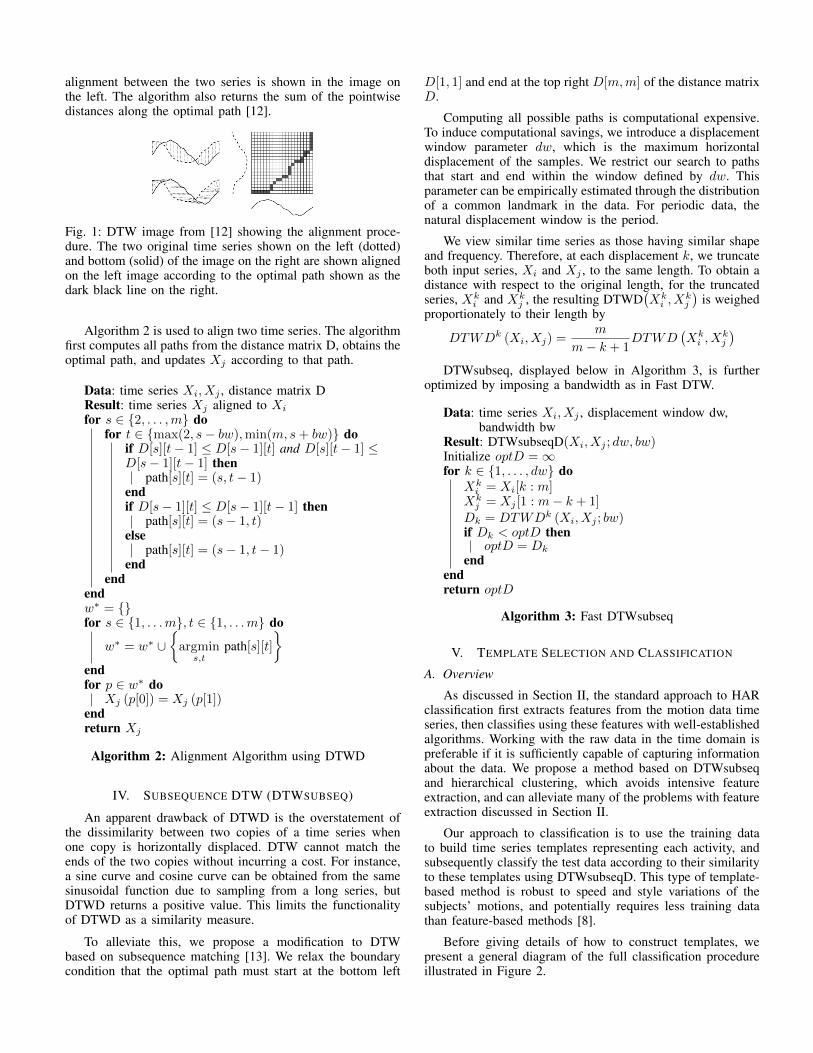
alignment between the two series is shown in the image onthe left. The algorithm also returns the sum of the pointwisedistances along the optimal path [12].
Fig. 1: DTW image from [12] showing the alignment proce-dure. The two original time series shown on the left (dotted)and bottom (solid) of the image on the right are shown alignedon the left image according to the optimal path shown as thedark black line on the right.
Algorithm 2 is used to align two time series. The algorithmfirst computes all paths from the distance matrix D, obtains theoptimal path, and updates Xj according to that path.
Data: time series Xi, Xj , distance matrix DResult: time series Xj aligned to Xi
for s ∈ 2, . . . ,m dofor t ∈ max(2, s− bw),min(m, s+ bw) do
if D[s][t− 1] ≤ D[s− 1][t] and D[s][t− 1] ≤D[s− 1][t− 1] then
path[s][t] = (s, t− 1)endif D[s− 1][t] ≤ D[s− 1][t− 1] then
path[s][t] = (s− 1, t)else
path[s][t] = (s− 1, t− 1)end
endendw∗ = for s ∈ 1, . . .m, t ∈ 1, . . .m do
w∗ = w∗ ∪
argmins,t
path[s][t]
endfor p ∈ w∗ do
Xj (p[0]) = Xj (p[1])endreturn Xj
Algorithm 2: Alignment Algorithm using DTWD
IV. SUBSEQUENCE DTW (DTWSUBSEQ)
An apparent drawback of DTWD is the overstatement ofthe dissimilarity between two copies of a time series whenone copy is horizontally displaced. DTW cannot match theends of the two copies without incurring a cost. For instance,a sine curve and cosine curve can be obtained from the samesinusoidal function due to sampling from a long series, butDTWD returns a positive value. This limits the functionalityof DTWD as a similarity measure.
To alleviate this, we propose a modification to DTWbased on subsequence matching [13]. We relax the boundarycondition that the optimal path must start at the bottom left
D[1, 1] and end at the top right D[m,m] of the distance matrixD.
Computing all possible paths is computational expensive.To induce computational savings, we introduce a displacementwindow parameter dw, which is the maximum horizontaldisplacement of the samples. We restrict our search to pathsthat start and end within the window defined by dw. Thisparameter can be empirically estimated through the distributionof a common landmark in the data. For periodic data, thenatural displacement window is the period.
We view similar time series as those having similar shapeand frequency. Therefore, at each displacement k, we truncateboth input series, Xi and Xj , to the same length. To obtain adistance with respect to the original length, for the truncatedseries, Xk
i and Xkj , the resulting DTWD
(Xk
i , Xkj
)is weighed
proportionately to their length by
DTWDk (Xi, Xj) =m
m− k + 1DTWD
(Xk
i , Xkj
)DTWsubseq, displayed below in Algorithm 3, is further
optimized by imposing a bandwidth as in Fast DTW.
Data: time series Xi, Xj , displacement window dw,bandwidth bw
Result: DTWsubseqD(Xi, Xj ; dw, bw)Initialize optD =∞for k ∈ 1, . . . , dw do
Xki = Xi[k : m]
Xkj = Xj [1 : m− k + 1]
Dk = DTWDk (Xi, Xj ; bw)if Dk < optD then
optD = Dk
endendreturn optD
Algorithm 3: Fast DTWsubseq
V. TEMPLATE SELECTION AND CLASSIFICATION
A. Overview
As discussed in Section II, the standard approach to HARclassification first extracts features from the motion data timeseries, then classifies using these features with well-establishedalgorithms. Working with the raw data in the time domain ispreferable if it is sufficiently capable of capturing informationabout the data. We propose a method based on DTWsubseqand hierarchical clustering, which avoids intensive featureextraction, and can alleviate many of the problems with featureextraction discussed in Section II.
Our approach to classification is to use the training datato build time series templates representing each activity, andsubsequently classify the test data according to their similarityto these templates using DTWsubseqD. This type of template-based method is robust to speed and style variations of thesubjects’ motions, and potentially requires less training datathan feature-based methods [8].
Before giving details of how to construct templates, wepresent a general diagram of the full classification procedureillustrated in Figure 2.
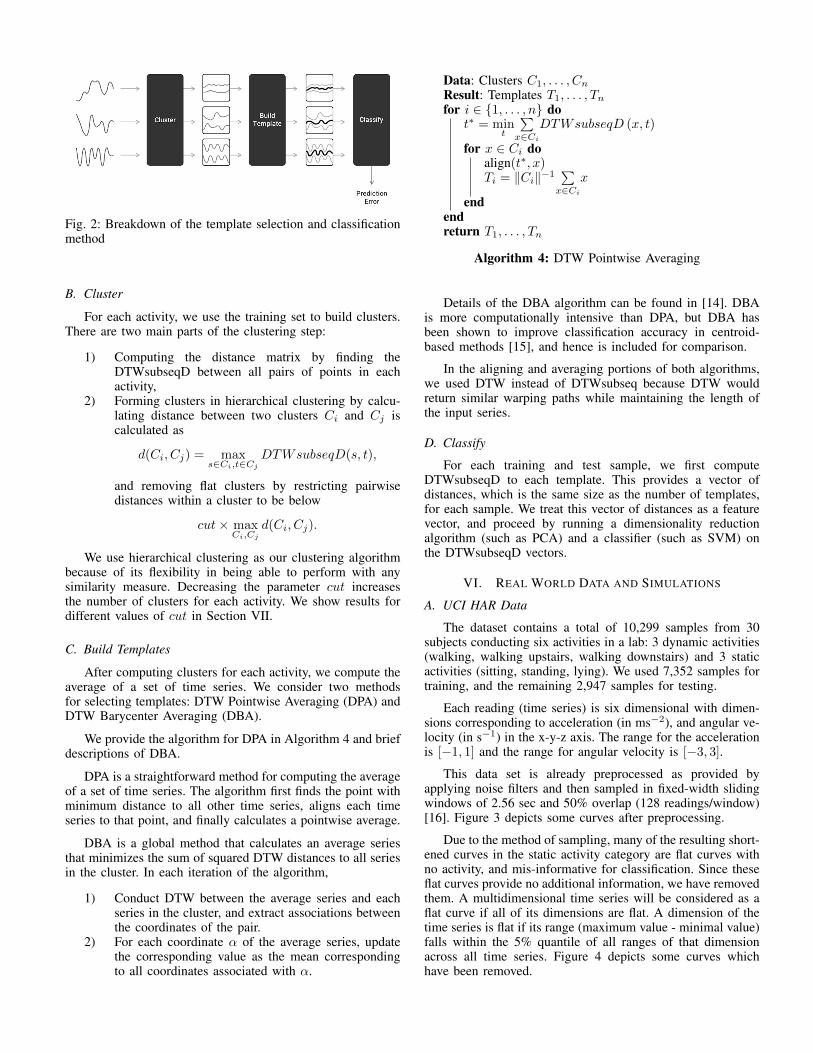
Fig. 2: Breakdown of the template selection and classificationmethod
B. Cluster
For each activity, we use the training set to build clusters.There are two main parts of the clustering step:
1) Computing the distance matrix by finding theDTWsubseqD between all pairs of points in eachactivity,
2) Forming clusters in hierarchical clustering by calcu-lating distance between two clusters Ci and Cj iscalculated as
d(Ci, Cj) = maxs∈Ci,t∈Cj
DTWsubseqD(s, t),
and removing flat clusters by restricting pairwisedistances within a cluster to be below
cut× maxCi,Cj
d(Ci, Cj).
We use hierarchical clustering as our clustering algorithmbecause of its flexibility in being able to perform with anysimilarity measure. Decreasing the parameter cut increasesthe number of clusters for each activity. We show results fordifferent values of cut in Section VII.
C. Build Templates
After computing clusters for each activity, we compute theaverage of a set of time series. We consider two methodsfor selecting templates: DTW Pointwise Averaging (DPA) andDTW Barycenter Averaging (DBA).
We provide the algorithm for DPA in Algorithm 4 and briefdescriptions of DBA.
DPA is a straightforward method for computing the averageof a set of time series. The algorithm first finds the point withminimum distance to all other time series, aligns each timeseries to that point, and finally calculates a pointwise average.
DBA is a global method that calculates an average seriesthat minimizes the sum of squared DTW distances to all seriesin the cluster. In each iteration of the algorithm,
1) Conduct DTW between the average series and eachseries in the cluster, and extract associations betweenthe coordinates of the pair.
2) For each coordinate α of the average series, updatethe corresponding value as the mean correspondingto all coordinates associated with α.
Data: Clusters C1, . . . , Cn
Result: Templates T1, . . . , Tnfor i ∈ 1, . . . , n do
t∗ = mint
∑x∈Ci
DTWsubseqD (x, t)
for x ∈ Ci doalign(t∗, x)Ti = ‖Ci‖−1
∑x∈Ci
x
endendreturn T1, . . . , Tn
Algorithm 4: DTW Pointwise Averaging
Details of the DBA algorithm can be found in [14]. DBAis more computationally intensive than DPA, but DBA hasbeen shown to improve classification accuracy in centroid-based methods [15], and hence is included for comparison.
In the aligning and averaging portions of both algorithms,we used DTW instead of DTWsubseq because DTW wouldreturn similar warping paths while maintaining the length ofthe input series.
D. Classify
For each training and test sample, we first computeDTWsubseqD to each template. This provides a vector ofdistances, which is the same size as the number of templates,for each sample. We treat this vector of distances as a featurevector, and proceed by running a dimensionality reductionalgorithm (such as PCA) and a classifier (such as SVM) onthe DTWsubseqD vectors.
VI. REAL WORLD DATA AND SIMULATIONS
A. UCI HAR Data
The dataset contains a total of 10,299 samples from 30subjects conducting six activities in a lab: 3 dynamic activities(walking, walking upstairs, walking downstairs) and 3 staticactivities (sitting, standing, lying). We used 7,352 samples fortraining, and the remaining 2,947 samples for testing.
Each reading (time series) is six dimensional with dimen-sions corresponding to acceleration (in ms−2), and angular ve-locity (in s−1) in the x-y-z axis. The range for the accelerationis [−1, 1] and the range for angular velocity is [−3, 3].
This data set is already preprocessed as provided byapplying noise filters and then sampled in fixed-width slidingwindows of 2.56 sec and 50% overlap (128 readings/window)[16]. Figure 3 depicts some curves after preprocessing.
Due to the method of sampling, many of the resulting short-ened curves in the static activity category are flat curves withno activity, and mis-informative for classification. Since theseflat curves provide no additional information, we have removedthem. A multidimensional time series will be considered as aflat curve if all of its dimensions are flat. A dimension of thetime series is flat if its range (maximum value - minimal value)falls within the 5% quantile of all ranges of that dimensionacross all time series. Figure 4 depicts some curves whichhave been removed.
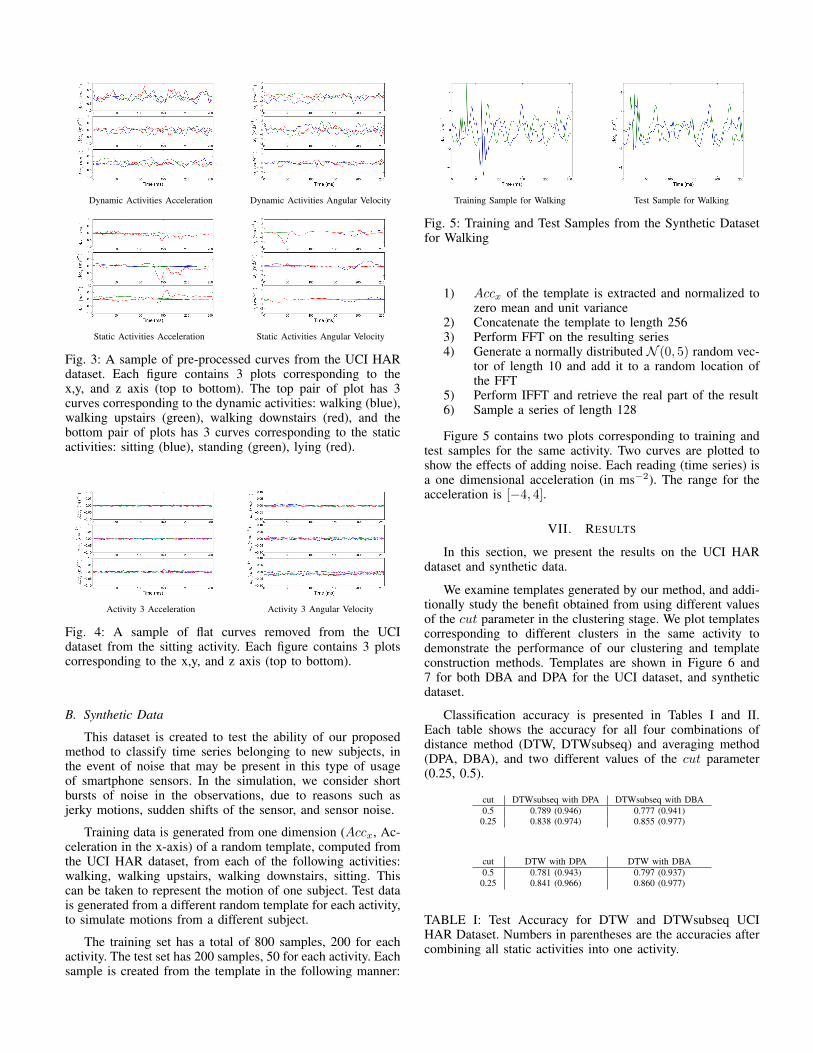
Dynamic Activities Acceleration Dynamic Activities Angular Velocity
Static Activities Acceleration Static Activities Angular Velocity
Fig. 3: A sample of pre-processed curves from the UCI HARdataset. Each figure contains 3 plots corresponding to thex,y, and z axis (top to bottom). The top pair of plot has 3curves corresponding to the dynamic activities: walking (blue),walking upstairs (green), walking downstairs (red), and thebottom pair of plots has 3 curves corresponding to the staticactivities: sitting (blue), standing (green), lying (red).
Activity 3 Acceleration Activity 3 Angular Velocity
Fig. 4: A sample of flat curves removed from the UCIdataset from the sitting activity. Each figure contains 3 plotscorresponding to the x,y, and z axis (top to bottom).
B. Synthetic Data
This dataset is created to test the ability of our proposedmethod to classify time series belonging to new subjects, inthe event of noise that may be present in this type of usageof smartphone sensors. In the simulation, we consider shortbursts of noise in the observations, due to reasons such asjerky motions, sudden shifts of the sensor, and sensor noise.
Training data is generated from one dimension (Accx, Ac-celeration in the x-axis) of a random template, computed fromthe UCI HAR dataset, from each of the following activities:walking, walking upstairs, walking downstairs, sitting. Thiscan be taken to represent the motion of one subject. Test datais generated from a different random template for each activity,to simulate motions from a different subject.
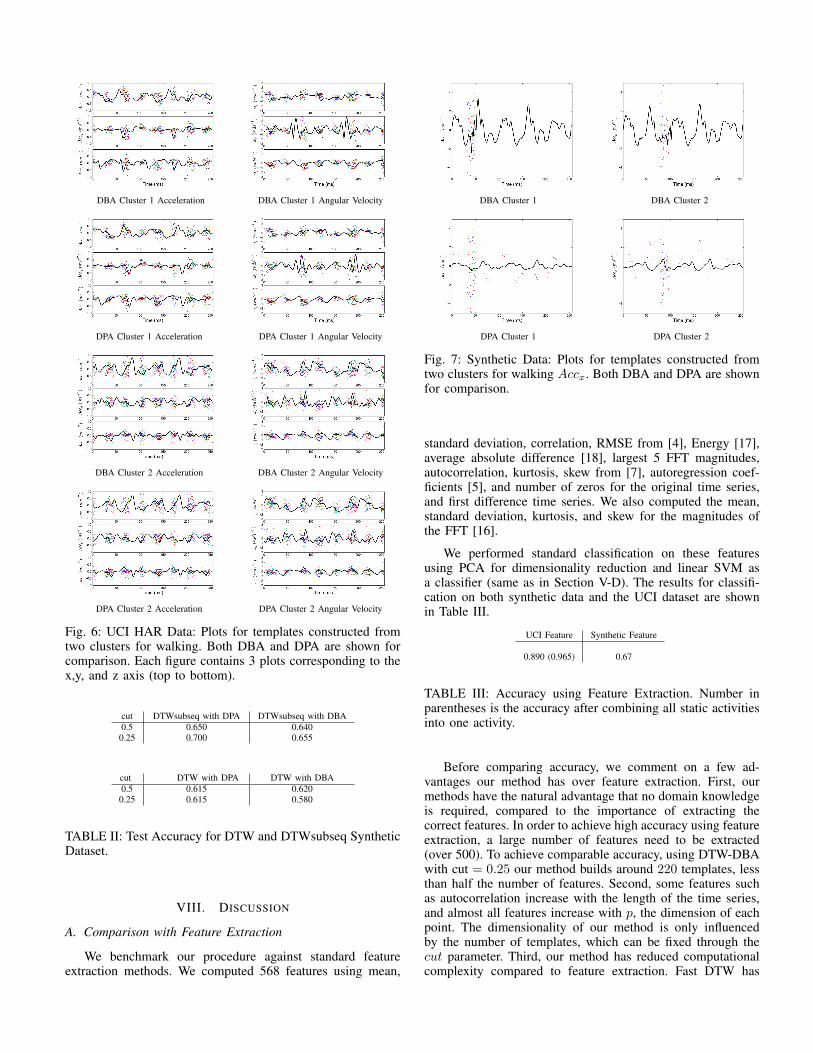
The training set has a total of 800 samples, 200 for eachactivity. The test set has 200 samples, 50 for each activity. Eachsample is created from the template in the following manner:
Training Sample for Walking Test Sample for Walking
Fig. 5: Training and Test Samples from the Synthetic Datasetfor Walking
1) Accx of the template is extracted and normalized tozero mean and unit variance
2) Concatenate the template to length 2563) Perform FFT on the resulting series4) Generate a normally distributed N (0, 5) random vec-
tor of length 10 and add it to a random location ofthe FFT
5) Perform IFFT and retrieve the real part of the result6) Sample a series of length 128
Figure 5 contains two plots corresponding to training andtest samples for the same activity. Two curves are plotted toshow the effects of adding noise. Each reading (time series) isa one dimensional acceleration (in ms−2). The range for theacceleration is [−4, 4].
VII. RESULTS
In this section, we present the results on the UCI HARdataset and synthetic data.
We examine templates generated by our method, and addi-tionally study the benefit obtained from using different valuesof the cut parameter in the clustering stage. We plot templatescorresponding to different clusters in the same activity todemonstrate the performance of our clustering and templateconstruction methods. Templates are shown in Figure 6 and7 for both DBA and DPA for the UCI dataset, and syntheticdataset.
Classification accuracy is presented in Tables I and II.Each table shows the accuracy for all four combinations ofdistance method (DTW, DTWsubseq) and averaging method(DPA, DBA), and two different values of the cut parameter(0.25, 0.5).
cut DTWsubseq with DPA DTWsubseq with DBA0.5 0.789 (0.946) 0.777 (0.941)0.25 0.838 (0.974) 0.855 (0.977)
cut DTW with DPA DTW with DBA0.5 0.781 (0.943) 0.797 (0.937)0.25 0.841 (0.966) 0.860 (0.977)
TABLE I: Test Accuracy for DTW and DTWsubseq UCIHAR Dataset. Numbers in parentheses are the accuracies aftercombining all static activities into one activity.
DBA Cluster 1 Acceleration DBA Cluster 1 Angular Velocity
DPA Cluster 1 Acceleration DPA Cluster 1 Angular Velocity
DBA Cluster 2 Acceleration DBA Cluster 2 Angular Velocity
DPA Cluster 2 Acceleration DPA Cluster 2 Angular Velocity
Fig. 6: UCI HAR Data: Plots for templates constructed fromtwo clusters for walking. Both DBA and DPA are shown forcomparison. Each figure contains 3 plots corresponding to thex,y, and z axis (top to bottom).
cut DTWsubseq with DPA DTWsubseq with DBA0.5 0.650 0.6400.25 0.700 0.655
cut DTW with DPA DTW with DBA0.5 0.615 0.6200.25 0.615 0.580
TABLE II: Test Accuracy for DTW and DTWsubseq SyntheticDataset.
VIII. DISCUSSION
A. Comparison with Feature Extraction
We benchmark our procedure against standard featureextraction methods. We computed 568 features using mean,
DBA Cluster 1 DBA Cluster 2
DPA Cluster 1 DPA Cluster 2
Fig. 7: Synthetic Data: Plots for templates constructed fromtwo clusters for walking Accx. Both DBA and DPA are shownfor comparison.
standard deviation, correlation, RMSE from [4], Energy [17],average absolute difference [18], largest 5 FFT magnitudes,autocorrelation, kurtosis, skew from [7], autoregression coef-ficients [5], and number of zeros for the original time series,and first difference time series. We also computed the mean,standard deviation, kurtosis, and skew for the magnitudes ofthe FFT [16].
We performed standard classification on these featuresusing PCA for dimensionality reduction and linear SVM asa classifier (same as in Section V-D). The results for classifi-cation on both synthetic data and the UCI dataset are shownin Table III.
UCI Feature Synthetic Feature
0.890 (0.965) 0.67
TABLE III: Accuracy using Feature Extraction. Number inparentheses is the accuracy after combining all static activitiesinto one activity.
Before comparing accuracy, we comment on a few ad-vantages our method has over feature extraction. First, ourmethods have the natural advantage that no domain knowledgeis required, compared to the importance of extracting thecorrect features. In order to achieve high accuracy using featureextraction, a large number of features need to be extracted(over 500). To achieve comparable accuracy, using DTW-DBAwith cut = 0.25 our method builds around 220 templates, lessthan half the number of features. Second, some features suchas autocorrelation increase with the length of the time series,and almost all features increase with p, the dimension of eachpoint. The dimensionality of our method is only influencedby the number of templates, which can be fixed through thecut parameter. Third, our method has reduced computationalcomplexity compared to feature extraction. Fast DTW has
complexity O(m), whereas most features have computationalcomplexity at least O(m), and some features such as autore-gression coefficients have computational complexity Ω
(m2).
B. UCI HAR Data
Figure 6 shows that our clustering scheme performs reason-ably well in grouping differently-shaped curves. Both templatemethods are able to capture the shape of the data. In fact, theDPA and DBA templates appear very similar to one another.
Judging from the classification accuracy results in TableI, for both cut = 0.5 and 0.25, DTW performs better withDBA, achieving 0.797 over 0.781 and 0.860 over 0.841 respec-tively. When cut = 0.25, DTWsubseq also does better withDBA, with accuracy 0.855 over 0.838. But when cut = 0.5,DTWsubseq performs better with DPA, achieving 0.789 over0.777.
One possible reason why DBA did not consistently workbetter is that the starting average sequence in DPA is initializedusing the same similarity measure (DTWD, DTWsubseqD) asis used for clustering. The starting average sequence in DBA isinitialized with a random candidate in the cluster, as suggestedin the original paper [14].
It’s possible that with a few modifications, such as pickingthe right initializing series for DBA, DTWsubseq-DBA withcut = 0.5 could achieve higher accuracy as it performswell in distinguishing between static and dynamic activities.It makes only 22 classification errors between static anddynamic activities, comparable to DTWsubseq-DPA, and hascomparable accuracy when considering 4 activities as shownin parentheses in Table I.
The effects of lowering the cut threshold are clear-cut. Asexpected, lowering the threshold (and increasing the numberof clusters) increased accuracy . With original DTW we seean increase in accuracy from 0.781 to 0.841 with DPA, andsubsequently up to 0.86 with DBA. Using DTWsubseq, wesee an increase with DBA, and a smaller increase with DPA.This may primarily be due to overfitting. Decreasing cut from0.5 to 0.25 increase the number of templates from around 50to over 500.
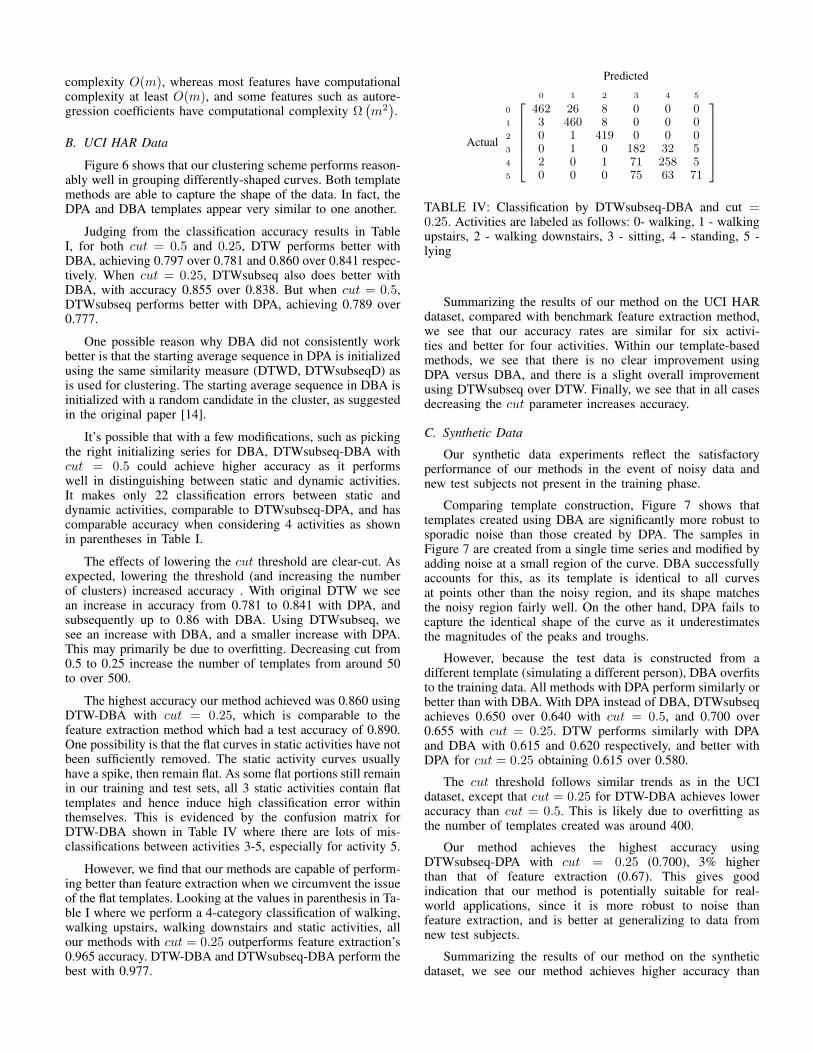
The highest accuracy our method achieved was 0.860 usingDTW-DBA with cut = 0.25, which is comparable to thefeature extraction method which had a test accuracy of 0.890.One possibility is that the flat curves in static activities have notbeen sufficiently removed. The static activity curves usuallyhave a spike, then remain flat. As some flat portions still remainin our training and test sets, all 3 static activities contain flattemplates and hence induce high classification error withinthemselves. This is evidenced by the confusion matrix forDTW-DBA shown in Table IV where there are lots of mis-classifications between activities 3-5, especially for activity 5.
However, we find that our methods are capable of perform-ing better than feature extraction when we circumvent the issueof the flat templates. Looking at the values in parenthesis in Ta-ble I where we perform a 4-category classification of walking,walking upstairs, walking downstairs and static activities, allour methods with cut = 0.25 outperforms feature extraction’s0.965 accuracy. DTW-DBA and DTWsubseq-DBA perform thebest with 0.977.
Predicted
Actual
0 1 2 3 4 5
0 462 26 8 0 0 01 3 460 8 0 0 02 0 1 419 0 0 03 0 1 0 182 32 54 2 0 1 71 258 55 0 0 0 75 63 71
TABLE IV: Classification by DTWsubseq-DBA and cut =0.25. Activities are labeled as follows: 0- walking, 1 - walkingupstairs, 2 - walking downstairs, 3 - sitting, 4 - standing, 5 -lying
Summarizing the results of our method on the UCI HARdataset, compared with benchmark feature extraction method,we see that our accuracy rates are similar for six activi-ties and better for four activities. Within our template-basedmethods, we see that there is no clear improvement usingDPA versus DBA, and there is a slight overall improvementusing DTWsubseq over DTW. Finally, we see that in all casesdecreasing the cut parameter increases accuracy.
C. Synthetic Data
Our synthetic data experiments reflect the satisfactoryperformance of our methods in the event of noisy data andnew test subjects not present in the training phase.
Comparing template construction, Figure 7 shows thattemplates created using DBA are significantly more robust tosporadic noise than those created by DPA. The samples inFigure 7 are created from a single time series and modified byadding noise at a small region of the curve. DBA successfullyaccounts for this, as its template is identical to all curvesat points other than the noisy region, and its shape matchesthe noisy region fairly well. On the other hand, DPA fails tocapture the identical shape of the curve as it underestimatesthe magnitudes of the peaks and troughs.
However, because the test data is constructed from adifferent template (simulating a different person), DBA overfitsto the training data. All methods with DPA perform similarly orbetter than with DBA. With DPA instead of DBA, DTWsubseqachieves 0.650 over 0.640 with cut = 0.5, and 0.700 over0.655 with cut = 0.25. DTW performs similarly with DPAand DBA with 0.615 and 0.620 respectively, and better withDPA for cut = 0.25 obtaining 0.615 over 0.580.
The cut threshold follows similar trends as in the UCIdataset, except that cut = 0.25 for DTW-DBA achieves loweraccuracy than cut = 0.5. This is likely due to overfitting asthe number of templates created was around 400.
Our method achieves the highest accuracy usingDTWsubseq-DPA with cut = 0.25 (0.700), 3% higherthan that of feature extraction (0.67). This gives goodindication that our method is potentially suitable for real-world applications, since it is more robust to noise thanfeature extraction, and is better at generalizing to data fromnew test subjects.
Summarizing the results of our method on the syntheticdataset, we see our method achieves higher accuracy than
benchmark feature extraction. Within the template-based meth-ods, we again see that there is no clear improvement using DPAversus DBA, but there is an improvement using DTWsubseqover DTW. Finally, we see that in almost all cases, decreasingthe cut parameter increases accuracy as expected.
D. Summary of Results
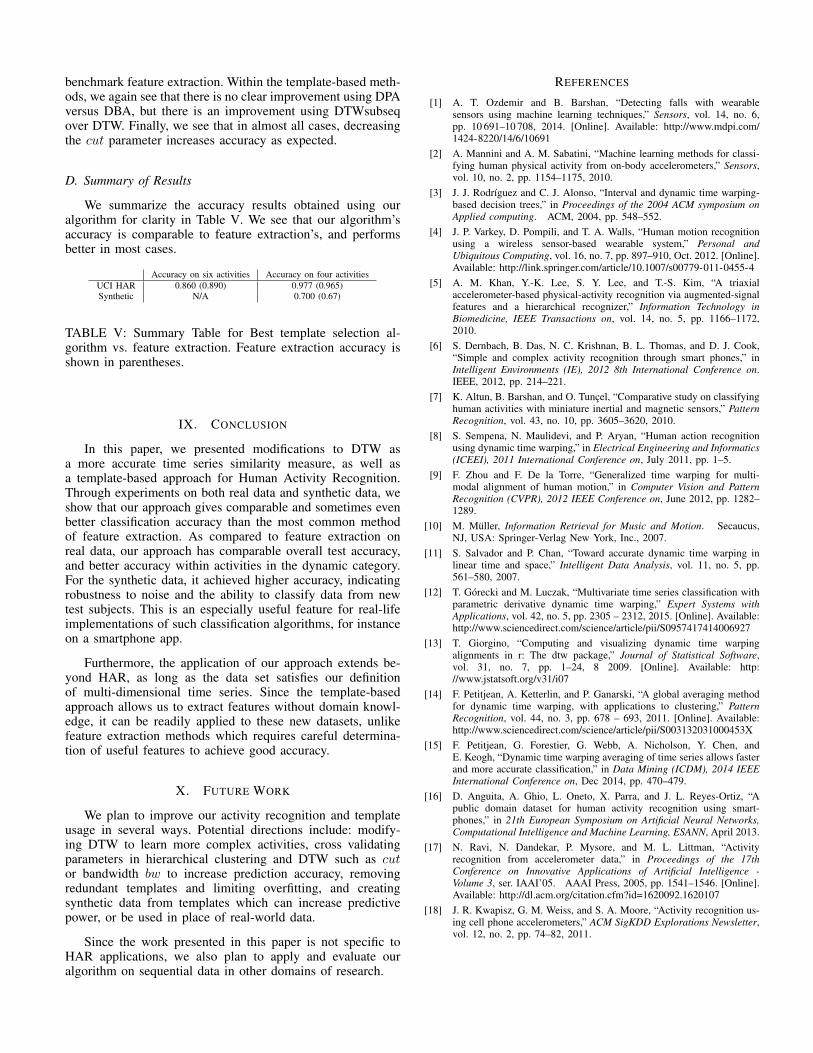
We summarize the accuracy results obtained using ouralgorithm for clarity in Table V. We see that our algorithm’saccuracy is comparable to feature extraction’s, and performsbetter in most cases.
Accuracy on six activities Accuracy on four activitiesUCI HAR 0.860 (0.890) 0.977 (0.965)Synthetic N/A 0.700 (0.67)
TABLE V: Summary Table for Best template selection al-gorithm vs. feature extraction. Feature extraction accuracy isshown in parentheses.
IX. CONCLUSION
In this paper, we presented modifications to DTW asa more accurate time series similarity measure, as well asa template-based approach for Human Activity Recognition.Through experiments on both real data and synthetic data, weshow that our approach gives comparable and sometimes evenbetter classification accuracy than the most common methodof feature extraction. As compared to feature extraction onreal data, our approach has comparable overall test accuracy,and better accuracy within activities in the dynamic category.For the synthetic data, it achieved higher accuracy, indicatingrobustness to noise and the ability to classify data from newtest subjects. This is an especially useful feature for real-lifeimplementations of such classification algorithms, for instanceon a smartphone app.
Furthermore, the application of our approach extends be-yond HAR, as long as the data set satisfies our definitionof multi-dimensional time series. Since the template-basedapproach allows us to extract features without domain knowl-edge, it can be readily applied to these new datasets, unlikefeature extraction methods which requires careful determina-tion of useful features to achieve good accuracy.
X. FUTURE WORK
We plan to improve our activity recognition and templateusage in several ways. Potential directions include: modify-ing DTW to learn more complex activities, cross validatingparameters in hierarchical clustering and DTW such as cutor bandwidth bw to increase prediction accuracy, removingredundant templates and limiting overfitting, and creatingsynthetic data from templates which can increase predictivepower, or be used in place of real-world data.
Since the work presented in this paper is not specific toHAR applications, we also plan to apply and evaluate ouralgorithm on sequential data in other domains of research.
REFERENCES
[1] A. T. Ozdemir and B. Barshan, “Detecting falls with wearablesensors using machine learning techniques,” Sensors, vol. 14, no. 6,pp. 10 691–10 708, 2014. [Online]. Available: http://www.mdpi.com/1424-8220/14/6/10691
[2] A. Mannini and A. M. Sabatini, “Machine learning methods for classi-fying human physical activity from on-body accelerometers,” Sensors,vol. 10, no. 2, pp. 1154–1175, 2010.
[3] J. J. Rodrıguez and C. J. Alonso, “Interval and dynamic time warping-based decision trees,” in Proceedings of the 2004 ACM symposium onApplied computing. ACM, 2004, pp. 548–552.
[4] J. P. Varkey, D. Pompili, and T. A. Walls, “Human motion recognitionusing a wireless sensor-based wearable system,” Personal andUbiquitous Computing, vol. 16, no. 7, pp. 897–910, Oct. 2012. [Online].Available: http://link.springer.com/article/10.1007/s00779-011-0455-4
[5] A. M. Khan, Y.-K. Lee, S. Y. Lee, and T.-S. Kim, “A triaxialaccelerometer-based physical-activity recognition via augmented-signalfeatures and a hierarchical recognizer,” Information Technology inBiomedicine, IEEE Transactions on, vol. 14, no. 5, pp. 1166–1172,2010.
[6] S. Dernbach, B. Das, N. C. Krishnan, B. L. Thomas, and D. J. Cook,“Simple and complex activity recognition through smart phones,” inIntelligent Environments (IE), 2012 8th International Conference on.IEEE, 2012, pp. 214–221.
[7] K. Altun, B. Barshan, and O. Tuncel, “Comparative study on classifyinghuman activities with miniature inertial and magnetic sensors,” PatternRecognition, vol. 43, no. 10, pp. 3605–3620, 2010.
[8] S. Sempena, N. Maulidevi, and P. Aryan, “Human action recognitionusing dynamic time warping,” in Electrical Engineering and Informatics(ICEEI), 2011 International Conference on, July 2011, pp. 1–5.
[9] F. Zhou and F. De la Torre, “Generalized time warping for multi-modal alignment of human motion,” in Computer Vision and PatternRecognition (CVPR), 2012 IEEE Conference on, June 2012, pp. 1282–1289.
[10] M. Muller, Information Retrieval for Music and Motion. Secaucus,NJ, USA: Springer-Verlag New York, Inc., 2007.
[11] S. Salvador and P. Chan, “Toward accurate dynamic time warping inlinear time and space,” Intelligent Data Analysis, vol. 11, no. 5, pp.561–580, 2007.
[12] T. Gorecki and M. Luczak, “Multivariate time series classification withparametric derivative dynamic time warping,” Expert Systems withApplications, vol. 42, no. 5, pp. 2305 – 2312, 2015. [Online]. Available:http://www.sciencedirect.com/science/article/pii/S0957417414006927
[13] T. Giorgino, “Computing and visualizing dynamic time warpingalignments in r: The dtw package,” Journal of Statistical Software,vol. 31, no. 7, pp. 1–24, 8 2009. [Online]. Available: http://www.jstatsoft.org/v31/i07
[14] F. Petitjean, A. Ketterlin, and P. Ganarski, “A global averaging methodfor dynamic time warping, with applications to clustering,” PatternRecognition, vol. 44, no. 3, pp. 678 – 693, 2011. [Online]. Available:http://www.sciencedirect.com/science/article/pii/S003132031000453X
[15] F. Petitjean, G. Forestier, G. Webb, A. Nicholson, Y. Chen, andE. Keogh, “Dynamic time warping averaging of time series allows fasterand more accurate classification,” in Data Mining (ICDM), 2014 IEEEInternational Conference on, Dec 2014, pp. 470–479.
[16] D. Anguita, A. Ghio, L. Oneto, X. Parra, and J. L. Reyes-Ortiz, “Apublic domain dataset for human activity recognition using smart-phones,” in 21th European Symposium on Artificial Neural Networks,Computational Intelligence and Machine Learning, ESANN, April 2013.
[17] N. Ravi, N. Dandekar, P. Mysore, and M. L. Littman, “Activityrecognition from accelerometer data,” in Proceedings of the 17thConference on Innovative Applications of Artificial Intelligence -Volume 3, ser. IAAI’05. AAAI Press, 2005, pp. 1541–1546. [Online].Available: http://dl.acm.org/citation.cfm?id=1620092.1620107
[18] J. R. Kwapisz, G. M. Weiss, and S. A. Moore, “Activity recognition us-ing cell phone accelerometers,” ACM SigKDD Explorations Newsletter,vol. 12, no. 2, pp. 74–82, 2011.