MULTIVARIATE MODEL FOR study CORPORATE ...seaopenresearch.eu/Journals/articles/NIS_7_6.pdfCORPORATE...
15
Network Intelligence Studies Volume IV, Issue 1 (7) / 2016 69 Daniel BRÎNDESCU – OLARIU West University of Timisoara MULTIVARIATE MODEL FOR CORPORATE BANKRUPTCY PREDICTION IN ROMANIA Empirical study Keywords Discriminant analysis Risk Failure Financial ratios Classification accuracy Benchmark JEL Classification G33, M10 Abstract The current paper proposes a methodology for bankruptcy prediction applicable for Romanian companies. Low bankruptcy frequencies registered in the past have limited the importance of bankruptcy prediction in Romania. The changes in the economic environment brought by the economic crisis, as well as by the entrance in the European Union, make the availability of performing bankruptcy assessment tools more important than ever before. The proposed methodology is centred on a multivariate model, developed through discriminant analysis. Financial ratios are employed as explanatory variables within the model. The study has included 53,252 yearly financial statements from the period 2007 – 2010, with the state of the companies being monitored until the end of 2012. It thus employs the largest sample ever used in Romanian research in the field of bankruptcy prediction, not targeting high levels of accuracy over isolated samples, but reliability and ease of use over the entire population.
Transcript of MULTIVARIATE MODEL FOR study CORPORATE ...seaopenresearch.eu/Journals/articles/NIS_7_6.pdfCORPORATE...

Network Intelligence Studies
Volume IV, Issue 1 (7) / 2016
69
Daniel BRÎNDESCU – OLARIU West University of Timisoara
MULTIVARIATE MODEL FOR CORPORATE BANKRUPTCY PREDICTION IN ROMANIA
Empirical study
Keywords Discriminant analysis
Risk Failure
Financial ratios Classification accuracy
Benchmark
JEL Classification G33, M10
Abstract
The current paper proposes a methodology for bankruptcy prediction applicable for Romanian companies. Low bankruptcy frequencies registered in the past have limited the importance of bankruptcy prediction in Romania. The changes in the economic environment brought by the economic crisis, as well as by the entrance in the European Union, make the availability of performing bankruptcy assessment tools more important than ever before. The proposed methodology is centred on a multivariate model, developed through discriminant analysis. Financial ratios are employed as explanatory variables within the model. The study has included 53,252 yearly financial statements from the period 2007 – 2010, with the state of the companies being monitored until the end of 2012. It thus employs the largest sample ever used in Romanian research in the field of bankruptcy prediction, not targeting high levels of accuracy over isolated samples, but reliability and ease of use over the entire population.

Network Intelligence Studies
Volume IV, Issue 1 (7) / 2016
70
INTRODUCTION
During the last years, the corporate bankruptcy
yearly frequency has increased continuously in
Romania, reaching almost 3% by the end of 2013,
with almost 30,000 bankruptcy cases (as shown in
figure 1) to aproximatively 1,000,000 existing
companies.
Before 2007, the importance of the bankruptcy
phenomenon from a macroeconomic perspective
was limited in Romania, as there was little culture
for bankruptcy filing at microeconomic level.
The evolution of the yearly bankruptcy ratio was
marked by the popularization of the bankruptcy
law, the economic crisis, the entrance of Romania
in the European Union, as well as by an increase in
the loan default ratio, Romania topping in this
regard at the end of 2012 the 4th place within the
European Union and 6th place worldwide in a
ranking which included 131 countries (Brîndescu-
Olariu, 2014d).
With the bankruptcy not representing a concerning
phenomenon in the past, limited efforts were made
at national level for the development of specific
bankruptcy risk assessment tools. Instead, the
scientific interest for the assessment of the
bankruptcy risk was purely theoretical, with most
researchers settling for testing foreign models for
bankruptcy prediction over small isolated samples
of Romanian companies. Several national models
were elaborated over time, but the development
methodologies were relatively superficial, as the
public interest for the subject was low. The
increase of the annual bankruptcy frequency has
made the public significantly more aware of the
phenomenon. The state of bankruptcy affects all the
stakeholders of the company, which makes the
existence of instruments for bankruptcy prediction
important.
Assessment of the default risk in general and of the
bankruptcy risk in particular has always been in the
centre of the financial ratios analysis (Brîndescu-
Olariu, 2014a). Introduced in the USA in the
1860s, the financial ratios analysis only became
popular in the continental Europe in the 1960s. The
initial approaches of the financial ratios analysis in
the prediction of bankruptcy were univariate. Some
of the most important early contributions in this
field include (Yadav, 1986):
o the study conducted by J.R. Ramster and L.O.
Foster in 1931 over a sample of 173
companies;
o the study conducted by FitzPatrick in 1932
over a sample of 38 de companies, of which 19
were bankrupt and 19 were healthy;
o the study conducted by Raymond Smith and
Winakor Arthur in 1935 over a sample of 183
companies that failed over the period 1923-
1931;
o the study conducted by Charles Merwin in
1942, over a sample of 900 companies.
The scientific literature usually credits Eduard
Altman as the author of the first multivariate model
for the prediction of corporate bankruptcy.
Nevertheless, Meir Tamari (1966) proposed a
multivariate model 2 years prior to the issue of
Altman’s famous paper.
Inspired by the models developed by Altman
(1968) through discriminant analysis and later on
by Ohlson (1980), through logistic regression,
multivariate studies in the field of bankruptcy
prediction have been performed all over the world
during the last 50 years. Some of the more recent
multivariate studies are presented in table 1.
The initial multivariate studies were performed on
paired samples. This approach still persists to great
extent today (17 of the 40 randomly selected papers
from table 1, used paired samples).
The different models and respective methodologies
of analysis proposed remain strictly related to the
populations on which they were developed. Thus,
each model has applicability for a certain region, a
certain type of company, period of time or
accounting system. The lack of homogeneity of the
population of companies worldwide has made the
elaboration of a general accepted financial ratios
analysis methodology impossible.
In Romania, many corporate stakeholders use
methodologies of analysis developed in other
countries, on companies with different profiles,
over different periods of time and for other
accounting systems. These methodologies are not
adapted to the Romanian economic environment
and, in many cases, present no transparent
scientific background. Nevertheless, they represent
important foundations in the decision-making
processes of the stakeholders.
Over the last 20 years several national models for
the prediction of bankruptcy were developed
(Brîndescu-Olariu, 2014a). Still, the majority of
these models were affected by deficiencies in terms
of statistical methodology or by the use of isolated
samples that did not allow for applicability over all
Romanian companies:
• 1996: Mânecuță and Nicolae model
(Bordeianu et. al., 2011);
• 1998: Băileșteanu model (Băileșteanu, 1998);
• 1998: Ivoniciu model (Bordeianu et. al.,
2011) ;
• 2002: Lorant-Eros Stark model;
• 2002: Anghel model (Anghel, 2002);
• 2010: Cârciumaru model (Cârciumaru, 2010);
• 2010: Căprariu model (Căprariu, 2010);
• 2010: Caracota, Dumitru and Dinu model
(Caracota, Dumitru, and Dinu, 2010) ;
• 2011: Bătrâncea model (Bătrâncea, 2011);
• 2012: Armeanu model (Armeanu et.al. 2012);
• 2012: Vintilă and Toroapă model (Vintilă and
Toroapă, 2012);

Network Intelligence Studies
Volume IV, Issue 1 (7) / 2016
71
• 2012: Mironiuc M., Robu M. and Robu I.
Model (Mironiuc, Robu and Robu, 2012);
• 2013: Andreica model (Andreica, 2013).
Because of their lack of performance, the national
models are generally ignored in the university
environment and absent in the practice of the
financial ratios analysis. Instead, older models from
overseas are more valued (the Altman model from
1968, the Conan-Holder model, the Central Bank
of France model).
Under these circumstances, the current
study sets to create a multivariate model applicable
in the Romanian practice.
Recent studies over the same population
(Brîndescu-Olariu, 2014a, Brîndescu-Olariu,
2014b, Brîndescu-Olariu, 2014c) proved the
potential of the financial ratios in the prediction of
bankruptcy 2 years in advance. The current
research attempts to increase the accuracy of the
prediction by providing a multivariate model that
would combine the potential of several ratios.
1. POPULATION
The population initially subjected to the analysis
included all the companies from the Timis County
(largest county in Romania) that submitted
financial statements to the fiscal authorities in the
period 2001 – 2011 (247,037 yearly financial
statements).
Financial ratio analysis was not considered
applicable for companies with no yearly income, as
the continuity of the operating activity represents a
fundamental hypothesis of the financial ratio
analysis.
Three phenomena with national impact were also
considered for their potential of changing the
profile of the companies that declare bankruptcy:
o The changes brought to the laws concerning
bankruptcy through the adoption of law
85/2006;
o The entrance within the European Union in
2007;
o The manifestation of the economic crisis
starting with the last quarter of 2008.
Under these circumstances, it was concluded that
the initial population shows important problems of
homogeneity, which do not recommend a unitary
treatment:
o The companies with no activity cannot be
evaluated based on the same methodology as
the companies with a financial history;
o The companies that became bankrupt after the
issue of law 85/2006 show different
characteristics compared to the companies that
went bankrupt before 2007, under different
laws;
o The cases of bankruptcy registered after 2009
have different causes compared to the cases
appeared before the beginning of the economic
crisis.
Taking all the aforementioned differences into
account, the initial population was adjusted:
o only financial statements from the period 2007
– 2010 were retained;
o all the yearly financial statements that reported
sales under 10000 lei (aprox. 2200 Euros) were
excluded.
The research targeted the risk of bankruptcy after 2
years from the date of the financial statements
taken as reference in the analysis. As the interest
was focused on the phenomenon of bankruptcy
during the crisis period, the first financial
statements included in the study were from 2007.
The last year for which data concerning the status
of the companies was available was 2012. Under
these circumstances, the last financial statements
included in the study were those from 2010.
Financial statements from 2011 were available, but
information concerning the status of the companies
at the end of 2013 was not.
Holding all the above into account, the target
population included all companies from Timis
County that submitted yearly financial statements
to the fiscal authorities during the period 2007-
2010 and that registered yearly sales of at least
10000 lei (aprox. 2200 Euros).
In accordance, 53,252 financial statements from the
period 2007-2010 were included in the analysis.
The companies of which financial statements were
included for one year were not necessarily included
for the following periods. As the study did not
target a dynamics analysis, the yearly financial
statements can be regarded as individual subjects.
The source of the data was represented by the
online publications of the Ministry of Public
Finances of Romania.
2. METHODOLOGY
In the purpose of combining the potential of
individual financial ratios, the development of a
multivariate model through discriminant analysis
was targeted. The discriminant analysis was chosen
as it is the most popular and one of the most
accurate methods (alongside logistic regression).
The data was processed by using the SPSS
software. The state of the company two years from
the date of the financial statements of reference was
defined as a binary variable that can take the
following values:
o 1, for the companies that went bankrupt 2
years after the date of the financial statements
of reference;
o 0, for the companies that continued their
activity under normal conditions at least until
the end of 2012.
In order to simplify the explanations, the
companies that went bankrupt 2 years after the date
of the financial statements of reference will simply
be referred to as „bankrupt”, while the companies
Network Intelligence Studies
Volume IV, Issue 1 (7) / 2016
72
that continued their activity under normal
conditions at least until the end of 2012 will be
referred to as „non-bankrupt”.
When defining the target population, the companies
that close their activity for other reasons than
bankruptcy during the period of analysis were
excluded.
As an example, the value of the variable „State”
was „1” for the companies that went bankrupt in
2011 and it was associated with the financial ratios
of the respective companies from 2009. These
companies were not included in the analysis for the
following years (for 2010 with the financial
statements and for 2012 with the state variable),
even if they still existed.
The purpose of the discriminant analysis performed
within the SPSS environment was to elaborate a
model capable of predicting the membership of a
company within one of the two predefined groups
(bankrupt companies or non-bankrupt companies).
As the classification would be made between only
2 groups, the model would be based on only one
discriminant function.
Financial ratios from 2 years prior to the date of the
variable „State” were used as independent variables
within the discriminant function. The result of the
discriminant function for each company would not
be a probability of bankruptcy, but a score. Based
on the value of its score, a company could be
associated with a certain probability of bankruptcy.
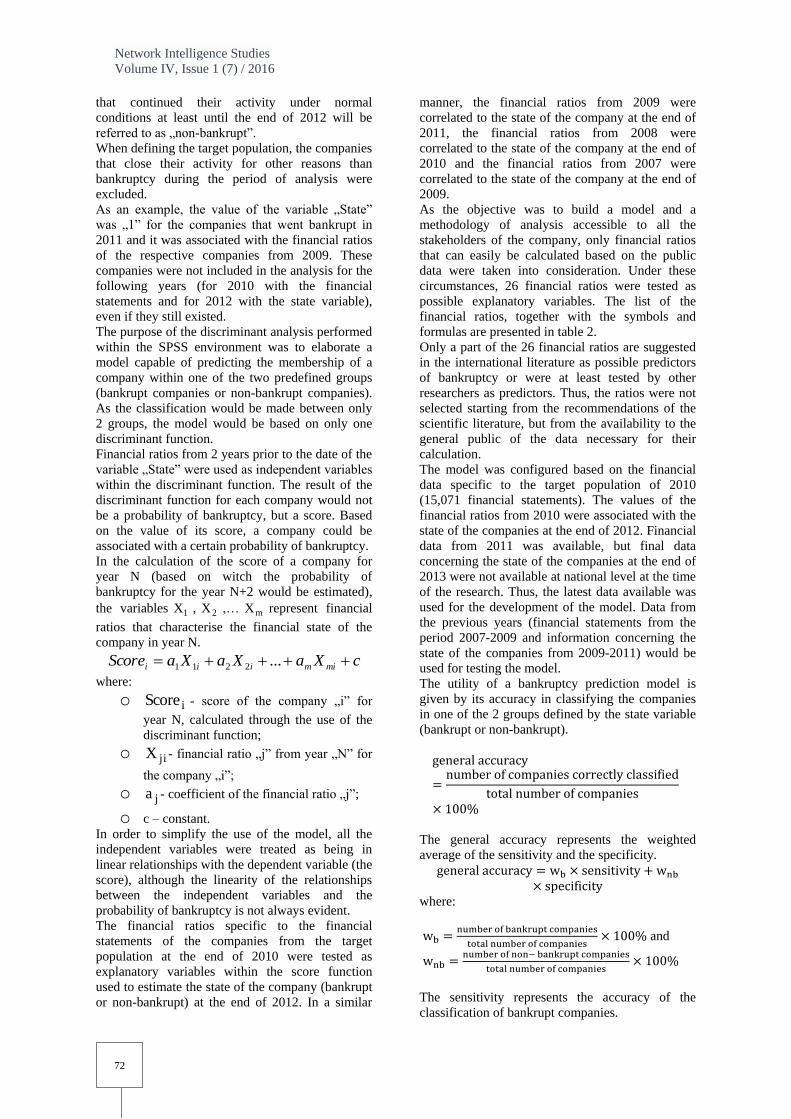
In the calculation of the score of a company for
year N (based on witch the probability of
bankruptcy for the year N+2 would be estimated),
the variables 1X , 2X ,… mX represent financial
ratios that characterise the financial state of the
company in year N.
cXaXaXaScore mimiii ...2211
where:
o iScore - score of the company „i” for
year N, calculated through the use of the
discriminant function;
o jiX - financial ratio „j” from year „N” for
the company „i”;
o ja - coefficient of the financial ratio „j”;
o c – constant.
In order to simplify the use of the model, all the
independent variables were treated as being in
linear relationships with the dependent variable (the
score), although the linearity of the relationships
between the independent variables and the
probability of bankruptcy is not always evident.
The financial ratios specific to the financial
statements of the companies from the target
population at the end of 2010 were tested as
explanatory variables within the score function
used to estimate the state of the company (bankrupt
or non-bankrupt) at the end of 2012. In a similar
manner, the financial ratios from 2009 were
correlated to the state of the company at the end of
2011, the financial ratios from 2008 were
correlated to the state of the company at the end of
2010 and the financial ratios from 2007 were
correlated to the state of the company at the end of
2009.
As the objective was to build a model and a
methodology of analysis accessible to all the
stakeholders of the company, only financial ratios
that can easily be calculated based on the public
data were taken into consideration. Under these
circumstances, 26 financial ratios were tested as
possible explanatory variables. The list of the
financial ratios, together with the symbols and
formulas are presented in table 2.
Only a part of the 26 financial ratios are suggested
in the international literature as possible predictors
of bankruptcy or were at least tested by other
researchers as predictors. Thus, the ratios were not
selected starting from the recommendations of the
scientific literature, but from the availability to the
general public of the data necessary for their
calculation.
The model was configured based on the financial
data specific to the target population of 2010
(15,071 financial statements). The values of the
financial ratios from 2010 were associated with the
state of the companies at the end of 2012. Financial
data from 2011 was available, but final data
concerning the state of the companies at the end of
2013 were not available at national level at the time
of the research. Thus, the latest data available was
used for the development of the model. Data from
the previous years (financial statements from the
period 2007-2009 and information concerning the
state of the companies from 2009-2011) would be
used for testing the model.
The utility of a bankruptcy prediction model is
given by its accuracy in classifying the companies
in one of the 2 groups defined by the state variable
(bankrupt or non-bankrupt).
The general accuracy represents the weighted
average of the sensitivity and the specificity.
where:
and
The sensitivity represents the accuracy of the
classification of bankrupt companies.

Network Intelligence Studies
Volume IV, Issue 1 (7) / 2016
73
The specificity represents the accuracy of the
classification of non-bankrupt companies.
In general, a model is considered useful if it can
ensure an out-of-sample general accuracy of more
than 25% over the “by chance” general accuracy
(Chung, K., Tan, S., Holdsworth, D., 2008). As
bankruptcy represents a “rare” phenomenon over
the target population, the “by chance” general
accuracy is very high (over 95%). No matter the
intrinsic classifying performance of a model, by
choosing a cut-off value that would lead to the
classification of all companies as non-bankrupt, the
general accuracy would equal the specificity (over
97%).
Most of the models available in the international
literature cannot ensure even in-sample general
accuracies at least equal to the „by chance” general
accuracies. Of the 40 models presented in table 1,
the highest reported in-sample (paired sample of 54
companies) accuracy was of 95.60% (Ugurlu and
Aksoy, 2006).
Considering that the current research targets to
develop a model that only employs data easily
available to all stakeholders, an out-of-sample
general accuracy close to 100% does not constitute
a reasonable objective.
Instead, the purpose of the model would be to
ensure the classification of the analysed companies
on risk classes.
In practice, using the model, the analyst should
expect every analysed company not to go bankrupt
(the model would not indicate a probability of
bankruptcy higher than 0.5), but it will be possible
to evaluate the bankruptcy risk as higher or lower
than the average.
In a first stage, the prediction capabilities of each of
the 26 ratios were tested on the population of 2010
(the financial statements of 2010). The
performance of each ratio was not evaluated
through its general accuracy, but through its in-
sample Area Under the ROC Curve (AUC), one of
the most viable solutions in the valuation of the
performance of a classifier (Hanely, McNeil, 1982,
Faraggi and Reiser, 2002). The ROC Curve
graphically reflects the relationship between the
sensitivity and the specificity for all possible cut-
off values (van Erkel, Pattynama, 1998).
The purpose of the tests was not to obtain practical
tools of analysis, but to observe the individual
potential of the ratios. Together with information
concerning the inter correlations, AUC specific to
each ratio in the approach was used in a second
stage as reference for grouping the ratios into
multivariate models.
The multivariate models were compared by their
in-sample AUC. The model with the highest in-
sample AUC was retained.
In a third stage, the model was tested in terms of
out-of-sample performance through the AUC over
the entire population for the period 2007-2009.
Many of the models presented by the international
literature were elaborated based on paired –
samples. The preference for the paired-samples is
based on the possibility of evaluating the model by
its general accuracy (as within the paired – sample
the percentage of the bankrupt companies is equal
to the percentage of the non-bankrupt companies
and, therefore, the general accuracy cannot be
manipulated through the choice of the cut-off
value). The paired sample approach is usually
criticised for artificially altering the structure of the
sample (compared to the structure of the
population), which is expected to lead to important
differences between in-sample and out-of-sample
performance. The current research avoided the
paired sample approach for the configuration stage,
in order to avoid the inherent out-of-sample
performance losses. Nevertheless, once the model
has been configured, it was also tested over a
paired sample, which allowed for an evaluation of
the performance in terms of general accuracy. The
paired sample included all the companies from the
target population that went bankrupt in the period
2009 – 2012 (712 companies). The financial
statements taken into analysis were specific to the
period 2007 – 2010. Within the sample, each
company that went bankrupt was associated with a
company from the same field of activity, with the
same yearly turnover, that continued its activity
under normal circumstances. Thus, the paired
sample contained 1424 companies: 712 companies
that went bankrupt within the period 2009 – 2012
and 712 companies that continued their activities
under normal circumstances beyond the end of
2012. The scores specific to the proposed model
were calculated for each company included in the
sample. As the weight of the bankrupt companies
within the paired sample is the same as that of the
non-bankrupt companies, the general accuracy
cannot be manipulated by choosing a cut-off value
that maximises the accuracy in the classification of
the predominant group. Thus, attention was not
paid to the specificity and the sensitivity, but only
to the general accuracy. The model would be
considered of practical use if it could ensure a
general accuracy 25% higher than the “by chance”
accuracy. Over a paired sample, the “by chance”
accuracy is of 50%, which establishes the
benchmark for the acceptance of a model at 62.5%.
Initially, the cut-off value that maximises the

Network Intelligence Studies
Volume IV, Issue 1 (7) / 2016
74
general accuracy over the 2010 paired sample (the
companies that were included with their 2010
financial statements) was determined. For this, the
ROC Curve for the 2010 paired sample was built.
The cut-off value was determined through the
inspection of the coordinating points of the ROC
Curve. To also evaluate the stability of the model in
time, the general accuracies over the paired
samples form 2007 – 2009 were determined by
using the optimal cut-off value for the 2010 paired
sample.
3. RESULTS
Initially, the prediction capabilities of each of the
26 ratios were tested on the population of 2010
through their in-sample Area Under the ROC
Curve (figure 2).
The ratios that showed the highest performances
were:
o Equity working capital;
o Labour productivity in terms of profits;
o Cash to total debt ratio;
o Profitability ratio;
o Equity working capital to sales ratio.
The ratios that showed inter correlations were:
o Fixed assets ratio – Current assets ratio;
o Autonomy ratio – Debt ratio;
o Inventory conversion ratio – Tax to sales
ratio;
o Autonomy ratio – Total assets turnover
ratio;
o Equity working capital – Labor
productivity in terms of profits;
o Profitability ratio – Equity working
capital;
o Cash to total debt ratio – Solvency ratio;
o Current assets to total debt ratio – Cash to
total debt ratio.
Through the use of discriminant analysis, different
ratio combinations were developed into models.
Combinations of ratios without important inter
correlations were granted priority. Still,
combinations that included ratios with medium
inter correlations were tested also.
Each model was evaluated by its in-sample AUC
(the AUC over the 2010 population). The AUCs
specific to the 10 best performing models are
presented in figure 3.
The financial ratios included in the models were:
o Model 1: Total assets turnover ratio,
Autonomy ratio;
o Model 2: Total assets turnover ratio,
Profitability ratio;
o Model 3: Autonomy ratio, Profitability
ratio;
o Model 4: Autonomy ratio, Profitability
ratio, Equity working capital;
o Model 5: Profitability ratio, Equity
working capital;
o Model 6: Profitability ratio, Equity
working capital, Receivables collection period;
o Model 7: Profitability ratio, Equity
working capital, Receivables collection period,
Fixed assets ratio;
o Model 8: Equity working capital,
Receivables collection period, Cash to total debt
ratio;
o Model 9: Profitability ratio, Equity
working capital, Receivables collection period,
Labour productivity in terms of profits;
o Model 10: Profitability ratio, Equity
working capital, Receivables collection period,
Labour productivity in terms of profits, Equity to
fixed assets ratio.
Although some inter correlations exist between the
Profitability ratio and the Equity working capital,
as well as between the Equity working capital and
the Labour productivity in terms of profits, model
10 was selected as it showed the highest in-sample
AUC (0.744).
The model has the following form:
where:
o S – the score calculated for the analysed
company;
o 0.085 – constant;
o LPp - Labour productivity in terms of
profits;
o RCP - Receivables collection period;
o EFAr - Equity to fixed assets ratio;
o Ewc - Equity working capital;
o Pr - Profitability ratio.
The score calculated for a company based on its
financial statements at the end of year N should
provide information regarding the risk of
bankruptcy for the year N+2.
The model was tested in terms of out-of-sample
performance through the AUC over the entire
population for the period 2007-2009.
The evaluation of models by their AUCs is usually
based on the following grid (Tazhibi, Bashardoost
și Ahmadi, 2011):
o 0.5 – 0.6: fail;
o 0.6 – 0.7: poor;
o 0.7 – 0.8: fair;
o 0.8 – 0.9: good;
o 0.9 – 1: excellent.
Thus, the accuracy of the proposed model can be
considered as fair.
Additional performance tests were made through
the general accuracy of the model over the paired
sample. Initially, the ROC Curve for the 2010

Network Intelligence Studies
Volume IV, Issue 1 (7) / 2016
75
paired sample was built. Through the inspection of
the coordinating points of the ROC Curve, the cut-
off value of the score S which maximizes the in-
sample general accuracy was determined (-0.016).
By classifying all the companies from the 2010
sample with scores lower than -0.016 as bankrupt
and all the companies from the 2010 sample with
scores higher than -0.016 as non-bankrupt, the
general accuracy would be of 66.9% (over the
62.5% benchmark). The optimal cut-off value
shows small variations from one year to another
(figure 5).
Using the optimal cut-value of 2010 for all 4 years
included in the research, the general accuracy of the
classification remains over the 62.5% benchmark
(figure 6), which sustains the practical use of the
model.
Although the model shows potential in the
estimation of the bankruptcy risk, the prediction of
the state of the analysed company based on a single
cut-value is not made feasible. As over the entire
target population the bankruptcy represents a “rare”
phenomenon, by predicting that no company will
go bankrupt the analyst would obtain a general
accuracy of over 97%. Most of the models
presented in the international literature cannon
ensure such a high level of performance (even on
isolated samples). As the proposed model is only
based on accounting data available to all
stakeholders, it cannot realistically target a general
accuracy close to 100%. The objective of the
research was to create a tool specific to the
Romanian companies, easily accessible to the
general public. Under these circumstances, the
proposed methodology does not set to ensure a
perfect classification of the analysed company as
bankrupt or non-bankrupt, but to associate the
company to a certain risk class. For this, the
bankruptcy risk was evaluated on intervals of the
score.
The risk indexes reflected in table 3 were
calculated for the 2010 population by comparing
the bankruptcy frequency of each specific interval
of the score S to the average bankruptcy frequency
(over the entire population).
Based on the dynamics of the risk indexes for the
10 intervals of the score S over the 2010
population, the following risk classes are proposed:
o high bankruptcy risk, for values of the
score S lower than 0;
o medium bankruptcy risk, for values of the
score S within the interval [0, 0.08);
o low bankruptcy risk, for values of the
score S higher than 0.08.
The definition of the 3 risk intervals remains
consistent with the characteristics of the 2007 –
2009 populations (table 4).
As shown in figure 7, aprox. 15% - 30% of the
companies included in the target population are
associated with the high bankruptcy risk class
based on the model.
As shown in figure 8, the relative risk of
bankruptcy (relative to the average risk) for each of
the 3 risk classes remains fairly constant over the 4
year period of analysis.
CONCLUSIONS
The objective of the research was to create a
bankruptcy prediction model easily applicable on
Romanian companies. The proposed model thus
only employs financial data available online to the
general public. The in-sample and out-of-sample
classification accuracies and AUCs of the model
over paired samples recommend it as a useful tool.
Still, bankruptcy represents a rare phenomenon,
which makes the structure of the target population
significantly different from the structure of a paired
sample. As the ”by chance” accuracy over the
entire population was considered impossible to
overpass, the model was designed not to classify a
company as future bankrupt or non-bankrupt, but to
assign the analysed company to a risk class.
The analyst is recommended to calculate the
following score for the company being evaluated:
Based on the calculated score, the company should
be included in one of the following 3 risk classes:
o high bankruptcy risk, for values of the
score S lower than 0;
o medium bankruptcy risk, for values of the
score S within the interval [0, 0.08);
o low bankruptcy risk, for values of the
score S higher than 0.08.
A company included in the high bankruptcy risk
class should not necessarily be expected to go
bankrupt. For the 2010 target population, of the
15,071 companies, 4,257 were included in the high
bankruptcy risk class. Of the 4,257 companies, 276
went bankrupt within a 2 – year horizon (until the
end of 2012). Thus, the bankruptcy frequency for
the high bankruptcy risk class was of 6.48%. This
suggests that a company included in the high
bankruptcy risk class will probably not go
bankrupt, but the probability of it going bankrupt in
a 2 – year time horizon is higher than the average.
The information offered to the analyst by the
proposed methodology is that:
o out of 1,000 companies included in the
low bankruptcy risk class, approximately 10 would
go bankrupt in a 2 – year time horizon;
o out of 1,000 companies included in the
medium risk class, approximately 20 would go
bankrupt in a 2 – year time horizon;

Network Intelligence Studies
Volume IV, Issue 1 (7) / 2016
76
o out of 1,000 companies included in the
high bankruptcy risk class, approximately 65
would go bankrupt in a 2 – year time horizon;
o without taking into account the value of
the score, out of 1,000 companies being analysed,
approximately 29 would go bankrupt in a 2 – year
time horizon.
Thus, by employing the proposed methodology, the
stakeholders should adopt different strategies for
companies from different risk classes. A capital
supplier could choose to finance more easily
companies from the low risk class, while
demanding more guaranties and increasing the
financing costs for companies from the medium
risk class and even avoid companies from the high
risk class.
Further studies that are considered useful over the
same population should target:
o the correlation between the dynamics of
the financial ratios and the probability of
bankruptcy;
o the possibility of valuating the bankruptcy
risk through scores assigned for each ratio, in
accordance with its value;
o the correlation between the probability of
bankruptcy and the absolute and relative deviations
of the ratios compared the sector means;
o the possibilities of predicting the
bankruptcy risks based on non-financial indicators
that are publicly available.
The proposed methodology should be updated on a
yearly basis, so it can remain adapted to the
changing characteristics of the target population.
REFERENCES
[1] Altman, E. (1968), “Financial ratios,
discriminant analysis and the prediction of
corporate bankruptcy.” The Journal of Finance,
Vol. 23, No. 4, pp.589-609.
[2] Andreica, M. (2013), “Modele de
avertizare timpurie a firmelor neproductive. Studiul
de caz al firmelor românești listate pe RASDAQ.
” Economie teoretică şi aplicată, Vol. 20, No. 5,
pp. 4-12.
[3] Anghel, I. (2002), Falimentul –
radiografie și predicție. București: Editura
Economică.
[4] Armeanu, D. et. al. (2012), “Utilizarea
tehnicilor de analiză cantitativă a datelor pentru
estimarea riscului de faliment al corporațiilor. ”
Economie teoretică și aplicată, Vol. 19, No. 1, pp.
86-102.
[5] Băileșteanu, Gh. (1998), Diagnostic, risc
şi eficienţă în afaceri. Timișoara: Editura Mirton.
[6] Bătrâncea, L. (2011), “Measuring the risk
of bankruptcy in the commercial sector in
Romania.” Analele Universității din Oradea, Vol.
1, No. 2, pp. 393-399.
[7] Bordeianu, G.D. et.al. (2011), “Analysis
models of the bankruptcy risk.” Economy
Transdisciplinarity Cognition, Vol. 14, No. 1, pp.
248-259.
[8] Brîndescu – Olariu, D. (2014a),
“Bankruptcy prediction based on the autonomy
ratio.” Paper submitted for publication.
[9] Brîndescu – Olariu, D. (2014b), “Payment
capacity sensitivity factors.” Management
Intercultural, Vol. 16, No.31, pp. 33-40.
[10] Brîndescu – Olariu, D. (2014c), “The
potential of the equity working capital in the
prediction of bankruptcy.” Management
Intercultural, Vol. 16, No.31, pp. 25-32.
[11] Brîndescu – Olariu, D. (2014d), „Labor
productivity as a factor for bankruptcy prediction.”
SEA – Practical Application of Science, Vol. 2, No.
4 (6), pp. 27-32.
[12] Caracota, R., Dumitru, M., Dinu, M.
(2010), “Construirea unui model de scoring pentru
întreprinderile mici și mijlocii. “ Economie
teoretică și aplicată, Vol. 17, No. 9, pp. 103-114.
[13] Căprariu, O. (2010), “The bankrupt risk in
feed distribution branch in Dolj District – FDR
model.” Management and Marketing Journal, Vol.
8, pp. 156-169.
[14] Cârciumaru, D. (2010), “A Model For
Evaluating The Bankruptcy Risk Of The Romanian
Companies.” The Young Economists Journal, Vol.
1, No. 14, pp.35-40.
[15] Chung, K., Tan, S., Holdsworth, D.
(2008), “Insolvency prediction model using
multivariate discriminant analysis and artificial
neural network for the finance industry in New
Zealand.” International journal of business and
management, Vol. 39, No. 1, pp.19-29.
[16] van Erkel, A., Pattynama, P. (1998),
“Receiver operating characteristic (ROC) analysis:
Basic principles and applications in radiology.”
European Journal of Radiology, Vol. 27, No. 2, pp.
88-94.
[17] Faraggi, D, Reiser, B (2002), „Estimation
of the area under the ROC curve. Statistics in
medicine.”, Vol. 21, pp. 3093-3106.
[18] Hanely, J.A., McNeil, B.J. (1982), “The
meaning and use of the area under a receiver
operating characteristic (ROC) curve.” Radiology,
Vol. 143, No. 1, pp.29-36.
[19] Mironiuc, M., Robu, M., Robu I. (2012),
“Estimating the probability of bankruptcy risk
occurence in an emerging capital market.” The
Proceedings of the VI th International Conference
on Globalization and Higher Education in
Economics and Business Administration GEBA
2012, pp. 611-623.
[20] Ohlson, J. (1980), “Financial ratios and the
probabilistic prediction of bankruptcy.” Journal of
accounting research, Vol. 18, No.1, pp. 109-131.

Network Intelligence Studies
Volume IV, Issue 1 (7) / 2016
77
[21] Tamari, M. (1966), „Financial ratios as a
means of forecasting bankruptcy.” Management
International Review, Vol. 6, No. 4, pp. 15-21.
[22] Tazhibi, M., Bashardoost N., Ahmadi, M.
(2011), “Kernel Smoothing For ROC Curve And
Estimation For Thyroid Stimulating Hormone.”
International Journal of Public Health Research,
Special Issue 2011, pp. 239-242.
[23] Ugurlu, M., Aksoy, H. (2006), “Prediction
of corporate financial distress in an emerging
market: the case of Turkey.” Cross Cultural
Management: An International Journal, Vol. 13,
No. 4, pp. 277 - 295.
[24] Vintilă, G., Toroapă, G. (2012),
“Forecasting the bankruptcy risk on the example of
Romanian enterprises.” Revista Română de
Statistică, pp. 377-388.
[25] Yadav, R.A. (1986), Financial ratios and
the prediction of corporate failure. New Delhi:
Concept Publishing Company.
[26] National Registry of Commerce (2014),
http://www.onrc.ro/index.php/ro/statistici?id=252

Network Intelligence Studies
Volume IV, Issue 1 (7) / 2016
78
Figures and tables
Figure 1. Number of bankruptcies in Romania
Source of data: National Registry of Commerce
Figure 2. Area Under the Curve (AUC) for individual ratios
Figure 3. In-sample AUCs of the 10 best performing models
0
5,000
10,000
15,000
20,000
25,000
30,000
2008 2009 2010 2011 2012 2013
14,483
18,421 21,692
19,651
26,804 29,587
Number of bankruptcies in Romania 0
.70
9
0.6
99
0.6
89
0.6
77
0.6
71
0.6
54
0.6
49
0.6
49
0.6
49
0.6
30
0.6
30
0.6
30
0.6
25
0.6
13
0.6
10
0.6
03
0.6
02
0.6
01
0.5
96
0.5
83
0.5
81
0.5
69
0.5
25
0.5
20
0.5
17
0.5
05
0.0000.1000.2000.3000.4000.5000.6000.7000.800
Ewc
LPp
CTD
r
Pr
EwcS
r
Cr
Ar
Dr Sr
CA
TDr
EwcC
Ar
RC
P
EFA
r
TSr
CSr A
r
AC
r
ASr
TAtr ICr
TPr
FAtr
CA
r
FAr
RO
E
LPs
Area Under the Curve for individual ratios
0.64
0.66
0.68
0.7
0.72
0.74
0.76
Model 1 Model 2 Model 3 Model 4 Model 5 Model 6 Model 7 Model 8 Model 9 Model 10
0.679 0.677 0.679
0.723 0.723
0.737 0.732 0.731
0.741 0.744
In-sample AUCs of the 10 best performing models

Network Intelligence Studies
Volume IV, Issue 1 (7) / 2016
79
Figure 4. AUC over the target population
Figure 5. Optimal cut-off value over the paired – sample
Figure 6. General accuracy over the paired – sample
0.620.640.660.68
0.70.720.740.76
2007 2008 2009 2010
0.708
0.670
0.746 0.744
Area Under the Curve over the target population
-0.014 -0.018
0.046
-0.016 -0.030
-0.020
-0.010
0.000
0.010
0.020
0.030
0.040
0.050
2007 2008 2009 2010
sco
re
Variations of the optimal cut-off value over the paired - sample
70.0%
63.3%
65.4% 66.9%
58.0%
60.0%
62.0%
64.0%
66.0%
68.0%
70.0%
72.0%
2007 2008 2009 2010
General accuracy over the paired - sample. Cut-off value = 0.016

Network Intelligence Studies
Volume IV, Issue 1 (7) / 2016
80
Figure 7. Distribution of the companies on risk classes
Figure 8. Dynamics of the risk indexes on intervals of the score S
0%
20%
40%
60%
80%
100%
2007 2008 2009 2010
16.7% 18.9% 25.6% 28.2%
31.5% 34.0% 29.6% 28.9%
51.8% 47.1% 44.8% 42.9%
Distribution of the companies on risk classes
High risk Medium risk Low risk
318.9%
247.2% 245.3% 227.8%
74.0% 75.1% 80.8% 68.6%
45.0% 58.8% 29.5% 37.0% 0%
50%
100%
150%
200%
250%
300%
350%
2007 2008 2009 2010
Ris
k in
de
xes
Dynamics of the risk indexes on intervals of the score S
High risk: Z4 < 0 Medium risk: 0 <= Z4 < 0.08 Low risk: Z4 >= 0.08

Network Intelligence Studies
Volume IV, Issue 1 (7) / 2016
81
Table 1. Bankruptcy prediction studies
No. Country Sample Main author Year
1 USA 1,249 Hatem Ben-Ameur 2008
2 China unspecified Wang Ying 2010
3 USA 468 EMEL KAHYA 1999
4 Turkey 54 Mine Ugurlu 2006
5 Italy 40,574 Giovanni Butera 2006
6 Pakistan 52 Abbas Qaiser 2011
7 Canada 633 S. Ben Amor 2009
8 USA 2,128 Gregory Kane 1998
9 India 70 A.V.N. Murty 2004
10 Taiwan 54 Tsung-Kang Chen 2011
11 Singapore 34 Zulkarnain Muhamad Sori 2009
12 USA 14,303 Stephen A. Hillegeist 2003
13 Norway 98,421 Daniel Berg 2005
14 Tunisia 60 Mondher Kouki 2011
15 Japan 3,586 Ming Xu 2009
16 Great Britain 7,833 Dionysia Dionysiou 2008
17 USA 16,816 Sudheer Chava 2004
18 Croatia 156 Ivica Pervan 2011
19 France 190 Conan - Holder 1979
20 Tunisia 120 Hamadi MATOUSSI 1999
21 Greece 58 THEOHARRY GRAMMATIKOS 1984
22 Belgium 306 N. DEWAELHEYNS 2004
23 SUA 1.203 Mary Hilston Keener 2013
24 Russia 120 Elena Makeeva 2013
25 Poland 13,288 Kamil Fijorek 2012
26 Belarus unspecified Chernovalov, A. 2004
27 Albania unspecified Shkurti Rezarta 2010
28 Brazil 12 Matias Alberto Borges 2011
29 Serbia 232 Nemanja Stanišić 2013
30 Hungary 154 Ottó Hajdu 2001
31 Czech Republic 757 Petr Jakubík 2008
32 Slovenia 19,627 Dusan Mramor 2003
33 Slovenia 29,698 Arjana Brezigar-Masten 2012
34 Sweden 3,982 Darush Yazdanfar 2008
35 Sweden 4,496 Darush Yazdanfar 2011
36 Europe 25,722 Kevin Keasey 2013
37 Finland 2,243 Laura Kainulainen 2011
38 Portugal 2,288 M. F. Santos 2006
39 Lithuania 230 O. Purvinis 2008
40 Estonia 16,443 Martin Grünberg 2014

Network Intelligence Studies
Volume IV, Issue 1 (7) / 2016
82
Table 2. Financial ratios tested as explanatory variables
No. Financial ratios Symbol Formula
1 Equity working capital Ewc Equity+Provisions-Fixed assets
2 Labor productivity in terms of profits LPp Gross profits/No. of employees
3 Profitability ratio Pr Net profits/Sales
4 Tax to profits ratio TPr Income tax/Gross profits
5 Autonomy ratio Ar (Equity+Provisions)/Total assets
6 Debt ratio Dr Total debt/Total assets
7 Solvency ratio Sr Total assets/Total debt
8 Equity working capital to sales ratio EwcSr Equity working capital / Sales
9 Arrears to sales ratio ASr Arrears/sales
10 Equity to fixed assets ratio EFAr Equity/Fixed assets
11 Arrears to cash ratio ACr Arrears/Cash
12 Cash to total debt ratio CTDr Cash/Total debt
13 Current assets to total debt ratio CATDr Current assets/Total debt
14 Cash ratio Cr Cash/Total assets
15 Equity working capital to current assets ratio EwcCAr Ewc/Current assets
16 Receivables collection period RCP (Receivables/Sales)x360
17 Total assets turnover ratio TAtr Sales/Total assets
18 Arrears ratio Ar Arrears / Total debt
19 Cash to sales ratio CSr Cash/Sales
20 Fixed assets turnover ratio FAtr Sales/Fixed assets
21 Inventory conversion ratio ICr (Inventory/Sales)x360
22 Tax to sales ratio TSr Income tax/Sales
23 Fixed assets ratio FAr Fixed assets/Total assets
24 Labor productivity in terms of sales LPs Sales/No. of employees
25 Current assets ratio CAr Current assets/Total assets
26 Return on equity ROE Net profits/(Equity+Provisions)
Table 3 Risk indexes on intervals of the score S for the 2010 population
No. Z4 2010
1 S < -0.1 324%
2 -0.1 <= S < 0 118%
3 0 <= S < 0.05 81%
4 0.05 <= S < 0.08 55%
5 0.08 <= S < 0.1 46%
6 0.1<= S < 0.13 38%
7 0.13 <= S < 0.18 24%
8 0.18 <= S < 0.25 27%
9 0.25 <= S < 0.4 43%
10 S >= 0.4 38%

Network Intelligence Studies
Volume IV, Issue 1 (7) / 2016
83
Table 4 Risk indexes on intervals of the score S for the 2007 - 2009 populations
No. Z4 2007 2008 2009
1 S < -0.1 421% 274% 306%
2 -0.1 <= S < 0 227% 221% 179%
3 0 <= S < 0.05 96% 73% 100%
4 0.05 <= S < 0.08 57% 77% 61%
5 0.08 <= S < 0.1 0% 72% 29%
6 0.1<= S < 0.13 64% 45% 35%
7 0.13 <= S < 0.18 0% 52% 40%
8 0.18 <= S < 0.25 55% 37% 23%
9 0.25 <= S < 0.4 172% 102% 25%
10 S >= 0.4 50% 48% 19%