Multispectral Band Selection and Spatial Characterization...
35
Multispectral Band Selection and Spatial Characterization: Application to Mitosis Detection in Breast Cancer Histopathology H. Irshad a,c,* , A. Gouaillard d,e , L. Roux a,c , D. Racoceanu b,c a University Joseph Fourier, Grenoble 1, France - IPAL UMI 2955 b Sorbonne Universit´ es, UPMC Univ Paris 06, France - IPAL UMI 2955 c French National Center for Scientific Research, IPAL UMI 2955 Singapore d CoSMo Software, Boston, MA, USA e Temasys Communications, Singapore Abstract Breast cancer is the second most frequent cancer. The reference process for breast cancer prognosis is Nottingham grading system. According to this sys- tem, mitosis detection is one of three important criteria required for grading process and quantifying the locality and prognosis of a tumor. Multispectral imaging, as relatively new to the field of histopathology, has the advantage, over traditional RGB imaging, to capture spectrally resolved information at specific frequencies, across the electromagnetic spectrum. This study aims at evaluating the accuracy of mitosis detection on histopathological multispec- tral images. The proposed framework includes: selection of spectral bands and focal planes, detection of candidate mitotic regions and computation of morphological and multispectral statistical features. A state-of-the-art of the methods for mitosis classification is also provided. This framework has been evaluated on MITOS multispectral dataset and achieved higher detection rate (67.35%) and F-Measure (63.74%) than the best MITOS contest re- sults [46]. Our results indicate that selected multispectral bands have more discriminant information than a single spectral band or all spectral bands for mitotic figures, validating the interest of using multispectral images to improve the quality of the diagnostic in histopathology. Keywords: histopathology, breast cancer, multispectral images, spectral * Corresponding author, E-mail: [email protected], Tel. No. +65-64082601 Preprint submitted to Computerized Medical Imaging and Graphics March 24, 2014
Transcript of Multispectral Band Selection and Spatial Characterization...

Multispectral Band Selection and Spatial
Characterization: Application to Mitosis Detection in
Breast Cancer Histopathology
H. Irshada,c,∗, A. Gouaillardd,e, L. Rouxa,c, D. Racoceanub,c
aUniversity Joseph Fourier, Grenoble 1, France - IPAL UMI 2955bSorbonne Universites, UPMC Univ Paris 06, France - IPAL UMI 2955
cFrench National Center for Scientific Research, IPAL UMI 2955 SingaporedCoSMo Software, Boston, MA, USAeTemasys Communications, Singapore
Abstract
Breast cancer is the second most frequent cancer. The reference process forbreast cancer prognosis is Nottingham grading system. According to this sys-tem, mitosis detection is one of three important criteria required for gradingprocess and quantifying the locality and prognosis of a tumor. Multispectralimaging, as relatively new to the field of histopathology, has the advantage,over traditional RGB imaging, to capture spectrally resolved information atspecific frequencies, across the electromagnetic spectrum. This study aims atevaluating the accuracy of mitosis detection on histopathological multispec-tral images. The proposed framework includes: selection of spectral bandsand focal planes, detection of candidate mitotic regions and computation ofmorphological and multispectral statistical features. A state-of-the-art of themethods for mitosis classification is also provided. This framework has beenevaluated on MITOS multispectral dataset and achieved higher detectionrate (67.35%) and F-Measure (63.74%) than the best MITOS contest re-sults [46]. Our results indicate that selected multispectral bands have morediscriminant information than a single spectral band or all spectral bandsfor mitotic figures, validating the interest of using multispectral images toimprove the quality of the diagnostic in histopathology.
Keywords: histopathology, breast cancer, multispectral images, spectral
∗Corresponding author, E-mail: [email protected], Tel. No. +65-64082601
Preprint submitted to Computerized Medical Imaging and Graphics March 24, 2014

bands selection, texture characterization, classification, object detection,features extraction
1. Introduction
According to the International Agency for Research on Cancer (IARC) inits GLOBOCAN 2012 estimated cancer incidence, mortality and prevalenceworldwide [1], breast cancer is the second most commonly diagnosed cancerworldwide after lung cancer. In 2012, there was an estimated 1.677 millionnew breast cancer cases and 522,000 deaths from breast cancer.
The reference process for breast cancer prognosis, recommended by theWorld Health Organization, is histologic grading that combines tubule for-mation, nuclei atypia and mitotic count [2, 3]. This assessment of tissuesample is synthesized into a diagnosis that would help the clinician to deter-mine the best course of therapy. Several computer aided diagnostic solutionsexist for the detection of tubule formation [4, 5] and nuclei atypia [6, 7, 8, 9]but only a few are dedicated to mitosis detection [10, 11].
In histopathology, hematoxylin and eosin (H&E) is a well-establishedstaining technique, exploiting intensity of stains in the tissue images to quan-tify the nuclei and other structures related to cancer developments [13]. Inthis context, image processing techniques are devoted to accurate and objec-tive quantification and localization of cancer evolution in specific regions ofthe tissue such as cytoplasm, membranes and nuclei [14]. From the chromaticviewpoint, nuclear regions are characterized by non-uniform stain intensityand color, thus preventing a trivial classification based on color separation. Inaddition, the superposition of tissue layers, as well as the diffusion of the dyeson the tissue surface, may bring the stains to contaminate the backgroundor other cellular regions, which are different from their specific target.
One of the most difficult challenges in histopathological dataset analysisis spatial analysis, more specifically automated nuclei detection and classi-fication [15, 12]. The objective of nuclei classification is to assign differentlabels to different types of nuclei as normal, cancer, mitotic, apoptosis, lym-phocytes etc. In addition, quantitative characterization is important not onlyfor clinical applications (e.g., to reduce/eliminate inter- and intra-observervariation in diagnosis) but also for research applications (e.g., to understandthe biological mechanisms of the disease process) [16].
Image analysis in cytology has been studied for years and numerous solu-tions [17, 30, 31, 32, 33] have been proposed in the literature. The application
2

of these solutions to histopathology is rather complicated due to the radi-cal differences between the two imaging modalities and to the highly com-plex image characteristics. Indeed, in the case of histology images, cellularstructures and functions are studied embedded in the whole tissue structure,presenting various cells architecture (gland formation, DCIS), very difficultto handle with usual pattern recognition techniques. Nevertheless, recentworks [34, 10, 11, 12] show great potential for computer assisted diagnosticof histopathological datasets for breast cancer grading.
Multispectral imaging has the advantage over traditional RGB imagingto retrieve spectrally resolved information of a tissue image scene at spe-cific frequencies across the electromagnetic spectrum. Multispectral imag-ing system captures images with accurate spectral content, correlated withspatial information, by revealing the chemical [29] and anatomic featuresof histopathology [35, 36]. This modality provides option to biologists andpathologists to see beyond the RGB image planes to which they are accus-tomed. Recent publications [37, 38, 39, 40] have begun to explore the use ofextra information contained in such spectral data. Specifically, a comparisonof spectral methodologies demonstrates the advantage of multispectral data[41, 42]. The added benefit of multispectral imaging for analysis in routineH&E stained histopathological images, however, is still largely unknown, al-though some promising results are presented in [43, 37, 40, 39]. As far aswe know, there is no existing study of the use of multispectral imaging forautomation of mitosis detection in breast cancer histopathology.
In our study, we propose a framework [11] for mitosis detection in breastcancer multispectral histopathology. This framework addresses two impor-tant questions: First, does the spatial-spectral analysis on selected spectralbands (as opposed to spatial analysis on single spectral or spatial-spectralanalysis of all the spectral bands) suffice for efficient classification of mitoticand non-mitotic figures. An obvious advantage of using selected spectralbands is its reduced computational and storage complexity. Second, how ef-fective are the multiple features for discrimination of mitotic and non-mitoticfigures, as compared to one type of features? Some examples of mitotic andnon-mitotic nuclei are shown in Figure 1.
The remainder of the paper is organized as follows. Section 2 reviewsthe state-of-the-art of multispectral methods, particularly in object or re-gion detection in histopathology, related to this research work. Section 3describes the dataset used for this study. Section 4 describes the proposedframework for mitosis detection in breast cancer multispectral histopathol-
3

(a) Mitotic nuclei.
(b) Non-mitotic nuclei.
Figure 1: Examples of mitotic and non-mitotic nuclei in breast cancer multispectralhistopathology. It is difficult to manually differentiate between mitotic and non-mitoticnuclei due to similarity.
ogy. Experiments and results are presented in section 5. Section 6 containsthe discussion part. Finally, the concluding remarks with future work arepresented in section 7.
2. Literature Review
Multispectral imaging uses more than three spectral filters (not like RGBcolor images) to capture a series of images having spectral and spatial in-formation. This spectral and spatial information has been used in remotesensing [18, 19, 20, 21], biometric systems [22, 23], plant and animal diseaseidentification [24, 25, 36, 26, 27]. The main idea for extracting discriminativeinformation from multispectral imaging is the use of combined spectral andspatial information for discrimination of regions or objects. In earlier works,Holmquist et al. [28] utilized spectrophotometric information for cervical cellsegmentation in Papanicolaou-stained images. They found that two spectralbands were more appropriate for cervical cells segmentation as compared tosingle spectral band.
Fernandez et al. [37] coupled high-throughput Fourier transform infra-redspectroscopic imaging of tissue microarrays with statistical pattern recogni-tion of spectra indicative of endogenous molecular composition for histopatho-
4

logical characterization of prostate tissue. They explicitly defined metricsconsisting of spectral features that have a physical significance related totissue biochemistry and facilitating the measurement of cell types.
We found few methods in the multispectral literature for spectral andspatial characterization of histopathological images. Some of them employedsingle spectral band of multispectral imaging [44, 34] and others used multiplespectral bands of multispectral imaging [40, 39, 45]. Some methods computedone type of features on single spectral band for quantitative analysis. Ma-sood and Rajpoot [44] proposed a colon biopsy classification method basedon spatial analysis of hyperspectral images. First, spectral band 588 nm wasselected, as it is the one that seemed to contain more textural information.Then, using circular local binary pattern algorithm, spatial analysis of pat-terns was represented by a feature vector in the selected spectral band. Later,classification was achieved using subspace projection methods like principalcomponent analysis (PCA), linear component analysis (LCA) and supportvector machine (SVM).
Some methods computed different types of features on single spectralband for quantitative analysis. Malon and Cosatto [34] combined manuallydesigned nuclear features with the learned features extracted by convolu-tional neural network for mitosis detection and achieved the best F-Measure(59%) on multispectral dataset during ICPR contest 2012 [46]. First, focalplane number five was selected as it was clearly focused. Second, two spectralbands were selected using PCA to extract the top two eigenvectors from a setof 10 spectral bands of H&E stained multispectral images. Third, two stepthresholding was applied on first eigenvectors (hematoxylin image) to obtaincandidate blobs. Fourth, a set of shape, contour, pixel and texture featureswas computed on the selected spectral band only. Fifth, log likelihoods ofclass membership were computed using convolutional neural network classi-fier for each patch of candidate blob. In the last, the SVM classifier was usedto classify each blob as either mitotic or non-mitotic blob using output of con-volutional neural network along with feature vector. This approach discardsadditional potentially relevant information from other spectral bands.
Instead of limiting themselves to a single spectral band, some authorsuse multiple and sometime even all spectral bands, from a given dataset.Boucheron et al. [45] presented a study in which the additional spectral bandshave additional useful information for nuclear classification in histopathologyas compared to the three standard bands of RGB imagery. Using all spec-tral bands, they reported a 0.79% improvement in performance compared to
5

the next best performing image type. Similarly, Wu el al. [39] proposed amultilayer conditional random field model using a combination of low-levelcues and high-level contextual information for nuclei separation in high di-mensional data set obtained through spectral microscopy. In this approach,the multilayer contextual information is extracted to interpret spectral datawith dynamically imposed pairwise constraints along the neighboring spec-tral bands. It is an unsupervised process, which efficiently helps to suppresssegmentation errors caused by intensity inhomogeneity and variable chro-matin texture. Khelifi et al. [40] proposed a spatial and spectral gray leveldependence method in order to extend the concept of gray level co-occurrencematrix by assuming the presence of texture joint information between spec-tral bands. Some spectral bands have more relevant information for specificobject or region classification than others. This approach is limited to asingle spatial feature computed from all spectral bands. Approaches like[45, 39, 40] used all available spectral bands but were limited to one type offeatures only. One possible improvement in object classification is multispec-tral analysis using more types of features. Another possibility of additionalimprovement is the selection of spectral bands by minimization of the redun-dancy and maximization of the relevancy.
In multispectral imaging, the question is how to select the correct spec-tral bands from the spectral range to best characterize the problem. Morespecifically, there are strong correlations between spectral bands and somespectral bands cannot discriminate between mitotic nuclei and others; thisis the reason why the effective dimension of spectral bands for classificationis less than the total number of spectral bands. In literature, we found onepossible solution that uses information theory, more specifically, by means ofmeasures based on the mutual information (MI) to feature selection for pixelclassification. Furthermore, Martinez-Uso et al. [47] proposed a hierarchicalclustering framework based on MI for spectral bands selection. Kamandar etal. [48] used minimum redundancy maximum relevance (mRMR) technique[49] for spectral bands selection in AVARIS data.
Each mitotic region has different level of relevant information in differentspectral bands. In the proposed framework, we address the shortcomingsof previous works, including (1) selection of spectral bands; (2) analysis ofstatistical-spectral features in selected spectral bands rather than single [44,34] or all spectral bands [45, 39, 40] and (3) selection of the best classifier fordiscrimination of mitotic figures from other microscopic objects. The mainnovel contributions of the proposed work are:
6

1. Three different methods for spectral bands selection including relativespectral absorption of different tissue components, spectral absorptionof H&E stains and mRMR technique.
2. Computation of a morphological & multispectral statistical featuresvector (MMSF) containing intensity, texture and morphological fea-tures which leverage discriminant information from a given candidateacross selected spectral bands for classification of mitotic and non-mitotic figures.
3. An extensive investigation of classifiers and inference of the best onefor mitotic figures classification.
3. Dataset
We evaluated the proposed framework on multispectral MITOS dataset[50] a freely available dataset of medical images where localization of mitoticfigures have been provided by experienced pathologists. To the best of ourknowledge, this is the only available de facto gold standard dataset of bothmultispectral and color images. It provides basis not only for comparisonbetween our proposed framework and other previous frameworks, but alsofor comparison between multispectral and color images. Using this dataset,IPAL CNRS laboratory organized a contest during ICPR 2012 [46]. Theyalso provided the performance metrics to evaluate the framework for mitosisdetection. We used this dataset and compared our results against the resultsof contestants.
The data set is made up of 200 images coming from five different slidesscanned at 40X magnification using a 10 spectral bands microscope. Thereare 40 images per slide and each image has a size of 251.6× 251.6 µm2 (thatis an area of 0.063 mm2). The 200 images contain a total 322 mitotic figures.The training data set consists of 140 images containing 224 mitotic figuresand the evaluation data set consists of 60 images containing 98 mitotic figures[46].
The spectral bands are all in the visible spectrum. There is some spectrumoverlapping for the spectral bands. In addition, for each spectral band, thedigitization has been performed at 17 different focal planes (17 layers Z-stack), each focal plane being separated from the other by 500 nm. Therefore,for each image, there is a stack of 170 files (10 spectral bands and 17 focalplanes for each spectral band). Fig. 2 shows the spectral coverage of each ofthe 10 spectral bands of the multispectral microscope.
7

Figure 2: Spectral bands of the multispectral microscope and examples for each spectralband (SB).
4. Proposed Framework
In this paper, we propose a framework for mitosis detection in breast can-cer multispectral histopathology as shown in Fig. 3. The proposed frameworkhas five main steps. Step one performs a selection of the most informativefocal plane based on maximum gradient information of mitotic figures frombackground. This is explained in Appendix A. Step two is responsible forthe selection of relevant spectral bands for the objective of mitotic figuresdetection. Candidates for mitotic figures are detected in step three. Then,in step four, intensity and texture features across selected spectral bands arecomputed for each detected candidate. In addition, using segmented regionsof detected candidates, morphological features are also computed and addedto the feature vector. During step five, candidates are classified into mito-sis and non-mitosis classes using decision tree (DT), multilayer perceptron(MLP) as well as linear and non-linear support vector machine (L- and NL-SVM) classifiers. A side advantage of performing the statistical analysis onmultiple selected spectral bands simultaneously is to investigate whether im-
8
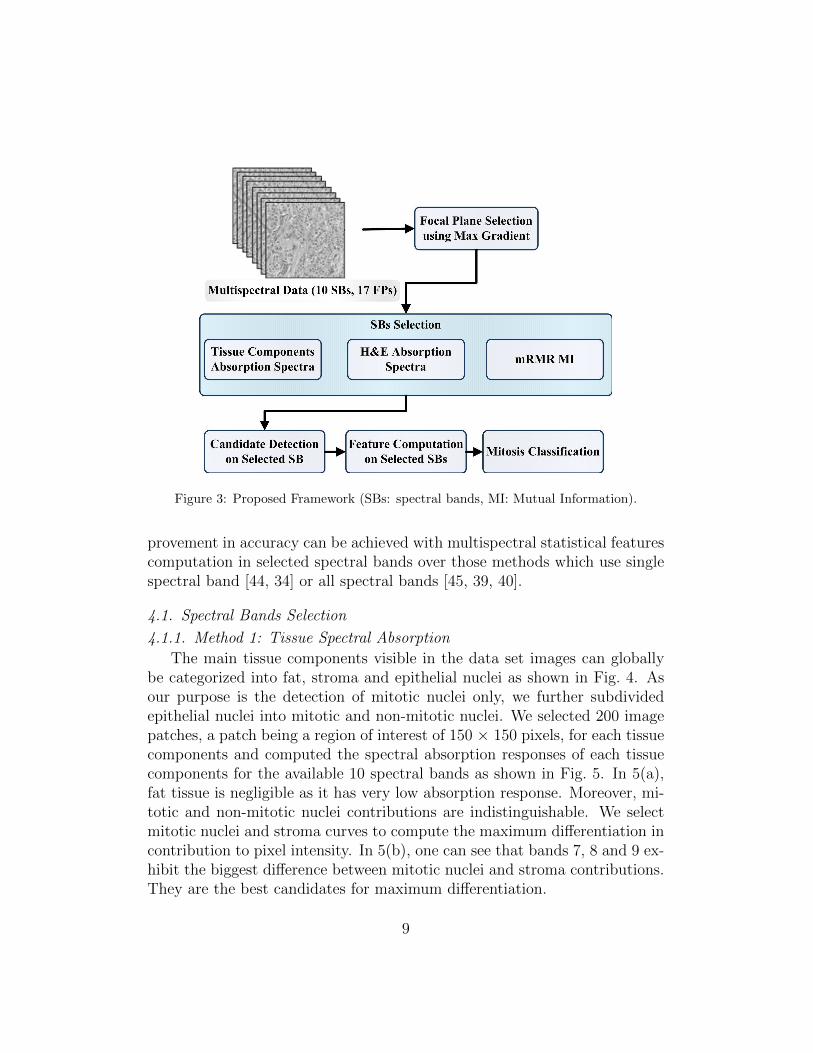
Figure 3: Proposed Framework (SBs: spectral bands, MI: Mutual Information).
provement in accuracy can be achieved with multispectral statistical featurescomputation in selected spectral bands over those methods which use singlespectral band [44, 34] or all spectral bands [45, 39, 40].
4.1. Spectral Bands Selection
4.1.1. Method 1: Tissue Spectral Absorption
The main tissue components visible in the data set images can globallybe categorized into fat, stroma and epithelial nuclei as shown in Fig. 4. Asour purpose is the detection of mitotic nuclei only, we further subdividedepithelial nuclei into mitotic and non-mitotic nuclei. We selected 200 imagepatches, a patch being a region of interest of 150 × 150 pixels, for each tissuecomponents and computed the spectral absorption responses of each tissuecomponents for the available 10 spectral bands as shown in Fig. 5. In 5(a),fat tissue is negligible as it has very low absorption response. Moreover, mi-totic and non-mitotic nuclei contributions are indistinguishable. We selectmitotic nuclei and stroma curves to compute the maximum differentiation incontribution to pixel intensity. In 5(b), one can see that bands 7, 8 and 9 ex-hibit the biggest difference between mitotic nuclei and stroma contributions.They are the best candidates for maximum differentiation.
9

Figure 4: Example of different components of breast tissue in H&E stained histopathologi-cal image. Left image sample is a taken from spectral band 8, focal plane 6 of multispectralmicroscope; right image is taken from Aperio Slide Scanner.
(a) Normalized absorption spectra of fourtissue components in 10 SBs
(b) Difference of mitotic nuclei and stromaabsorption spectra in 10 SBs
Figure 5: Normalized absorption spectra of four tissue components in 10 spectral bands(SBs). Note that SB 1 (white band), in nature, is different from other SBs and may serveas reference as it covers the whole visible spectrum and contains all the information thatother bands are containing, although at a lower resolution. It is separated from other SBsby a dotted line.
10

Figure 6: Normalized plot of hematoxylin (blue line) and eosin (red line) dyes absorptionspectra in multispectral images and the difference of hematoxylin and eosin (green line).
4.1.2. Method 2: Hematoxylin and Eosin Spectral Absorption
In this method, we reconstruct the spectrum of a pixel by using stainingcharacteristics of tissue components to select the optimal number of spectralbands for mitosis discrimination in H&E stained multispectral histopathol-ogy. To illustrate the possible correlation between spectral bands and thestaining characteristics of the spectral samples, the plot of hematoxylin andeosin dyes spectral absorptions are shown in Fig. 6 (this plot is derived fromthe work of Bautista and Yagi [51]). Hematoxylin stains nuclei material,while eosin stains both nuclei and cytoplasm. The H−E plot in Fig. 6 showsthe difference of absorption between hematoxylin and eosin. The spectralbands for which H−E is maximum are more suitable for discrimination be-tween nuclei and cytoplasm. The difference is maximum in spectral bands 7and 8 with almost zero eosin absorption. Therefore, these spectral bandsshould be good options for mitosis detection.
4.1.3. Method 3: mRMR Technique
In this method, mRMR technique [49] is used for selection of spectralbands. Selection is based on two criteria; minimum redundancy R(S, c) andmaximum relevance D(S, c). The relevancy of selected spectral bands to class
11
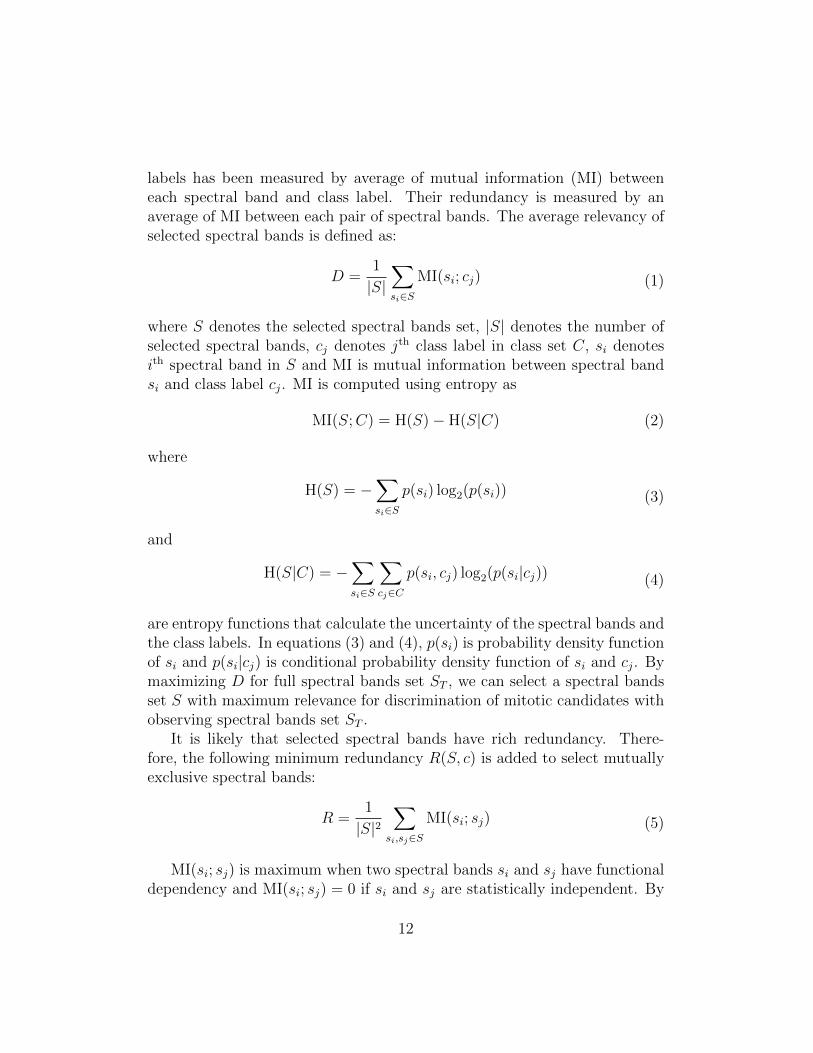
labels has been measured by average of mutual information (MI) betweeneach spectral band and class label. Their redundancy is measured by anaverage of MI between each pair of spectral bands. The average relevancy ofselected spectral bands is defined as:
D =1
|S|∑si∈S
MI(si; cj) (1)
where S denotes the selected spectral bands set, |S| denotes the number ofselected spectral bands, cj denotes jth class label in class set C, si denotesith spectral band in S and MI is mutual information between spectral bandsi and class label cj. MI is computed using entropy as
MI(S;C) = H(S)− H(S|C) (2)
where
H(S) = −∑si∈S
p(si) log2(p(si)) (3)
and
H(S|C) = −∑si∈S
∑cj∈C
p(si, cj) log2(p(si|cj)) (4)
are entropy functions that calculate the uncertainty of the spectral bands andthe class labels. In equations (3) and (4), p(si) is probability density functionof si and p(si|cj) is conditional probability density function of si and cj. Bymaximizing D for full spectral bands set ST , we can select a spectral bandsset S with maximum relevance for discrimination of mitotic candidates withobserving spectral bands set ST .
It is likely that selected spectral bands have rich redundancy. There-fore, the following minimum redundancy R(S, c) is added to select mutuallyexclusive spectral bands:
R =1
|S|2∑
si,sj∈S
MI(si; sj) (5)
MI(si; sj) is maximum when two spectral bands si and sj have functionaldependency and MI(si; sj) = 0 if si and sj are statistically independent. By
12

Table 1: Spectral Bands (SBs) Mutual Information (MI) Measure.
SBs MI Accumulated MI Accumulated MI%
SB 8 3.60 3.60 33%
SB 9 3.59 0.95 42%
SB 7 3.38 0.94 51%
SB 6 3.18 0.93 60%
SB 2 3.16 0.92 69%
SB 1 3.11 0.91 78%
SB 3 3.05 0.89 86%
SB 0 2.99 0.88 91%
SB 4 2.94 0.85 95%
SB 5 2.85 0.82 100%
minimizing R for selected spectral bands, we selected spectral bands set withminimum redundancy.
Selection of Spectral Bands in Set (S) in Equations (1), (2),(3), (4) and (5): The incremental search method was used to find then spectral bands from the set {ST−Sn−1}, maximizing the following conditionexpression:
maxsi∈ST−S(n−1)
MI(si; c)−1
n− 1
∑sj∈S(n−1)
MI(si; sj)
(6)
The image patches, used in computation of spectral absorption of differ-ent tissue components (as described in section 4.1.1), were divided into twoclasses. The non-mitosis class consisted of three tissue components includingfat, stroma and non-mitotic nuclei, and the remaining samples belonged tomitosis class. We performed mRMR on these image patches and their MIwith ranking are shown in Table 1.
13
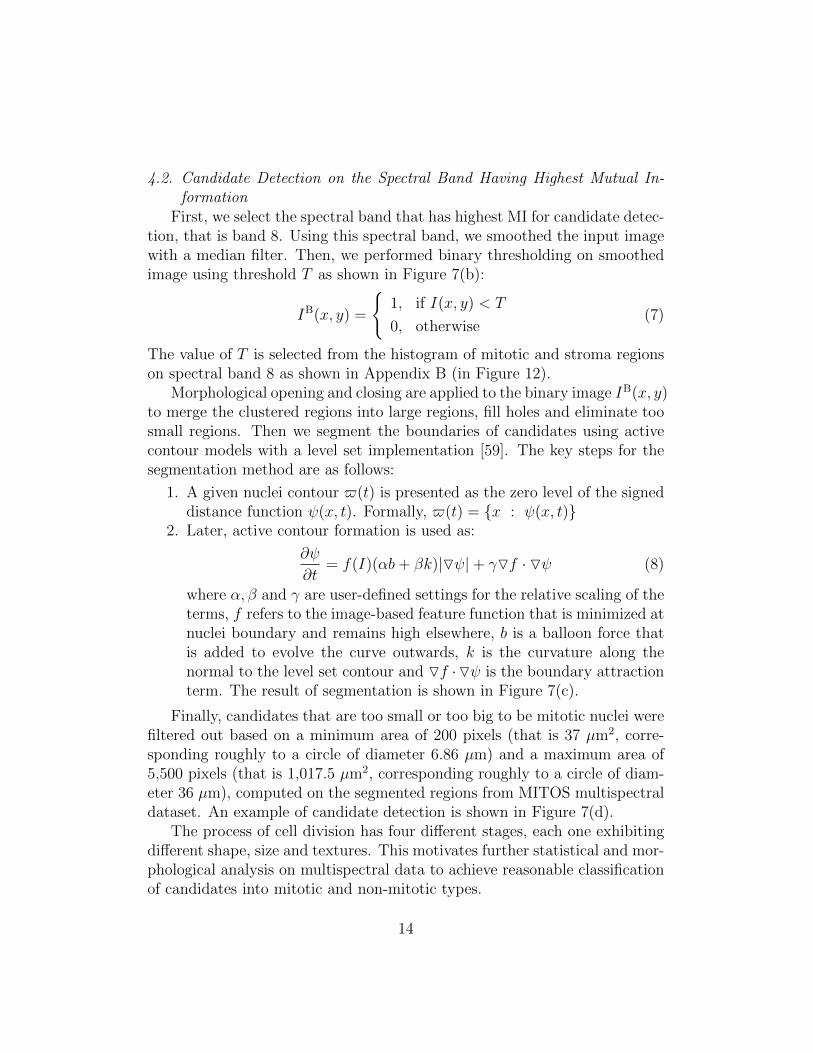
4.2. Candidate Detection on the Spectral Band Having Highest Mutual In-formation
First, we select the spectral band that has highest MI for candidate detec-tion, that is band 8. Using this spectral band, we smoothed the input imagewith a median filter. Then, we performed binary thresholding on smoothedimage using threshold T as shown in Figure 7(b):
IB(x, y) =
{1, if I(x, y) < T
0, otherwise(7)
The value of T is selected from the histogram of mitotic and stroma regionson spectral band 8 as shown in Appendix B (in Figure 12).
Morphological opening and closing are applied to the binary image IB(x, y)to merge the clustered regions into large regions, fill holes and eliminate toosmall regions. Then we segment the boundaries of candidates using activecontour models with a level set implementation [59]. The key steps for thesegmentation method are as follows:
1. A given nuclei contour $(t) is presented as the zero level of the signeddistance function ψ(x, t). Formally, $(t) = {x : ψ(x, t)}
2. Later, active contour formation is used as:
∂ψ
∂t= f(I)(αb+ βk)|Oψ|+ γOf · Oψ (8)
where α, β and γ are user-defined settings for the relative scaling of theterms, f refers to the image-based feature function that is minimized atnuclei boundary and remains high elsewhere, b is a balloon force thatis added to evolve the curve outwards, k is the curvature along thenormal to the level set contour and Of ·Oψ is the boundary attractionterm. The result of segmentation is shown in Figure 7(c).
Finally, candidates that are too small or too big to be mitotic nuclei werefiltered out based on a minimum area of 200 pixels (that is 37 µm2, corre-sponding roughly to a circle of diameter 6.86 µm) and a maximum area of5,500 pixels (that is 1,017.5 µm2, corresponding roughly to a circle of diam-eter 36 µm), computed on the segmented regions from MITOS multispectraldataset. An example of candidate detection is shown in Figure 7(d).
The process of cell division has four different stages, each one exhibitingdifferent shape, size and textures. This motivates further statistical and mor-phological analysis on multispectral data to achieve reasonable classificationof candidates into mitotic and non-mitotic types.
14
(a) Smooth Image (b) Threshold Image
(c) Segmented Image (d) Selected Candidates (Green cir-cle=mitotic region, red circle=non-mitoticregion)
Figure 7: Different steps in candidate detection on breast cancer multispectral histopathol-ogy.
4.3. Morphological & Multispectral Statistical Features (MMSF) Computa-tion
We computed MMSF vector consisting of intensity and textural featuresin several selected spectral bands. In addition, we also computed morpholog-ical features (such as area, roundness, elongation, perimeter and equivalent
15

spherical perimeter) from segmented regions during candidate detection. Themorphological features reflect the phenotype information of mitotic and non-mitotic nuclei.
Using pixel information in selected spectral bands, we computed fiveintensity-based features on each segmented candidate regions in selected spec-tral bands: mean, median, variance, kurtosis and skewness for each candi-date. For capturing spatial dependency inside candidate regions, we alsocomputed multispectral textural features on each segmented candidate re-gions in selected spectral bands that included Haralick co-occurrence [52]and run-length [53] features. The co-occurrence features were correlation,cluster shade, cluster prominence, energy, entropy, hara-correlation, inertiaand difference moment and the run-length features were short run empha-sis, long run emphasis, grey-level non-uniformity, run length non-uniformity,low grey level runs emphasis, high grey level runs emphasis, short run lowgrey level emphasis, short run high grey level emphasis, long run low greylevel emphasis, and long run high grey level emphasis. These multispec-tral texture features were computed with one displacement vector in fourdirections (0o, 45o, 90o, 135o) as in [11]. To make these features rotationallyinvariant, they were averaged over four directions. Hence, a total of 23 fea-tures were computed for each spectral band (five intensity based features,eight co-occurrence features and ten run-length features).
In most cases, the features have different dynamic ranges. These differentdynamic ranges of features affect the majority of classifiers which use thedistance between two points. If one of the features has a broad range ofvalues, the distance will be governed by this particular feature. Therefore,dynamic ranges of features were normalized so that each feature contributesapproximately proportionately to the final distance. We solved this problemby normalizing the features values so that they lie within similar dynamicranges. The normalization formula is given as:
f ′ =f − fmin
fmax − fmin
(9)
where f is original feature value, f ′ is the normalized feature value, fmin isthe minimum feature values and fmax is the maximum feature value.
4.4. Candidate Classification
Different classifiers learn a model in different ways that fits the relation-ship between features and labels of the training set. These learned models
16

are used to classify new unknown instances from the evaluation set. Eachclassifier has its own strong and weak points. To explore the different learn-ing models on MMSF, four classifiers, DT, MLP, L-SVM and NL-SVM [54]were used to learn mitotic and non-mitotic classes from training set. Theselearned classes predicted the possible label of detected candidates in evalu-ation set. Generally, SVM and MLP tend to perform better when dealingwith high dimensions and continuous features. On the other hand, DT tendto perform better when dealing with discrete features.
In our experiments, a multilayer perceptron (feedforward neural network)with backpropagation as learning model and sigmoid as activation functionis used. The decision tree (DT) is a functional tree that could have logisticregression model at the inner nodes and leaves. It models the posterior classprobabilities as:
P (C = c,X = x) =eFc(x)∑Ci=1 e
Fi(x)(10)
where C is a label set and X is an instance set.The L-SVM is a L2-regularized L2-loss support vector classification [55]
as:
minω
1
2ωTω + α
N∑i=1
(max(0, 1− CiωTxi))
2 (11)
where α > 0 is a penalty parameter, xi is an instance of the instance set,Ci is a label of label set and ω is a weight vector.
In NL-SVM, we used Gaussian radial base function that allowed to avoidthe explicit evaluation of mapping by using the so-called kernel trick:
K(xi, xj) = e−‖xi−xj‖2
2σ2 (12)
5. Experiment Results
The proposed framework was evaluated on MITOS multispectral dataset[50]. The results of candidate detection and classification methods were com-pared with ground-truth (GT) information provided along with the dataset.The metrics used to evaluate the mitosis detection included: number of truepositives (TP), number of false positives (FP), number of false negatives(FN), sensitivity or true positive rate
(TPR = TP
TP+FN
), precision or positive
predictive value(PPV = TP
TP+FP
)and F-Measure
(F-Measure = 2× TPR×PPV
TPR+PPV
).
17
In addition to MITOS contest, the proposed framework was also evaluatedwith 5-fold cross validation [56] by merging the training and evaluation sets.
5.1. Spectral Bands Selection
How many spectral bands are necessary for a good detection of mitoticfigures? Which spectral bands are relevant for mitotic figure detection?
To discuss these two questions, we tried first to evaluate the contributionsof each spectral band using three different proposed methods as discussed insection 4.1. The results are shown in Table 2. The ranking of spectral bandsin method one is based on difference between spectral absorption of mitoticnuclei and cytoplasm, while the ranking of spectral bands in method twois based on difference between hematoxylin and eosin spectral absorption.These three rankings put the same spectral bands, namely 7, 8 and 9 intop position. More specifically, the top position in methods one and two isoccupied by spectral band 7 while method three gives the top position tospectral band 8 on the basis of highest MI.
At the bottom of the table, there are spectral bands 4 and 5 for allthree rankings. According to method two ranking, the difference betweenabsorption response of hematoxylin and eosin in spectral bands 4 and 5 isalmost zero which represents that these two spectral bands are irrelevant formitosis discrimination. Based on these analyses, we ignore spectral bands 4and 5 for mitosis discrimination.
Considering the available spectral bands and their rankings, our selectionof spectral bands contains the following eight bands: 8, 9, 7, 6, 2, 1, 3, and 0.
5.2. Candidate Detection
We performed candidate detection in top three spectral bands of thethree proposed spectral bands selection methods. Those three spectral bandsare 7, 8 and 9. In order to evaluate the ability of these spectral bandsto provide adequate information for the detection of mitosis, we will alsoperform separately candidate detection on spectral band 1 only as this bandcovers the whole visible spectrum. The results of candidate detection stepwere ranked according to F-Measure and reported in Figure 8.
Spectral band 8 has higher F-Measure than bands 7, 9 and 1 with moreTP and less FP. Although spectral band 1 covers the full spectrum of light,it reported poor results for candidate detection.
On training and evaluation sets, the candidate detection using spectralband 8 detects 2510 and 1188 candidates, containing 192 and 90 ground truth
18

Table 2: Different Rankings of Spectral Bands (SBs). The upper dotted line shows thatSBs 7,8 and 9 are at top three positions in these ranking. The lower dotted line showsthat SBs 4 and 5 are at bottom three positions.
Method 1 Method 2 Method 3
SB Mitosis−Cytoplasm SB H−E SB MI
7 0.47 7 0.96 8 3.6
8 0.45 8 0.91 9 3.59
9 0.36 9 0.64 7 3.38
3 0.33 1 0.39 6 3.18
2 0.31 6 0.33 2 3.16
6 0.30 0 0.23 1 3.05
1 0.30 2 0.23 3 3.05
4 0.29 3 0.21 0 2.99
0 0.28 5 0.04 4 2.95
5 0.27 4 0 5 2.83
mitosis from a total 224 and 98 ground truth mitosis, respectively. Among allthe detected candidates, there are 2318 and 1098 non-mitosis in the trainingand evaluation sets, respectively. The candidate detection step generates alarge number of FP and missed 32 and 8 ground truth mitosis from trainingand evaluation sets, respectively.
5.3. Candidate Classification
5.3.1. Classification on MITOS Dataset using 5-fold Cross Validation
In this experiment, the assessment of classification performance was madeusing 5-fold cross validation by combining both MITOS training and evalu-ation sets. Classification results are shown in Table 3. In case of all spec-tral bands MMSF, NL-SVM classifier outperformed the other classifiers andachieved the highest PPV (79.70%) and F-Measure (61.45%). Overall, L-SVM reported higher TPR (56.21%) but more FP as well. In case of selectedeight spectral bands MMSF, L-SVM classifier has its F-Measure improvedthanks to higher TPR and PPV. Overall, NL-SVM achieved the highest F-Measure (62.07%) and PPV (81.00%).
19

Figure 8: Candidate detection results on selected spectral bands (SB: spectral band, TR:training dataset, EV: evaluation dataset).
Table 3: Classification Results (ground truth = 322 mitosis) on MITOS Dataset using5-fold Cross Validation.
Classifiers TP FP TPR PPV F-Measure
All SBs MMSFL-SVM 181 98 56.21% 64.87% 60.23%NL-SVM 161 41 50% 79.70% 61.45%MLP 164 63 50.93% 72.25% 59.54%DT 167 103 51.86% 56.42% 56.42%
Selected eight SBs MMSFL-SVM 184 93 57.14% 66.43% 61.44%NL-SVM 162 38 50.31% 81.00% 62.07%MLP 164 47 50.93% 77.73% 61.54%DT 163 79 50.62% 67.36% 57.80%
20

Figure 9: Plot of F-Measure using spectral bands (SBs) selection. Result from using allSBs from left to the current, e.g. SB 2 result uses SB 8, 9, 7, 6, 2. This order is taken fromthe mRMR ranking. First vertical dotted line shows that selecting features upto SBs 2matches the previous best result. Second vertical dotted line highlights the overall bestresult by selecting features upto SBs 0.
Using mRMR ranking of spectral bands, the different selection of spectralbands are also tested using all the classifiers introduced in Section 4.4. How-ever, for both clarity and briefness, we only plot F-Measure curves of 5-foldcross validation with all classifiers in Figure 9. Similar results were obtainedin other cases. Figure 9 shows that F-Measure increases while we add morespectral bands to the set of selected spectral bands. F-Measure reaches apeak with a set of eight selected spectral bands, then it starts decreasingwhen adding more spectral bands. The sequence of spectral bands selectionis according to ranking of MI from mRMR. In case of few spectral bandsMMSF, NL-SVM, MLP and DT reported poor classification accuracy whileL-SVM reported higher classification accuracy. As more spectral bands areselected NL-SVM classifiers started performing better than other classifiersand reached maximum performance with first eight selected spectral bands.
5.3.2. Classification on MITOS Evaluation Set
In this experiment, MITOS training set was used to train the four selectedclassifiers and MITOS evaluation set is used to test the classification accuracyof proposed framework as shown in Table 4. Classification was performedfrom MMSF computed both on selected eight spectral bands and on all the
21
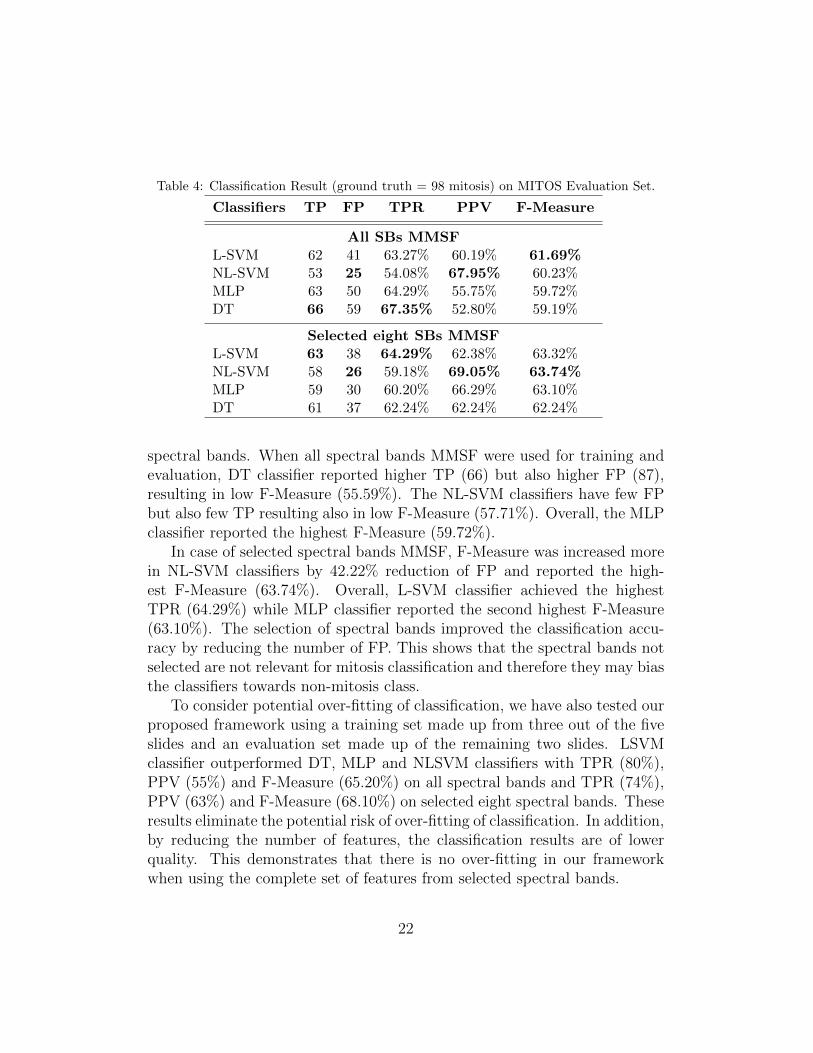
Table 4: Classification Result (ground truth = 98 mitosis) on MITOS Evaluation Set.
Classifiers TP FP TPR PPV F-Measure
All SBs MMSFL-SVM 62 41 63.27% 60.19% 61.69%NL-SVM 53 25 54.08% 67.95% 60.23%MLP 63 50 64.29% 55.75% 59.72%DT 66 59 67.35% 52.80% 59.19%
Selected eight SBs MMSFL-SVM 63 38 64.29% 62.38% 63.32%NL-SVM 58 26 59.18% 69.05% 63.74%MLP 59 30 60.20% 66.29% 63.10%DT 61 37 62.24% 62.24% 62.24%
spectral bands. When all spectral bands MMSF were used for training andevaluation, DT classifier reported higher TP (66) but also higher FP (87),resulting in low F-Measure (55.59%). The NL-SVM classifiers have few FPbut also few TP resulting also in low F-Measure (57.71%). Overall, the MLPclassifier reported the highest F-Measure (59.72%).
In case of selected spectral bands MMSF, F-Measure was increased morein NL-SVM classifiers by 42.22% reduction of FP and reported the high-est F-Measure (63.74%). Overall, L-SVM classifier achieved the highestTPR (64.29%) while MLP classifier reported the second highest F-Measure(63.10%). The selection of spectral bands improved the classification accu-racy by reducing the number of FP. This shows that the spectral bands notselected are not relevant for mitosis classification and therefore they may biasthe classifiers towards non-mitosis class.
To consider potential over-fitting of classification, we have also tested ourproposed framework using a training set made up from three out of the fiveslides and an evaluation set made up of the remaining two slides. LSVMclassifier outperformed DT, MLP and NLSVM classifiers with TPR (80%),PPV (55%) and F-Measure (65.20%) on all spectral bands and TPR (74%),PPV (63%) and F-Measure (68.10%) on selected eight spectral bands. Theseresults eliminate the potential risk of over-fitting of classification. In addition,by reducing the number of features, the classification results are of lowerquality. This demonstrates that there is no over-fitting in our frameworkwhen using the complete set of features from selected spectral bands.
22
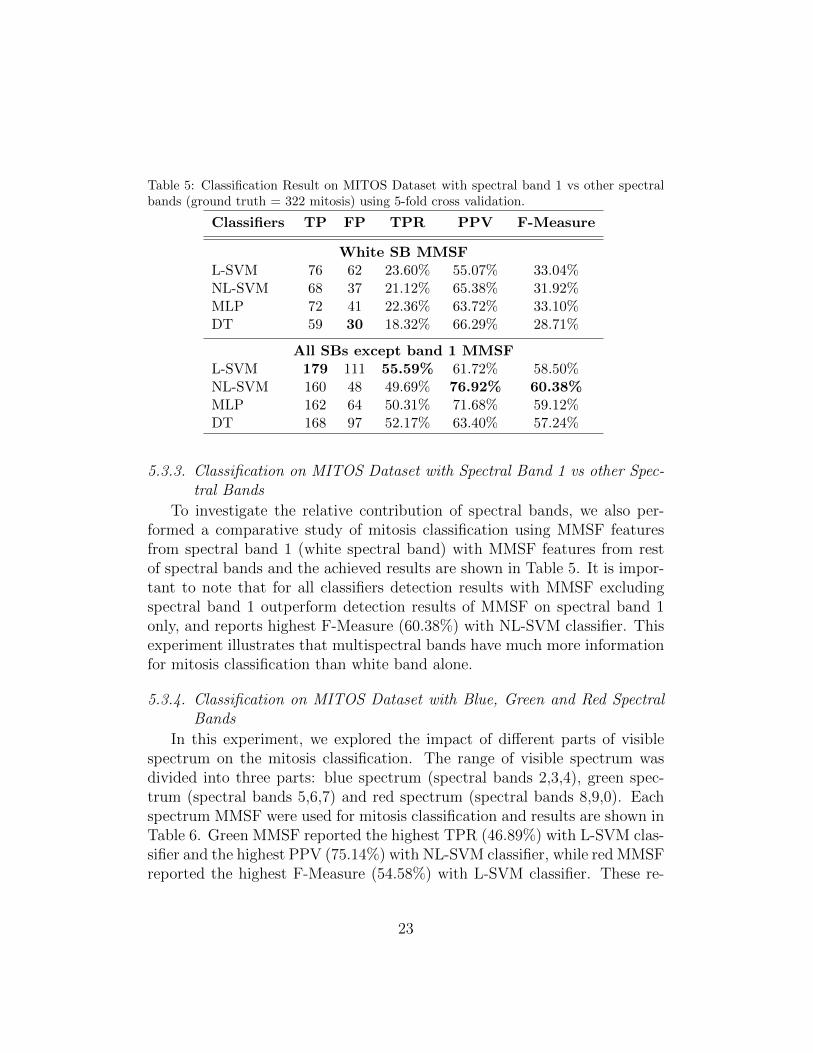
Table 5: Classification Result on MITOS Dataset with spectral band 1 vs other spectralbands (ground truth = 322 mitosis) using 5-fold cross validation.
Classifiers TP FP TPR PPV F-Measure
White SB MMSFL-SVM 76 62 23.60% 55.07% 33.04%NL-SVM 68 37 21.12% 65.38% 31.92%MLP 72 41 22.36% 63.72% 33.10%DT 59 30 18.32% 66.29% 28.71%
All SBs except band 1 MMSFL-SVM 179 111 55.59% 61.72% 58.50%NL-SVM 160 48 49.69% 76.92% 60.38%MLP 162 64 50.31% 71.68% 59.12%DT 168 97 52.17% 63.40% 57.24%
5.3.3. Classification on MITOS Dataset with Spectral Band 1 vs other Spec-tral Bands
To investigate the relative contribution of spectral bands, we also per-formed a comparative study of mitosis classification using MMSF featuresfrom spectral band 1 (white spectral band) with MMSF features from restof spectral bands and the achieved results are shown in Table 5. It is impor-tant to note that for all classifiers detection results with MMSF excludingspectral band 1 outperform detection results of MMSF on spectral band 1only, and reports highest F-Measure (60.38%) with NL-SVM classifier. Thisexperiment illustrates that multispectral bands have much more informationfor mitosis classification than white band alone.
5.3.4. Classification on MITOS Dataset with Blue, Green and Red SpectralBands
In this experiment, we explored the impact of different parts of visiblespectrum on the mitosis classification. The range of visible spectrum wasdivided into three parts: blue spectrum (spectral bands 2,3,4), green spec-trum (spectral bands 5,6,7) and red spectrum (spectral bands 8,9,0). Eachspectrum MMSF were used for mitosis classification and results are shown inTable 6. Green MMSF reported the highest TPR (46.89%) with L-SVM clas-sifier and the highest PPV (75.14%) with NL-SVM classifier, while red MMSFreported the highest F-Measure (54.58%) with L-SVM classifier. These re-
23

Table 6: Classification Result on MITOS Dataset with blue, green and red Spectral Bands(SBs) using 5-fold cross validation (ground truth = 322 mitosis).
Classifiers TPR PPV F-Measure TPR PPV F-Measure
Blue SBs (2,3&4) MMSF Green SBs (5,6&7) MMSFL-SVM 26% 59% 36.56% 47% 56% 51.01%NL-SVM 32% 68% 43.31% 40% 67% 50.49%MLP 39% 55% 45.26% 43% 60% 49.91%DT 30% 51% 37.96% 42% 55% 47.89%
Red SBs (0,8&9) MMSF SBs 7,8&9 MMSFL-SVM 42% 67% 51.53% 45% 62% 52.25%NL-SVM 39% 72% 51% 41% 72% 51.88%MLP 42% 61% 49.54% 40% 66% 49.62%DT 40% 58% 47.43% 41% 61% 48.70%
sults illustrate that red spectral bands have more information for mitosisclassification as compared to green and blue spectral bands. An importantpoint is that green spectral bands have more information as compared to blueones that might be due to spectral bands 6 and 7 having higher absorptionresponse for mitotic figures. Moreover, we also investigated the impact of topthree ranked spectral bands (7, 8 & 9) MMSF vector for mitosis detectionusing 5-fold cross validation. As compared with blue, green and red spectralbands results, this MMSF vector clearly outperformed with all four classifiersand achieved highest F-Measure (52.25%) with L-SVM classifier as shown inTable 6.
6. Discussion
The results seem to indicate the best scores are achieved using the se-lected focal plane, across selected spectral bands. The proposed focal planeselection is automatic and unsupervised. We performed selection of focalplane separately for each spectral band. However, as the best focal plane isthe same for all spectral bands, in future we could use the best focal planecomputed on one spectral band only. It is not necessary to compute it foreach spectral band separately. In other words, finding the best focal planeand finding the best spectral bands are separable problems.
The best F-Measure for candidate detection was achieved on spectralband 8. The fact that the proposed framework achieved better results when
24
using spectral bands 8, 9 and 7 for candidate detection than when usingthe full spectrum (spectral band 1) supports the claim that multispectralimaging improves the accuracy of the framework. As spectral bands 7, 8and 9 actually overlap in terms of spectrum, it would be interesting to applyspectral unmixing between spectral bands 7, 8 and 9 to see if it can furtherimprove the results. The results illustrate clearly the improved accuracyresulting of the spectral band selection process.
In order to study the MMSF for classification of mitotic figures, we per-formed spectral bands selection by studying which spectral bands have mini-mum redundant and maximum relevant information for mitosis classification.Figure 9 show the results (F-Measure) of mitosis classification using a selec-tion of spectral bands based on mRMR ranking. With top five spectral bands,we match the best results achieved during MITOS contest [46]. With topeight spectral bands, we achieve 63.74% F-Measure which is a 8% increaseover the best know results. Adding more spectral bands (spectral bands 4and 5), only has a negative impact on the results. This concludes that spec-tral bands 4 and 5 are irrelevant for mitosis discrimination. To illustrate thepossible correlation between selected spectral bands and the staining charac-teristics of the spectral samples, the shape of H−E plot in Figure 6 validatedthe proposed selection of spectral bands.
We also used the analysis of different subsets of multispectral features ascomplement to the analysis of performance on MMSF. Specifically, we haveshown in experiment 3 that multispectral data contains more discriminantinformation for detection of mitosis than spectral band 1, which covers thefull visible spectrum. According to experiment 4, red spectral bands (8,9,0)are more helpful for mitosis discrimination as compared to blue spectralbands (2,3,4) and green spectral bands (5,6,7). An important finding is thatgreen spectral bands have more information than blue spectral bands, whichmight be reason of spectral band 6 and 7, which contain higher absorptionresponse for mitotic nuclei as compared to other tissue components.
Separate training and evaluation sets of MITOS dataset [50] have beenused for training and evaluation of the proposed framework. The comparisonof proposed framework results with MITOS contest results [46] are shownin Figure 10. Malon and Cosatto [34] method ranked first of the contestwith 59% F-Measure. In comparison with MITOS contestants, the proposedframework compute features on selected spectral bands that have higher mi-totic absorption response as compared to other tissue components. Using se-lected spectral bands MMSF and NL-SVM classifier, we managed to achieve
25
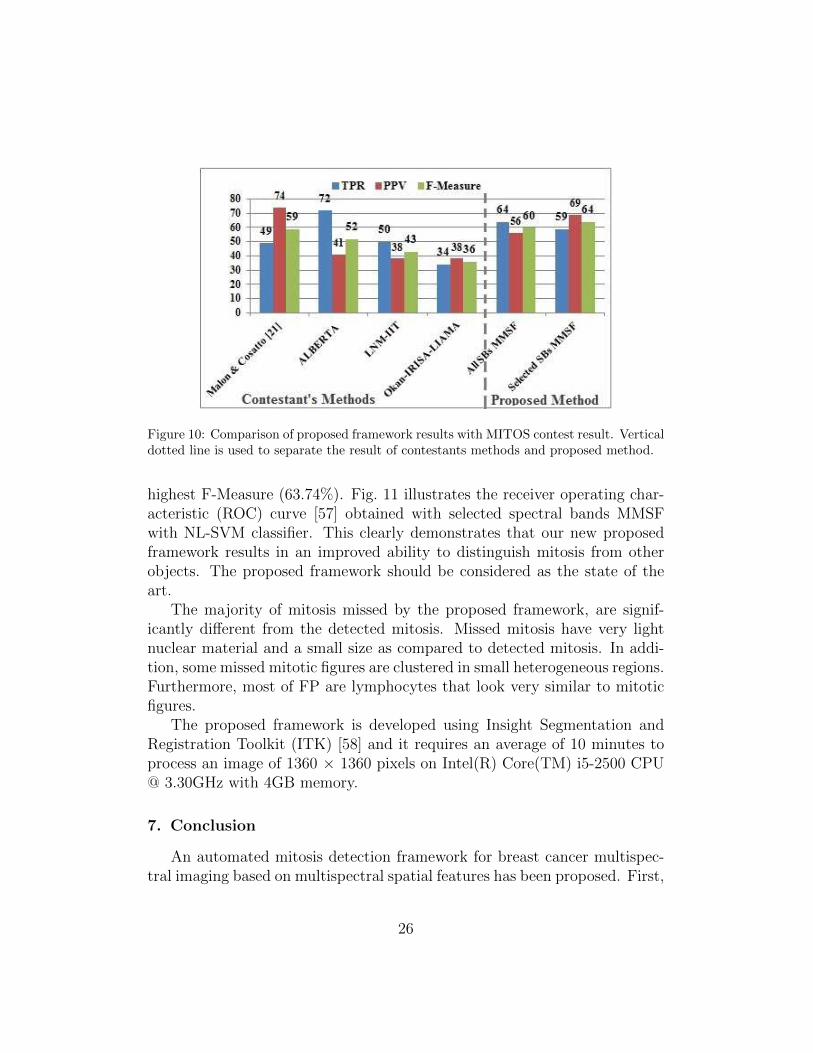
Figure 10: Comparison of proposed framework results with MITOS contest result. Verticaldotted line is used to separate the result of contestants methods and proposed method.
highest F-Measure (63.74%). Fig. 11 illustrates the receiver operating char-acteristic (ROC) curve [57] obtained with selected spectral bands MMSFwith NL-SVM classifier. This clearly demonstrates that our new proposedframework results in an improved ability to distinguish mitosis from otherobjects. The proposed framework should be considered as the state of theart.
The majority of mitosis missed by the proposed framework, are signif-icantly different from the detected mitosis. Missed mitosis have very lightnuclear material and a small size as compared to detected mitosis. In addi-tion, some missed mitotic figures are clustered in small heterogeneous regions.Furthermore, most of FP are lymphocytes that look very similar to mitoticfigures.
The proposed framework is developed using Insight Segmentation andRegistration Toolkit (ITK) [58] and it requires an average of 10 minutes toprocess an image of 1360 × 1360 pixels on Intel(R) Core(TM) i5-2500 CPU@ 3.30GHz with 4GB memory.
7. Conclusion
An automated mitosis detection framework for breast cancer multispec-tral imaging based on multispectral spatial features has been proposed. First,
26

Figure 11: The ROC curve using selected spectral bands MMSF with NL-SVM classifier.
focal plane selection is performed using maximum gradient information. Basedon MI of spectral bands and spectral absorption of different tissue compo-nents and stains, spectral bands were selected for candidate detection andfeature computation. Candidate detection was performed on the spectralbands that have relatively higher MI and mitotic absorption spectra. Then,MMSF are computed for each candidate in eight selected spectral bands, ahighly efficient model for capturing spectral and spatial features for objectdiscrimination. The proposed framework outperformed the MITOS contestresults with 8% improvement of F-Measure. We expect to improve mitosisdetection performance by selecting the feature set through the computationof MMSF of candidate regions in selected spectral bands. In future work, weplan to investigate unmixing of bands as most spectral bands have overlap-ping area, which increase redundancy. The pre-selection of the focal plane (orvolumes) is also of great importance to reduce the complexity of the datasetand improve the actual performances to reach clinical operational acceptanceexpected by our professional consortia. Future improvements are expectedusing this novel medical modality in histopathology, in order to exploit therichness of the spectral and spatial information, going far beyond the humaneye perception.
Acknowledgement
This work is supported by the French National Research Agency ANR,project MICO, reference ANR-10-TECS-015.
27

References
[1] J. Ferlay, I. Soerjomataram, M. Ervik, R. Dikshit, S. Eser, C. Mathers,M. Rebelo, D. Parkin, D. Forman, F. Bray, GLOBOCAN 2012 v1.0,Cancer Incidence and Mortality Worldwide: IARC CancerBase No. 11[Internet], International Agency for Research on Cancer, Lyon, France,2013, available from: http://globocan.iarc.fr/, accessed on Decem-ber 20th, 2013
[2] H. Bloom, W. Richardson, Histological grading and prognosis in breastcancer: a study of 1409 cases of which 359 have been followed for 15years, British Journal of Cancer 11 (3) (1957) 359.
[3] E. Elston, I. Ellis, Method for grading breast cancer., Journal of clinicalpathology 46 (2) (1993) 189.
[4] S. Petushi, F. U. Garcia, M. M. Haber, C. Katsinis, A. Tozeren, Large-scale computations on histology images reveal grade-differentiating pa-rameters for breast cancer, BMC Medical Imaging 6 (1) (2006) 14.
[5] S. Naik, S. Doyle, S. Agner, A. Madabhushi, M. Feldman,J. Tomaszewski, Automated gland and nuclei segmentation for grad-ing of prostate and breast cancer histopathology, in: IEEE InternationalSymposium on Biomedical Imaging: From Nano to Macro (ISBI), IEEE,2008, pp. 284–287.
[6] E. Cosatto, M. Miller, H. P. Graf, J. S. Meyer, Grading nuclear pleomor-phism on histological micrographs, in: 19th International Conference onPattern Recognition (ICPR), 2008, pp. 1–4.
[7] J.-R. Dalle, H. Li, C.-H. Huang, W. K. Leow, D. Racoceanu, T. C.Putti, Nuclear pleomorphism scoring by selective cell nuclei detection,in: IEEE Workshop on Applications of Computer Vision, 2009.
[8] A. R. Chaudhury, K. Iychettira, R. Iyer, A. Sreedevi, Diagnosis of in-vasive ductal carcinoma using image processing techniques, in: Inter-national Conference on International Conference on Image InformationProcessing (ICIIP), IEEE, 2011, pp. 1–6.
[9] M. Dundar, S. Badve, G. Bilgin, V. C. Raykar, R. K. Jain, O. Sertel,M. N. Gurcan, Computerized classification of intraductal breast lesions
28

using histopathological images, IEEE Transactions on Biomedical Engi-neering 58 (7) (2011) 1977–1984.
[10] H. Irshad, S. Jalali, L. Roux, D. Racoceanu, L. Joo-Hwee, G. L. Naour,F. Capron, Automated mitosis detection using texture, sift features andhmax biologically inspired approach, Journal of Pathology informatics4 (2013) 12. doi:10.4103/2153-3559.109870.
[11] H. Irshad, Automated mitosis detection in histopathology using mor-phological and multi-channel statistics features, Journal of PathologyInformatics 4 (2013) 10. doi:10.4103/2153-3539.112695.
[12] H. Irshad, A. Veillard, L. Roux, D. Racoceanu, Methods for Nuclei De-tection, Segmentation and Classification in Digital Histopathology: AReview. Current Status and Future Potential, IEEE Reviews on Biomed-ical Engineering (RBME), 2013, issue 99, pp. 1.
[13] G. Avwioro, Histochemical uses of haematoxylina review, J Pharm ClinSci (JPCS) 1 (2011) 24–34.
[14] G. Meijer, J. Belien, P. Van Diest, J. Baak, Origins of image analysis inclinical pathology, Journal of clinical pathology 50 (5) (1997) 365–370.
[15] T. J. Fuchs, J. M. Buhmann, Computational pathology: Challengesand promises for tissue analysis, Computerized Medical Imaging andGraphics 35 (7) (2011) 515–530.
[16] M. N. Gurcan, L. E. Boucheron, A. Can, A. Madabhushi, N. M. Rajpoot,B. Yener, Histopathological image analysis: A review, IEEE Reviews inBiomedical Engineering 2 (2009) 147–171.
[17] W. H. Wolberg, W. N. Street, O. L. Mangasarian, Breast cytology diag-nosis via digital image analysis, Analytical and Quantitative Cytologyand Histology 15 (6) (1993) 396–404.
[18] R. N. Clark, T. L. Roush, Reflectance spectroscopy: Quantitative anal-ysis techniques for remote sensing applications, Journal of GeophysicalResearch: Solid Earth (19782012) 89 (B7), 1984, pp. 6329-6340.
[19] J. R. Jensen, D. C. Cowen, Remote sensing of urban/suburban infras-tructure and socio-economic attributes, Photogrammetric engineeringand remote sensing, vol. 65, 1999, pp. 611-622.
29

[20] V. Walter, Object-based classification of remote sensing data for changedetection, ISPRS Journal of Photogrammetry and Remote Sensing, vol.58 (3), 2004, pp. 225-238.
[21] T. M. Lillesand, R. W. Kiefer, J. W. Chipman, Remote sensing andimage interpretation, ed 5, John Wiley & Sons Ltd, 2004.
[22] D. Zhang, Z. Guo, G. Lu, L. Zhang, W. Zuo, An online system ofmultispectral palmprint verification, Instrumentation and Measurement,IEEE Transactions on 59 (2), 2010, pp. 480-490.
[23] D. Wei, L. Zhang, D. Zhang, Q. Pan, Studies on hyperspectral facerecognition in visible spectrum with feature band selection, Systems,Man and Cybernetics, Part A: Systems and Humans, IEEE Transactionson 40 (6), 2010, pp. 1354-1361.
[24] P. S. Thenkabail, R. B. Smith, D. E. Pauw, Hyperspectral vegetationindices and their relationships with agricultural crop characteristics, Re-mote sensing of Environment, vol. 71 (2), 2000, pp. 158-182.
[25] Y. Li, Y. Zhu, Y. Tian, W. Cao, Quantitative relationships betweenleaf area index and canopy reflectance spectra of wheat, The journal ofapplied ecology, vol. 17 (8), 2006, 1443.
[26] S. Prigent, X. Descombes, D. Zugaj, L. Petit, A. S. Dugaret, P. Martel,J. Zerubia, Skin lesion evaluation from multispectral images, Researchreport, 2012.
[27] J. Feng, H. Li, J. J. Duan, X. Lv, Y. Zhu, W. Liu, Multispectral BandsSelection of Horticultural Plant Diseases Using Brightness, Photonicsand Optoelectronics (SOPO), 2012 Symposium on, pp. 1-4. IEEE, 2012.
[28] J. Holmquist, Y. Imasoto, E. Bengtsson, B. Olsen, B. Stenkvist, A mi-crospectrophotometric study of Papanicolaou-stained cervical cells asan aid in computerized image processing, Journal of Histochemistry &Cytochemistry, 24 (12), 1976, pp. 1218–1224.
[29] P. Geladi, H. Grahn, K. Esbensen, E. Bengtsson, Image analysis inchemistry II. Multivariate image analysis. TRAC Trends In AnalyticalChemistry, 11(3), 1992, pp. 121-130.
30

[30] C. Stewart, J. Duncan, M. Farquharson, J. Richmond, Fine needle aspi-ration cytology diagnosis of malignant lymphoma and reactive lymphoidhyperplasia., Journal of clinical pathology 51 (3) (1998) 197–203.
[31] E. S. Cibas, B. S. Ducatman, Cytology: Diagnostic principles and clin-ical correlates, Saunders, 2009.
[32] M. E. Plissiti, C. Nikou, A review of automated techniques for cervi-cal cell image analysis and classification, in: Biomedical Imaging andComputational Modeling in Biomechanics, Springer, 2013, pp. 1–18.
[33] Y. Gong, Breast cancer: Pathology, cytology, and core needle biopsymethods for diagnosis, in: M. K. Shetty (Ed.), Breast and GynecologicalCancers, Springer New York, 2013, pp. 19–37.
[34] C. Malon, E. Cosatto, et al., Classification of mitotic figures with convo-lutional neural networks and seeded blob features, Journal of PathologyInformatics 4 (2013) 9. doi:10.4103/2153-3539.112694.
[35] R. M. Levenson, Spectral imaging perspective on cytomics, CytometryPart A 69 (7) (2006) 592–600.
[36] R. M. Levenson, A. Fornari, M. Loda, Multispectral imaging and pathol-ogy: seeing and doing more, Expert Opinion on Medical Diagnostics2 (9) (2008) 1067–1081, pMID: 23495926.
[37] D. C. Fernandez, R. Bhargava, S. M. Hewitt, I. W. Levin, Infrared spec-troscopic imaging for histopathologic recognition, Nature biotechnology23 (4) (2005) 469–474.
[38] R. M. Levenson, J. R. Mansfield, Multispectral imaging in biology andmedicine: slices of life, Cytometry Part A 69 (8) (2006) 748–758.
[39] X. Wu, M. Amrikachi, S. K. Shah, Embedding topic discovery in con-ditional random fields model for segmenting nuclei using multispectraldata, IEEE Transactions on Biomedical Engineering 59 (6) (2012) 1539–1549.
[40] R. Khelifi, M. Adel, S. Bourennane, Multispectral texture characteriza-tion: application to computer aided diagnosis on prostatic tissue images,EURASIP Journal on Advances in Signal Processing 2012 (1) (2012) 1–13.
31
[41] R. M. Levenson, P. J. Cronin, K. K. Pankratov, Spectral imaging forbrightfield microscopy, in: Biomedical Optics 2003, International Societyfor Optics and Photonics, 2003, pp. 27–33.
[42] S. M. Gentry, R. M. Levenson, Biomedical applications of theinformation-efficient spectral imaging sensor (ISIS), in: InternationalBiomedical Optics Symposium (BiOS), International Society for Opticsand Photonics, 1999, pp. 129–142.
[43] M. Roula, A. Bouridane, F. Kurugollu, A. Amira, A quadratic classifierbased on multispectral texture features for prostate cancer diagnosis, in:Seventh International Symposium on Signal Processing and Its Appli-cations, Vol. 2, IEEE, 2003, pp. 37–40.
[44] K. Masood, N. Rajpoot, Texture based classification of hyperspectralcolon biopsy samples using clbp, in: IEEE International Symposiumon Biomedical Imaging: From Nano to Macro ISBI), IEEE, 2009, pp.1011–1014.
[45] L. E. Boucheron, Z. Bi, N. R. Harvey, B. Manjunath, D. L. Rimm, Util-ity of multispectral imaging for nuclear classification of routine clinicalhistopathology imagery, BMC Cell Biology 8 (Suppl 1) (2007) S8.
[46] L. Roux, D. Racoceanu, N. Lomenie, M. Kulikova, H. Irshad, J. Klossa,F. Capron, C. Genestie, G. L. Naour, M. N. Gurcan, Mitosis detectionin breast cancer histological images an icpr 2012 contest, Journal ofPathology Informatics 4 (2013) 8. doi:10.4103/2153-3539.112693.
[47] A. Martinez-Uso, F. Pla, J. Sotoca, P. Garcia-Sevilla, Clustering-basedmultispectral band selection using mutual information, in: PatternRecognition, 2006. ICPR 2006. 18th International Conference on, Vol. 2,2006, pp. 760–763. doi:10.1109/ICPR.2006.375.
[48] M. Kamandar, H. Ghassemian, Maximum relevance, minimum redun-dancy band selection for hyperspectral images, in: Electrical Engineer-ing (ICEE), 2011 19th Iranian Conference on, IEEE, 2011, pp. 1–5.
[49] H. Peng, F. Long, C. Ding, Feature selection based on mutual informa-tion: criteria of max-dependency, max-relevance, and min-redundancy,,IEEE Trans. on Pattern Analysis and Machine Intelligence 27 (8) (2005)1226–1238.
32
[50] MITOS contest 2012, http://ipal.cnrs.fr/ICPR2012.
[51] P. A. Bautista, Y. Yagi, Digital simulation of staining in histopathologymultispectral images: enhancement and linear transformation of spectraltransmittance, Journal of Biomedical Optics 17 (5) (2012) 0560131–05601310.
[52] R. Haralick, K. Shanmugam, I. Dinstein, Textural features for imageclassification, IEEE Trans. on Systems, Man and Cybernetics 3 (1973)610–21.
[53] M. Galloway, Texture analysis using gray level run lengths, CGIP 4(1975) 172–9.
[54] Weka, Url http://www.cs.waikato.ac.nz/˜ml/weka.
[55] R.-E. Fan, K.-W. Chang, C.-J. Hsieh, X.-R. Wang, C.-J. Lin, Liblinear:A library for large linear classification, The Journal of Machine LearningResearch 9 (2008) 1871–1874.
[56] P. A. Devijver, J. Kittler, Pattern recognition: A statistical approach,Prentice/Hall International Englewood Cliffs, NJ, 1982.
[57] M. H. Zweig, G. Campbell, Receiver-operating characteristic (roc) plots:a fundamental evaluation tool in clinical medicine., Clinical chemistry39 (4) (1993) 561–577.
[58] N. C. Ibanez, The ITK Software Guide, First Edition,, published byKitware Inc., 2003.
[59] K. Mosaliganti, L. Cooper, R. Sharp, R. Machiraju, G. Leone, K. Huang,J. Saltz, Reconstruction of cellular biological structures from opticalmicroscopy data, IEEE Transactions on Visualization and ComputerGraphics, 2008, vol 14 (4), 863–876.
Appendix
A - Focal plane Selection using Maximum Gradient
For selection of focal plane, average gradient of mitotic figures from back-ground regions was computed on all the focal planes. The computed gradient
33

vector of image I:
5I =
[∂I
∂x,∂I
∂y
](13)
where ∂I∂x
and ∂I∂y
are partial derivative of I with respect to x and y directions,respectively as:
∂I(x, y)
∂x=I(x+ 1, y)− I(x− 1, y)
2∂I(x, y)
∂y=I(x, y + 1)− I(x, y − 1)
2
(14)
The focal plane that has maximum average gradient (i.e. best focus) isselected for the next steps of the framework.
B - Histograms of mitotic and stroma regions in 10 spectral bands
34

(a) Histogram in SB 8
(b) Histogram in SB 0 (c) Histogram in SB 1 (d) Histogram in SB 2
(e) Histogram in SB 3 (f) Histogram in SB 4 (g) Histogram in SB 5
(h) Histogram in SB 6 (i) Histogram in SB 7 (j) Histogram in SB 9
Figure 12: Histogram analysis of mitotic and stroma regions in 10 spectral bands (SBs).The threshold value T is selected at intersection of both curves.
35