Integration of a Precision Landing System on a Multirotor ...

Multirotor UAV State Prediction throughMulti-Microphone Side-Channel Fusion
Hendrik Vincent Koops1, Kashish Garg2, Munsung Kim2,Jonathan Li2, Anja Volk1 and Franz Franchetti2
Abstract— Improving trust in the state of Cyber-Physical Sys-tems becomes increasingly important as more Cyber-PhysicalSystems tasks become autonomous. Research into the soundof Cyber-Physical Systems has shown that audio side-channelinformation from a single microphone can be used to accuratelymodel traditional primary state sensor measurements such asspeed and gear position. Furthermore, data integration re-search has shown that information from multiple heterogeneoussources can be integrated to create improved and more reliabledata. In this paper, we present a multi-microphone machinelearning data fusion approach to accurately predict ascend-ing/hovering/descending states of a multi-rotor UAV in flight.We show that data fusion of multiple audio classifiers predictsthese states with accuracies over 94%. Furthermore, we signifi-cantly improve the state predictions of single microphones, andoutperform several other integration methods. These resultsadd to a growing body of work showing that microphone side-channel approaches can be used in Cyber-Physical Systems toaccurately model and improve the assurance of primary sensorsmeasurements.
I. INTRODUCTION
Obtaining high-assurance state information (such as speed,location, direction, etc.) from Cyber-Physical Systems (CPS)becomes increasingly important, especially as more of theirtasks become autonomous. A self-driving vehicle that cannotaccurately determine its own position, or a unmanned deliv-ery drone flying in the wrong direction are examples of howincorrect state information can lead to catastrophic incidentsand/or mis-delivered packages.
To determine CPS state, such as speed, acceleration orlocation of CPS, we commonly rely on information from oneor more primary sensor measurements such as speedometers,accelerometers or GPS. However, it has been shown thatmost, if not all sensors are susceptible to attacks. Thisproblem is accelerated by the trend of increased sensorsconnectivity with (wireless) networked systems and theInternet [1], [2], [3], [4]. For GPS for example, this canresult in a false estimation of position. Multiple solutionsto improve trust in sensor information have been proposed.Most of these rely on improving sensor security throughcryptographic solutions or data analysis of the sensor signalto find anomalies that are indicative of falsification [5].
1Hendrik Vincent Koops and Anja Volk are with the Department ofInformation and Computing Sciences, Utrecht University, the Netherlands{h.v.koops}{a.volk}@uu.nl
2 Kashish Garg, Munsung (Bill) Kim, Jonathan Li andFranz Franchetti are with the Department of Electrical andComputer Engineering, Carnegie Mellon University, USA{k.garg}{m.kim}{j.li}{franzf}@ece.cmu.com
Fig. 1. Quadcopter equipped with microphones (positioned in the red cir-cles) close to each rotor. After classifying the sound of each rotor separately,we fuse the classifier outputs to obtain improved ascend/hover/descend statepredictions.
A different approach to improving trust in CPS stateestimation is to use side-channel information from sensorsthat use data from a different domain. Such state estimationsfrom side-channel information can be used to verify or enrichprimary sensor state estimations. For example, in a previousstudy it was shown that microphone audio can be used toaccurately estimate states of a moving vehicle [6]. Theseside-channel estimations can be used in conjunction withprimary sensors to improve the trust of state estimation.
In this paper, we introduce an approach to multi-microphone state prediction of a quadcopter drone in flight.More specifically, we investigate the use of multiple micro-phones as side-channel sensors for state prediction. We showthat using multiple microphones, we can predict with near-perfect accuracy whether a quadcopter is either descending,hovering or ascending. Furthermore, we show that using adata fusion technique, we can accurately assess the relativequality of microphone data, by investigating their deviationfrom the consensus between the microphones.
Contribution. The contributions of this paper are asfollows. First, we show that we can predict ascending,descending and hovering states from the sound a quadcoptermakes. Secondly, we show how predictions from multiplemicrophones can be integrated to obtain an improved stateprediction using data fusion. Thirdly, we show we canaccurately estimate the relative quality of microphone side-channel data using data fusion.
Synopsis. The remainder of this paper is structured asfollows. Section III introduces our method of improvingquadcopter state assurance by predicting and integratingmachine learning outputs from multiple microphone sources.Section IV details the way we evaluate our system. SectionV provides results of these integration methods, and SectionVI closes with conclusions.
15
2017 IEEE International Conference on Multisensor Fusion and Integration for Intelligent Systems (MFI 2017) November 16 - 18, 2017, Daegu, Korea
978-1-5090-6064-1/17/$31.00 ©2017 IEEE

II. BACKGROUND
To establish high trust in a state, humans assess theirenvironment using information from different domains. Forexample, assume we drive a vehicle at a constant speed, andthe speedometer suddenly indicates zero while the sound ofthe engine stays the same. We will immediately assume thatthe speedometer is faulty and trust our other senses that thevehicle is still driving at the same speed. We can use thisintuition in CPS by using side-channel information to makestate predictions. For example, research has shown that audiodata from a microphone can be used to accurately estimatevarious states (i.e. speed and gear position) from a movingvehicle with [6].
Audio state estimation of CPS. Research into using soundfor the analysis of physical systems is not new. Nevertheless,nearly all of this research is aimed at detecting low-levelsystem states, such as malfunction or fault detection ofengines, gears or bearings [7], [8]. We propose to estimatemore complex states from the sound a CPS produces. For this,we take inspiration from a research area related to digitalsignal processing called audio content analysis. Instead ofjust detecting whether a CPS behaves faulty compared to abaseline measurement from the sound it makes, we proposeto investigate more complex states. Some examples aredetecting the state a quadcopter can be in, for examplehovering, descending and ascending.
Data fusion. Recent research in data integration has shownthat information from multiple heterogeneous sources canbe integrated to create improved, and more reliable data[9]. These data fusion techniques have for example beensuccessfully applied in a musical context of integratingcrowd-sourced chord sequences [10]. It was shown thatintegrated data outperforms individual source data, and thatit can be used to accurately estimate the relative qualityof data sources. In this research, we will combine CPSstate estimation from audio with data fusion, to improve theaccuracy of state prediction, and therefore obtain a highertrust in state estimations from sound.
III. QUADCOPTER STATE PREDICTION AND INTEGRATIONFROM AUDIO
This section details the method used to integrate multiplepredictions of the state of a quadcopter from the soundits rotors make during flight. We fly a 3DR IRIS+ quad-copter a predefined flight plan in autopilot mode, whilefour microphones attached to each of the four arms of thequadcopter record the sound of the rotors. During flight, anon-board computer records ground truth state information,as detailed in Section III-A.1. From the audio of each of themicrophones, we extract features that are used in a machinelearning classification task, as detailed in Section III-A.2.We classify the audio features of each of the microphonesindividually, as detailed in Section III-B. To improve the clas-sification results of the individual microphones, we integratetheir predictions, as detailed in Section III-C.
Fig. 2. Schematic pipeline of the proposed system. The sound of each rotoris classified using a Random Forest classifier. The outputs of all classifiersare then integrated using Data Fusion to create an improved state prediction.
A. Data collection
The flight of a quadcopter is easily influenced by weatherconditions such as wind, and the pilot (controller) by meansof overcompensation. To control for pilot influence duringflight, we set up a controlled environment where the quad-copter is flying a preprogrammed path in autopilot mode.The flight plan consists of seven steps:
1) Take-off and ascend to 5 meters2) Hover for 10 seconds3) Ascend to 10 meters4) Hover for 10 seconds5) Descend to 5 meters6) Hover for 10 seconds7) Descend and land
A visualization of this flight path can be found in green inFig. 3. Flights were performed in an open field in dry weatherconditions. During the autopilot flight, we recorded bothground truth state information through telemetry (Section III-A.1) and the sound of each of the rotors (Section III-A.2).
1) Telemetry: During flight, we used the on-board teleme-try system to record quadcopter flight data at a fixed samplingfrequency. In this research, we focus on predicting threestates of the quadcopter during flight: ascending, hoveringand descending (AHD). The quadcopter itself does not recordthis data, but it does record data from which we can derivethese states, i.e. the absolute altitude measured by the on-board GPS receiver.
Obtaining AHD. To calculate AHD, we compute a gradientfrom the altitude data, from which we calculate a stepfunction that describes if the gradient is increasing, stable
16

0 10 20 30 40 50 60Time in seconds
−2
0
2
4
6
8
10
12M
eter
s
Fig. 3. Example of recorded altitude of autopilot flight plan in green andderived ascending (1), hovering (0) and descending (-1) data in red.
or decreasing. We interpret this step function as AHD. Thegradient is calculated through a first-order discrete differenceof the sampled altitudes. Suppose we measure the altitudeat a certain sampling frequency to be [0,5,5,5,0], that is:starting at 0 meter followed by 3 samples at 5 meter andfinally back at 0 meter again. Computing the gradient resultsin differences [5,0,0,−5], from which we only keep the signof the numbers and the zeros. The result of this exampleis [+1,0,0,−1], which we interpret as +1, 0 and −1 asan ascending state, hovering state and descending state,respectively. An example of derived AHD state informationfrom GPS altitude data can be found in red in Fig. 3.
2) Rotor audio feature extraction: To record the sound ofeach quadcopter rotor during flight, we equip the quadcopterwith four microphones, one above each of the arms, closeto the rotors. We record the sound at 44.1 kHz, 16-bit. Asthe spectrogram of an example recording in Fig. 4 shows,the rotor sound is rich in content at higher frequencies.Therefore, the audio is passed through a nonuniform filterbank of 24 bands per octave to increases frequency contentdetail at higher frequencies.
From this filtered signal, we create a logarithmically fil-tered short-time Fourier transform spectrogram at ten framesper second with a frame size of 8192 samples, with aminimum and maximum frequency of 30Hz and 18kHz,respectively. From a visual inspection of the spectrogram,this frequency range was found to have the most importantinformation. From preliminary experiments, it was found thatfrequency analysis beyond these bounds did not significantlyimprove results. Nonuniform filtering and short-time Fouriertransform results in a spectrogram representation of thesignal in 181 bins per audio frame.
3) Context window: Research in a large number of audiocontent analysis experiments has shown that better predictionaccuracies can be achieved by aggregating information overseveral frames instead of using a single frame. Research inspeech recognition [11] and automatic chord estimation [12]provide examples where context windows have proven to besuccessful in improving classification.
Therefore, we concatenate consecutive frames (contextwindow) of the spectrogram to form the input to a classifier.More specifically, to classify frame fi from the spectrogram,we concatenate the frames fi−n/2 to fi+n/2 to create a contextwindow Wi of size n, where n ∈ 2N>0. These concatenatedspectrogram frames are used as input for a classifier. Weexperiment with different window sizes to find the optimalamount of context in terms of classification accuracy.
B. Classification
Although recent advances in deep learning have showngreat results in machine learning using deep architectures,we choose a fast, lightweight solution that in theory can runfrom an on-board quadcopter computer in real-time. Froma preliminary experiment, it was found that the commonlyused Random Forest Classifier (RF) produced the best resultsfrom a selection of learning algorithms. RF [13], [14] is anensemble classifier that uses unpruned classification treescreated from bootstrap samples of the training data andrandom feature selection in tree induction. Prediction is madeby aggregating (majority vote or averaging) the predictionsof the ensemble, thereby creating a strong classifier frommultiple weaker ones. It is beyond the scope of this paperto fully describe RF. For a complete description we refer to[13], [14].
The context window frames of each of the four micro-phones are classified using RF, resulting in four heteroge-neous classification streams. An example of this can befound in Table I, where the classification results of fourconsecutive context windows from the four microphonesM0,M1,M2 and M3 can be found. We hypothesize that theshared information between the microphones can be usedto improve the classification accuracy over using a singlemicrophone. To integrate the shared information between themicrophones, we propose to use data fusion and compare itsresults with other integration methods.
C. Integration
To find the best state predictions among the classificationresults of four individual microphones, we explore severalintegration methods. We compare the baseline methods ran-dom picking and majority voting with data fusion integration,and compare them with the average microphone accuracy.
0 10 20 30 40 50 60Time in seconds
5
8
12
16
Freq
uenc
y (k
Hz)
Fig. 4. Example of a spectrogram of rotor audio, while a quadcopterperforms the sequence described in Section III-A and Fig. 3
17

TABLE ISTATES (ASCEND, HOOVER, AND DESCEND) PREDICTED FROM A
SEQUENCE (Wi . . .Wi+3) OF AUDIO CONTEXT WINDOWS FROM FOUR
MICROPHONES M(0...3).
Wi Wi+1 Wi+2 Wi+3M0 Ascend Descend Descend HoverM1 Ascend Hover Hover HoverM2 Ascend Hover Descend DescendM3 Ascend Hover Descend Descend
1) Random Picking (RND): selects a state from a ran-domly picked microphone for every context window. For theexample in Table I, RND essentially picks one state from34 possible state combinations by picking a state from arandomly chosen microphone per context window.
2) Majority Voting (MV): selects the most frequent stateshared between the microphones for every context window.In case multiple states are most frequent, we randomly pickfrom the most frequent states. For the example in Table I,MV would result in either Ascend, Hover, Descend,Hover or Ascend, Hover, Descend, Descend.
3) Data Fusion (DF): can be viewed as an extension ofmajority voting in the sense that in addition to finding themost common state per audio context window, it also usesthe agreement between microphones to integrate data. Mi-crophones with higher agreement with other microphones areconsidered to be more trustworthy. We propose to a methodadapted from ACCUCOPY model introduced by Dong et al. in[9], [15] to integrate conflicting databases. This model waspreviously successfully applied in a musical context, whereit showed to outperform baseline methods in an automaticchord extraction task [10]. In this study, we propose tointegrate RF state predictions from four microphones. In thefollowing sections, we refer to the RF output of a singlemicrophone as a source, which provides a sequence ofstate predictions. Calculating DF involves the computationof source accuracy, vote counts, and state probabilities.
Source accuracy is calculated by taking the arithmeticmean of the probabilities of all states the source provides.As an example, suppose we estimate the probabilities ofthe states in Table I based on their frequency count (c.q.likelihood). That is, Ascend for the first column is 1,Descend for the second column is 1/4, etc. Taking theaverage of the state probabilities of the first source in ourexample of Table I we can calculate the source accuracyA(M0) of M0 as follows:
A(M0) =1+ 1/4+ 3/4+ 1/2
4= 0.625 (1)
In the same way, we can calculate the source accuracies forthe other three sources which are 0.625, 0.75 and 0.75 forM1, M2 and M3 respectively.
Assuming that the sources are independent, then the prob-ability that a source provides a correct state is its sourceaccuracy. Conversely, the probability that a source providesan incorrect state is the fraction of the inverse of the sourceaccuracy over all possible incorrect values n: (1−A(M))
n . In our
case n = 2, since we have three possible states. The states ofsources with higher source accuracies are more likely to beselected through the use of vote counts.
Vote counts are used as weights for the probabilities ofthe states they provide. With n and A(Mi) we can derive avote count VS(Mi) of a source Mi. The vote count of a sourceis computed as follows:
VS(Mi) = lnnA(Mi)
1−A(Mi)(2)
Applied to our example, this results in vote counts of 2.62for M0 and M1, and 2.80 for M2 and M3. The higher votecount for M2 and M3 means that its values are more likelyto be correct than those of M0 and M1.
State probabilities: After having defined the accuracy ofa source, we can now determine which states provided by allthe sources are most likely correct, by taking into accountsource accuracy. In the computation of state probabilities wetake into account a) the number of sources that provide thosestates and b) the accuracy of their sources. With these valueswe calculate the vote count VC(L ) of a state L , which iscomputed as the sum of the vote counts of its providers:
VC(L ) = ∑σ∈SL
VS(σ) (3)
where SL is the set of all sources that provide the state L .For example, for the vote count of Hover in the last columnof the example in Table I, we take the sum of the vote countsof M0 and M1. For the vote count of Descend we take thesum of the vote counts of M2 and M3. To calculate stateprobabilities from state vote counts, we take the fraction ofthe state vote count and the state vote counts of all possiblestates D:
P(L ) =exp(VC(L ))
Σl∈D exp(VC(l))(4)
Applied to our example from Table I, we see that solv-ing this equation for Hover results in a probability ofP(Hover) ≈ 0.39, and for Descend results in a proba-bility of P(Descend) ≈ 0.56. Instead of having to chooserandomly as would be necessary in a majority vote, we cannow see that Descend is more probable to be the correctstate, because it is provided by sources that are overall moretrustworthy.
Iterative computation. State likelihoods and source ac-curacy are defined in terms of each other, which posesa problem for calculating these values. As a solution, weinitialize the state likelihoods with equal probabilities anditeratively compute state likelihoods and source accuracyuntil the state probabilities converge or oscillation of valuesis detected. The resulting state is composed of the states withthe highest likelihoods.
For detailed Bayesian analyses of the techniques men-tioned above we refer to [15], [16]. With regard to thescalability of data fusion, it has been shown that DF withsource dependency runs in polynomial time [15]. Further-more, [17] proposes a scalability method for very large datasets, reducing the time for source dependency calculation bytwo to three orders of magnitude.
18

4) Average Microphone Accuracy (AVG): To assess theimprovement over the average microphone in terms ofclassification accuracy, we also compare the results of DF,RND and MV with the average classification accuracy ofthe microphones. Computing AVG simply produces the non-weighted mean of the accuracies (i.e. the proportion oftrue correct classifications compared to the ground truth)of all four microphones. Comparing the integration methodswith AVG will show how much on average the integrationmethods will improve the classification results of the averagemicrophone.
IV. EVALUATION
We evaluate our system of audio feature extraction, classi-fication and data integration integration accuracy using cross-validation (Section IV-A). Furthermore, we investigate theData Fusion source accuracy measure (Section IV-B).
A. Integration Accuracy
To evaluate the integration methods, we perform cross-validation on 15 different iterations of the flight plan men-tioned in Section III-A.1. For each of the 4 microphones,for all 15 flights, we perform 20-fold frame-wise crossvalidation on randomly selected 70/30% train/test set splitsof the shuffled data. For each fold, a RF classifier is trainedon the training set of the folds and tested on the testingset of the folds. The output of RF on the test set of eachthe microphones is integrated using each integration method(DF, RND, and MV). The average accuracy of the 20 foldsis reported as the classification accuracy of each integrationmethod. We repeat this process for each context window size.
To evaluate the output quality of each integration method,we compare their accuracies (i.e. the fraction of correctclassifications with regard to the ground truth). We alsocompare these scores with the average microphone accuracy(AVG) to see how much integration improves classificationfrom an average microphone. These results show whether wecan improve the trust in quadcopter state estimation by datafusing audio side-channel data from multiple microphones,compared to using a single microphone.
B. Data Fusion Source Accuracy
Research in other domains has shown that DF SourceAccuracy can be used as a way to rank sources by theirquality without having ground truth knowledge [9], [10]. Toevaluate it in the context of CPS in this paper, we comparefor each microphone its DF Source Accuracy with its groundtruth accuracy. This reveals if DF Source Accuracy is usefulfor estimating microphone data quality from their agreementwith the other microphones.
V. RESULTS
A. Integration Accuracy.
Classification results for several context window sizesfor the different integration methods DF, MV and RND canbe found in Fig. 5. The figure shows that DF producesthe best results of all integration methods, up to 94.2%,
1 5 9 13 17 21 25 29 33 37 41 45 49Context window size in number of frames
65.0
70.0
75.0
80.0
85.0
90.0
95.0
Accu
racy
0.1 0.5 0.9 1.3 1.7 2.1 2.5 2.9 3.3 3.7 4.1 4.5 4.9Context window size in seconds
Average MicrophoneData Fusion
Majority VotingRandom Picking
Fig. 5. Average 20-fold cross-validation classification results for Data Fu-sion (DF), Majority Voting (MV), and Random Picking (RND) of integratingthe classifications of four microphones for several audio context windowsizes. Average accuracy (AVG) shows the average microphone accuracy.
outperforming all other integration methods by around 10to 20 percentage points. For every context window size DFperforms significantly better than MV with p � 0.01 usinga Wilcoxon signed-rank test for the null hypothesis thattwo related paired samples come from the same distribution[18]. MV improves the average microphone accuracy with5.5 percentage points on average for every context size.RND does not improve the average microphone classification,performing equally with the average microphone at everycontext window size.
Effect of context window size. Fig. 5 shows that classifi-cation results for all methods improve with context windowsize, but DF seems to be more robust to this effect. DF, incontrast to the other integration methods, takes into accountthe agreement between sources through the DF Source Ac-curacy measure. This way, information shared between thesources over all windows is used to integrate data, insteadof just using information from a single frame in MV, RND.
Increasing the context window size increases the reactiontime of the system: if more frames are needed to make agood state estimation, more time is needed. Therefore, thesmaller the frame size the better. We find that DF integrationstabilizes after around context windows sizes of 13 frames(or 1.3 seconds). For the other integration methods, wefind that accuracy increases almost linearly with contextwindow size. This shows that DF is better at finding usefulshared knowledge between the microphones to make a goodintegration, compared to the other integration methods.
B. DF Source Accuracy.
An important part of data fusion is the computation of aDF source accuracy per source. DF source accuracy providesan agreement score for each source relative to the othersources, which is used for selecting the best values fromthe most accurate sources. This ranking can be used in CPSfor the estimation of sensor quality. For example, in ourapplication of data fusion for the integration of microphoneclassifications, DF source accuracy can provide a rankingof microphone trustworthiness, without having ground truth
19
0.55 0.60 0.65 0.70 0.75 0.80 0.85 0.90Microphone Accuracy
0.55
0.60
0.65
0.70
0.75
0.80
0.85
0.90
DF
Sou
rce
Acc
urac
y
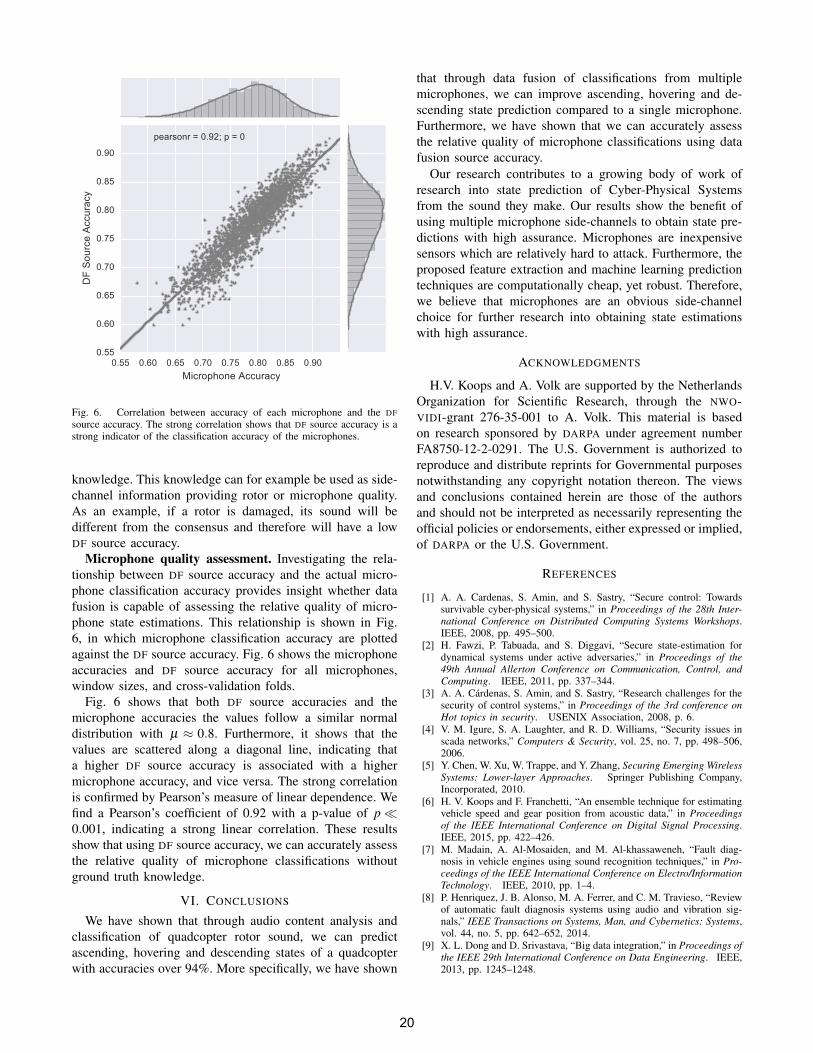
pearsonr = 0.92; p = 0
Fig. 6. Correlation between accuracy of each microphone and the DFsource accuracy. The strong correlation shows that DF source accuracy is astrong indicator of the classification accuracy of the microphones.
knowledge. This knowledge can for example be used as side-channel information providing rotor or microphone quality.As an example, if a rotor is damaged, its sound will bedifferent from the consensus and therefore will have a lowDF source accuracy.
Microphone quality assessment. Investigating the rela-tionship between DF source accuracy and the actual micro-phone classification accuracy provides insight whether datafusion is capable of assessing the relative quality of micro-phone state estimations. This relationship is shown in Fig.6, in which microphone classification accuracy are plottedagainst the DF source accuracy. Fig. 6 shows the microphoneaccuracies and DF source accuracy for all microphones,window sizes, and cross-validation folds.
Fig. 6 shows that both DF source accuracies and themicrophone accuracies the values follow a similar normaldistribution with µ ≈ 0.8. Furthermore, it shows that thevalues are scattered along a diagonal line, indicating thata higher DF source accuracy is associated with a highermicrophone accuracy, and vice versa. The strong correlationis confirmed by Pearson’s measure of linear dependence. Wefind a Pearson’s coefficient of 0.92 with a p-value of p �0.001, indicating a strong linear correlation. These resultsshow that using DF source accuracy, we can accurately assessthe relative quality of microphone classifications withoutground truth knowledge.
VI. CONCLUSIONS
We have shown that through audio content analysis andclassification of quadcopter rotor sound, we can predictascending, hovering and descending states of a quadcopterwith accuracies over 94%. More specifically, we have shown
that through data fusion of classifications from multiplemicrophones, we can improve ascending, hovering and de-scending state prediction compared to a single microphone.Furthermore, we have shown that we can accurately assessthe relative quality of microphone classifications using datafusion source accuracy.
Our research contributes to a growing body of work ofresearch into state prediction of Cyber-Physical Systemsfrom the sound they make. Our results show the benefit ofusing multiple microphone side-channels to obtain state pre-dictions with high assurance. Microphones are inexpensivesensors which are relatively hard to attack. Furthermore, theproposed feature extraction and machine learning predictiontechniques are computationally cheap, yet robust. Therefore,we believe that microphones are an obvious side-channelchoice for further research into obtaining state estimationswith high assurance.
ACKNOWLEDGMENTS
H.V. Koops and A. Volk are supported by the NetherlandsOrganization for Scientific Research, through the NWO-VIDI-grant 276-35-001 to A. Volk. This material is basedon research sponsored by DARPA under agreement numberFA8750-12-2-0291. The U.S. Government is authorized toreproduce and distribute reprints for Governmental purposesnotwithstanding any copyright notation thereon. The viewsand conclusions contained herein are those of the authorsand should not be interpreted as necessarily representing theofficial policies or endorsements, either expressed or implied,of DARPA or the U.S. Government.
REFERENCES
[1] A. A. Cardenas, S. Amin, and S. Sastry, “Secure control: Towardssurvivable cyber-physical systems,” in Proceedings of the 28th Inter-national Conference on Distributed Computing Systems Workshops.IEEE, 2008, pp. 495–500.
[2] H. Fawzi, P. Tabuada, and S. Diggavi, “Secure state-estimation fordynamical systems under active adversaries,” in Proceedings of the49th Annual Allerton Conference on Communication, Control, andComputing. IEEE, 2011, pp. 337–344.
[3] A. A. Cardenas, S. Amin, and S. Sastry, “Research challenges for thesecurity of control systems,” in Proceedings of the 3rd conference onHot topics in security. USENIX Association, 2008, p. 6.
[4] V. M. Igure, S. A. Laughter, and R. D. Williams, “Security issues inscada networks,” Computers & Security, vol. 25, no. 7, pp. 498–506,2006.
[5] Y. Chen, W. Xu, W. Trappe, and Y. Zhang, Securing Emerging WirelessSystems: Lower-layer Approaches. Springer Publishing Company,Incorporated, 2010.
[6] H. V. Koops and F. Franchetti, “An ensemble technique for estimatingvehicle speed and gear position from acoustic data,” in Proceedingsof the IEEE International Conference on Digital Signal Processing.IEEE, 2015, pp. 422–426.
[7] M. Madain, A. Al-Mosaiden, and M. Al-khassaweneh, “Fault diag-nosis in vehicle engines using sound recognition techniques,” in Pro-ceedings of the IEEE International Conference on Electro/InformationTechnology. IEEE, 2010, pp. 1–4.
[8] P. Henriquez, J. B. Alonso, M. A. Ferrer, and C. M. Travieso, “Reviewof automatic fault diagnosis systems using audio and vibration sig-nals,” IEEE Transactions on Systems, Man, and Cybernetics: Systems,vol. 44, no. 5, pp. 642–652, 2014.
[9] X. L. Dong and D. Srivastava, “Big data integration,” in Proceedings ofthe IEEE 29th International Conference on Data Engineering. IEEE,2013, pp. 1245–1248.
20
[10] H. V. Koops, W. B. de Haas, D. Bountouridis, and A. Volk, “Integrationand quality assessment of heterogeneous chord sequences using datafusion,” in Proceedings of the 17th International Society for MusicInformation Retrieval Conference, 2016, pp. 178–184.
[11] G. Hinton, L. Deng, D. Yu, G. E. Dahl, A.-r. Mohamed, N. Jaitly,A. Senior, V. Vanhoucke, P. Nguyen, T. N. Sainath et al., “Deep neuralnetworks for acoustic modeling in speech recognition: The sharedviews of four research groups,” IEEE Signal Processing Magazine,vol. 29, no. 6, pp. 82–97, 2012.
[12] F. Korzeniowski and G. Widmer, “Feature learning for chord recog-nition: The deep chroma extractor,” in Proceedings of the 17th Int.Society for Music Information Retrieval Conference, 2016.
[13] T. K. Ho, “Random decision forests,” in Proceedings of the ThirdInternational Conference on Document Analysis and Recognition,vol. 1. IEEE, 1995, pp. 278–282.
[14] ——, “The random subspace method for constructing decisionforests,” IEEE Transactions on Pattern Analysis and Machine Intelli-gence, vol. 20, no. 8, pp. 832–844, 1998.
[15] X. L. Dong, L. Berti-Equille, and D. Srivastava, “Integrating conflict-ing data: the role of source dependence,” Proceedings of the VLDBEndowment, vol. 2, no. 1, pp. 550–561, 2009.
[16] X. L. Dong and D. Srivastava, “Big data integration,” SynthesisLectures on Data Management, vol. 7, no. 1, pp. 1–198, 2015.
[17] X. Li, X. L. Dong, K. B. Lyons, W. Meng, and D. Srivastava, “Scalingup copy detection,” in Proceedings of the IEEE 31st InternationalConference on Data Engineering. IEEE, 2015, pp. 89–100.
[18] F. Wilcoxon, “Individual comparisons by ranking methods,” Biomet-rics bulletin, vol. 1, no. 6, pp. 80–83, 1945.
21