Multiresidue Screening of Agricultural Chemicals (I) … Screening of Agricultural Chemicals (I) and...
12
Multiresidue Screening of Agricultural Chemicals (I) and (II) in Food According to the Japan Positive List Using Agilent Cartridge-Based SPE and LC/MS/MS Authors Eugene Chang, Kazuyuki Yamashita, Nigel Simpson, and Ritu Arora Agilent Technologies, Inc. Application Note Food Testing and Agriculture Abstract Japan implemented new regulations on May 29, 2006 for residues of agricultural chemicals in food. Japan’s Ministry of Health, Labor, and Welfare (MHLW), equivalent to the US FDA, introduced the Positive List for detection of pesticides, feed additives, and veterinary drugs (collectively referred to as agricultural chemicals) remaining in foods [1]. The legislation was developed to prohibit the distribution of foods that contain agricultural chemicals above a certain level of maximum residue limits (MRLs). The regulations apply to all domestically produced and imported foodstuffs and lists almost 800 chemicals. The Western Pacific/Australasia region mostly tests according to this list, and, as Japan is the biggest importer in the region, all other countries tend to follow its guidelines. The regulation requires that analysts apply a set of testing protocols that use classic cartridge-based SPE and LC/MS or GC/MS techniques, and requires that no agricultural chemical exceed the MRL (0.01 ppm). This application note describes two methods to screen multi-residues of agricultural chemicals in food extracts according to the analytical methods listed in the Japan Positive List. A mix of 67 neutral, basic, and acidic chemicals was analyzed by two different methods, both employing LC/MS/MS. Using high-resolution Agilent Pursuit XRs C18 columns and tandem MS/MS detection, good chromatographic and mass spectrometric separation was achieved for two pairs of isomers in one of the groups. The data generated offers a complete solutions package of Agilent Bond Elut Carbon/Amino (Dual phase), Bond Elut Silica SPE, and Pursuit HPLC products for screening challenging agricultural chemicals within the expected MRLs of the Japan Positive List in several food matrices.
Transcript of Multiresidue Screening of Agricultural Chemicals (I) … Screening of Agricultural Chemicals (I) and...
Multiresidue Screening of AgriculturalChemicals (I) and (II) in Food Accordingto the Japan Positive List Using AgilentCartridge-Based SPE and LC/MS/MS
Authors
Eugene Chang, Kazuyuki Yamashita,
Nigel Simpson, and Ritu Arora
Agilent Technologies, Inc.
Application NoteFood Testing and Agriculture
Abstract
Japan implemented new regulations on May 29, 2006 for residues of agricultural
chemicals in food. Japan’s Ministry of Health, Labor, and Welfare (MHLW),
equivalent to the US FDA, introduced the Positive List for detection of pesticides,
feed additives, and veterinary drugs (collectively referred to as agricultural
chemicals) remaining in foods [1] . The legislation was developed to prohibit the
distribution of foods that contain agricultural chemicals above a certain level of
maximum residue limits (MRLs). The regulations apply to all domestically produced
and imported foodstuffs and lists almost 800 chemicals. The Western
Pacific/Australasia region mostly tests according to this list, and, as Japan is the
biggest importer in the region, all other countries tend to follow its guidelines. The
regulation requires that analysts apply a set of testing protocols that use classic
cartridge-based SPE and LC/MS or GC/MS techniques, and requires that no
agricultural chemical exceed the MRL (0.01 ppm).
This application note describes two methods to screen multi-residues of agricultural
chemicals in food extracts according to the analytical methods listed in the Japan
Positive List. A mix of 67 neutral, basic, and acidic chemicals was analyzed by
two different methods, both employing LC/MS/MS. Using high-resolution Agilent
Pursuit XRs C18 columns and tandem MS/MS detection, good chromatographic and
mass spectrometric separation was achieved for two pairs of isomers in one of the
groups. The data generated offers a complete solutions package of Agilent Bond
Elut Carbon/Amino (Dual phase), Bond Elut Silica SPE, and Pursuit HPLC products
for screening challenging agricultural chemicals within the expected MRLs of the
Japan Positive List in several food matrices.

2
Introduction
The Japanese Positive List systemAfter the implementation date, foods containing residuesexceeding the MRL levels on the Positive List are regarded asviolations of the Food Sanitation Law and are prohibited frombeing sold or used as food in Japan [2,3]. The MHLWestablished a uniform limit of 0.01 ppm, which is themaximum allowable limit for combinations of chemicals andcommodities that have no official or provisional MRLs. TheMHLW also listed 15 chemicals for which no residues may bedetected because of high human health risks and 65substances used as agricultural chemicals for exemption fromthe regulation [4,5,6]. The MHLW established provisionalMRLs on some processed foods besides raw commodities,mainly by adopting the Codex standards. For residues inprocessed foods without provisional MRLs, the MHLW isusing the provisional MRLs of raw ingredients afterconverting them based on water content and taking intoconsideration concentration ratios. With these new
regulations, the MHLW is not changing its monitoring plan forimported foods, except that each sample will be tested formore residues. The same number of samples, however, will betaken and there will be no new documentation or datarequirements from the MHLW after the implementation.
Experimental
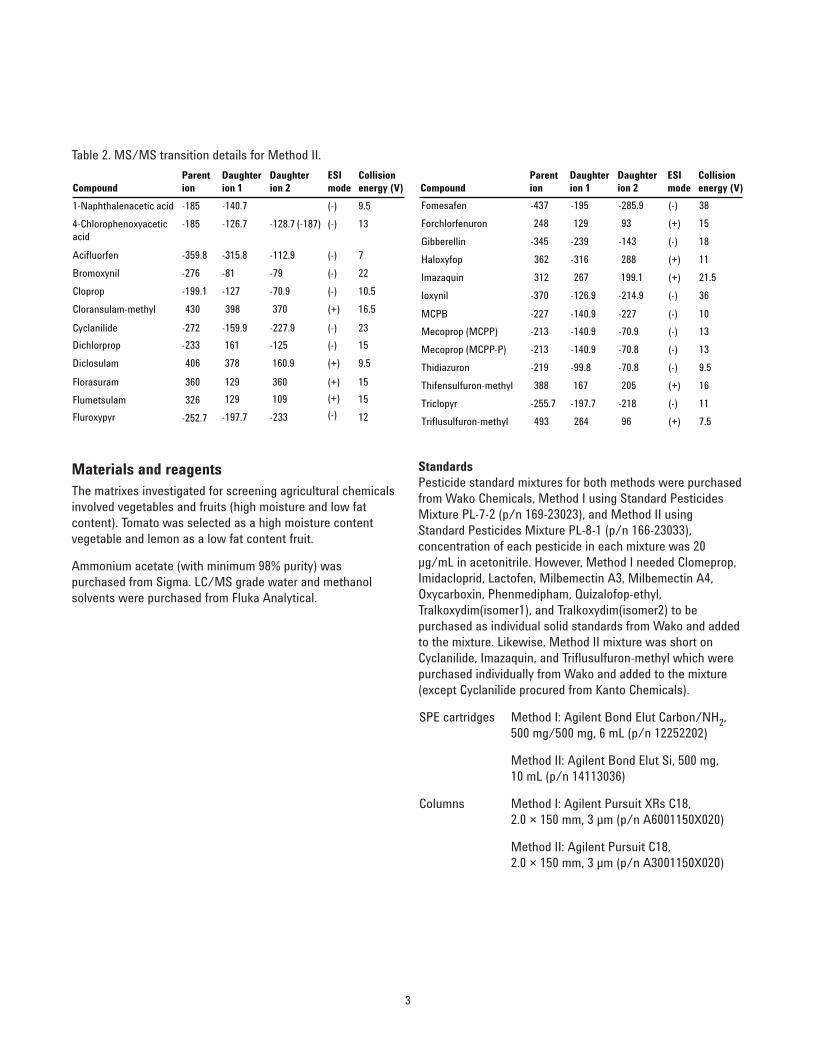
The MHLW has published several methods for the extractionand analysis of plant- and animal-based foods [7]. Dependingupon the target compounds, the extracts are analyzed byLC/MS or GC/MS. Out of the 8 government recommendedtest methods, multi-residue screening of veterinary drugs inmeat by Methods I and II and LC/MS has already beeninvestigated [8]. In this particular study, multiresiduescreening for agricultural chemicals in food followingMethods I and II was looked at by LC/MS. Among the 799compounds in the Japan Positive List, 67 compounds areanalyzed by LC/MS methods, 42 analytes come under LC/MSMethod I and 25 analytes fall under LC/MS Method II, asshown in Tables 1 and 2.
Table 1. MS/MS transition details for Method I.
Note: The negative sign before ions analyzed in negative mode is not a common way of differentiating positive and negative modes of ionization. However, theyare represented in this manner in Tables 1 and 2 as per stipulations in the MHLW document [7].
CompoundParent ion
Daughter ion 1
Daughter ion 2
ESI mode
Collision energy (V) Compound
Parent ion
Daughter ion 1
Daughter ion 2
ESI mode
Collision energy (V)
Abamectin Bla 891 305 567 (+) 25 Isoxaflutole 360 251 144 (+) 15
Anilofos 368 199 125 (+) 12 Lactofen 479 344 223 (+) 18
Azinphos-methyl 318 160 77 (+) 10 (-)Methoxyfenozide -367 -149 -105 18
Azamethiphos 325 183 112 (+) 15 Milbemectin A3 551 343.8 240 (+) 18
Benzofenap 431 105 119 (+) 25 Milbemectin A4 565 337 240 (+) 27
Butafenacil 492 331 180 (+) 20 Naproanilide 292 171 120 (+) 12
Chloridazon 222 92 77 (+) 23 (-)Oryzalin -345 -281 -78 17.5
Chromafennozide 395 175 147 (+) 18 Oxycarboxin 268 175 147 (+) 12
Clomeprop 324 120 105 (+) 15 Phenmedipham 301 168 136 (+) 7
Clonquintcet-mexyl 336 238 192 (+) 15 Pyrazolynate 439 91 229 (+) 25
Clothianidin 250 169 132 (+) 11 Pyriftalid 319 139 93 (+) 25
Cyazofamid 413 295 241 (+) 12 Quizalofop-ethyl 373 299 85 (+) 15
Cyflufenamid 325 108 261 (+) 9.5 Simeconazole 294 70 73 (+) 15
Dimethirimol 210 71 140 (+) 28 Thiabendazole 202 175 131 (+) 21
Fenoxycarb 302 116 88 (+) 10 Thiacloprid 253 126 90 (+) 18
Ferimzone (E) 255 132 91 (+) 20 Thiamethoxam 292 211 181 (+) 10.5
Furathiocarb 383 252 195 (+) 15 Tralkoxydim (isomer 2) -328 -254 -66 22(-)
Ferimzone (Z) 255 124 91 (+) 25 Tralkoxydim (isomer 1) -328 -254 -66 22(-)
Imidacloprid 256 209 175 (+) 10 Tridemorph (isomer 1) 298 130 98 (+) 15
Indoxacarb 528 150 203 (+) 18.5 Tridemorph (isomer 2) 298 130 98 (+) 15
Iprovalicarb 321 119 203 (+) 20 Triticonazole 318 70 125 (+) 12
3
Materials and reagentsThe matrixes investigated for screening agricultural chemicalsinvolved vegetables and fruits (high moisture and low fatcontent). Tomato was selected as a high moisture contentvegetable and lemon as a low fat content fruit.
Ammonium acetate (with minimum 98% purity) waspurchased from Sigma. LC/MS grade water and methanolsolvents were purchased from Fluka Analytical.
CompoundParent ion
Daughter ion 1
Daughter ion 2
ESI mode
Collision energy (V) Compound
Parent ion
Daughter ion 1
Daughter ion 2
ESI mode
Collision energy (V)
1-Naphthalenacetic acid -185 -140.7 (-) 9.5
(-)4-Chlorophenoxyacetic acid
-185 -126.7 -128.7 (-187) 13
(-)Acifluorfen -359.8 -315.8 -112.9 7
(-)Bromoxynil -276 -81 -79 22
(-)Cloprop -199.1 -127 -70.9 10.5
Cloransulam-methyl 430 398 370 (+) 16.5
(-)Cyclanilide -272 -159.9 -227.9 23
(-)Dichlorprop -233 161 -125 15
Diclosulam 406 378 160.9 (+) 9.5
Florasuram 360 129 360 (+) 15
Flumetsulam 326 129 109 (+) 15
(-)Fluroxypyr -252.7 -197.7 -233 12
(-)Fomesafen -437 -195 -285.9 38
Forchlorfenuron 248 129 93 (+) 15
(-)Gibberellin -345 -239 -143 18
Haloxyfop 362 -316 288 (+) 11
Imazaquin 312 267 199.1 (+) 21.5
(-)Ioxynil -370 -126.9 -214.9 36
(-)MCPB -227 -140.9 -227 10
(-)Mecoprop (MCPP) -213 -140.9 -70.9 13
(-)Mecoprop (MCPP-P) -213 -140.9 -70.8 13
(-)Thidiazuron -219 -99.8 -70.8 9.5
Thifensulfuron-methyl 388 167 205 (+) 16
(-)Triclopyr -255.7 -197.7 -218 11
Triflusulfuron-methyl 493 264 96 (+) 7.5
Table 2. MS/MS transition details for Method II.
StandardsPesticide standard mixtures for both methods were purchasedfrom Wako Chemicals, Method I using Standard PesticidesMixture PL-7-2 (p/n 169-23023), and Method II usingStandard Pesticides Mixture PL-8-1 (p/n 166-23033),concentration of each pesticide in each mixture was 20µg/mL in acetonitrile. However, Method I needed Clomeprop,Imidacloprid, Lactofen, Milbemectin A3, Milbemectin A4,Oxycarboxin, Phenmedipham, Quizalofop-ethyl,Tralkoxydim(isomer1), and Tralkoxydim(isomer2) to bepurchased as individual solid standards from Wako and addedto the mixture. Likewise, Method II mixture was short onCyclanilide, Imazaquin, and Triflusulfuron-methyl which werepurchased individually from Wako and added to the mixture(except Cyclanilide procured from Kanto Chemicals).
SPE cartridges Method I: Agilent Bond Elut Carbon/NH2,500 mg/500 mg, 6 mL (p/n 12252202)
Method II: Agilent Bond Elut Si, 500 mg,10 mL (p/n 14113036)
Columns Method I: Agilent Pursuit XRs C18, 2.0 × 150 mm, 3 µm (p/n A6001150X020)
Method II: Agilent Pursuit C18, 2.0 × 150 mm, 3 µm (p/n A3001150X020)
4
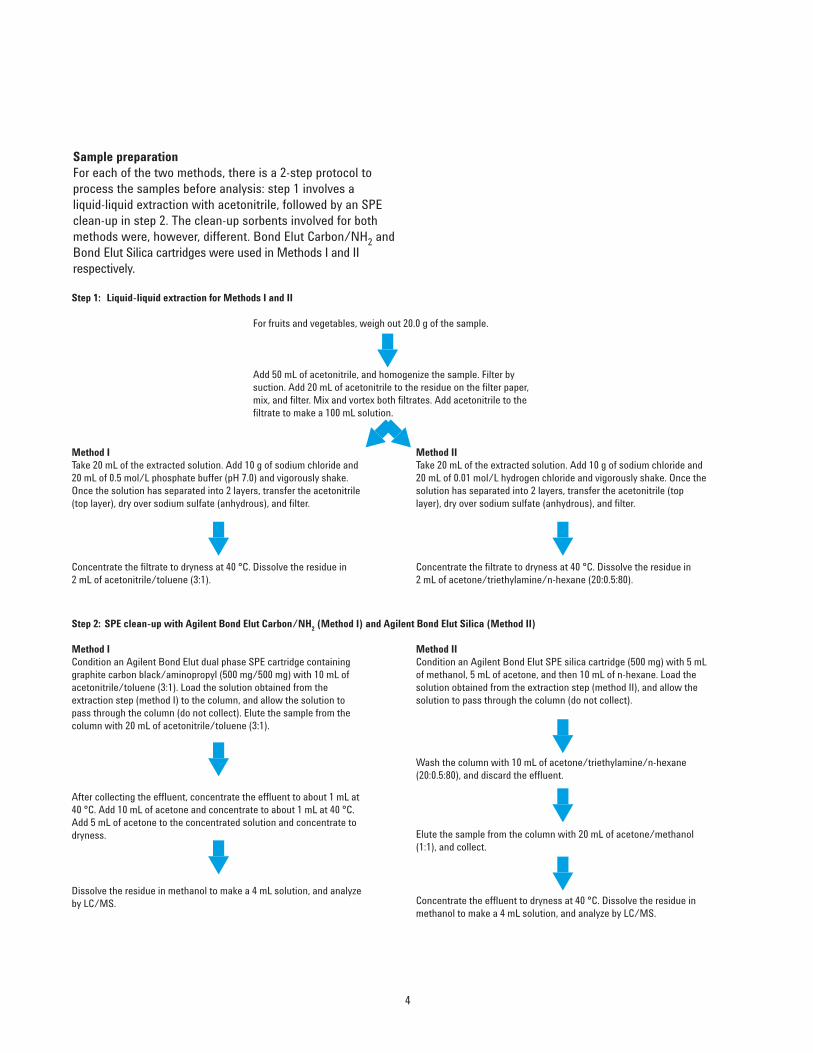
Sample preparationFor each of the two methods, there is a 2-step protocol toprocess the samples before analysis: step 1 involves a liquid-liquid extraction with acetonitrile, followed by an SPEclean-up in step 2. The clean-up sorbents involved for bothmethods were, however, different. Bond Elut Carbon/NH2 andBond Elut Silica cartridges were used in Methods I and IIrespectively.
Step 1: Liquid-liquid extraction for Methods I and II
Method ITake 20 mL of the extracted solution. Add 10 g of sodium chloride and 20 mL of 0.5 mol/L phosphate buffer (pH 7.0) and vigorously shake. Once the solution has separated into 2 layers, transfer the acetonitrile (top layer), dry over sodium sulfate (anhydrous), and filter.
Method IITake 20 mL of the extracted solution. Add 10 g of sodium chloride and 20 mL of 0.01 mol/L hydrogen chloride and vigorously shake. Once the solution has separated into 2 layers, transfer the acetonitrile (top layer), dry over sodium sulfate (anhydrous), and filter.
Add 50 mL of acetonitrile, and homogenize the sample. Filter by suction. Add 20 mL of acetonitrile to the residue on the filter paper, mix, and filter. Mix and vortex both filtrates. Add acetonitrile to the filtrate to make a 100 mL solution.
For fruits and vegetables, weigh out 20.0 g of the sample.
Concentrate the filtrate to dryness at 40 °C. Dissolve the residue in 2 mL of acetone/triethylamine/n-hexane (20:0.5:80).
Concentrate the filtrate to dryness at 40 °C. Dissolve the residue in 2 mL of acetonitrile/toluene (3:1).
Method ICondition an Agilent Bond Elut dual phase SPE cartridge containing graphite carbon black/aminopropyl (500 mg/500 mg) with 10 mL of acetonitrile/toluene (3:1). Load the solution obtained from the extraction step (method I) to the column, and allow the solution to pass through the column (do not collect). Elute the sample from the column with 20 mL of acetonitrile/toluene (3:1).
After collecting the effluent, concentrate the effluent to about 1 mL at 40 °C. Add 10 mL of acetone and concentrate to about 1 mL at 40 °C. Add 5 mL of acetone to the concentrated solution and concentrate to dryness.
Dissolve the residue in methanol to make a 4 mL solution, and analyze by LC/MS.
Method IICondition an Agilent Bond Elut SPE silica cartridge (500 mg) with 5 mL of methanol, 5 mL of acetone, and then 10 mL of n-hexane. Load the solution obtained from the extraction step (method II), and allow the solution to pass through the column (do not collect).
Wash the column with 10 mL of acetone/triethylamine/n-hexane (20:0.5:80), and discard the effluent.
Elute the sample from the column with 20 mL of acetone/methanol (1:1), and collect.
Concentrate the effluent to dryness at 40 °C. Dissolve the residue in methanol to make a 4 mL solution, and analyze by LC/MS.
Step 2: SPE clean-up with Agilent Bond Elut Carbon/NH2 (Method I) and Agilent Bond Elut Silica (Method II)

5
Instrument ConditionsColumns Method I: Agilent Pursuit XRs C18, 2.0 × 150 mm, 3 µm
Method II: Agilent Pursuit C18, 2.0 × 150 mm, 3 µm
Mobile phase A: H2O + 3 mM ammonium acetateB: CH3OH + 3 mM ammonium acetate
Gradient Time: %A %B0:00 85.0 15.01:00 60.0 40.03.50 60.0 40.06:00 50.0 50.08:00 45.0 55.017:50 5.0 95.030:00 5.0 95.030:06 85.0 15.040:00 85.0 15.0
Flow rate 0.2 mL/min
Temperature Ambient (Method I), 40 °C (Method II)
Source ESI
Ionization mode Positive/Negative
Collision gas Argon
Instrument Agilent 320 LC/MS/MS
Figure 1. Pigment removal and clean-up offered by Agilent Bond Elut Carbon/NH2 dual phase SPE cartridge.
Conditioning Cleanup Before and after cleanup
Results and Discussion
Clean-up with Bond Elut Carbon/NH2:Ideal sorbent for pigment removalAgilent Bond Elut Carbon is an ultrapure graphitized carbonparticle that has been optimized for the absorption of pigments in food, fruits, and vegetables, and small organicresidues in waste water. This sorbent behaves both as a nonspecific sorbent for hydrophobic compounds and, to a certain extent, as an anion-exchanger. Bond Elut NH2 is aweaker anion exchanger than sorbents such as SAX (quaternary amine sorbent), and is, therefore, a better choicefor retention of very strong anions, removes polar organicacids, some sugars, and lipids. Thus, the amino function augments the anion exchange capabilities of carbon as well.This layered cartridge is an efficient means of withholding colored hydrophobic pigments such as lycopene in tomatoesand acidic species in different matrices. The dual layer SPEtube was specifically developed to offer superior cleanupwhen conducting multiresidue pesticide analysis from food.

6
40
A: Method I, 42 compounds, standards B: Method II, 25 compounds, standards
30
20
10
0
MCo
unts
5 10 15 20 minutes minutes
200
250
150
100
50
0
5 10 15
Figure 2. Analysis of multiresidue pesticide standards by Japanese Positive List Method I (A, 42 compounds) and Method II (B, 25 compounds). [See Table 1 for the pesticides identified in Chromatrogram A (from Method I) and Table 2 for the pesticidesin Chromatogram B (from Method II)].
Figure 2 shows LC/MS/MS multiresidue pesticide analysisusing standard mixtures and Methods I and II. Figures 3 and 4illustrate data generated in spiked matrices used in Methods Iand II. Tomato and lemon were used for both Methods I and II,examples of spiked tomato and spiked lemon at 100 ppbconcentrations are shown for Methods I and II respectively.There are 2 pairs of isomers in Method I - Tralkoxydim andTridemorph. Both pairs are seen to separate with base-lineresolution on Agilent Pursuit XRs C18 column (Figure 3).These columns are based on a 100Å high surface area silica,combined with a high ligand density, they offer superiorresolution, excellent stability, easy scalability, and maximumloadability.

7
Figure 3. Analysis of multi-residue pesticides in spiked tomato by Japanese Positive List Method I - Total ion chromatogram andMRM chromatograms of 42 compounds in tomato at 100 ppb. [See Table 1 for the pesticides identified in Method I.]
Thiamethoxam
Imidacloprid
Benzofenap
Abamectin BlaButafenacil
Azinphos-methyl
Anilofos
Ferimzone(Z)
Ferimzone (E)
Dimethirimol
Clothianidin
Indoxacarb
Furathiocarb
Cyflufenamid
Fenoxycarb
Cyazofamid
Clonguintocet-mexyl
Phenmedipham
Oxycarboxin
Oryzalin
Naproanilide
Milbemectin A4
Milbemectin A3
Lactofen
Methoxyfenozide
Tralkoxydim (isomer 1 & 2)
MCo
unts
MCo
unts
Tridemorph (isomer 1 & 2)
Triticonazole
Thiacloprid
Simeconazole
Thiabendazole
Pyriftalid
Pyrazolynate
Quizalofop-ethyl
Azamethiphos
Chloridazon
Isoxaflutole
Iprovalicarb
Clomeprop
Chromafennozide
5 10 15 20 25 minutes 5 10 15 20 25 minutes
MCPB
Mecoprop (MCPP & MCPP-P)
Imazaquin
Ioxynil
Haloxyfop
Triflusulfuron-methyl
Thifensulfuron-methyl
Triclopyr
Thidiazuron
Gibberellin
Forchlorfenuron
Fomesafen
Fluroxypyr
Flumetsulam
MCo
unts
MCo
unts
Florasuram
Diclosulam
Dichlorprop
Cyclanilide
Cloransulam-methyl
Cloprop
Bromoxynil
Acifluorfen
4-Chlorophenoxyacetic acid
1-Naphthalenacetic acid
5 10 15 5 10 15minutes minutes
Figure 4. Analysis of multi-residue pesticides in spiked lemon by Japanese Positive List Method II - Total ion chromatogram andMRM chromatograms of 25 compounds in lemon at 100 ppb. [See Table 2 for the pesticides identified in Method II.]

8
For quantitation purposes, the matrices were spiked at 10 ppbas well. A 10 ppb amount was selected as per the MHLWregulations requiring that no agricultural chemical exceedthe MRL (typically 10 ppb). Figures 5 and 6 showrepresentative LC/MS/MS chromatogram comparisons of thepesticides in standard and spiked matrices (tomato andlemon) relative to the blank matrix at 10 and 100 ppb for bothmethods.
Standard Tomato Lemon42 Standard mix, 100 ppb
42 Standard mix,10 ppb
Blank Blank Blank
42 Compounds,100 ppb
42 Compounds,10 ppb
42 Compounds, 100 ppb
42 Compounds,10 ppb
10.0
MCo
unts
MCo
unts
kCou
nts
7.5
5.0
2.5
0.0
0.0
0.5
1.0
1.5
05 10 15 20 25 minutes
250
500
750
MCo
unts
MCo
unts
kCou
nts
7.5
5.0
2.5
0.0
0.0
0.25
0.75
0.50
1.00
0
5 10 15 20 25 minutes
200
600
400
MCo
unts
MCo
unts
kCou
nts
7.5
10.0
5.0
2.5
0.0
0.0
0.25
0.75
0.50
1.00
05 10 15 20 minutes
200
600
400
Figure 5. Method I: LC/MS/MS chromatogram comparisons of the compounds in standard and spiked matrices (tomato andlemon), relative to the blank matrix at 10 and 100 ppb.
Figure 6. Method II: LC/MS/MS chromatogram comparisons of the compounds in standard and spiked matrices (tomato andlemon), relative to the blank matrix at 10 and 100 ppb.
Standard Tomato Lemon25 Standard mix, 100 ppb
25 Standard mix,10 ppb
Blank Blank Blank
25 Compounds,100 ppb
25 Compounds,10 ppb
25 Compounds, 100 ppb
25 Compounds,10 ppb
6
4
2MCo
unts
MCo
unts
MCo
unts
0
0.0
0.25
0.5
0.75
0.0
5 10 15 20 25 minutes
0.25
0.50
0.75
MCo
unts
kCou
nts
kCou
nts
43
5
210
0
200
400
600
05 10 15 20 25 minutes
200300
500
100
400
MCo
unts
kCou
nts
kCou
nts
4
2
6
0
0
400
600
200
05 10 15 20 minutes
50
100
150
9
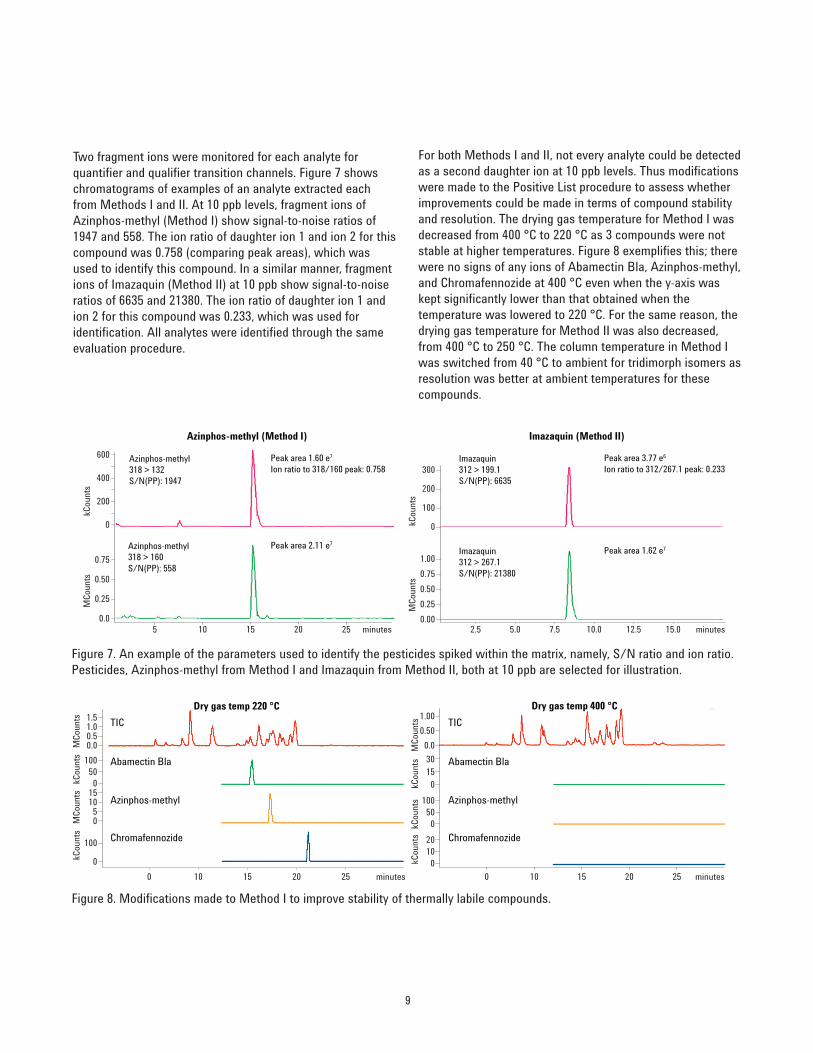
Two fragment ions were monitored for each analyte forquantifier and qualifier transition channels. Figure 7 showschromatograms of examples of an analyte extracted eachfrom Methods I and II. At 10 ppb levels, fragment ions ofAzinphos-methyl (Method I) show signal-to-noise ratios of1947 and 558. The ion ratio of daughter ion 1 and ion 2 for thiscompound was 0.758 (comparing peak areas), which wasused to identify this compound. In a similar manner, fragmentions of Imazaquin (Method II) at 10 ppb show signal-to-noiseratios of 6635 and 21380. The ion ratio of daughter ion 1 andion 2 for this compound was 0.233, which was used for identification. All analytes were identified through the sameevaluation procedure.
Figure 7. An example of the parameters used to identify the pesticides spiked within the matrix, namely, S/N ratio and ion ratio.Pesticides, Azinphos-methyl from Method I and Imazaquin from Method II, both at 10 ppb are selected for illustration.
Azinphos-methyl (Method I) Imazaquin (Method II)
Azinphos-methyl318 > 132S/N(PP): 1947
Peak area 1.60 e7
Ion ratio to 318/160 peak: 0.758
Peak area 2.11 e7Azinphos-methyl318 > 160S/N(PP): 558
Imazaquin312 > 199.1S/N(PP): 6635
Imazaquin312 > 267.1S/N(PP): 21380
600
kCou
nts
MCo
unts
400
200
0
0.05 10 15 20 25 minutes
0.25
0.50
0.75
Peak area 3.77 e6
Ion ratio to 312/267.1 peak: 0.233
Peak area 1.62 e7
kCou
nts
MCo
unts
300
200
100
0
0.002.5 5.0 7.5 10.0 12.5 15.0 minutes
0.25
0.50
0.75
1.00
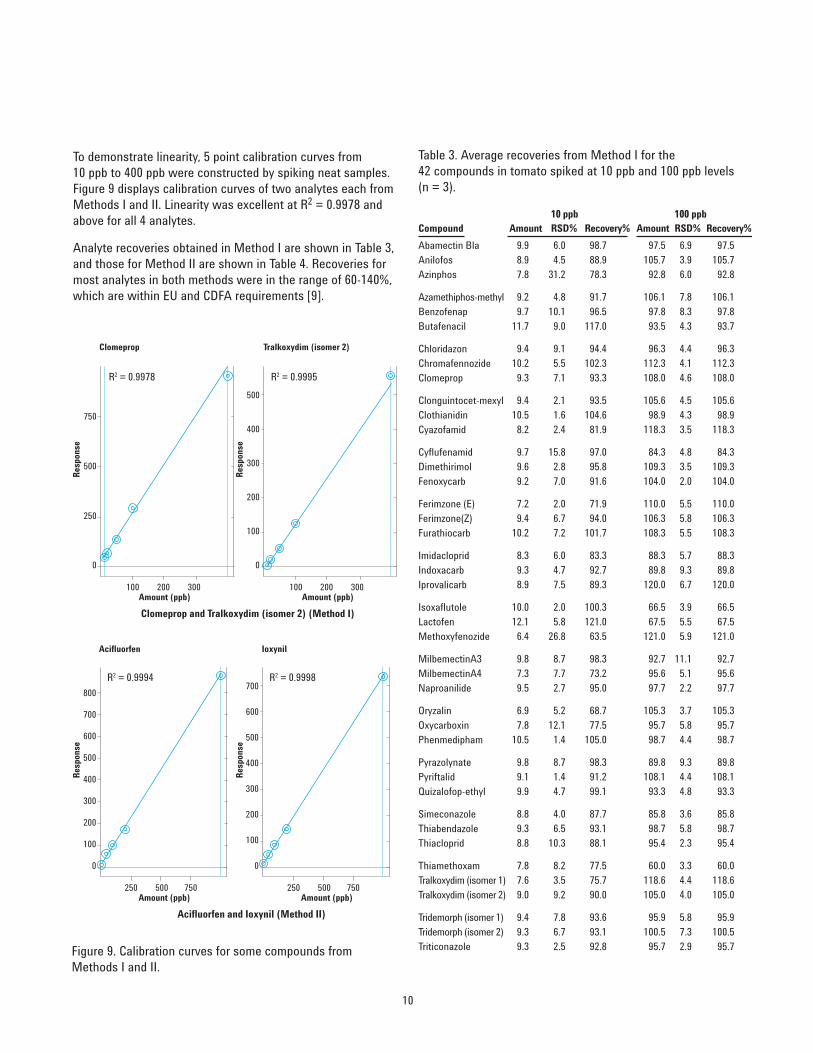
For both Methods I and II, not every analyte could be detectedas a second daughter ion at 10 ppb levels. Thus modificationswere made to the Positive List procedure to assess whetherimprovements could be made in terms of compound stabilityand resolution. The drying gas temperature for Method I wasdecreased from 400 °C to 220 °C as 3 compounds were notstable at higher temperatures. Figure 8 exemplifies this; therewere no signs of any ions of Abamectin Bla, Azinphos-methyl,and Chromafennozide at 400 °C even when the y-axis waskept significantly lower than that obtained when thetemperature was lowered to 220 °C. For the same reason, thedrying gas temperature for Method II was also decreased,from 400 °C to 250 °C. The column temperature in Method Iwas switched from 40 °C to ambient for tridimorph isomers asresolution was better at ambient temperatures for thesecompounds.
Abamectin Bla
Azinphos-methyl
Chromafennozide
TIC
Abamectin Bla
Azinphos-methyl
Chromafennozide
TIC
Dry gas temp 220 °C Dry gas temp 400 °C1.5
MCo
unts
kCou
nts
MCo
unts
kCou
nts
1.00.50.0
100
0
0 10 15 20 25 minutes
050
100
05
1015
1.00
MCo
unts
kCou
nts
kCou
nts
kCou
nts
0.50
0.0
2010
0
0 10 15 20 25 minutes
0
3015
050
100
Figure 8. Modifications made to Method I to improve stability of thermally labile compounds.
Compound
Abamectin BlaAnilofosAzinphos
Azamethiphos-methylBenzofenapButafenacil
ChloridazonChromafennozideClomeprop
Clonguintocet-mexylClothianidinCyazofamid
CyflufenamidDimethirimolFenoxycarb
Ferimzone (E)Ferimzone(Z)Furathiocarb
ImidaclopridIndoxacarbIprovalicarb
Amount
9.98.97.8
9.29.7
11.7
9.410.2
9.3
9.410.5
8.2
9.79.69.2
7.29.4
10.2
8.39.38.9
RSD%10 ppb 100 ppb
6.04.5
31.2
4.810.1
9.0
9.15.57.1
2.11.62.4
15.82.87.0
2.06.77.2
6.04.77.5
Recovery%
98.788.978.3
91.796.5
117.0
94.4102.3
93.3
93.5104.6
81.9
97.095.891.6
71.994.0
101.7
83.392.789.3
Amount
97.5105.7
92.8
106.197.893.5
96.3112.3108.0
105.698.9
118.3
84.3109.3104.0
110.0106.3108.3
88.389.8
120.0
RSD%
6.93.96.0
7.88.34.3
4.44.14.6
4.54.33.5
4.83.52.0
5.55.85.5
5.79.36.7
Recovery%
97.5105.7
92.8
106.197.893.7
96.3112.3108.0
105.698.9
118.3
84.3109.3104.0
110.0106.3108.3
88.389.8
120.0
Isoxaflutole 10.0 2.0 100.3 66.5 3.9 66.5Lactofen 12.1 5.8 121.0 67.5 5.5 67.5Methoxyfenozide 6.4 26.8 63.5 121.0 5.9 121.0
MilbemectinA3 9.8 8.7 98.3 92.7 11.1 92.7MilbemectinA4 7.3 7.7 73.2 95.6 5.1 95.6Naproanilide 9.5 2.7 95.0 97.7 2.2 97.7
Oryzalin 6.9 5.2 68.7 105.3 3.7 105.3Oxycarboxin 7.8 12.1 77.5 95.7 5.8 95.7Phenmedipham 10.5 1.4 105.0 98.7 4.4 98.7
Pyrazolynate 9.8 8.7 98.3 89.8 9.3 89.8Pyriftalid 9.1 1.4 91.2 108.1 4.4 108.1Quizalofop-ethyl 9.9 4.7 99.1 93.3 4.8 93.3
Simeconazole 8.8 4.0 87.7 85.8 3.6 85.8Thiabendazole 9.3 6.5 93.1 98.7 5.8 98.7Thiacloprid 8.8 10.3 88.1 95.4 2.3 95.4
Thiamethoxam 7.8 8.2 77.5 60.0 3.3 60.0Tralkoxydim (isomer 1) 7.6 3.5 75.7 118.6 4.4 118.6Tralkoxydim (isomer 2) 9.0 9.2 90.0 105.0 4.0 105.0
Tridemorph (isomer 1) 9.4 7.8 93.6 95.9 5.8 95.9Tridemorph (isomer 2) 9.3 6.7 93.1 100.5 7.3 100.5Triticonazole 9.3 2.5 92.8 95.7 2.9 95.7
Table 3. Average recoveries from Method I for the42 compounds in tomato spiked at 10 ppb and 100 ppb levels (n = 3).
10
To demonstrate linearity, 5 point calibration curves from10 ppb to 400 ppb were constructed by spiking neat samples.Figure 9 displays calibration curves of two analytes each fromMethods I and II. Linearity was excellent at R2 = 0.9978 andabove for all 4 analytes.
Analyte recoveries obtained in Method I are shown in Table 3,and those for Method II are shown in Table 4. Recoveries formost analytes in both methods were in the range of 60-140%,which are within EU and CDFA requirements [9].
Figure 9. Calibration curves for some compounds fromMethods I and II.
750
R2 = 0.9978 R2 = 0.9995
R2 = 0.9994 R2 = 0.9998
500
250
0
100 200Amount (ppb)
300
500
300
200
400
100
0
100 200Amount (ppb)
300
500
600
700
800
300
200
400
100
0
250 500Amount (ppb)
Res
pons
e
Res
pons
e
Res
pons
e
Res
pons
e
750
500
600
700
300
200
400
100
0
250 500Amount (ppb)
750
Clomeprop and Tralkoxydim (isomer 2) (Method I)
Acifluorfen and Ioxynil (Method II)
Clomeprop Tralkoxydim (isomer 2)
Acifluorfen Ioxynil

11
Conclusions
A complete solutions package incorporating the use of thedual phase Agilent Bond Elut Carbon/NH2 and Bond ElutSilica SPE coupled with robust Pursuit HPLC columns wasdeveloped for screening challenging agricultural chemicals infood within the expected MRLs (0.01 ppm) of the JapanPositive List. All 67 compounds included in multiresidueMethods I and II were analyzed in tomato and lemon matricesby using cartridge-based SPE and LC/MS/MS. Pursuit XRscolumn was able to separate 2 pairs of isomers with baselineresolution in Method I, illustrating the power of liquidchromatography when MS detection becomes a limitation.Good linearity from 10 ppb to 400 ppb was observed for most
analytes with R2 greater than 0.98. Recoveries for mostanalytes in both methods were in the range of 60-140%,which are within EU and CDFA requirements.
For both Methods I and II, not every analyte could be detectedas a second daughter ion at 10 ppb levels. However, slightmodifications made to the drying gas temperature and columntemperature compared to the existing Positive List procedureresulted in stable daughter ions and isomers. Optimization ofparameters associated with lower drying gas temperature inboth Methods I and II lent qualifying ions for all pesticidesthat were not observed at the high drying gas temperature at10 ppb for some of the pesticides.
Table 4. Average recoveries from Method II for the 25 compoundsin lemon spiked at 10 ppb and 100 ppb levels (n = 3).
Compound Amount RSD%10 ppb
Recovery% Amount RSD%100 ppb
Recovery%
1-Naphthalenacetic acid NA NA NA 80.1 15.3 80.14-Chlorophenoxyacetic acid 12.3 5.4 123.0 80.5 5.8 80.5Acifluorfen 7.5 5.1 74.8 99.7 10.8 99.7
Bromoxynil 8.9 4.7 88.9 79.0 3.4 79.0Cloprop 11.7 21.3 117.0 98.2 11.3 98.2Cloransulam-methyl 9.5 19.7 94.6 95.4 2.1 95.4
Cyclanilide 9.4 5.6 94.2 85.6 2.8 85.6Dichlorprop 8.6 19.3 86.0 100.5 6.3 100.5Diclosulam 8.8 5.5 88.1 93.0 6.1 93.0
Florasuram 9.1 6.6 90.8 81.3 1.1 81.3Flumetsulam 10.2 9.9 101.9 72.6 8.1 72.6Fluroxypyr 8.6 17.3 86.1 75.9 4.1 75.9
Fomesafen 6.6 8.6 65.8 83.9 3.2 83.9Forchlorfenuron 8.7 10.5 86.9 57.7 9.8 57.7Gibberellin 12.5 19.1 124.5 89.1 2.5 89.1
Haloxyfop 8.7 2.8 86.6 91.3 0.5 91.3Imazaquin 6.4 7.7 63.8 81.0 1.4 81.0Ioxynil 11.8 17.1 118.3 75.9 7.1 75.8
MCPB 12.4 9.0 123.5 91.8 4.6 91.8Mecoprop (MCPP) 8.7 6.9 86.7 77.1 9.9 77.1Mecoprop (MCPP-P) 8.7 6.9 86.7 91.8 0.5 91.8
Thidiazuron 8.4 16.8 83.5 80.9 7.5 80.9Thifensulfuron-methyl 10.6 8.7 105.5 98.9 5.3 98.9Triclopyr 9.0 0.9 89.5 104.4 6.3 104.4
Triflusulfuron-methyl 11.9 19.3 119.3 79.7 6.7 79.7
www.agilent.com/chem
Agilent shall not be liable for errors contained herein or for incidental or consequentialdamages in connection with the furnishing, performance, or use of this material.
Information, descriptions, and specifications in this publication are subject to changewithout notice.
© Agilent Technologies, Inc., 2012Printed in the USAAugust 9, 20125990-9895EN
References
1. “Positive List System for Agricultural Chemical Residuesin Foods”, http://www.ffcr.or.jp
2. “Introduction of the Positive List System for AgriculturalChemical Residues in Foods,” Department of FoodSafety, Ministry of Health, Labour and Welfare, June2006http://www.mhlw.go.jp/english/topics/foodsafety/positivelist060228/introduction.html
3. “Positive List System for Agricultural Chemical Residuesin Foods,” Ministry of Health, Labour and Welfarehttp://www.mhlw.go.jp/english/topics/foodsafety/positivelist060228/index.html
4. “Maximum Residue Limits (MRLs) List of AgriculturalChemicals in Foods,” The Japan Food ChemicalResearch Foundationhttp://www.m5.ws001.squarestart.ne.jp/foundation/search.html
5. Table in item 6 (1), Section A General CompositionalStandards for Food, Part I Food: The maximum residuelimits of substances used as ingredients of agriculturalchemicals in foodshttp://www.mhlw.go.jp/english/topics/foodsafety/positivelist060228/dl/index-1a.pdf
6. Table in item 7 (1), Section A General CompositionalStandards for Food, Part I Food: The maximum residuelimits of substances used as ingredients of agriculturalchemicals in foods (Provisional MRLs List)http://www.mhlw.go.jp/english/topics/foodsafety/positivelist060228/dl/index-1b.pdf
7. “Analytical Methods for Residual CompositionalSubstances of Agricultural Chemicals, Feed Additives,and Veterinary Drugs in Food”, Department of FoodSafety, Ministry of Health, Labour and Welfare,http://www.ffcr.or.jp-zaidan-FFCRHOME.nsf
8. E. Chang, K. Yamashita, R. Arora, "Multi-residueScreening of Veterinary Drugs (I) and (II) in MeatAccording to the Japan Positive List using Cartridge-based SPE and LC/MS/MS", Agilent Application Note,Publication No.: 5990-8986EN.
9. “Quality Control Procedures for Pesticide ResiduesAnalysis”. SANCO/10232/2006, 24/March/2006.http://ec.europa.eu/food/plant/resources/qualcontrol_en.pdf.
For More Information
These data represent typical results. For more informationon our products and services, visit our Web site atwww.agilent.com/chem