
Multiplexed volumetric bar-chart chip for point-of-care … · 2013-07-16 · Multiplexed...
13
1 Supplementary Information Multiplexed volumetric bar-chart chip for point-of-care diagnostics Yujun Song 1 , Yuanqing Zhang 1 , Paul E. Bernard 1 , James M. Reuben 2, 3, 4 , Naoto T. Ueno 2, 3 , Ralph B. Arlinghaus 5 ,Youli Zu 6 , & Lidong Qin 1 1 Department of Nanomedicine, The Methodist Hospital Research Institute, Houston, TX 77030, USA. 2 Morgan Welch Inflammatory Breast Cancer Research Program and Clinic, 3 Section of Translational Breast Cancer Research, 4 Department of Hematopathology, 5 Department of Molecular Pathology, The University of Texas MD Anderson Cancer Center, Houston, TX 77030, USA. 6 Department of Pathology and Genomic Medicine, The Methodist Hospital, Houston, TX 77030, USA. Correspondence and requests for materials should be addressed to L.Q. ([email protected] ).
Transcript of Multiplexed volumetric bar-chart chip for point-of-care … · 2013-07-16 · Multiplexed...

1
Supplementary Information
Multiplexed volumetric bar-chart chip for point-of-care diagnostics
Yujun Song1, Yuanqing Zhang
1, Paul E. Bernard
1, James M. Reuben
2, 3, 4, Naoto T. Ueno
2, 3, Ralph B.
Arlinghaus5,Youli Zu
6, & Lidong Qin
1
1Department of Nanomedicine, The Methodist Hospital Research Institute, Houston, TX 77030, USA. 2Morgan Welch Inflammatory Breast Cancer Research Program and Clinic, 3Section of Translational
Breast Cancer Research, 4Department of Hematopathology, 5Department of Molecular Pathology, The
University of Texas MD Anderson Cancer Center, Houston, TX 77030, USA. 6Department of Pathology and Genomic Medicine, The Methodist Hospital, Houston, TX 77030, USA.
Correspondence and requests for materials should be addressed to L.Q. ([email protected]).
2
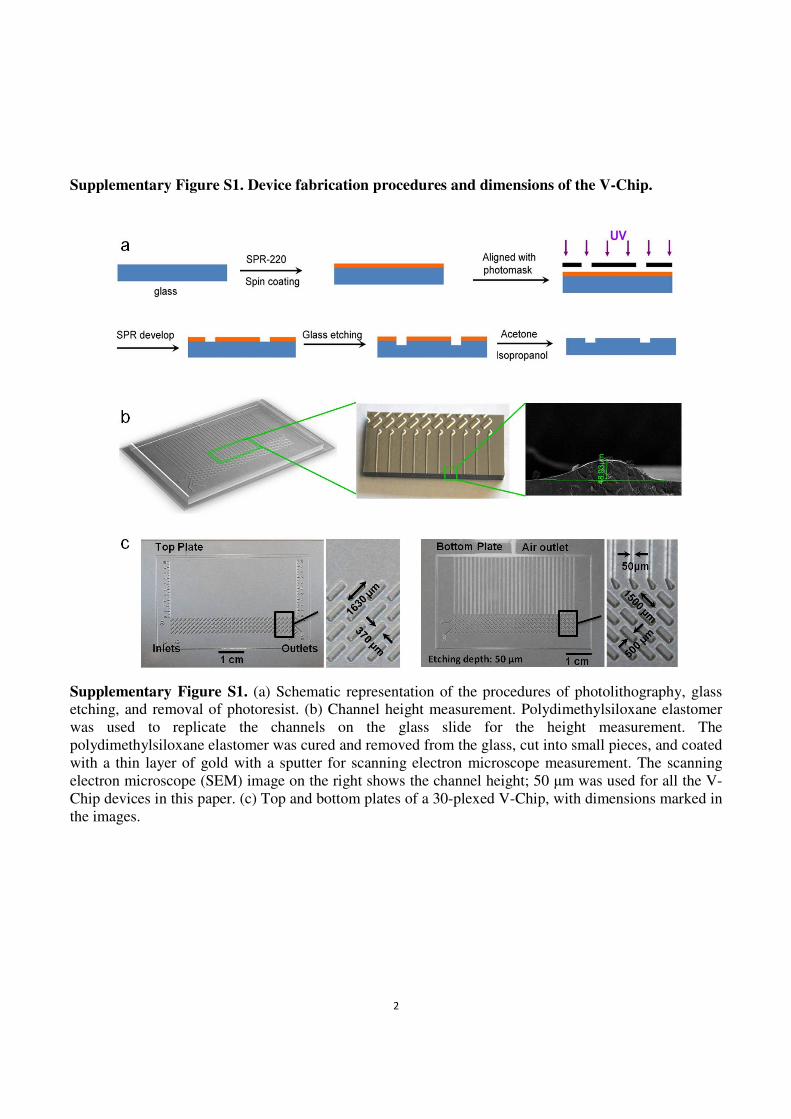
Supplementary Figure S1. Device fabrication procedures and dimensions of the V-Chip.
Supplementary Figure S1. (a) Schematic representation of the procedures of photolithography, glass etching, and removal of photoresist. (b) Channel height measurement. Polydimethylsiloxane elastomer
was used to replicate the channels on the glass slide for the height measurement. The
polydimethylsiloxane elastomer was cured and removed from the glass, cut into small pieces, and coated
with a thin layer of gold with a sputter for scanning electron microscope measurement. The scanning
electron microscope (SEM) image on the right shows the channel height; 50 µm was used for all the V-
Chip devices in this paper. (c) Top and bottom plates of a 30-plexed V-Chip, with dimensions marked in
the images.

3
Supplementary Figure S2. Photographs of V-Chip devices.
Supplementary Figure S2. (a) Single, (b) 6-, (c) 10-, (d) 30-, and (e) 50-plexed V-Chip devices.
Pictures from left to right are the top plates, the bottom plates, and the assembled V-Chips, respectively.
The scale bar is 1 cm for all pictures.

4
Supplementary Figure S3. Protocol for the detection of biomarkers in serum and cell lysates.
Supplementary Figure S3. (a) The ELISA wells are modified with epoxy groups and then reacted with
capture antibodies. The capture antibodies are covalently immobilized on the glass surface by the
reaction between their amino groups and the epoxy groups. GPS is (3-glycidoxypropyl)
trimethoxysilane. (b) Serum, urine, or PBS-based samples are loaded in the ELISA wells and the
biomarkers react with the capture antibodies. Following this, the catalase probes with detecting
antibodies are bound, generating the ELISA “sandwich.” This complex is then reacted with hydrogen
peroxide to generate oxygen and push the inked bars. (c) Cancer cell lysates are loaded into the ELISA
wells and the biomarkers are bound to the capture antibodies. The catalase probes with detecting
antibodies are then loaded to form the sandwich structures. Afterwards, the complex is reacted with
hydrogen peroxide to generate oxygen and move the inked bars.

5
Supplementary Figure S4. AFM micrographs (3D) of the glass surface.
Supplementary Figure S4. The glass surface before (a) and after (b) glass etching.

6
Supplementary Figure S5. Capture antibody loading and catalase probe binding.
Supplementary Figure S5. (a) The capture antibody solution (1 µL) was loaded into each sample well
using a pipette. Because the ELISA wells were treated to be hydrophilic and the boundaries are
hydrophobic, the solution stayed inside and covered the entire well. The scale bar is 1 cm. (b) & (c)
SEM images of captured catalase probes (silicon nanoparticles conjugated with catalase and detecting
antibody) without CEA target and with 50 ng/mL CEA target.
7
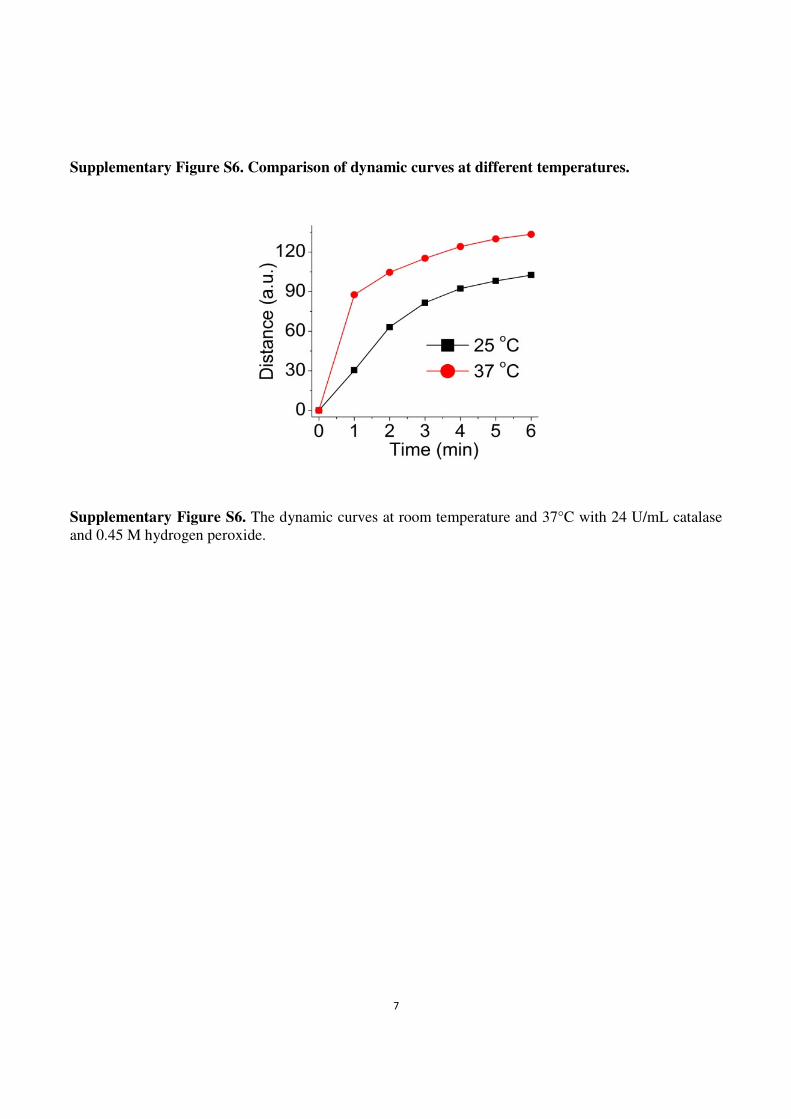
Supplementary Figure S6. Comparison of dynamic curves at different temperatures.
Supplementary Figure S6. The dynamic curves at room temperature and 37°C with 24 U/mL catalase
and 0.45 M hydrogen peroxide.

8
Supplementary Figure S7. Patient samples and the clinical instrument.
Supplementary Figure S7. (a) Pictures of the 10 patient serum samples collected. (b) Photograph of the
ADVIA Centaur that was used for the clinical CEA assay.

9
Supplementary Table S1. De-identified patient information for the CEA test.

10
Supplementary Methods
Procedures for the preparation of magnetic beads-capture antibody complexes
Conjugation of the hCG (Abcam) capture antibody onto the surface of magnetic beads was done
according to a standard protocol. Nine milligrams of epoxy magnetic beads were washed twice using
PBS buffer and then re-suspended in 600 µL PBS buffer for a final concentration of 1×10⁹ beads/mL.
Thirty-four micrograms of polyclonal anti-hCG antibodies (Abcam, 1 mg/mL) were added to the
solution and vortexed for 5 min. Subsequently, 100 µL of 7 M ammonium sulfate solution was added to
the solution to speed up the reaction. The solution was incubated in a shaker for 3 h, and unbound
antibodies were removed by magnetic separation. The coated magnetic beads were washed four times
with 2% BSA (in PBS) solution. The coated beads were suspended in 600 µL PBS buffer for hCG
detection.
Procedures for the synthesis of detecting antibody-SiO2-catalase complexes (catalase probes)
The detecting antibodies and catalase molecules were conjugated onto SiO2 nanoparticles
(SkySpring Nanomaterials, Inc.) to generate the catalase probe. In the ELISA reaction, the antibody was
used to specifically bind the antigen and the catalase molecules were used to generate oxygen. For
conjugation, 2 mg of the epoxy SiO2 nanoparticles were suspended in 1 mL PBS buffer and 20 µL
detecting antibodies (1 mg/mL) were added. Subsequently, 144 µL of a 2 mg mL-1 catalase solution in
PBS buffer was added and the mixture was vortexed for 30 min. One hundred microliters of 12 M
ammonium sulfate (Sigma) solution were added to speed up the reaction. The catalase molecules were
conjugated to SiO2 nanoparticles and formed antibody-SiO2-catalase complexes. In the complex, the
mole ratio between the antibodies and catalase was approximately 1:9, in which SiO2 nanoparticles
increased catalase loading. The solution was incubated with tilting and rotation for 3 h. The mixture was

11
washed four times with 2% BSA (in PBS) with a 10-min incubation each time, and then separated by
centrifugation at 5000 rpm. Finally, the coated beads were suspended in 1 mL PBS as the stock solution.
Cell culture
The BT-474, MCF-7, SKBR-3, and MDA-MB-231 cell lines were obtained from the American
Type Culture Collection (ATCC; Manassas, VA). The SUM-159 cell line was obtained from Asterand
(Detroit, MI). MCF-7 (ER+, PR-, HER2-), MDA-MB-231 (ER-, PR-, HER2-), and SUM-159 (ER-, PR-,
HER2-) cells were grown in DMEM supplemented with 10% FBS. BT-474 (ER+, PR+, HER2+) cells
were grown in RPMI-1640 medium supplemented with 10% FBS. SKBR-3 (ER-, PR-, HER2+) cells
were grown in McCoys 5A medium supplemented with 10% FBS. All of these breast cancer cell lines
were incubated at 37°C in a 5% CO2 atmosphere.
Cell imaging
In immunofluorescence experiments, breast cancer cells were seeded on glass slides in multi-
well plates and grown in medium for 48 h. The cells were first rinsed with PBS buffer three times to
remove unattached cells. Then 4% fresh paraformaldehyde was added into each well to fix the cells for
10 min, followed by incubation with 0.5% Triton X-100 for 10 min. Next, the cells were incubated in
2% BSA for 30 min to prevent nonspecific binding. After incubation in a 2% primary antibody solution
overnight, Cy3-labeled secondary antibodies (Abcam) were added to image ER and PR, and FITC-
labeled secondary antibodies (Abcam) were added to image HER2. Following this, cells were washed
with PBS buffer three times and visualized with an Olympus IX-81 optical system microscope (Tokyo,
Japan) equipped with 20× objective lenses and an Olympus imaging system.
Cell lysate preparation
Two identical concentrations of breast cancer cells were seeded in two culture dishes and grown
up to 48 h. One dish was used to determine the number of cells, and the other was used for lysis and
12
protein collection. To determine the cell numbers, the breast cancer cells were rinsed 3 times with PBS
buffer and treated with trypsin. The cells were then collected and the number was determined by trypan
blue exclusion in a hemocytometer chamber. For cell lysis, the cells (107 cells/mL) were rinsed with
PBS buffer 3 times, and RIPA buffer (Invetrigen) was added to the culture dish to directly lyse the
cancer cells. The lysate was gathered to one side using a cell scraper and transferred to a centrifuge tube.
The collected lysate was centrifuged at 12000 rpm for 15 min to pellet the cell debris. For assays, the
cell lysate was diluted to the required concentration before the experiment.
Serum collection and clinical assay
Sera were collected at the Methodist Hospital from volunteer patients, and CEA data were
collected by The Methodist Hospital Pathology Lab using the ADVIA Centaur CEA assay. The assay
protocol can be found on the manufacturer’s website (http://www.medical.siemens.com) and the assay
standard is on the FDA website (http://www.accessdata.fda.gov). Supplementary Fig. S7 shows a picture
of the instrument used to collect the CEA quantitation data.
V-Chip assay
In the absence of targets, the response comes from non-specific binding. Therefore, a control
channel was included in all the multiplex assays. During the immobilization of capture antibodies, the
control wells were coated with BSA instead of antibodies. As show in Fig. 4b, the control channels
never moved more than 0.3 V-Chip unit when the assay was complete. A more ideal “zero” control
would include no target but would contain both the capture antibody and the detecting probe, which
would rule out possible binding between the detection probe and capture antibody; however, in our
assays shown in Fig. 4, the detecting probe showed almost no binding to capture antibody, as confirmed
by the negative assay shown in Fig. 4b SUM-159 and MD-MB-231.
Because V-Chip employs the ELISA method, all ELISA-related errors are also possible,
13
including those arising from washing, blocking, antibody activity, and others. In addition to these
sources of error, V-Chip introduces a readout based on catalase. We have proved that uniform catalase
concentration results in consistent bar advancement (Relative Standard Error = 1.3%), as shown in Fig.
1f. Therefore, in principle, the V-Chip would not introduce significantly more errors than other ELISA
methods. However, in practice, operational errors in processes such as consistency in sliding the chip,
uniformity in coating the antibody, and other minor issues are likely. All assays were conducted more
than three times to avoid random operational errors.
Atomic force microscopy (AFM)
The glass surface before and after etching was characterized using atomic force microscopy
(AFM). AFM measurements were performed with a Veeco MultiMode Nanoscope IIIA (Bruker AXS,
Madison, WI). The glass slides were cut into small pieces, washed with acetone and isopropanol, and
dried with nitrogen gas. Tapping mode was used to acquire the images under ambient conditions. Image
analysis was carried out using Veeco NanoScope Analysis software version 1.20.
Scanning electron microscope (SEM)
A scanning electron microscope (SEM) was used to characterize the binding of catalase probe
onto the glass surface. The glass slides were mounted on SEM stubs (Ted Pella, Inc.) using conductive
adhesive tape (12 mm OD PELCO Tabs, Ted Pella, Inc.), and sputter-coated with a 10 nm layer of
platinum/palladium (80:20) using a Cressington Sputter Coater 208 HR (Ted Pella, Inc.). SEM images
were acquired using a Nova NanoSEM scanning electron microscope (FEI Company, Hillsboro, OR).