Multiplexed readout of uniform arrays of TES x-ray ... multiplexer electronics, ... in an adiabatic...
12
Multiplexed readout of uniform arrays of TES x-ray microcalorimeters suitable for Constellation-X Caroline A. Kilbourne a , W. Bertrand Doriese b , Simon R. Bandler a,c , Regis P. Brekosky a,d , Ari-David Brown a,† , James A. Chervenak a , Megan E. Eckart a,† , Fred M. Finkbeiner a,e , Gene C. Hilton b , Kent D. Irwin b , Naoko Iyomoto a,f,‡ , Richard L. Kelley a , F. Scott Porter a , Carl D. Reintsema b , Stephen J. Smith a,† , and Joel N. Ullom b a NASA/Goddard Space Flight Center, Greenbelt, MD 20771, USA; b National Institute of Standards and Technology, Boulder, CO 80305 , USA; c CRESST and University of Maryland, College Park, MD 20742, USA; d Northrop Grumman Corporation, Lanham, MD, USA 20706; e Wyle Information Systems Inc., McLean, VA 22102, USA; f Johns Hopkins University, Physics and Astronomy Dept., Baltimore, MD 21218, USA; † NASA Postdoctoral Program Resident Research Associate; ‡ present address: Department of Nuclear Engineering and Management, University of Tokyo 7-3-1 Hongo, Bunkyo-ku, Tokyo 113-8656, Japan ABSTRACT Following our development of a superconducting transition-edge-sensor (TES) microcalorimeter design that en- ables reproducible, high performance (routinely better than 3 eV FWHM energy resolution at 6 keV) and is compatible with high-fill-factor arrays, we have directed our efforts towards demonstrating arrays of identical pixels using the multiplexed read-out concept needed for instrumenting the Constellation-X X-ray Microcalorime- ter Spectrometer (XMS) focal plane array. We have used a state-of-the-art, time-division SQUID multiplexer system to demonstrate 2×8 multiplexing (16 pixels read out with two signal channels) with an acceptably modest level of degradation in the energy resolution. The average resolution for the 16 multiplexed pixels was 2.9 eV, and the distribution of resolution values had a relative standard deviation of 5%. The performance of the array while multiplexed is well understood. The technical path to realizing multiplexing for the XMS instrument on the scale of 32 pixels per signal channel includes increasing the system bandwidth by a factor of four and reducing the non-multiplexed SQUID noise by a factor of two. In this paper we discuss the characteristics of a uniform 8×8 array and its performance when read out non- multiplexed and with various degrees of multiplexing. We present data acquired through the readout chain from the multiplexer electronics, through the real-time demultiplexer software, to storage for later signal processing. We also report on a demonstration of real-time data processing. Finally, because the multiplexer provides unprecedented simultaneous access to the pixels of the array, we were able to measure the array-scale uniformity of TES calorimeter parameters such as the individual thermal conductances and superconducting transition temperatures of the pixels. Detector uniformity is essential for optimal operation of a multiplexed array, and we found that the distributions of thermal conductances, transition temperatures, and transition slopes were sufficiently tight to avoid significant compromises in the operation of any pixel. Keywords: microcalorimeters, transition-edge sensors, time-division SQUID multiplexing, Constellation-X Send correspondence to C.A.K. or W.B.D. C.A.K.: E-mail: [email protected], Telephone: 1 301 286 2469 W.B.D: E-mail: [email protected], Telephone: 1 303 497 4463 Space Telescopes and Instrumentation 2008: Ultraviolet to Gamma Ray, edited by Martin J. L. Turner, Kathryn A. Flanagan, Proc. of SPIE Vol. 7011, 701104, (2008) · 0277-786X/08/$18 · doi: 10.1117/12.790027 Proc. of SPIE Vol. 7011 701104-1
-
Upload
trinhtuyen -
Category
Documents
-
view
229 -
download
1
Transcript of Multiplexed readout of uniform arrays of TES x-ray ... multiplexer electronics, ... in an adiabatic...

Multiplexed readout of uniform arrays of TES x-raymicrocalorimeters suitable for Constellation-X
Caroline A. Kilbournea, W. Bertrand Dorieseb, Simon R. Bandlera,c, Regis P. Brekoskya,d,Ari-David Browna,†, James A. Chervenaka, Megan E. Eckarta,†, Fred M. Finkbeinera,e,
Gene C. Hiltonb, Kent D. Irwinb, Naoko Iyomotoa,f,‡, Richard L. Kelleya,F. Scott Portera, Carl D. Reintsemab, Stephen J. Smitha,†, and Joel N. Ullomb
aNASA/Goddard Space Flight Center, Greenbelt, MD 20771, USA;bNational Institute of Standards and Technology, Boulder, CO 80305 , USA;
cCRESST and University of Maryland, College Park, MD 20742, USA;dNorthrop Grumman Corporation, Lanham, MD, USA 20706;
eWyle Information Systems Inc., McLean, VA 22102, USA;fJohns Hopkins University, Physics and Astronomy Dept., Baltimore, MD 21218, USA;
†NASA Postdoctoral Program Resident Research Associate;‡ present address: Department of Nuclear Engineering and Management, University of Tokyo
7-3-1 Hongo, Bunkyo-ku, Tokyo 113-8656, Japan
ABSTRACT
Following our development of a superconducting transition-edge-sensor (TES) microcalorimeter design that en-ables reproducible, high performance (routinely better than 3 eV FWHM energy resolution at 6 keV) and iscompatible with high-fill-factor arrays, we have directed our efforts towards demonstrating arrays of identicalpixels using the multiplexed read-out concept needed for instrumenting the Constellation-X X-ray Microcalorime-ter Spectrometer (XMS) focal plane array. We have used a state-of-the-art, time-division SQUID multiplexersystem to demonstrate 2×8 multiplexing (16 pixels read out with two signal channels) with an acceptably modestlevel of degradation in the energy resolution. The average resolution for the 16 multiplexed pixels was 2.9 eV,and the distribution of resolution values had a relative standard deviation of 5%. The performance of the arraywhile multiplexed is well understood. The technical path to realizing multiplexing for the XMS instrument onthe scale of 32 pixels per signal channel includes increasing the system bandwidth by a factor of four and reducingthe non-multiplexed SQUID noise by a factor of two.
In this paper we discuss the characteristics of a uniform 8×8 array and its performance when read out non-multiplexed and with various degrees of multiplexing. We present data acquired through the readout chain fromthe multiplexer electronics, through the real-time demultiplexer software, to storage for later signal processing.We also report on a demonstration of real-time data processing. Finally, because the multiplexer providesunprecedented simultaneous access to the pixels of the array, we were able to measure the array-scale uniformityof TES calorimeter parameters such as the individual thermal conductances and superconducting transitiontemperatures of the pixels. Detector uniformity is essential for optimal operation of a multiplexed array, andwe found that the distributions of thermal conductances, transition temperatures, and transition slopes weresufficiently tight to avoid significant compromises in the operation of any pixel.
Keywords: microcalorimeters, transition-edge sensors, time-division SQUID multiplexing, Constellation-X
Send correspondence to C.A.K. or W.B.D.C.A.K.: E-mail: [email protected], Telephone: 1 301 286 2469W.B.D: E-mail: [email protected], Telephone: 1 303 497 4463
Space Telescopes and Instrumentation 2008: Ultraviolet to Gamma Ray, edited by Martin J. L. Turner, Kathryn A. Flanagan, Proc. of SPIE Vol. 7011, 701104, (2008) · 0277-786X/08/$18 · doi: 10.1117/12.790027
Proc. of SPIE Vol. 7011 701104-1
-' 25Oim
1. INTRODUCTION
We have been developing arrays of superconducting transition-edge sensor (TES) x-ray calorimeters compatiblewith the reference design of the X-ray Microcalorimeter Spectrometer (XMS) instrument on Constellation-X, afuture x-ray observatory under formulation by NASA. The XMS field of view is to be 5.5 arcmin × 5.5 arcmin,sampled at 5 arcsec. The highest spectral resolution, 2.5 eV full width at half maximum (FWHM), is requiredof the central quarter of the array, or 2.7 arcmin × 2.7 arcmin, while the rest of the array need only achievea resolution of 10 eV. Our plan to meet these requirements is to fill the focal plane with a combination of ahigh-performance core array and a field-of-view extension. The baseline concept for the core array is a 32×32array of 5-arcsec, independent calorimeters. The core array is the subject of this paper; progress on our conceptfor filling the rest of the focal plane with position-sensitive TES calorimeters is discussed elsewhere in theseproceedings.1
An 8×8 array of independent TES calorimeters with a pitch of 0.25 mm has been the basic format for ourdevelopment of a robust pixel design. Each pixel consists of a Mo/Au TES thermometer with an electroplated Auor Au/Bi x-ray absorber on a thermally isolating silicon-nitride membrane. Direct contact between the absorberand the TES film is limited to a small, insensitive area of the TES so that the low-resistance absorber neithershunts current away from the TES nor interferes with its sensitivity as a thermometer. We have previouslypresented this design concept,2 as well as performance and detailed characterization of pixels with variationsin the absorber composition and attachment geometry.3,4,5,6 Here we present the next step in the maturationof this design – the production of arrays of nominally identical pixels and the subsequent verification of thatuniformity.
Superconducting quantum interference devices (SQUIDs) are well matched to reading the current signalsfrom these low-resistance (typically a few mΩ under optimal bias) sensors. Multiplexed readout is motivated bythe need to reduce the number of wires running to the low temperature stages of the instrument for effectivemanagement of heat loads and design complexity. In our present time-division multiplexing (TDM) concept,7
the outputs from the dedicated input SQUIDs of individual TES pixels are coupled to a single amplifier, andmultiplexing is achieved by sequential switching of these input SQUIDs. Fig. 3 (left) illustrates the NIST TDMconcept. Additional reduction in wire count is achieved by using common bias lines for multiple TES biascircuits; each bias circuit consists of a shunt resistor, the TES, the SQUID input coil, and additional inductancefor filtering the detector response. Columns of individual bias circuits are biased in series with a common dccurrent. In parallel with the array development, the design of the multiplexed SQUID read-out electronicsprogressed to the level appropriate for a 2×8 demonstration of the readout of high-resolution TES signals with∼0.3 ms fall times.8,9
A milestone on the Constellation-X/XMS technology road map had been a demonstration of multiplexed
Figure 1. Electron micrograph of a uniform TES array with Au/Bi absorbers. The close-up view on the right shows anindividual pixel. The absorber is cantilevered over the underlying substrate everywhere except in the T-shaped contactarea. This array scheme is directly scalable to 32×32 except for the density of the signal wires, which is the nextdevelopment milestone to be pursued.
Proc. of SPIE Vol. 7011 701104-2

readout of 16 TES pixels with fall times shorter than 1 ms using two readout channels (i.e. 2×8 multiplexing)and achieving better than 4 eV resolution at 6 keV on all 16 pixels. Combining the GSFC uniform array withthe NIST SQUID multiplexer, we have surpassed the goals of this demonstration by a wide margin, as we detailin Sec. 4.1.
2. UNIFORM TES ARRAY
While continuing to study the optimization of the design of individual pixels, we have chosen one design to usefor a demonstration of array uniformity and to test multiplexed readout (see Fig. 1). The TES thermometersare 0.14 mm square Mo/Au bilayers deposited by electron-beam evaporation. Additional Au features, borderson the edges parallel to the current flow and three interdigitated stripes perpendicular to the current flow, aredeposited atop the TES to control detector noise and the transition shape.3 The transition temperature was∼0.1 K. Mo/Nb leads make electrical contact to each TES. Each TES is situated on a 1 µm thick silicon-nitridemembrane suspended above a separate etched well in the silicon substrate wafer. The absorbers are 0.24 mmwide on a 0.25 mm pitch and consist of 3 µm Bi electroplated atop 2.5 µm of Au that had been electroplated upfrom a 0.2 µm evaporated seed layer. The absorbers make contact to the plane of the sensors only in a T-shapedarea; the stem of the T is placed at the middle noise-mitigating stripe of the TES, and the cross bar of the Tcontacts the membrane directly outside of the TES and provides mechanical stability for the absorber. In each8×8 array, there are wires leading only to half of the pixels in order to leave room on the die for diagnosticdevices and a heatsinking Au contact.
Two identical arrays were tested at GSFC, and one of these arrays was subsequently operated in the 4×32time-division SQUID multiplexer platform at NIST, as will be discussed in Sec. 4. The testbed at GSFC alsoemploys a NIST SQUID multiplexer, an older 2×12 system, in an adiabatic demagnetization refrigerator (ADR).Both systems can be used to study one pixel (per multiplexer column) at a time for characterization of resolutionwithout impact from multiplexing. The multiplexer can also be used to measure the physical characteristics ofmany pixels simultaneously, such as through measurements of the complex impedance.
The GSFC tests included measurement of the physical parameters of several pixels for a heat-sink temperature,Tb, of 50 mK and an early investigation of the feasibility of multiplexing the array. The value of Rn, the resistanceof a TES when not superconducting, was ∼7 mΩ. During non-multiplexed operation, a spectral resolution of2.30 eV was measured on one pixel. This measurement was consistent, within statistical error, with the measurednoise level of 2.18 eV. The optimal bias for this device, based on a scan of the signal-to-noise ratio vs. bias, wasdetermined to be ∼17% of Rn, consistent with previous devices with this absorber-attachment design. Froma determination of the power required to heat the TES into its transition as a function of Tb, the thermalconductance, G, was determined to be 234 pW/K ± 5 pW/K, and T at the operating resistance was determinedto be 94.7 mK. A quick scan of Tc across the array, where Tc is defined at the top of the superconductingtransition, found Tc to vary from 95.3 to 97.0 mK over 22 pixels, with all but one of those falling between 96and 97 mK. The heat capacity was measured on two pixels by increasing Tb to a value within the transition,applying a small bias voltage so that the operating point was at the top of the transition, and measuring the timeconstant, τ , of x-ray pulses acquired in this configuration. Because there is negligible electrothermal feedback insuch a configuration, the heat capacity, C, is given by C = τG. For both pixels, we determined C=0.86 pJ/K.
In order to characterize the detector response, the GSFC testbed was also used to record the transfer functions(from the bias through the output) on multiple pixels simultaneously through use of the multiplexer. The compleximpedance of each pixel, as a function of bias resistance and frequency, is obtained from such transfer functions.The complex impedance of a calorimeter is a manifestation of its electrothermal feedback, and thus is sensitiveto the electrical and thermal time scales of the device. Fitting a model to the impedance curves can be useful fordetermining detector parameters such as α (≡ (T/R)∂R/∂T |I , where R, T , and I are resistance, temperature,and current) and β (≡ (I/R)∂R/∂I|T ), especially if C, G, and the values of the circuit components are fixed byother measurements. Fig. 2 shows impedance traces taken on six devices biased in common. The traces fromdifferent pixels are similar, especially low in the transition where the detectors are operated. Because of thecommon bias, the similarity of the curves verifies the uniformity of the components of the bias circuits as well asthe pixels themselves. We fitted these data for one of the pixels at the 15% bias point and determined α = 76.37and β = 1.24. In order to predict the performance, we need to specify the Johnson noise level associated with
Proc. of SPIE Vol. 7011 701104-3

2
0
) -2E
-4
-6m0hm
-6m0hm -4 -2 0 2 4 6Z_real
Figure 2. Complex impedance curves for six pixels biased in common and measured through the multiplexer. The bunchedcurves are for different devices at the same applied bias; the series runs from tight curves low in the transition to widecurves at the top. (The nominal bias points indicated, e.g. 15 % Rn, are exact for one of the pixels and are valid forthe other pixels to the extent that the pixels and bias circuits are uniform.) The traces from different pixels are similar,especially low in the transition where the detectors are operated. Because the complex impedance of a calorimeter issensitive to the electrical and thermal time scales of the device, detector parameters can be determined from fitting modelsto the impedance curves.
the device at its operating point. We have established, for other devices operated with similar bias currents,3
that the power of this voltage noise is 4kBTR(1 + 2β) [V2/Hz], the expression for Johnson noise in a non-lineardevice,10 and the noise of the present devices is consistent with this expression at the operating point. With theinclusion of the measured amplifier noise, the detector model predicts a resolution of ∼2.2 eV. This is close tothe resolution measured on a different pixel. If the readout noise were negligible, a device with these parameterswould have a resolution of 1.9 eV when biased at 15% Rn and anchored to a 50 mK heat sink.
3. MULTIPLEXER SET-UP
Detailed studies of the multiplexed readout were conducted at NIST. The GSFC detector array was installed ina 4-column × 32-channel SQUID time-division-multiplexer testbed. The detector and the front-end electronics,which are capable of reading out up to 128 microcalorimeters, are pictured in Fig. 3. A two-stage ADR cooledthe detector plane, and allowed full array operation for more than 8 hours per cycle with a 70.5 mK heatsink tem-perature (choice of temperature discussed below). Custom-developed room-temperature electronics11 controlledthe multiplexed row switching and digital feedback application.
The open-loop bandwidth of the multiplexer system was measured to be about 1.7 MHz, and was limited bythe coupling of the second-stage SQUID to the series-array SQUID (see Fig. 3). A 2.5 MHz anti-aliasing filterwas placed before the error-signal-sampling analog-to-digital converter (ADC). The open-loop (non-multiplexed)SQUID noise, averaged over the channels connected to detectors, was measured to be 0.61 µΦ0/
√Hz. The input
coupling from each detector to its input SQUID was Min1−1 = 7.53µ A/Φ0. Each 680-ns row-switching cycle
consisted of 600 ns of settling, followed by four 20-ns ADC samples that were averaged to yield the measurementfor that cycle.
The total inductance, L, in each TES bias circuit must be tuned for optimal combined performance of thedetector and multiplexer. This inductance serves two functions – to suppress the detector noise at frequencies
Proc. of SPIE Vol. 7011 701104-4

Min1
Rad
Rsh
MFB
SQ2
P, I
Ver
TES bias
VFB
SQ2 bias
SA flux biasSQ2 flux bias
sum
min
g co
ilse
ries
arra
y S
QU
IDIad1
on
t
Row 1
Column 1 Column 2I a
d1(t
)
unit pixel
Iad2
SQ2
P, I
Ver
VFB
serie
s ar
ray
SQ
UID
SQ1
TES
off
on
t
Row 2
I ad2
(t)
offSQ1
TES
SQ1
TES
SQ1
TES
LNy
Figure 3. (left) Schematic of a 2-row × 2-column SQUID-time-division multiplexer, used to illustrate a general N -row ×M -column array. The TES bias circuits of each column are connected in series and are supplied with a constant current.Each TES is inductively coupled (Min1) to its own first-stage SQUID amplifier (SQ1). Extra inductance, LNy, is includedin each bias circuit to filter the detector response. An inductive summing coil carries the output signals from all SQ1’sin a column to a common second-stage SQUID (SQ2). Rows of SQ1’s are sequentially turned on (or addressed, usingIad), so the signal from one TES at a time per column is passed to that column’s SQ2. When a SQ1 is off, it acts likea superconducting wire, transmitting no signal or noise from its TES. Finally, the output of each SQ2 is routed to a100-SQUID, series-array amplifier and then to room-temperature electronics. In order to keep the nonlinear three-stageSQUID amplifier in a small, linear range, the multiplexer is run as a flux-locked feedback loop. The series array output,or error signal (Ver), is digitally sampled, and then a flux-feedback signal (VFB) is applied inductively to the first-stageSQUIDs to regulate Ver to a constant value. With perfect feedback, VFB would be directly proportional to the TES current;in a real system, the TES current is determined from a linear combination of VFB and Ver. Electronics synchronize therow-address and flux-feedback signals and stream the data to a computer. A kilopixel array could be read out with a32-row × 32-column TDM. (right) Photograph of the detector plane, showing the 64-pixel GSFC detector array in the4-column × 32-row NIST TDM testbed. An amplifier column consists of a 1×32 linear multiplexer chip, an interfacechip with TES shunt resistors and Nyquist inductors, and its associated detectors. A wiring bridge chip was fabricated toconnect the GSFC detector to the Nyquist interface chip. 16 rows in each of two columns (A and C) were connected todetectors, while B and D were not used. The detector array was heat-sunk to the copper cold stage via Au wire bonds.
above the Nyquist frequency of the multiplexer frame rate and to slow down the pulse rise time so that pulsesdo not exceed the system slew-rate limit. Stability considerations limit how high the inductance can be, sincethe inductance interacts with the electrothermal feedback of the TES to create a resonance as the electricaltime constant approaches the thermal time constant. The optimal choice, Lcrit, is the inductance value thatleads to critical damping;12 this results in the slowest rise times and fastest fall times for a particular set ofdetector characteristics. Fig. 4 shows modeled pulses, based on the detector characteristics measured at GSFCunder optimal bias with Tb = 50 mK. Two cases are shown: L ∼ 0 and L = Lcrit. Critical damping would beachieved with L = 152 nH, however the lowest inductance available on existing Nyquist interface chips was 263nH, resulting in L = 273 nH when combined with the input inductance of the first stage SQUID.
To create operating conditions so that Lcrit = 273 nH, Tb was raised to 70.5 mK to reduce the loop gainassociated with the electrothermal feedback thereby slowing down the detector response. The detector operatingtemperature remained at the superconducting transition temperature, but less current was required to bias itat this operating point. Running with an elevated value of Tb has several negative effects on the ideal detectorperformance – it increases the detector sensitivity to fluctuations in Tb, it slightly increases the magnitude ofthe thermal fluctuation noise between the detector and the heat sink, and it reduces the signal and thermalnoise terms with respect to the Johnson noise, reducing the signal bandwidth over which the signal-to-noiseratio is high. On the positive side, besides enabling slower rise times that make multiplexing easier, operation at
Proc. of SPIE Vol. 7011 701104-5

5iA
0.0 0.5 1.0 1.5 2.0 2.5 3.Oms
time
Figure 4. Simulated pulse response for absorption of a 1 keV x-ray photon, based on detector characteristics measured atGSFC for optimal bias at Tb = 50 mK (see discussion in Sect. 2), assuming a 0.3 mΩ biasing shunt resistor. Real pulsesare actually decrements in current; the value plotted is the steady-state current minus the signal. Two cases are shown:L ∼ 0 (dashed) and L = Lcrit (critical damping, solid). Although the critically damped pulse peaks later than the pulsefor L ∼ 0, it returns to the quiescent level sooner. For this case, Lcrit = 152 nH and τcrit = 0.17 ms.
reduced current can improve sensitivity by reducing noise in a non-ideal device. We discuss the modest overallimpact of higher Tb on the intrinsic resolution of the detector in Sec. 4.2 as we analyze the incremental impactof multiplexing on this base value. Critically damped pulses take the functional form Ate−t/τcrit , where t is timeand A is a scale factor; for the conditions of the NIST demonstration, τcrit was 0.28 ms.
Data acquisition is controlled by discrete software modules: 1) a user interface that sets the SQUID anddetector biases, the dwell time on each row, and the digital feedback parameters; 2) a server that demultiplexesthe data stream into the individual pixel signals (both error and feedback) and makes these parallel streamsavailable on the network; and 3) clients that can access the data. One client is based on the calorimeter digitalprocessor of the XRS instrument on Suzaku13,14 and provides real-time pulse processing. Preliminary resultsobtained while employing this system in this new application are discussed in Sec. 5. Another client functionsas a digital oscilloscope and saves triggered data records for later optimal filtering and analysis. This clientwas used to acquire the data presented in Sec. 4. This client also communicates with the server and controlscharacteristics of the data stream, such as whether the error signal should be combined with the raw feedbacksignal and the scale factors to use for this mixing if it is enabled. While the relationship between the feedbackvoltage and the TES current depends only on the relative coupling of the feedback and input lines and the valueof the feedback resistance, the relationship between the feedback and error signals also depends on the slope ofthe combined V -Φ curve of the SQUID amplifier chain. This slope is easily measured by increasing the feedbackgain in order to produce oscillations in the feedback signal, and then adjusting the error-signal scale factor sothat, when the error is added to the feedback signal, the root-mean-square value of the sum (in the absence ofpulses) is minimized. In addition to streaming data on the network, the server can also save raw data streamsto disk that can be played back by another server. Such playback is useful for development of the clients and touse as control data for comparison of different analysis techniques.
4. OPERATION OF GSFC TES ARRAY WITH NIST MULTIPLEXER
4.1 Demonstration of 2×8 readout
An 55Fe source mounted inside the cryostat provided an x-ray flux of 1.8 counts/s/pixel. The average operatingresistance, < Rop >, of the 16 pixels was 15% Rn, while the range of bias resistances of individual pixels rangedfrom 13.5% to 16.4%. The multiplexer switched between rows every 34 cycles of the 50 MHz master clock, or0.68 µs, thus the frame period was 5.44 µs, which represents the sample interval for the signal from an individualpixel. Triggered records of 8192 samples (44.6 ms) each were recorded over about 4.5 hours for an average of30,000 events per pixel. Data cuts to reject pile-up eliminated 8% of the pulses, which is consistent with theexpected record-rejection rate of a non-paralyzable detector with dead time = 44.6 ms and input count rate
Proc. of SPIE Vol. 7011 701104-6
Column 1Avg res: 2.93 eV
2.8 3.0 i.2 3.4
resolution (eV R.NHM)
Row 0: 2.60 eV Row 0: 2.74 eV
= 3000-o>cD
(I)=
8 2000
1000
0
5880 5890 5900 5910 5920 5880 5890 5900 5910 5920
Energy (eV) Energy (eV)
Column 0Avg res: 2.92 eV
5000
4000
= 3000-o>cD
(I)=
8 2000
1000
0
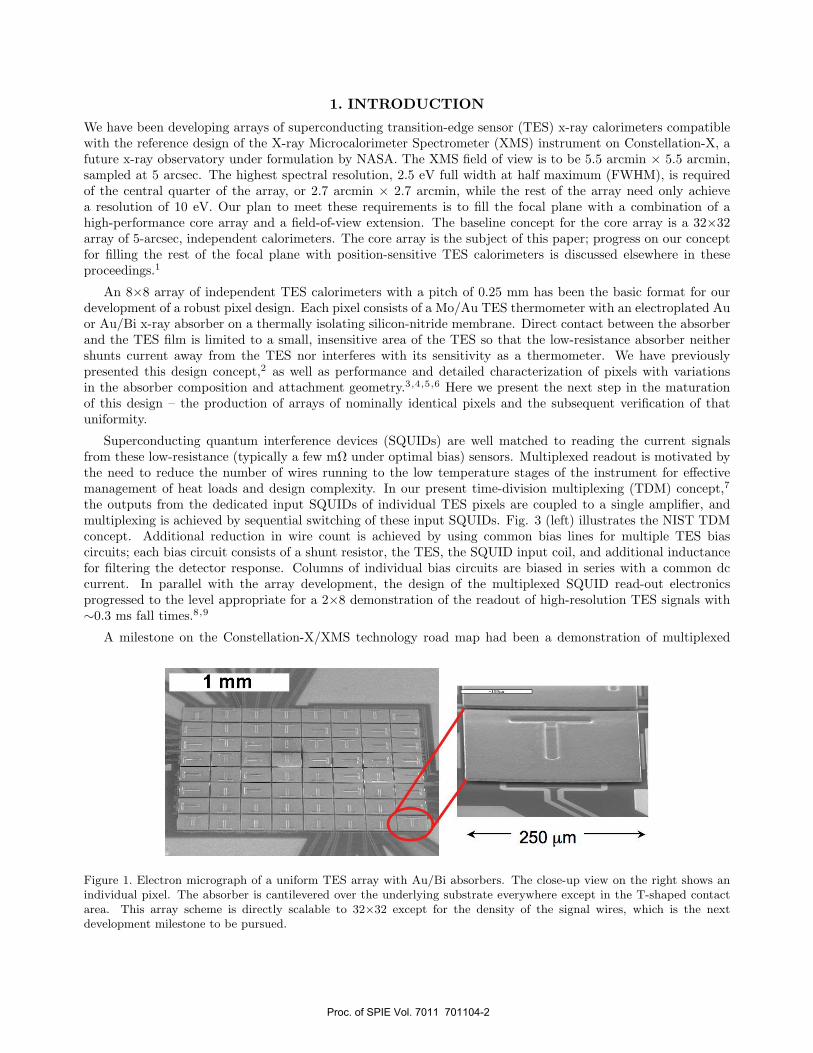
Figure 5. Results of the 2×8 multiplexing demonstration; the spectra for the individual pixels in a column are verticallyoffset by 500 counts/bin. The data were acquired and processed under the following conditions: Tb = 70.5 mK, < Rop >= 15% Rn, row dwell time = 0.68 µs, frame time = 5.44 µs, 8192 frames per triggered record, 1.8 counts/s/pixel inputcount rate (limited by cryogenic 55Fe source), 30,000 counts/pixel, no data cuts other than pile-up rejection performed,gain drift and sampling phase corrections performed, and fits based on Holzer et al.,15 with correction and extensionprovided by Holzer via private communication. These results are a significant milestone for the development of TEStechnology suitable for the XMS instrument on Constellation-X.
= 1.8 counts/s.16 No other data cuts were performed. An optimal digital filter17 was used to determine thebest estimate of energy; the value of the filter in the 0 Hz frequency bin was set to zero to remove contributionfrom the quiescent signal level. Drift in gain over time was removed by use of a third-order-polynomial scalecorrection. The dependence of filtered pulse height on sampling phase (the arrival time of the photon within asample interval) was determined and also corrected. The energy scale was determined from a linear fit to theMn Kα1 and Mn Kα2 peak positions. The energy resolution of each channel was then determined by fitting thenatural line shape of the Mn Kα doublet, convolved with the detector resolution, to the accumulated spectra.The line shape was based on the profile determined by Holzer et al.,15 with correction and extension providedby Holzer via private communication. Fig. 5 shows the individual fits to the 16 pixels and a summary histogramof the 16 results. The 1σ statistical errors on the determination of the individual resolution values were ∼0.07
Proc. of SPIE Vol. 7011 701104-7
Average of all pixels3.8
>a)
3.6I
3.2
2.4
25Number of multiplexed rows
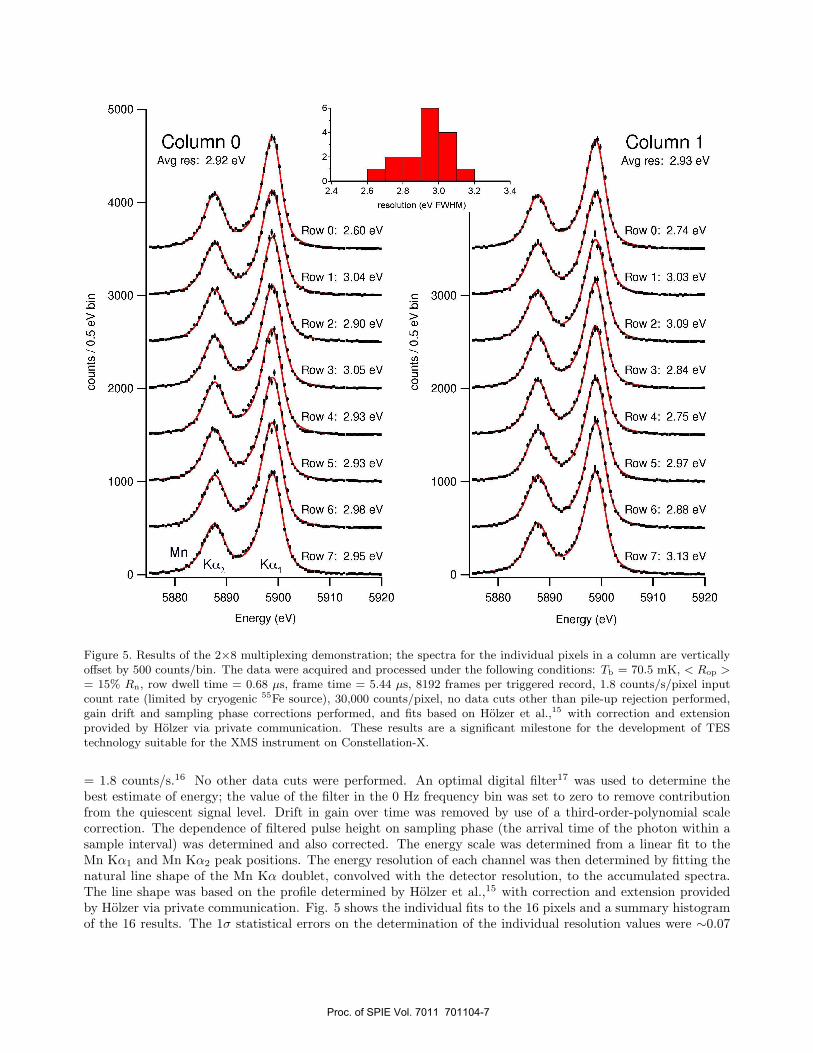
Figure 6. Plot of the average measured resolution (circles with error bars) compared with the expected energy resolution(upper curve) based on the aliased SQUID noise term, as a function of the number of multiplexed rows. The lower curveis the prediction for the case of a factor of two reduction in SQUID noise. With a factor of four faster switching, the goodmatch between theory and data now seen out to 8 rows will be extended out to the 32 rows needed for the Constellation-XXMS. Both improvements should be achievable with incremental (and planned) changes to the existing architecture.
eV. The average resolution was 2.9 eV FWHM, and the distribution of resolution values had a relative standarddeviation of 5%. Each pixel surpassed the 4 eV requirement for this demonstration milestone by a wide margin.
4.2 Performance versus number of multiplexed rows
The effect of the readout on the detector energy resolution was assessed by multiplexing various numbers ofdetector pixels per amplifier channel. An expected source of signal degradation is the aliasing of SQUID noise bythe multiplexer. In order to switch rapidly among the rows and allow the error signal to settle before sampling, themultiplexer must have a very high open-loop bandwidth (here, fOL = 1.7 MHz). As the number of rows, Nrows,increases, each row is sampled less often. The Nyquist sampling condition, fsamp ≥ fsignal/2, is not met for theSQUID noise. This leads to a SQUID noise term of the form nSQUID−muxed = nSQUID−notmuxed
√πfOLNrowstrow
that adds in quadrature to the TES noise.9 Fig. 6 is a plot of the average measured resolution comparedwith the expected energy resolution based on the aliased SQUID noise term, as a function of the number ofmultiplexed rows. This expected resolution is based on the average over four modeled pixels from the multiplexdemonstration that spanned the ranges of measured pulseheights and SQUID noise. The data point for a singlerow (not-multiplexed) is the average of 3 pixels. The 2-row and 4-row data points average the same 16 pixels asthe 2-column × 8-row case discussed in Sect. 4, through multiple acquisitions. The 12-row point is an averageof the 16 of the 24 pixels that were part of the 2×8 data set. One of the columns wouldn’t operate stably whenmultiplexing more than 12 rows, so the 16- and 20-row points are based on the average results from the 8 pixelsin one column in common with the 8-row case. In the 20-row measurement, 4 SQUIDs that weren’t connectedto detectors were included in the multiplexer cycle.
The data in Fig. 6 follow the expected resolution well for 1, 2, 4, 8, and 12 rows. For 16 and 20 rows,the energy resolution degrades more rapidly than can be accounted for in this model. As the frame intervalincreases with increasing row count, the dependence of filtered pulse height on sampling phase also increases.We determine this arrival phase by solving for the coefficients of a parabola defined by the peak three pointsof the optimally filtered pulse. From these coefficients, we determine an interpolated peak value and the timeof that peak between the discrete samples of the measurement. With larger sample intervals, the peak threepoints cover a larger span of the filtered pulse. Eventually, the assumption that the encompassed peak can be
Proc. of SPIE Vol. 7011 701104-8

MUX CMUX C
T = 103.1 mK(highest, many pixeI
T = 102.5 mK(lowest, many
Span in G:226 - 256 pW/K
MUXA MUXA
adequately described by a parabola breaks down, resulting in a correlation between pulse height and samplingphase. In this demonstration, correcting the data for this correlation was an effective remedy for measurementsusing up through 12 rows. For 16 rows and above, this method was less effective.
Fig. 6 also includes a lower theoretical curve that shows the effect of lowering the SQUID noise to 0.30µΦ0/
√Hz (non-multiplexed), in contrast with the 0.61 µΦ0/
√Hz average measured in this demonstration. With
a factor of four faster switching, the good match between theory and data now seen out to 8 rows will be extendedto 32 rows. Both improvements should be achievable with incremental (and planned) changes to the existingarchitecture.
The base resolution of 2.5 eV measured in the NIST experiments, which is then degraded by multiplexing, isitself degraded by the higher temperature operation of the detector heat sink. With Tb = 50 mK, the detectormodel discussed in Sect. 2 predicts a resolution of 1.9 eV if sources of noise external to the detector are notsignificant, and this degrades to 2.2 eV when the modeled heat sink temperature is raised to 70 mK. In thecase in which non-multiplexed SQUID noise degrades the 50 mK case to 2.2 eV, the predicted resolution for Tb
= 70 mK becomes 2.5 eV. Thus, for reasonable levels on non-multiplexed amplifier noise, 50 mK operation (asplanned for XMS) results in resolution about 0.3 eV better than achievable at 70 mK, and will provide moremargin for the aliased SQUID noise inherent in multiplexing.
4.3 Study of array uniformity
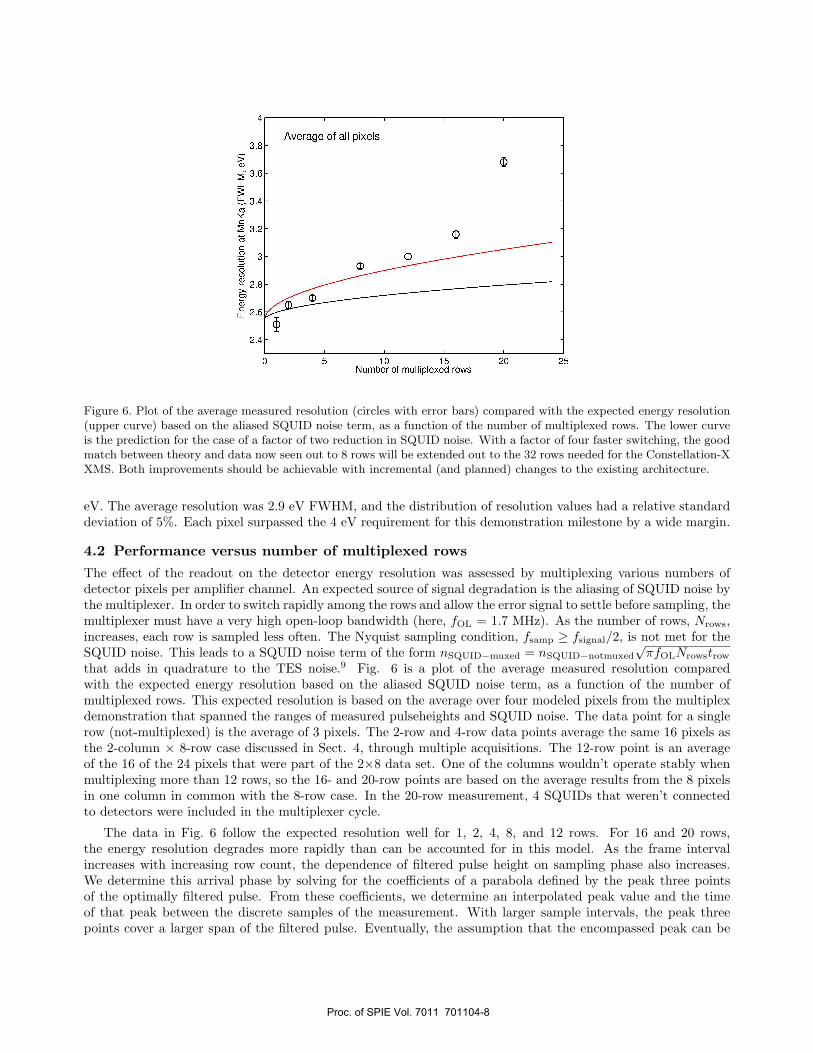
The results of Sec. 4 show that the properties of the pixels of the array were sufficiently uniform to achieve high-resolution performance under common detector bias. Fig. 7 is a map of the two active quadrants of the array(one pixel, marked with an “x”, was open, probably due to a bad wire bond) showing the measured distributionsof Tc and G. The distribution of Tc shows no discernable pattern. Due to disagreement between the thermometrycalibrations in the NIST and GSFC testbeds, these Tc values are higher than the values measured at GSFC.The measurements of G were performed on one quadrant at a time. The apparent pattern showing lower Gtoward the middle of each quadrant is probably an artifact resulting from the bias power increasing the effectiveheat-sink temperature. The variations in G and also in the shapes of the superconducting transitions resultedin a range in bias points from 13.5% to 16.4% of Rn at a common bias chosen to yield an average bias resistanceof 15%. Plots of signal-to-noise vs. bias point of detectors of this design are flat in the 13 % - 17 % range, thusthis degree of variation was acceptable. The biases of the two columns were independently optimized.
Figure 7. Plot of the distributions of Tc (left) and G (right) in the active quadrants of the test array. With the 16 pixelsin each quadrant under common bias, the variations in G and in the shapes of the superconducting transitions resultedin a range in bias points from 13.5% to 16.4% of Rn. Plots of signal-to-noise vs. bias point of these detectors are flat inthe 13 % – 17 % range, thus this degree of variation was acceptable. One pixel, marked with an “x”, was not measurable,presumably due to a failed wire bond.
Proc. of SPIE Vol. 7011 701104-9

curve shows a fit to A/rn,where r is the pixel separation;n= 2.33 determined
2 4 6 8
pixel separation in units of pitch
Figure 8. Height of thermal crosstalk as a function of pixel separation, as measured through the multiplexer. Thedependence of crosstalk amplitude on pixel separation, r, falls slightly more steeply than 1/r2, suggesting that diffusionthrough the silicon between pixels in the array is the primary heatsinking bottleneck.
4.4 Crosstalk
Simultaneous readout of a large number of pixels in an array allows in-depth crosstalk studies. We have alreadyperformed limited but detailed analysis of thermal crosstalk on previous test arrays.18 Crosstalk pulses are toosmall to be confused for x-ray photons, therefor crosstalk contributes to noise, not background, and can result inenergy resolution that depends on the incident x-ray flux. The level of crosstalk in our present arrays needs tobe reduced by a factor of ∼10, based on preliminary analysis, in order to meet the XMS resolution requirementat count rates approaching 1000 counts/s/pixel. We are performing investigations into improving the thermaldesign of the array in order to reduce the crosstalk magnitude. In the multiplexed data, thermal crosstalk canbe unambiguously seen between pixels in different readout columns. Recent results are summarized in Fig. 8.The rough dependence of crosstalk on position suggests that diffusion within the silicon in the interior of thearray is limiting the thermal anchoring of the pixels, as also suggested by the pixel G measurements describedabove. Within a column, multiplexer-induced crosstalk is also observed, known sources of which include heatingof non-superconducting wires in the printed circuit boards of the test bed and coupling between the input andfeedback coils of the first-stage SQUID.7 Detailed analysis of multiplexer-induced crosstalk will occur in a futurepublication.
5. DATA ANALYSIS ISSUES
Analysis of large data sets of critically damped, multiplexed pulses has revealed two issues that need furtherstudy before an instrument can be designed. The first effect is the dependence of filtered pulse height on samplingphase discussed in Sect. 4.2. A study of the range of optimally filtered pulse shapes expected, given realistic noiseand detector characteristics that meet the requirements for a particular application such as the XMS instrument,may reveal a more appropriate functional form for interpolation than a parabola. The multiplexer contributes tothis effect beyond the basic problem of sparse sampling. Because the signal is recreated from a linear combinationof the error signal and the feedback signal, it is important that the deviation from the lock point remain withinthe linear part of the combined SQUID V -Φ curve. Different sampling phase on the initial fast rise of a pulse can
Proc. of SPIE Vol. 7011 701104-10

result in different degrees of excursion into the non-linear regime; this effect would also depend on pulse energy.Faster row switching times and new SQUIDs with extended linear regimes will help address this issue.
The second issue is the choice of record length for pulse analysis. The record length sets the size of thefrequency bins used to calculate the optimal filter. Because the dc level is included in the zero-frequency bin, butrepresents a source of noise (due to the fact that it is a component of the signal that does not scale with energy, aswell as to any slow changes in that level), the optimal filter value for this bin is often set to zero. Even when notexplicitly zeroed, the dc level suppresses this bin when the optimal filter is calculated. The shorter the record,the greater the proportion of the passband of the filter that is lost when this bin is set to zero. Electrothermalfeedback and critical damping both result in hastening the return of a calorimeter to its quiescent level, butneither of these effects changes the frequency spectrum of the signal-to-noise ratio significantly. Therefore,the signal-to-noise ratio remains highest at low frequencies, and nulling out a large fraction of that sensitivitydegrades the resolution. For this demonstration, a generous record length of 45 ms was chosen, but our modelsand test results indicate that the record length could have been reduced by about a factor of 4 before havingsignificant impact on the resolution. In order to shorten the necessary record length by another factor of 10or so to enable the high count rates that should otherwise be allowed given the fast detector response times,we plan to investigate alternative analysis methods. We are considering methods that permit retention of thezero-frequency bin in the optimal filter, such as tracking an average of the dc level on time scales much longerthan a record.
Automatic pulse processing is essential in orbit and convenient on the ground. We have conducted a prelim-inary test of applying real-time optimal filtering derived from the Suzaku/XRS calorimeter digital processor byplaying back recorded 2×8 multiplexed data at approximately the real-time rate. The client calculates an opti-mal filter for each pixel based on a set of noise and pulse thresholds and then applies that filter to the incomingdata. The final product is an event list that includes information for each event such as filtered pulse height,time, sampling phase (parabolic approximation), and various flags. After correcting for gain drift and phasedependence and determining an energy scale for one test pixel, a resolution of 3.1 eV was measured. Manualanalysis of saved triggered records from the same data stream resulted in a resolution of 2.7 eV. The cause ofthe degradation is under investigation, but we are confident that real-time data processing for performance atthe level of 2 eV resolution will soon be possible.
6. CONCLUSIONSWe have reached an important milestone in the development of TES array technologies suitable for the XMSinstrument on Constellation-X. We have produced an array of pixels sufficiently uniform that they can be biasedin common without significant compromise in the operation of any pixel. We have demonstrated an averageresolution of 2.9 eV with a relative standard deviation of 5% on 16 pixels read out with a 2-column × 8-rowSQUID multiplexer. We have characterized multiplexing up to 20 rows. The path to improvement is to movethe series array SQUIDs to the 50 mK stage (from 4 K) to eliminate stray inductance, enabling increase of theopen-loop bandwidth to the 6-7 MHz range. Room-temperature electronics are under development to matchthis performance. Reduction of SQUID noise by factor of two (to 0.3 µΦ0/
√Hz) is achievable by, among other
improvements, better heatsinking of the SQUID chips to the thermal bath. These straightforward improvementswill enable results like those demonstrated here to be realized for 32-row multiplexing, enabling a kilopixel arrayto be read out with 32 amplifier channels. The base pixel resolution, to which the multiplexer effects are added,will be improved when the detectors are heat sunk to 50 mK (instead of 70 mK) and are matched with a suitableinductance, which will, in turn, improve the resolution while multiplexed.
ACKNOWLEDGMENTSThis work was supported in part by NASA/NIST interagency agreement NNG07EJ04I.
REFERENCES[1] Smith, S. J., Bandler, S. R., Brekosky, R., Brown, A. D., Chervenak, J. A., Figueroa-Feliciano, E.,
Finkbeiner, F. M., Kelley, R. L., Kilbourne, C. A., and Porter, F. S., “Development of arrays of position-sensitive microcalorimeters for Constellation-X,” Proc. SPIE 7011 (these proceedings) (2008).
Proc. of SPIE Vol. 7011 701104-11

[2] Kilbourne, C. A., Bandler, S. R., Brown, A. D., Chervenak, J. A., Figueroa-Feliciano, E., Finkbeiner, F. M.,Iyomoto, N., Kelley, R. L., Porter, F. S., Saab, T., Sadleir, J., and White, J., “High-density arrays of x-raymicrocalorimeters for Constellation-X,” Proc. SPIE 6266, 626621–1 – 62662–9 (2006).
[3] Iyomoto, N., Bandler, S. R., Brekosky, R. P., Brown, A. D., Chervenak, J. A., Finkbeiner, F. M., Kelley,R. L., Kilbourne, C. A., Porter, F. S., Sadleir, J., Smith, S. J., and Figueroa-Feliciano, E., “Close-packedarrays of transition-edge x-ray microcalorimeters with high spectral resolution at 5.9 keV,” Appl. Phys.Lett. 92, 013508–1 –013508–3 (2007).
[4] Bandler, S. R., Brekosky, R. P., Brown, A. D., Chervenak, J. A., Figueroa-Feliciano, E., Finkbeiner, F. M.,Iyomoto, N., Kelley, R. L., Kilbourne, C. A., Porter, F. S., Sadleir, J., and Smith, S. J., “Performance ofTES x-ray microcalorimeters with a novel absorber design,” J. Low Temp. Phys. 151, 400–405 (2008).
[5] Iyomoto, N., Bandler, S. R., Brekosky, R. P., Brown, A. D., Chervenak, J. A., Figueroa-Feliciano, E.,Finkbeiner, F. M., Kelley, R. L., Kilbourne, C. A., Porter, F. S., Sadleir, J., and Smith, S. J., “Modellingof TES x-ray microcalorimeters with a novel absorber design,” J. Low Temp. Phys. 151, 406–412 (2008).
[6] Kilbourne, C. A., Bandler, S. R., Brown, A. D., Chervenak, J. A., Figueroa-Feliciano, E., Finkbeiner, F. M.,Iyomoto, N., Kelley, R. L., Porter, F. S., and Smith, S. J., “Uniform high spectral resolution demonstratedin arrays of tes x-ray microcalorimeters,” Proc. SPIE 6686, 668606–1 – 668606–10 (2007).
[7] de Korte, P. A. J., Beyer, J., Deiker, S., Hilton, G. C., Irwin, K. D., Macintosh, M., Nam, S. W.,Reintsema, C. D., and Vale, L. R., “Time-division superconducting quantum interference device multiplexerfor transition-edge sensors,” Rev. Sci. Instrum. 74, 3807–3815 (2003).
[8] Doriese, W. B., Beall, J. A., Deiker, S., Duncan, W. D., Ferreira, L., Hilton, G. C., Irwin, K. D., Reintsema,C. D., Ullom, J. N., Vale, L. R., and Xu, Y., “Time-division multiplexing of high-resolution x-ray mi-crocalorimeters: Four pixels and beyond,” Appl. Phys. Lett. 85, 4762–4764 (2004).
[9] Doriese, W. B., Beall, J. A., Duncan, W. D., Ferreira, L., Hilton, G. C., Irwin, K. D., Reintsema, C. D.,Ullom, J. N., Vale, L. R., and Xu, Y., “Progress toward kilopixel arrays: 3.8 eV microcalorimeter resolutionin 8-channel SQUID multiplexer,” Nucl. Inst. and Meth. A 559, 808–810 (2006).
[10] Irwin, K. D., “Thermodynamics of nonlinear bolometers near equilibrium,” Nucl. Inst. and Meth. A 559,718–720 (2006).
[11] Reintsema, C. D., Beyer, J., Nam, S. W., Deiker, S., Hilton, G. C., Irwin, K. D., Martinis, J., Ullom,J. N., and Vale, L. R., “Prototype system for superconducting quantum interference device multiplexing oflarge-format transition-edge sensor arrays,” Rev. Sci. Instrum. 74, 4500–4508 (2003).
[12] Irwin, K. D. and Hilton, G. C., “Transition-edge sensors,” in [Topics in Applied Physics: Cryogenic ParticleDetection ], Enss, C., ed., 63–149, Springer-Verlag and Berlin and Heidelberg (2005).
[13] Boyce, K. R., Audley, M. D., Baker, R. G., Dumonthier, J. J., Fujimoto, R., Gendreau, K. C., Ishisaki,Y., Kelley, R. L., Stahle, C. K., Szymkowiak, A. E., and Winkert, G. E., “Design and performance of theAstro-E/XRS signal processing system,” Proc. SPIE 3765, 741–750 (1999).
[14] Kelley, R. L., Mitsuda, K., Allen, C. C., Arsenovic, P., Audley, M. D., Bialas, T. G., R.Boyce, K., Boyle,R. F., Breon, S. R., Brown, G. G., Cottam, J., DiPirro, M. J., Fujimoto, R., Furusho, T., Gendreau, K. C.,Gochar, G. G., Gonzalez, O., Hirabayashi, M., Holt, S. S., Inoue, H., Ishida, M., Ishisaki, Y., Jones, C. S.,Keski-Kuha, R., Kilbourne, C. A., Mccammon, D., Morita, U., Moseley, S. H., Mott, D. B., Narasaki, K.,Ogawara, Y., Ohashi, T., Ota, N., Panek, J. S., Porter, F. S., Serlemitsos, A., Shirron, P. J., Sneiderman,G. A., Szymkowiak, A. E., Takei, Y., Tveekrem, J. L., Volz, S. M., Yamamoto, M., and Yamasaki, N. Y.,“The Suzaku high resolution x-ray spectrometer,” Publ. Astron. Soc. Japan 59, S77–S112 (2007).
[15] Holzer, G., Fritsch, M., Deutsch, M., Hartwig, J., and Forster, E., “Kα1,2 and Kβ1,3 x-ray emission lines ofthe 3d transition metals,” Phys. Rev. A 56, 4554–4568 (1997).
[16] Knoll, G. F., [Radiation Detection and Measurement ], John Wiley & Sons, Inc., New York, USA, 3 ed.(2000).
[17] Symkowiak, A. E., Kelley, R. L., Moseley, S. H., and Stahle, C. K., “Signal processing for microcalorimeters,”J. Low Temp. Phys. 93, 281–285 (1993).
[18] Iyomoto, N., Bandler, S. R., Brekosky, R. P., Brown, A. D., Chervenak, J. A., Figueroa-Feliciano, E.,Finkbeiner, F. M., Kelley, R. L., Kilbourne, C. A., Porter, F. S., Sadleir, J., and Smith, S. J., “Heat sinkingand crosstalk for large, close-packed arrays of microcalorimeters,” J. Low Temp. Phys. 151, 506–512 (2008).
Proc. of SPIE Vol. 7011 701104-12