Multiplexed Method to Calibrate and Quantitate Fluorescence …ultra.bu.edu/papers/CaFE...
7
rXXXX American Chemical Society A dx.doi.org/10.1021/ac202212k | Anal. Chem. XXXX, XXX, 000–000 ARTICLE pubs.acs.org/ac Multiplexed Method to Calibrate and Quantitate Fluorescence Signal for Allergen-Specific IgE Margo R. Monroe,* ,† Alexander P. Reddington, ‡ Austin D. Collins, ‡ Craig LaBoda, ‡ Marina Cretich, § Marcella Chiari, § Fr ed eric F. Little, || and M. Selim € Unl€ u †,‡,^ † Department of Biomedical Engineering, Boston University, 44 Cummington Street, Boston, Massachusetts 02215, United States ‡ Department of Electrical and Computer Engineering, Boston University, 8 St. Mary’s Street, Boston, Massachussetts 02215, United States § Consiglio Nazionale delle Ricerche, Istituto di Chimica del Riconoscimento Molecolare (ICRM), Milano, Italy ) Pulmonary Center, Boston University School of Medicine, 715 Albany Street, Boston, Massachusetts 02118, United States ^ Physics Department, Boston University, 590 Commonwealth Avenue, Boston, Massachusetts 02215, United States b S Supporting Information A llergy, a disorder of the immune system characterized by a maladaptive immune response to otherwise harmless envir- onmental antigens (“allergens”), affects nearly 50 million people in the U.S. with total estimated annual costs at nearly $7B. 1,2 The recent development of protein microarrays and the availability of recombinant allergens over the past decade have led to micro- array-based allergy immunoassays testing for specific IgE in patient serum. The main advantages of these microarray in vitro diagnostics resides in the inherent capability to quantify allergen- specific IgE using only 10 100 μL of serum per test and to better characterize allergen sensitization by measuring specific IgE to the component major allergens of a crude allergen extract (component-resolved diagnostics, CRD). 3 However, two speci- fic shortcomings exist with this technology. First, the typical microarray chips utilize assays with probes placed directly on a simple glass slide. In this configuration, the presence of a high index solid substrate (glass) in the immediate vicinity of the fluorophores reduces the fluorescence yield. Simple layered structures offer an inexpensive alternative to overcome the limitations imposed by glass slides and provide significant signal enhancement. 4 Second, the more important limitation is related to the difficulty in obtaining quantitative results in conventional fluorescence based microarray tests. This difficulty arises from the variability in the amount of immobilized allergens that affects specific IgE capture and quantitation. 3,5,6 As a result, fluorescence detection on typical glass (SiO 2 ) slides, the “gold-standard” technique used in microarrays, has limited sensitivity and may yield inaccurate results. These inadequacies can cause under- estimation or failure of detection for captured targets 7 and concurrently yield unreliable clinical results. 8 10 Variability in microarray technology in general has become an essential concern in producing reliable data not only due to the technical variation, such as array printing, sample processing, analytes, plate, or person, but also due to the inherent nature of proteins themselves. 11 13 Label-based procedures have been developed to account for this variation in probe deposition and Received: August 22, 2011 Accepted: November 7, 2011 ABSTRACT: Using a microarray platform for allergy diagnosis allows for testing of specific IgE sensitivity to a multitude of allergens, while requiring only small volumes of serum. However, variation of probe immobilization on microarrays hinders the ability to make quantitative, assertive, and statistically relevant conclusions necessary in immunodiagnostics. To address this problem, we have developed a calibrated, inexpensive, multiplexed, and rapid protein microarray method that directly correlates surface probe density to captured labeled secondary antibody in clinical samples. We have identified three major technological advantages of our calibrated fluorescence enhancement (CaFE) technique: (i) a significant increase in fluorescence emission over a broad range of fluorophores on a layered substrate optimized specifically for fluorescence; (ii) a method to perform label-free quanti fication of the probes in each spot while maintaining fluorescence enhancement for a particular fluorophore; and (iii) a calibrated, quantitative technique that combines fluorescence and label-free modalities to accurately measure probe density and bound target for a variety of antibody antigen pairs. In this paper, we establish the effectiveness of the CaFE method by presenting the strong linear dependence of the amount of bound protein to the resulting fluorescence signal of secondary antibody for IgG, β-lactoglobulin, and allergen-specific IgEs to Ara h 1 (peanut major allergen) and Phl p 1 (timothy grass major allergen) in human serum.
Transcript of Multiplexed Method to Calibrate and Quantitate Fluorescence …ultra.bu.edu/papers/CaFE...
rXXXX American Chemical Society A dx.doi.org/10.1021/ac202212k |Anal. Chem. XXXX, XXX, 000–000
ARTICLE
pubs.acs.org/ac
Multiplexed Method to Calibrate and Quantitate Fluorescence Signalfor Allergen-Specific IgEMargo R. Monroe,*,† Alexander P. Reddington,‡ Austin D. Collins,‡ Craig LaBoda,‡ Marina Cretich,§
Marcella Chiari,§ Fr�ed�eric F. Little,|| and M. Selim €Unl€u†,‡,^
†Department of Biomedical Engineering, Boston University, 44 Cummington Street, Boston, Massachusetts 02215, United States‡Department of Electrical and Computer Engineering, Boston University, 8 St. Mary’s Street, Boston, Massachussetts 02215,United States§Consiglio Nazionale delle Ricerche, Istituto di Chimica del Riconoscimento Molecolare (ICRM), Milano, Italy
)Pulmonary Center, Boston University School of Medicine, 715 Albany Street, Boston, Massachusetts 02118, United States^Physics Department, Boston University, 590 Commonwealth Avenue, Boston, Massachusetts 02215, United States
bS Supporting Information
Allergy, a disorder of the immune system characterized by amaladaptive immune response to otherwise harmless envir-
onmental antigens (“allergens”), affects nearly 50 million peoplein the U.S. with total estimated annual costs at nearly $7B.1,2 Therecent development of protein microarrays and the availability ofrecombinant allergens over the past decade have led to micro-array-based allergy immunoassays testing for specific IgE inpatient serum. The main advantages of these microarray in vitrodiagnostics resides in the inherent capability to quantify allergen-specific IgE using only 10�100 μL of serum per test and to bettercharacterize allergen sensitization by measuring specific IgE tothe component major allergens of a crude allergen extract(component-resolved diagnostics, CRD).3 However, two speci-fic shortcomings exist with this technology. First, the typicalmicroarray chips utilize assays with probes placed directly on asimple glass slide. In this configuration, the presence of a highindex solid substrate (glass) in the immediate vicinity of thefluorophores reduces the fluorescence yield. Simple layeredstructures offer an inexpensive alternative to overcome thelimitations imposed by glass slides and provide significant signal
enhancement.4 Second, the more important limitation is relatedto the difficulty in obtaining quantitative results in conventionalfluorescence based microarray tests. This difficulty arises fromthe variability in the amount of immobilized allergens that affectsspecific IgE capture and quantitation.3,5,6 As a result, fluorescencedetection on typical glass (SiO2) slides, the “gold-standard”technique used in microarrays, has limited sensitivity and mayyield inaccurate results. These inadequacies can cause under-estimation or failure of detection for captured targets7 andconcurrently yield unreliable clinical results.8�10
Variability in microarray technology in general has become anessential concern in producing reliable data not only due to thetechnical variation, such as array printing, sample processing,analytes, plate, or person, but also due to the inherent nature ofproteins themselves.11�13 Label-based procedures have beendeveloped to account for this variation in probe deposition and
Received: August 22, 2011Accepted: November 7, 2011
ABSTRACT: Using a microarray platform for allergy diagnosisallows for testing of specific IgE sensitivity to a multitude ofallergens, while requiring only small volumes of serum. However,variation of probe immobilization on microarrays hinders theability to make quantitative, assertive, and statistically relevantconclusions necessary in immunodiagnostics. To address thisproblem, we have developed a calibrated, inexpensive, multiplexed,and rapid protein microarray method that directly correlatessurface probe density to captured labeled secondary antibody inclinical samples. We have identified three major technologicaladvantages of our calibrated fluorescence enhancement (CaFE) technique: (i) a significant increase in fluorescence emission over a broadrange of fluorophores on a layered substrate optimized specifically for fluorescence; (ii) a method to perform label-free quantification ofthe probes in each spot while maintaining fluorescence enhancement for a particular fluorophore; and (iii) a calibrated, quantitativetechnique that combines fluorescence and label-free modalities to accurately measure probe density and bound target for a variety ofantibody�antigen pairs. In this paper, we establish the effectiveness of theCaFEmethod by presenting the strong linear dependence of theamount of bound protein to the resulting fluorescence signal of secondary antibody for IgG, β-lactoglobulin, and allergen-specific IgEs toAra h 1 (peanut major allergen) and Phl p 1 (timothy grass major allergen) in human serum.
B dx.doi.org/10.1021/ac202212k |Anal. Chem. XXXX, XXX, 000–000
Analytical Chemistry ARTICLE
binding to the surface in order to visualize the printed slides priorto experimentation.14,15 Although these techniques verify thepresence of uniformly bound probe, they may negatively affectthe activity of the probe, fail to quantify the amount of boundprobe on surface, and alter physiochemical properties. Recently,an approach that utilizes a photonic crystal biosensor surface anda high resolution label-free imaging detection instrument toformulate prehybridization images of spotted nucleic acid arraywas recently reported as a sensitive method of quality control.16
Aside from being demonstrated only for DNA microarrays, thisquality control method merely bins the spot as being suitable orunsuitable for analysis and does not offer the quantified amountof bound probe relative to secondary antibody (i.e., fluorescence).Although a variety of techniques have attempted to advancequality assurance of microarray technologies, a need for quanti-tative assessment providing calibrated microarray measurementsstill remains.
To address these issues, we have integrated our label-freetechnology, the interferometric reflectance imaging sensor(IRIS), a quantitative, high-throughput, simple, robust, andversatile technology used for multiplexed detection of DNAand proteins with high sensitivity comparable to surface plasmonresonance (SPR),17�20 with a new enhanced fluorescence tech-nology to develop the calibrated fluorescence enhancement(CaFE) method.21 By combining the sensitivity of fluorescencewith the quantitative nature of IRIS, the CaFE method addressesmicroarray reproducibility issues by (1) quantifying the probeamount with IRIS, (2) measuring the enhanced fluorescencesignal generated by labeled secondary antibodies, and (3)calibrating the fluorescence signal utilizing the quantitativeassessment of the spots by IRIS. While this technique is broadlyapplicable to a variety of ligand-analyte based microarray plat-forms, it is particularly effective for allergy chips. Detection ofallergen-specific IgE molecules necessitates the use of second-ary antibodies to distinguish them from the large amount ofphysiologic allergen-specific IgG molecules that bind to theprobe but are not indicative of allergic sensitization. Theadditional quantification challenge imposed by the largevariability of immobilized probe density makes in vitro allergydiagnostics a perfect candidate for the demonstration of CaFEtechnology proof-of-concept.
A variety of layered structure designs could be used to achievefluorescence enhancement for DNA and protein microarrayapplications.22�26 In this paper, we choose to implement asimple oxide on Si structure due to its low-cost and well-established characteristics. Our primary design parameters in-clude wavelength range for fluorescence enhancement and label-free detection accuracy. We have designed two types of sampleplatforms for enhanced fluorescence and label-free proteinsensing. For design optimization we used the dipole emissionmodel27,28 to simulate fluorophore emitters near a dielectricinterface on a layered structure. Details of modeling for the label-free sensing by IRIS technology can be found in Daaboul et al.19
Platform-1 consists of two areas of SiO2, one optimized speci-fically for label-free and the other optimized for fluorescencesensing (500 nm for IRIS and 100 nm for enhanced fluores-cence19,21,29), and has been designed to enhance a broad emis-sion range of fluorophore wavelengths. Recently, this combinedchip was shown to be of high practical use during the assaydevelopment process. Label-free sensing was utilized to imagearrays prior to incubation with labeled antibodies to assessthe robustness of the array and to quantify the amount of
immobilized probes. Via this method, fluorescence measure-ments on the same chip yielded calibrated bioassay results in asingle experiment.21 However, this platform relies on uniformityand repeatability within a chip since label-free and fluorescencemeasurements are performed on two separate parts of the samechip. Platform-2 consists of a silicon chip with a single oxidethickness optimized for single spot enhancement of a particularfluorophore(s) and label-free analysis. In this new configuration,each spot is measured with both fluorescence and label-freemodalities, and hence calibrated, effectively accounting for spot-to-spot variation commonly reported in microarrays. For bothplatforms, regardless of having single or multiple regions, the toplayer is oxide and thus chemical surface preparation is identical.This feature allows the use of specialized polymeric coatings(copoly(DMA-NAS-MAPS)30,31 to covalently link captureagents to the surface, while maintaining high functionality andpreventing nonspecific binding. Therefore, the self-calibratedCaFE platform offers an opportunity for quantitative assessmentof allergy chips which uses labeled secondary antibodies to detectcaptured IgE by integrating both label-free and fluorescencemeasurements.
’MATERIALS AND METHODS
Platform Design Simulations. Structure optimization is de-fined as the oxide thickness on Si that yields intensity enhance-ment across fluorescence emission wavelengths of interest andperforms label-free sensing with high accuracy. These simulationsaddress two goals regarding oxide thickness design and optimiza-tion: (1) platform-1 (called CaFE chip) should yield emissionenhancement for maximum coverage of wavelengths while per-forming label-free sensing on a separate spot on the same chip and(2) platform-2 maintains emission enhancement for a limitedwavelength range (covering 1 or 2 fluorophores) while allowingfor accurate calibration of the same spot using IRIS. Platformdesign forCy3 andCy5 emission enhancementwas chosen due totheir extensive use in microarrays to study the ratio of expressionof genes from two sources.32�36
To investigate the effect of oxide thickness on fluorescenceintensity, the dipole emission model27,28 was used to simulatefluorophore emitters near a dielectric interface on a layeredSiO2/Si structure. Simulations were carried out for oxide thick-nesses ranging from 1 to 1000 nm over the entire visible wave-length range to select the optimized oxide thickness for each ofthe two platforms described above. In Figure 1a, we plot thewavelength dependence of fluorescence intensity for two specificoxide thicknesses in comparison to a glass substrate along withtypical spectra of fluorophores that are commonly used as labelsin bioassays (Alexa Fluor 359, Alexa Fluor 488, Cy3 dye, Cy5 dye,and Alexa Fluor 647). The initial optimization is performedassuming a collection angle of 0.7. For a practical fluorescencecollection system, the numerical aperture (NA) is large (typicalvalues around 0.5�0.7) (Herman, B., Fluorescence Microscopy,Second Edition, BIOS Scientific Publishers (1998)) and hencethe theoretical enhancement calculations should consider thedependence on NA. In Figure 1b, the NA dependence ofemission enhancement of Cy3 is plotted and the two optimizeddesigns are compared at typical NA values.The CaFE verification of fluorescence measurement is de-
scribed in the Supporting Information, and details on label-freedetection using IRIS have been described.19 As previouslyreported, 500 nm oxide on Si is optimal for IRIS sensing because

C dx.doi.org/10.1021/ac202212k |Anal. Chem. XXXX, XXX, 000–000
Analytical Chemistry ARTICLE
the spectra of three of the LEDs (455, 525, and 632 nm) samplethe linear region of the curve while the yellow LED (598 nm)helps determine the amplitude of the curve over one period.Because the linear region falls on the inflection point of the curve,any small change in height, or biomass accumulation, will bedetected. To check for label-free sensing capability for theoxide thickness chosen for emission enhancement of Cy3/Cy5fluorophores (goal-2), we generated an additional reflectivitycurve at this oxide thickness as a function of illuminationwavelengths and compared it to the curve produced from500 nm oxide (Figure 1c).Finally, to verify the results of the simulations with experi-
mental data, platform-1 (CaFE) chips and platform-2 (320 nm)chips were fabricated as seen in Cretich et al.21 An experimentdescribed in IgG Calibration was performed on each platform tovalidate the accuracy of label-free detection and enhancement offluorescence (Figure 1d).Reagents and Equipment. TRIS, BSA, Tween 20, PBS
tablets, rabbit immunoglobulin G, carbonic anhydrase, andbovine serum albumin were purchased from Sigma (St. Louis,MO). Rabbit anti-β-lactoglobulin was purchased from BethylLaboratories (Montgomery, TX), goat anti-α-lactalbumin fromGeneTex Inc. (Irvine, CA), and AbCam (Cambridge, U.K.).
Secondary antibodies (Cy3-labeled goat antimouse IgG andmouse antigoat IgG) were purchased from Jackson ImmunoR-esearch (West Grove, PA), and anti-IgE was purchased fromBDBioscences. Allergens Bet v 1a (Bet v 1.0101), Phl p 1 (Phlp1.0101), Phl p 5 (Phl p 5.0101), and Alt a 1 (Alt a 1.0101) wererecombinant allergens from Biomay, (Vienna, Austria) andallergens Bet v 2 (Bet v 2.0101), Phl p 7, nDer p 1, nDer p 2,and nFel d 1 were recombinant (or native, when prefix“n” is used) allergens from Indoor Biotechnologies Ltd.(Warminster, U.K.).Si/SiO2 Coating by Copoly(DMA-NAS-MAPS). Si/SiO2
slides were immersed for 30 min in a solution of copoly(DMA-NAS-MAPS) at 1% w/v concentration in a solution of deionizedwater and 20% saturated ammonium sulfate. Slides were washedwith water and dried at 80 �C for 15 min. This polymeric coatingwas chosen for our CaFE chips due the feasibility and repro-ducibility of its synthesis and coating process. This particularpolymeric coating does not change the optical properties ofthe setup.Proof of Concept of CaFE Using IgG and β-lactoglobulin.
To demonstrate the universal application of the CaFE meth-od, we have performed the quantification and correlation ofcaptured IgG and β-lactoglobulin probe to fluorescence signal
Figure 1. (a) Simulations model the theoretical fluorescence of 100 nm oxide, 320 nm oxide, and glass at normal incidence as a function of emissionwavelengths. From left to right, the emission spectra of commonly used fluorophores (Alexa Fluor 359, Alexa Fluor 488, Cy3 dye, Cy5 dye, and AlexaFluor 647). (b) Fluorescence emission enhancement of Cy3 for 100 and 320 nmoxide is 2-fold compared to glass at NA= 0.7. (c)Normalized reflectivitycurves for 500 nm oxide and 320 nm oxide are fitted to illumination wavelengths used in IRIS. (d) The CaFE method is performed and compared forboth chip platforms.
D dx.doi.org/10.1021/ac202212k |Anal. Chem. XXXX, XXX, 000–000
Analytical Chemistry ARTICLE
of Cy3-labeled-secondary antibody. For these experiments, weutilize the CaFE chip platform to optimize for all fluorophoresand achieve maximum sensitivity on the IRIS device. IgG andβ-lactoglobulin proteins were chosen due to their well-establishedspotting protocols and reliable spotting morphologies.IgG Calibration. As proof of concept, 20 replicates IgG of
varying concentrations (0.015, 0.03, 0.063, 0.125, 0.25, and 1mg/mL) were spotted onto 2 CaFE chips. After overnight humidchamber incubation, the chips were washed with 50 mM etha-nolamine in TRIS/HCl 1MpH 9 for 1 h, rinsed with water, driedwith a stream of argon gas, and then measured using IRIS. Theywere then incubated with 100 μL of specific labeled antibody inincubation buffer (Tris/HCl 0.05 M pH 7.6, NaCl 0.15 M,Tween 20 0.02%) with 1% w/v BSA for 1 h at 1 μg/mL. AnotherIRIS measurement was taken after washing with PBS for 10 min,rinsing with water, and drying with argon.Fluorescence evaluation was performed by a fluorescence
scanner using 40% PMT and 33% laser power for maximalfluorescence value without saturation. Mean fluorescence inten-sity and standard error from all 20 spots is depicted.β-Lactoglobulin Calibration. To model a sandwich assay
similar to the allergen immunoassay and to demonstrate theversatility of the CaFE method, 20 replicates of β-lactoglobulinof varying concentrations (0.015, 0.03, 0.063, 0.125, 0.25, and1 mg/mL) were spotted onto three CaFE chips, and afterovernight humid chamber incubation, the CaFE chips werewashed with 50 mM ethanolamine in TRIS/HCl 1 M pH 9 for1 h, washed with water, dried with a stream of argon gas, and thenmeasured using IRIS. The chips were then incubated with 100 μLof specific antibody in incubation buffer with 1%w/v BSA, for 2 hat 10 ng/mL. Slides were then washed with washing buffer(Tris/HCl 0.05 M pH 9, NaCl 0.25 M, Tween20 0.05%) for10 min, rinsed with water, and dried with argon gas. The chipswere then incubated with 100 μL of the solution of the specificlabeled secondary antibody 1 μg/mL in incubation buffer for 1 h.Slides were then washed with PBS for 10 min, rinsed with water,dried with argon, and measured with IRIS.Fluorescence evaluation was performed using 90% PMT and
90% laser power for maximal fluorescence value just belowsaturation. Mean fluorescence intensity and standard error wereplotted for the 20 replicate spots.CaFE Implemented as an Allergy Testing Platform. To
evaluate CaFE as a clinical diagnostic platform, two majorallergens (peanut (Ara h1) amd timothy grass (Phl p1) werespotted in replicates of three at four concentrations (0.25, 0.5,0.75, and 1.0 mg/mL) on two CaFE chips. In addition, PBS andIgG were spotted as negative and positive control parameters.After overnight humid chamber incubation, the chips werewashed with 50 mM ethanolamine in TRIS/HCl 1 M pH 9 for1 h, washed with water, dried with a stream of argon gas, and thenmeasured using IRIS. The chips were then incubated with 100 μLof patient serum with documented allergy to peanut (specific IgE19.40 kU/L, Phadia ImmunoCAP) and timothy grass (positiveallergen skin prick test) in incubation buffer with 1%w/v BSA for2 h at 10 μg/mL. (Subject recruitment was approved by theBoston University Medical Campus Institutional Review Board,Protocol H-29428.) Slides were then washed with washing bufferfor 10 min, rinsed with water, and dried with argon gas. Afterincubating with 1 ng/mL anti-IgE labeled with Cy3, the chipswere washed with PBS (10 min), rinsed with water, dried withargon, and measured with IRIS.
Scanning for fluorescence evaluation was performed. CaFEslides were analyzed using 90%PMT and laser power tomaximizethe signal-to-noise ratio without pixel saturation. Mean fluores-cence intensity is depicted.
’RESULTS AND DISCUSSION
Platform Design Simulations. After running the radiationmodel of emitters near a dielectric interface, a 100 nm oxidethickness yielded emission enhancement for maximum coverageof wavelengths and a 320 nm oxide thickness yielded enhance-ment for emission wavelengths of Cy3 and Cy5 fluorophores(Figure 1a). This enhancement effect is a result from theinterference of the emission wavelength reflected at the oxide-silicon interface and the air-oxide interface. The oxide thicknessserves as a spacer in which emitted light is reflected at the air-oxide interface and refracted through the oxide layer. Therefracted light travels through the spacer layer and is thenreflected by the silicon layer. Depending on the wavelength ofthe emitted light, the thickness of the spacer will determine whichwavelengths undergo constructive or destructive interference.Using this method, we designed two layered structures: (1) a100 nm SiO2 layer on Si that yields enhancement for maximumcoverage of wavelengths and (2) a 320 nm SiO2 layer on Sithat maintains fluorescence enhancement for Cy3 and Cy5fluorophores.In Figure 1b, the NA dependence of emission enhancement of
Cy3 is graphed and the two optimized designs are compared. Atlow NA, a 100 nm oxide thickness yields a greater enhancementeffect compared to a 320 nm oxide layer. As the collection angleincreases, the enhancement effect decreases because higherangles do not undergo complete constructive interference dueto the increase in optical path length through the spacer region.The enhancement values converge as a greater percentage of thereflected emission is collected. When comparing the platforms atthe typical NA used in fluorescence scanners (NA = 0.7), bothplatforms yield a 2-fold emission enhancement of Cy3. Further-more, the enhancement produced by 100 nm SiO2 is only 1.04times greater than the enhancement yielded by 320 nm SiO2. Onthe basis of these results, designing a chip with 100 nm oxide onSi would enhance all wavelengths of commonly used fluoro-phores and constructing a chip with 320 nm oxide on Si wouldmaintain enhancement for Cy3 and Cy5 fluorophores.In Figure1c, normalized reflectivity curves as a function of
illumination wavelength are generated for both platforms andcompared. Because the rate of change with wavelength is slightlyslower in the 320 nm oxide compared to the 500 nm oxide, theillumination wavelengths intersect the curves at slightly differentlocations. As a result, the spectra of the LEDs now sample the320 nm reflectivity curve close to the minima and maximaregions. Although none of the LEDs fall directly on the inflectionpoint of the graph, the green and yellow LED sample above andbelow the linear region, helping to define the slope of the curveand determine the reflectivity profile of a 320 nm oxide on Si.These reflectivity comparisons suggest that IRIS measurementson a 320 nm oxide are feasible; however, a reduction in level ofdetection and sensitivity may occur.Fluorescence simulations and IRIS reflectivity curves facili-
tated the design of two platforms: (1) a CaFE chip with one areaof 100 nm oxide on Si for fluorescence enhancement coverageover all visible wavelengths and an area of 500 nm for sensitivelabel-free biosensing and (2) a 320 nm oxide on Si chip that
E dx.doi.org/10.1021/ac202212k |Anal. Chem. XXXX, XXX, 000–000
Analytical Chemistry ARTICLE
maintains fluorescence enhancement of Cy3 and Cy5 fluoro-phores and operates with IRIS. These designs were tested andcompared by conducting the IgG calibration experiments oneach platform (Figure1d). As expected, the CaFE chip yields ahigher fluorescence signal and slightly better sensitivity com-pared to the 320 nm oxide chip. Standard deviation is also higheron the 320 nm oxide chip, and the measurement was not able todetect the lowest spotting concentration (0.015mg/mL). On thebasis of this data, the radiation model of emitters and IRISreflectivity curves helped design two dual modality platforms thatoptimize for enhanced fluorescence of one or more wavelengthsand quantify biomass accumulation, label-free.Proof of Concept of Quantification and Calibration of
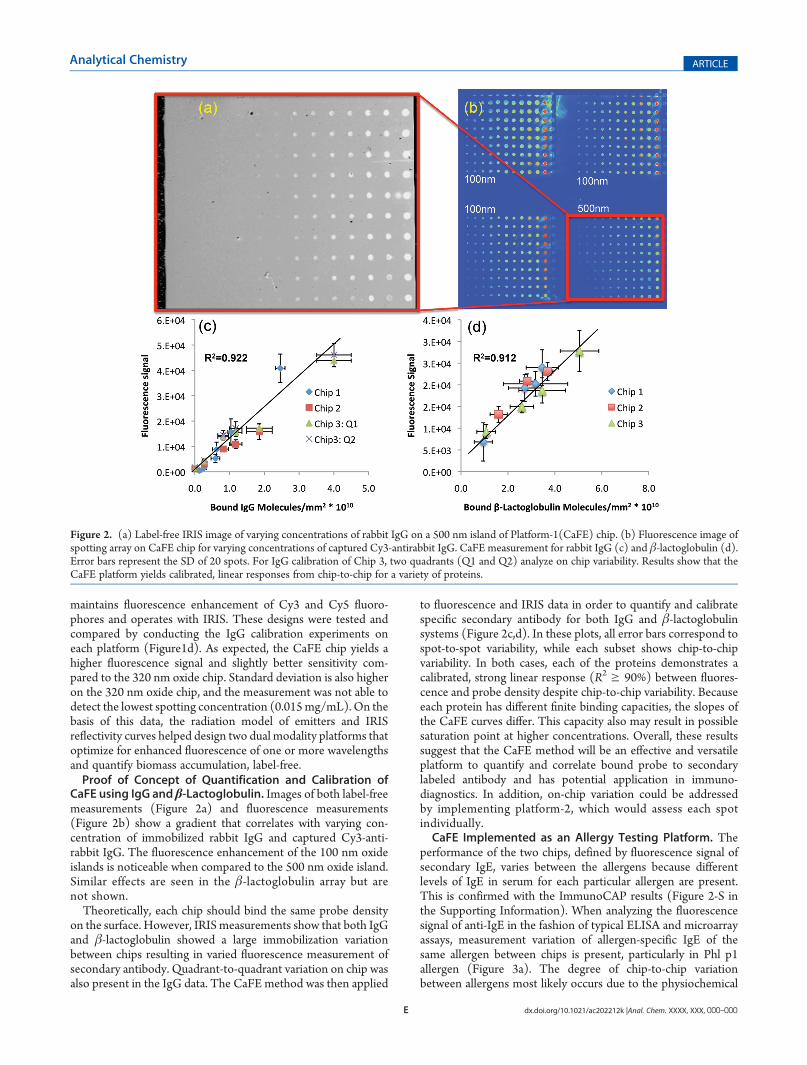
CaFE using IgG and β-Lactoglobulin. Images of both label-freemeasurements (Figure 2a) and fluorescence measurements(Figure 2b) show a gradient that correlates with varying con-centration of immobilized rabbit IgG and captured Cy3-anti-rabbit IgG. The fluorescence enhancement of the 100 nm oxideislands is noticeable when compared to the 500 nm oxide island.Similar effects are seen in the β-lactoglobulin array but arenot shown.Theoretically, each chip should bind the same probe density
on the surface. However, IRISmeasurements show that both IgGand β-lactoglobulin showed a large immobilization variationbetween chips resulting in varied fluorescence measurement ofsecondary antibody. Quadrant-to-quadrant variation on chip wasalso present in the IgG data. The CaFE method was then applied
to fluorescence and IRIS data in order to quantify and calibratespecific secondary antibody for both IgG and β-lactoglobulinsystems (Figure 2c,d). In these plots, all error bars correspond tospot-to-spot variability, while each subset shows chip-to-chipvariability. In both cases, each of the proteins demonstrates acalibrated, strong linear response (R2 g 90%) between fluores-cence and probe density despite chip-to-chip variability. Becauseeach protein has different finite binding capacities, the slopes ofthe CaFE curves differ. This capacity also may result in possiblesaturation point at higher concentrations. Overall, these resultssuggest that the CaFE method will be an effective and versatileplatform to quantify and correlate bound probe to secondarylabeled antibody and has potential application in immuno-diagnostics. In addition, on-chip variation could be addressedby implementing platform-2, which would assess each spotindividually.CaFE Implemented as an Allergy Testing Platform. The
performance of the two chips, defined by fluorescence signal ofsecondary IgE, varies between the allergens because differentlevels of IgE in serum for each particular allergen are present.This is confirmed with the ImmunoCAP results (Figure 2-S inthe Supporting Information). When analyzing the fluorescencesignal of anti-IgE in the fashion of typical ELISA and microarrayassays, measurement variation of allergen-specific IgE of thesame allergen between chips is present, particularly in Phl p1allergen (Figure 3a). The degree of chip-to-chip variationbetween allergens most likely occurs due to the physiochemical
Figure 2. (a) Label-free IRIS image of varying concentrations of rabbit IgG on a 500 nm island of Platform-1(CaFE) chip. (b) Fluorescence image ofspotting array on CaFE chip for varying concentrations of captured Cy3-antirabbit IgG. CaFE measurement for rabbit IgG (c) and β-lactoglobulin (d).Error bars represent the SD of 20 spots. For IgG calibration of Chip 3, two quadrants (Q1 and Q2) analyze on chip variability. Results show that theCaFE platform yields calibrated, linear responses from chip-to-chip for a variety of proteins.

F dx.doi.org/10.1021/ac202212k |Anal. Chem. XXXX, XXX, 000–000
Analytical Chemistry ARTICLE
properties of the allergens themselves (i.e., affinity to immobilizeto the surface) and technical variation (i.e., spotting). While onlyslight chip-to-chip fluorescence variation is seen for Ara h1 allergen(R2 of 0.88), a significant chip-to-chip fluorescence variation is seenfor Phl p1 allergen (R2 of 0.24), despite the same conditions,reagents, and serum samples used in this single experiment. On thebasis of the fluorescence data alone, it is unknown as to why Phl p1allergen chips yield different fluorescence responses.To account for this deviation, the CaFE method is applied to
collected fluorescence and IRIS data. As a result, a calibrated,linear response between allergen-specific IgE and amount ofallergen immobilized on surface emerges (Figure 3b). In bothAra h1 and Phl p1 examples, the R2 value increases to at least90%, demonstrating the higher degree of correlation betweenfluorescence signal and immobilization density compared tospotting concentration. Although the CaFE method only slightlyimproves upon Ara h1 allergen data, the effects of including label-free IRIS measurement are dramatically seen in the Phl p1 data.Most importantly, use of the CaFE method clarifies that higherimmobilization density of Phl p1 allergen on chip 2 results inhigher fluorescence signal, indicating that any variation inimmobilization density will affect the amount of IgE captured.In accordance with the literature, this data supports that highvariation in allergen immobilization microarrays is a concerningissue. The strong linear correlation between fluorescence andimmobilization density demonstrates the value of the CaFEmethod as an opportunity for calibrated quantitative assessmentof serum allergen-specific IgE and should improve accuracy inpredicting clinical reactivity in susceptible individuals.
Finally, in order to verify that the CaFE method differentiatesbetween allergic and nonallergic samples, five allergens werearrayed in replicates of three onto a CaFE chip. This chip wasincubated with characterized serum in which there was selectiveallergen-specific IgE. Results were compared to ImmunoCAPor skin test characterization (Figure 2-S in the SupportingInformation).
’CONCLUSIONS
We have designed two platforms: (1) a chip with multiplesections to optimize label-free measurement and fluorescenceover a broad range of wavelengths and (2) a silicon chip that hasbeen engineered specifically for the enhancement of a particularfluorophore and is operational in the label-free modality andallows for calibration of the same spot, to create a calibratedfluorescence enhancement, or CaFE, method that improvesupon quality and quantity control in microarrays. In our experi-ments, we utilize one of the two platforms, the CaFE chip, todemonstrate that the correlation between the fluorescence signaland immobilized probe density is linear despite chip-to-chipvariance.We also show that these experiments are repeatable on asingle oxide thickness platform. Without the ability to quantifythe amount of capture probes (major allergens), the typical assayquality control would be limited to controlling the spottingconditions, i.e., the intended concentration of the probes. Thus,the CaFE method is an effective, self-calibrated, multiplexed, andsensitive platform and offers technological advances that are notcurrently or readily available.
Figure 3. (a) The standard “calibration” of secondary antibody for diagnosis of allergy is measured as the degree of fluorescence as a function of spottingconcentration is shown for Ara h 1 peanut allergen (left) and Phl p1 timothy grass allergen (right) for two chips. Using the self-calibration methodprovided by CaFE (b), results show calibrated, linear responses for allergy testing analysis compared to traditional “semi-quantifiable” analysis in part a.
G dx.doi.org/10.1021/ac202212k |Anal. Chem. XXXX, XXX, 000–000
Analytical Chemistry ARTICLE
Additional applications of this technology are by no meanslimited to the described model of allergy diagnosis; this platformcould be effectively applied where readout from a labeledsecondary antibody must be calibrated against quantity ofimmobilized capture probe for accurate diagnosis.
’ASSOCIATED CONTENT
bS Supporting Information. Additional information asnoted in text. This material is available free of charge via theInternet at http://pubs.acs.org.
’AUTHOR INFORMATION
Corresponding Author*Phone: 617-353-9046. E-mail: [email protected].
’ACKNOWLEDGMENT
We thankCarlos A. Lopez andGeorgeDaaboul for intellectualdiscussion. We would also like to thank the reviewers and editorsfor their helpful suggestions. Financial support was from theWallace H. Coulter Foundation 2010 Coulter TranslationalAward and by the SmartLighting ERC funded via the NSF underCooperative Agreement EEC-0812056.
’REFERENCES
(1) Airborne Allergens: Something in the Air, U.S. Department ofHealth and Human Services, Ed. 2003, National Institutes of Health andInfectious Diseases.(2) National Health Interview Survey, National Center for Health
Statistics, Editor 2005, CDC.(3) Shreffler,W. G. J. Allergy Clin. Immunol. 2011, 127 (4), 843–849.(4) Chiari, M.; et al. Anal. Chem. 2009, 81 (13), 5197–5203.(5) Balboni, I.; et al. Proteomics 2008, 8 (17), 3443–3449.(6) Lin, J.; Bardina, L.; Shreffler, W. G. Methods Mol. Biol. 2009,
524, 259–272.(7) Wang, X. J., et al. Comprehensive quality control utilizing the
prehybridization third-dye image leads to accurate gene expressionmeasurements by cDNA microarrays. BMC Bioinf. 2006, 7, 378�388.(8) Shi, L. M., et al. The balance of reproducibility, sensitivity, and
specificity of lists of differentially expressed genes in microarray studies.BMC Bioinf. 2008, 9 (Suppl 9): S10.(9) Shi, L. M.; et al. Curr. Opin. Biotechnol. 2008, 19 (1), 10–18.(10) Foy, C. A.; Wilkes, T.; Laux, H. OMICS: J. Integr. Biol. 2007, 11
(1), 1–13.(11) Kricka, L. J.; Master, S. R. Clin. Chem. 2009, 55 (6), 1053–1055.(12) Emmert-Buck, M. R.; et al. Nat. Genet. 2002, 32, 509–514.(13) Klee, G. G.; et al. Clin. Chem. 2009, 55 (6), 1092–1099.(14) Schabacker, D. S.; et al. Anal. Biochem. 2006, 359 (1), 84–93.(15) Hessner, M. J., et al. , Utilization of a labeled tracking
oligonucleotide for visualization and quality control of spotted 70-merarrays. BMC Genomics, 2004, 5, 12.(16) Cunningham, B. T.; et al. Anal. Chem. 2010, 82 (20), 8551–8557.(17) Ozkumur, I. E., et al. , Label-free and High-throughput
Screening of Biomolecular Interactions. Lasers and Electro-Optics &Quantum Electronics and Laser Science Conference, Vols 1�9, 2008;pp 58�59.(18) Ozkumur, E.; et al. IEEE J. Sel. Top. Quantum Electron. 2010,
16 (3), 635–646.(19) Daaboul,G.G.; et al. Biosens. Bioelectron.2011, 26 (5), 2221–2227.(20) Lopez, C. A.; et al. Biosens. Bioelectron. 2011, 26 (8), 3432–3437.(21) Cretich,M.; et al. Biosens. Bioelectron. 2011, 26 (9), 3938–3943.(22) Moal, E., et al. , Mirror slides for high-sensitivity cell and tissue
fluorescence imaging. J. Biomed. Opt. 2007, 12 (2), 024030.
(23) Akimoto, T.; Yasuda, M. Appl. Opt. 2010, 49 (1), 80–85.(24) Sullivan, K.; Hall, D. G. J. Opt. Soc. Am. B 1997, 14 (5),
1149–1159.(25) Rajendra, R.; et al. J. Biomol. Tech. 2006, 17, 122–130.(26) Choumane, H., et al. Double interference fluorescence
enhancement from reflective slides: Application to bicolor microarrays.Appl. Phys. Lett. 2005, 87 (3), 031102.
(27) Hellen, E. H.; Axelrod, D. J. Opt. Soc. Am. B 1987, 4 (3),337–350.
(28) Moiseev, L.; et al. J. Appl. Phys. 2004, 96 (9), 5311–5315.(29) Yalcin, A., et al. Fluorescence Enhancement on Reflecting
Substrates for Microarray Applications. In IEEE Leos Annual MeetingConference Proceedings, Vols 1 and 2, 2009; pp 465�466.
(30) Ozkumur, E.; et al. Biosens. Bioelectron. 2009, 25 (1), 167–172.(31) Yalcin, A.; et al. Anal. Chem. 2009, 81 (2), 625–630.(32) Brownstein, M. J.; et al. Nat. Biotechnol. 2002, 20 (7), 738–742.(33) Muckenthaler, M.; et al. Biotechniques 2002, 33 (3), 620–630.(34) Swaroop, A.; et al. Mol. Vision 2002, 8 (17), 130–137.(35) Tang, T.; et al. Bioinformatics 2007, 23 (20), 2686.(36) ’t Hoen, P. A. C., et al. , Fluorescent labelling of cRNA for
microarray applications. Nucleic Acids Res., 2003. 31(5), e20.


![New Method to Quantitate Clonogenic Tumor Cells in the ......[CANCER RESEARCH 43, 5451-5455, November 1983] New Method to Quantitate Clonogenic Tumor Cells in the Blood Circulation](https://static.fdocuments.us/doc/165x107/6068d20ce566193e3e18220a/new-method-to-quantitate-clonogenic-tumor-cells-in-the-cancer-research.jpg)