Multiple Regressions
20
Multiple regressions ใใใใใใใใใใใใ http://instruction.bus.wisc.edu/jfrees/jfreesbooks/Regression % 20 Modeling/BookWebDec 2010/ data.html ใใใใใใใใใ Table 21. Term Life Insurance Like all firms, life insurance companies continually seek new ways to deliver products to the market. Those involved in product development wish to know “who buys insurance and how much do they buy?” Analysts can readily get information on characteristics of current customers through company databases. Potential customers, those that do not have insurance with the company, are often the main focus for expanding market share. we examine the Survey of Consumer Finances (SCF), a nationally representative sample that contains extensive information on assets, liabilities, in- come, and demographic characteristics of those sampled (potential U.S. customers). We study a random sample of 500 households with positive incomes that were in- terviewed in the 2004 survey. For term life insurance, the quantity of insurance is measured by the policy FACE, the amount that the company will pay in the event of the death of the named insured. Characteristics that will turn out to be important include annual INCOME, the number of years
description
Multiple Regressions
Transcript of Multiple Regressions

Multiple regressions
ใชข้อ้มูลจาก http://instruction.bus.wisc.edu/jfrees/jfreesbooks/Regression% 20 Modeling/
BookWebDec 2010/ data.html
คำาอธบิาย
Table 21. Term Life Insurance
Like all firms, life insurance companies continually seek new ways to deliver products to
the market. Those involved in product development wish to know “who buys insurance
and how much do they buy?” Analysts can readily get information on characteristics of
current customers through company databases. Potential customers, those that do not
have insurance with the company, are often the main focus for expanding market share.
we examine the Survey of Consumer Finances (SCF), a nationally representative sample
that contains extensive information on assets, liabilities, in- come, and demographic
characteristics of those sampled (potential U.S. customers). We study a random sample of
500 households with positive incomes that were in- terviewed in the 2004 survey.
For term life insurance, the quantity of insurance is measured by the policy FACE, the
amount that the company will pay in the event of the death of the named insured. Characteristics
that will turn out to be important include annual INCOME, the number of years
of EDUCATION of the survey respondent and the number of household members, NUMHH

เราจะดวูา่ปัจจยัใดมผีลต่อตัวแปร FACE โดยในกรณีแรกจะเลือกตัวแปรท่ีคิดวา่น่าจะมีผลคือ GENDER, AGE, EDUCATION, NUMHH, INCOME
1. พจิารณา FACE เป็นการแจกแจงปกติหรอืไม่

จะเหน็วา่ขอ้มูลไมม่กีารแจกแจงปกติจงึทำาการทำาการเปล่ียนขอ้มูลเป็น LN(FACE) (log
ฐาน e)

Tests of Normality
Kolmogorov-Smirnova Shapiro-Wilk
Statistic df Sig. Statistic df Sig.
LnFace .044 275 .200* .992 275 .115
a. Lilliefors Significance Correction
*. This is a lower bound of the true significance.
2. พจิารณาวา่ตัวแปรอิสระมคีวามสมัพนัธเ์ชงิเสน้กับ LnFace หรอืไม่

จะต้องเปล่ียน Income เป็น LnIncome

Scatter plot ระหวา่งตัวแปรอิสระและตัวแปรตาม
3. ตรวจสอบ Correlation
4. หาสมการท่ีเหมาะสม โดยใช ้Stepwise เป็นวธิท่ีีพฒันามาจาก Forward คือตัวแปรอิสระจะถกูคัดเลือกเขา้ไปและสามารถถกูคัดออกได้ถ้าพบวา่มคีวามสมัพนัธก์ับตัวแปรอิสระอ่ืนๆ
ANOVAe
Model Sum of Squares Df Mean Square F Sig.
1 Regression 222.629 1 222.629 82.549 .000a
Residual 736.267 273 2.697
Total 958.896 274
2 Regression 274.131 2 137.066 54.445 .000b
Residual 684.765 272 2.518
Total 958.896 274
3 Regression 328.467 3 109.489 47.066 .000c
Residual 630.429 271 2.326
Total 958.896 274
4 Regression 345.432 4 86.358 38.008 .000d
Residual 613.465 270 2.272
Total 958.896 274
a. Predictors: (Constant), LnIncome
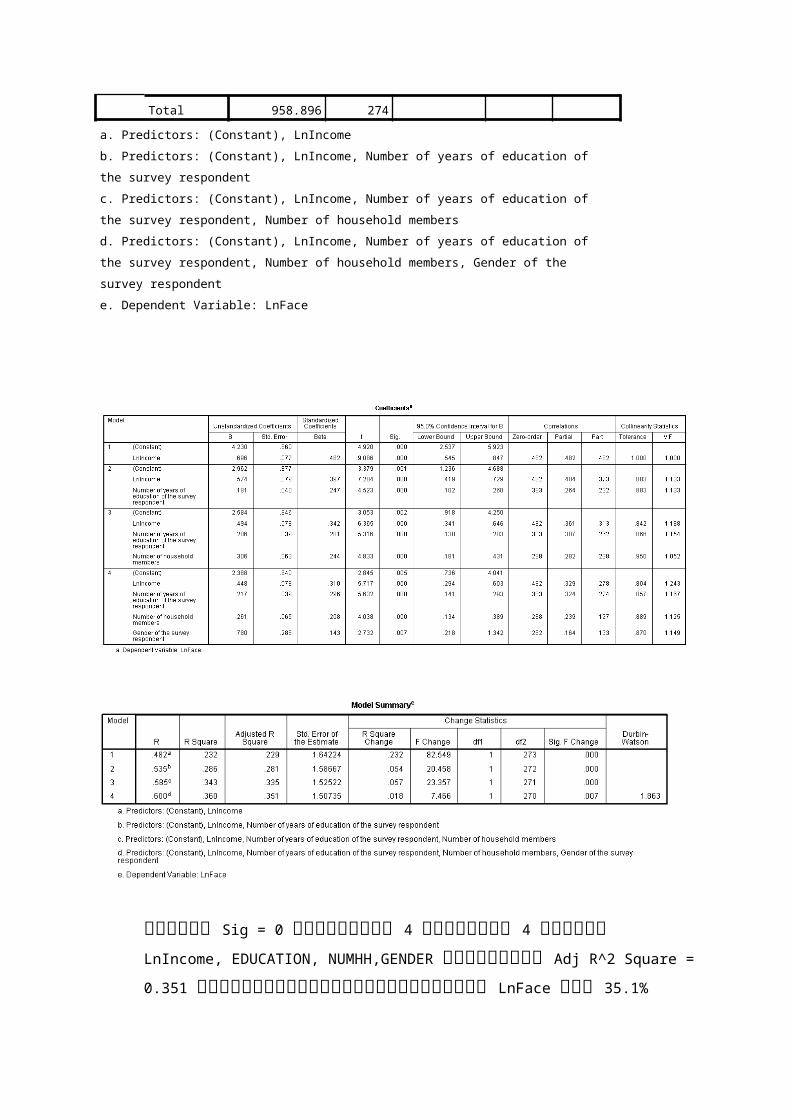
b. Predictors: (Constant), LnIncome, Number of years of education of the survey respondent
c. Predictors: (Constant), LnIncome, Number of years of education of the survey respondent,
Number of household members
d. Predictors: (Constant), LnIncome, Number of years of education of the survey respondent,
Number of household members, Gender of the survey respondent
e. Dependent Variable: LnFace
จากค่า Sig = 0 ตัวแบบที่ 4 มตัีวแปร 4 ตัวคือ LnIncome, EDUCATION, NUMHH,GENDER
ซึ่งมคี่า Adj R^2 Square = 0.351 ตัวแปรอสระทัง้สีตั่วอธบิาย LnFace ได้ 35.1%
จะได้สมการถดถอยคือ LnFace=2.388+0.448∗LnIncome+0.217∗EDUCATION+0.261∗NUMHH+0.780∗¿NDER
5. ได้ค่าสหสมัพนัธบ์างสว่นของตัวแปรตาม กับตัวแปรต้นตัวใดตัวหนึ่งเมื่อควบคมุตัวแปรอิสระอ่ืนๆ ได้ผลคือLnIncome มคี่าสมัประสทิธิส์หสมัพนัธบ์างสว่นเท่ากับ 0.329
EDUCATION มคี่าสมัประสทิธิส์หสมัพนัธบ์างสว่นเท่ากับ 0.324
NUMHH มคี่าสมัประสทิธิส์หสมัพนัธบ์างสว่นเท่ากับ 0.288
GENDER มคี่าสมัประสทิธิส์หสมัพนัธบ์างสว่นเท่ากับ 0.262
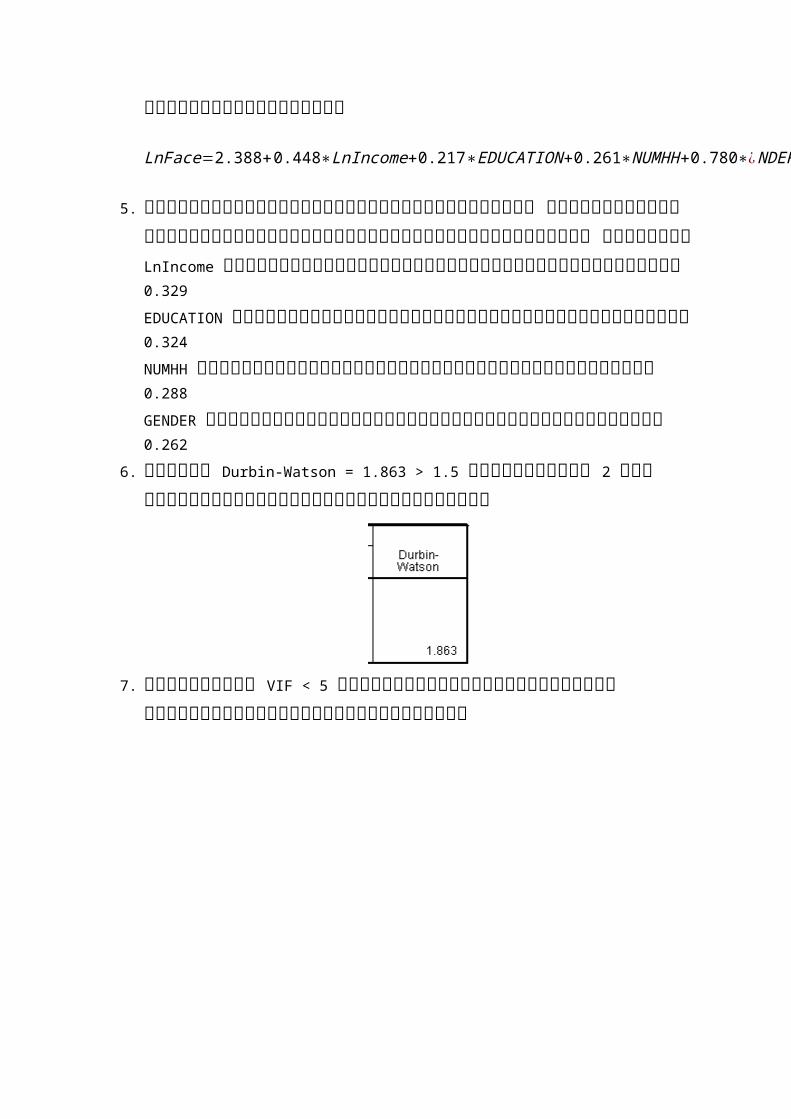
6. ได้ค่า Durbin-Watson = 1.863 > 1.5 และเขา้ใกล้ 2 ดังนัน้ความคลาดเคล่ือนเป็นอิสระกัน
7. พจิารณาค่า VIF < 5 ตัวแปรอิสระแต่ละตัวมคีวามสมัพนัธก์ับตัวแปรตัวอ่ืนๆน้อย

8. ตรวจสอบวา่ค่าคลาดเคล่ือนเป็นการแจกแจงปกติและความแปรปรวนคงที่
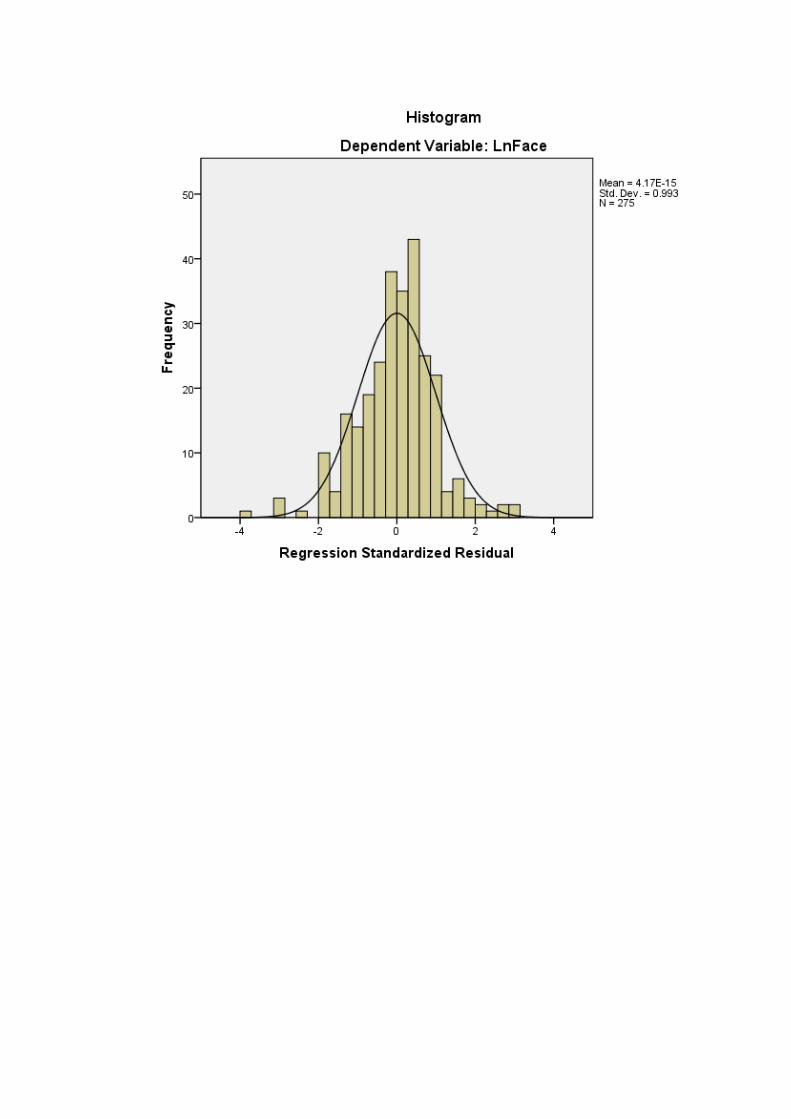
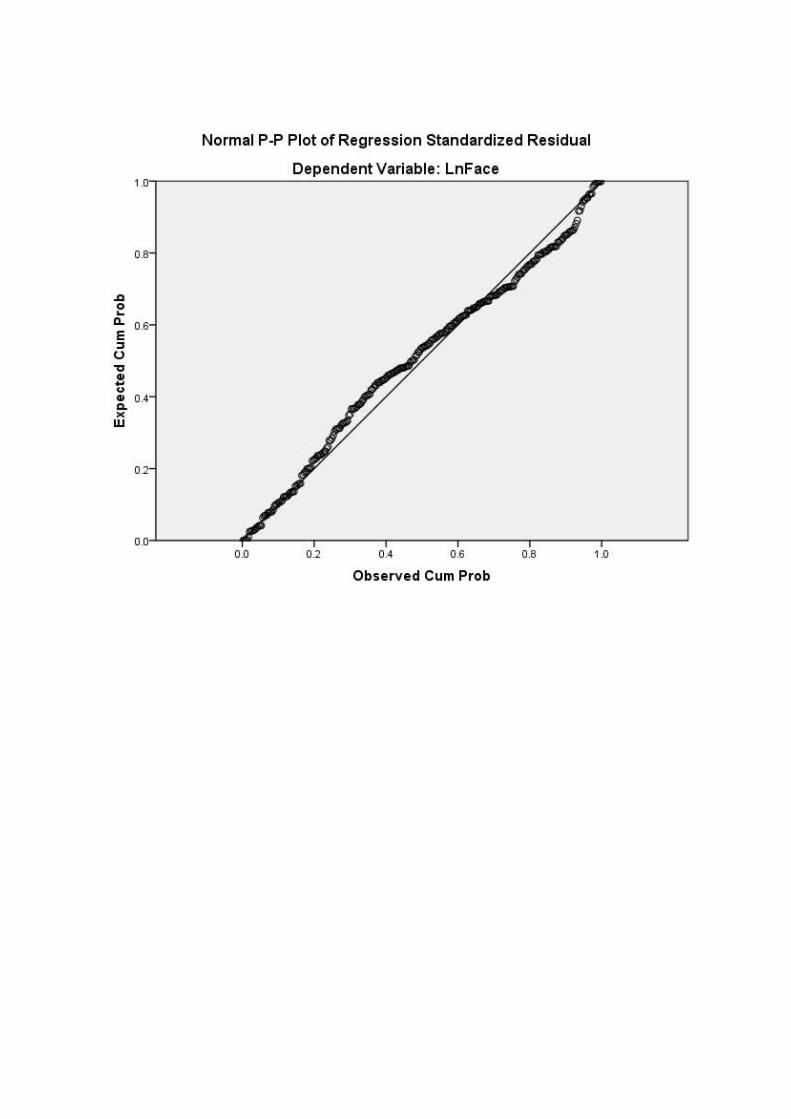

สรุปๆได้วา่ ค่าคาดเคล่ือนมกีารแจกแจงเขา้ใกล้ปกติ และจาก Scatterplot พบวา่การกระจายไมม่รีูปแบบแสดงวา่ความแปรปรวนของค่าเคล่ือนมคี่าคงท่ี

ขอ้มูล Expense
Table 15. Insurance Company ExpensesLike every other business, insurance companies seek to minimize expenses associated with doing business in order to enhance profitability. To study expenses, we examine a random sample of 500 insurance companies from the National Association of Insurance Commissioners (NAIC) database of over 3,000 companies. The NAIC maintains one of the world’s largest insurance regulatory databases; we consider here data that is based on 2005 annual reports for all the property and casualty insurance companies in United States. The annual reports are financial statements that use statutory accounting principles.
ตัดขอ้มูลท่ีเป็น missing

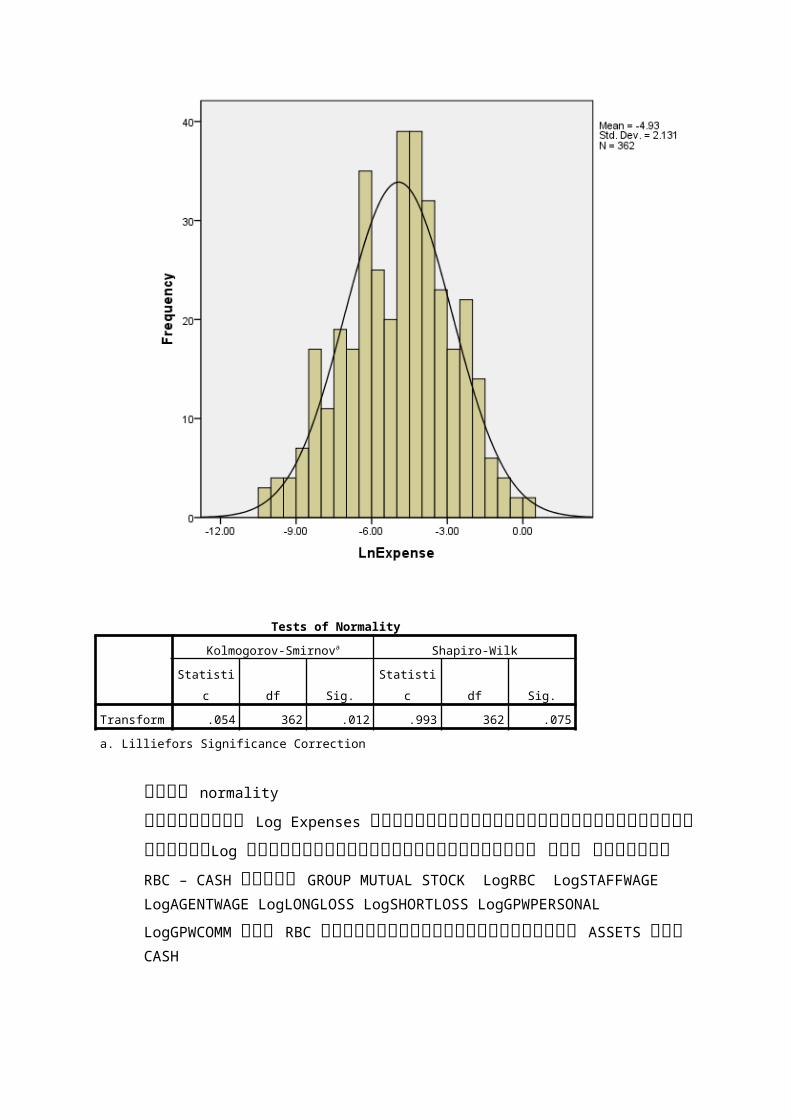
Tests of Normality
Kolmogorov-Smirnova Shapiro-Wilk
Statistic df Sig. Statistic df Sig.
Transform .054 362 .012 .993 362 .075
a. Lilliefors Significance Correction
เป็น normality
ใชข้อ้มูล Log Expenses แล้วทำากระบวนการตามท่ีกล่าวมา โดยใส่Log ใหข้อ้มูลที่เป็นจำานวนเงิน คือ ตัง้แต่ RBC – CASH เลือก GROUP MUTUAL STOCK LogRBC
LogSTAFFWAGE LogAGENTWAGE LogLONGLOSS LogSHORTLOSS LogGPWPERSONAL
LogGPWCOMM โดย RBC จะมคีวามสมัพนัธข์ึ้นกับ ASSETS และ CASH
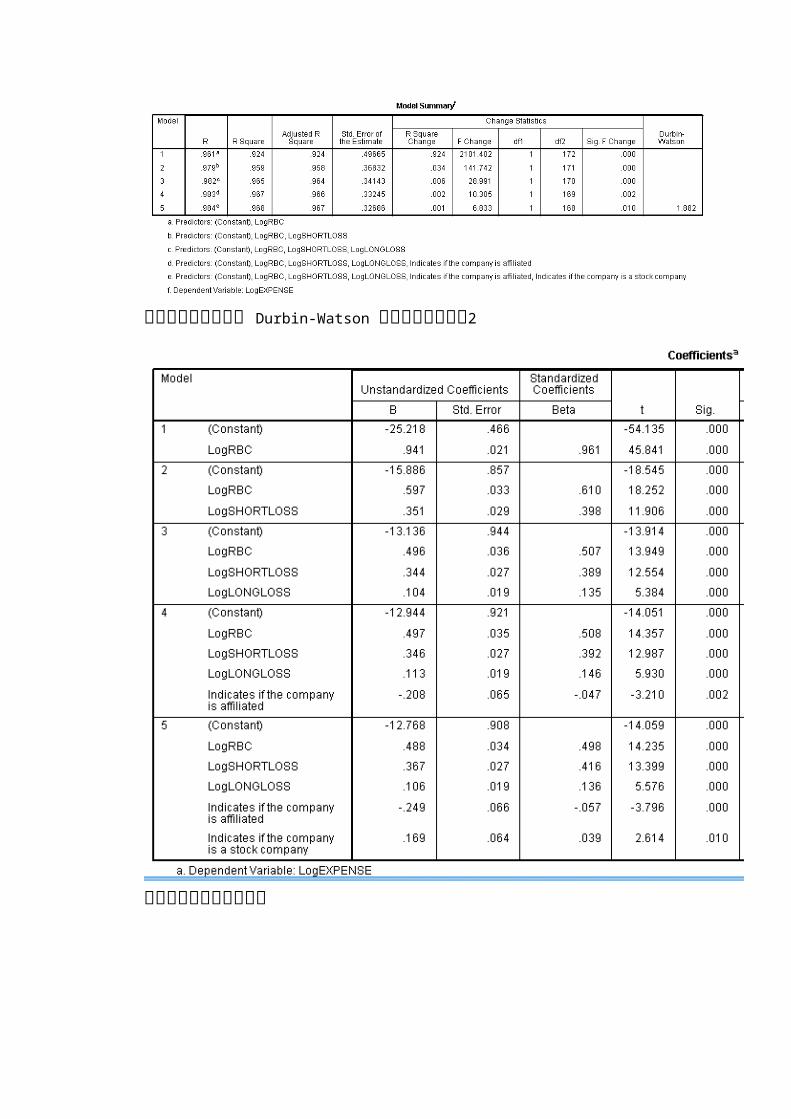
จะเหน็วา่ Durbin-Watson เขา้ใกล้2
พารามเิตอร์

ในบางงานวจิยักำาหนดวา่ให ้VIF <10
RESIDUAL
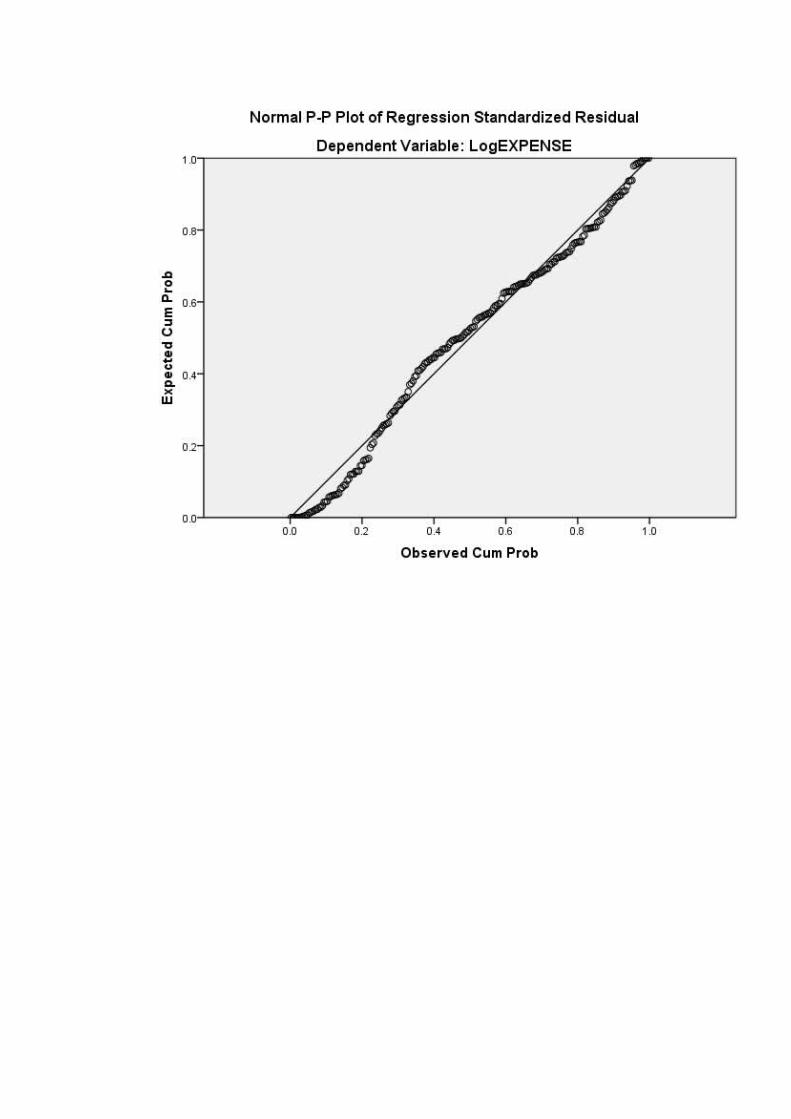

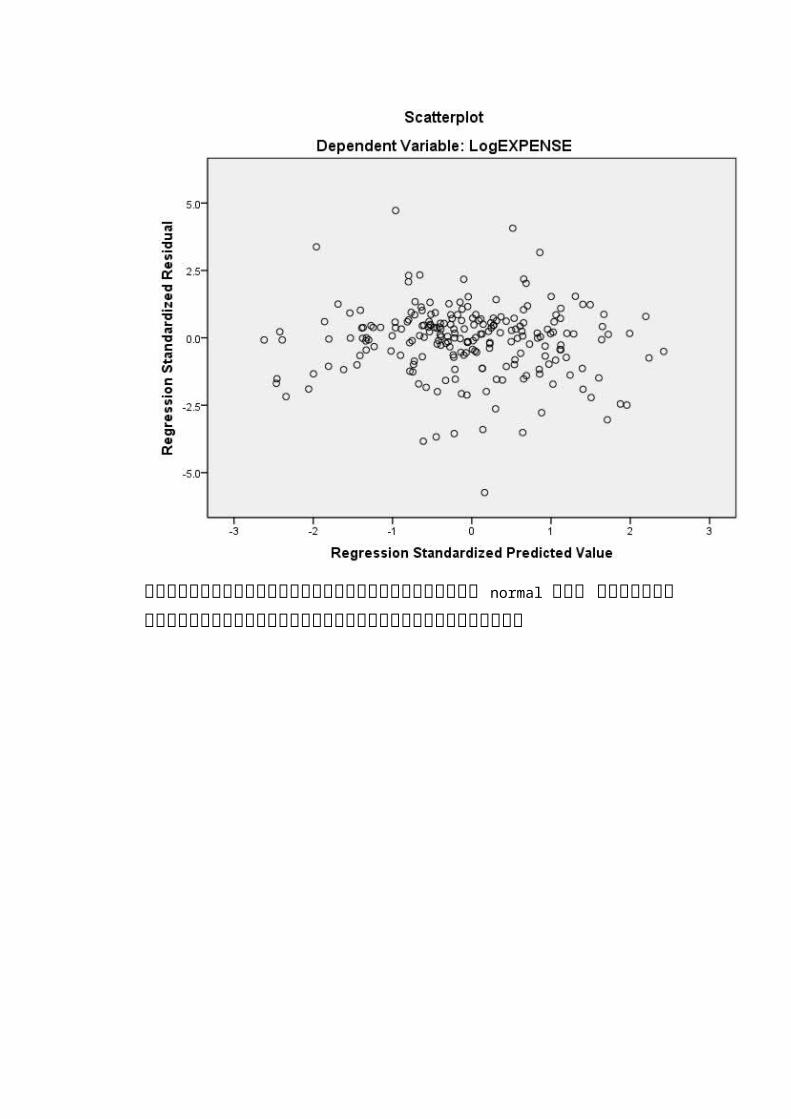
จะเหน็วา่ค่าคาดเคล่ือนเขา้ใกล้ normal และ ค่าความแปรปรวนความคาดเคล่ือนค่อนค่างคงท่ี