MULTIPLE PERSPECTIVES PROVIDED - IT World Canada · Canadian SMB landscape. It’s informed our...
16
Transcript of MULTIPLE PERSPECTIVES PROVIDED - IT World Canada · Canadian SMB landscape. It’s informed our...


MULTIPLE PERSPECTIVES PROVIDED
2
In this year’s study, we benefit from having multiple ways of looking at our collected responses to help us draw insights and implications for you and your fellow IT decision-makers at Canada’s small and medium-sized organizations.
In this year`s study, we collected an overall sample of 360 IT decision-makers.
In addition to looking at just small (0-50 employees:
226) and medium-sized organizations (51-500: 57),
we also include larger-sized organizations (500+:
77) in our sample to broaden our perspective.
Among small, medium and larger organizations, about 20% classified themselves
as being best-in-class. Though their
circumstances vary greatly by virtue of their
very different sizes, some common themes emerged
as well.
Small vs. Medium vs. Large Best-in-class Practitioner
This is the 3rd wave of research we have conducted on the
Canadian SMB landscape. It’s informed our editorial
choices at itbusiness.ca along the way, and now
provides us with points of comparison to understand how the ground has been
shifting beneath our collective feet.
Year-over-Year
1 2 3

YEAR-OVER-YEAR PERSPECTIVE
3
1
In our first section, we discuss findings under the following headings:
a CHANGE – CAN’T LIVE WITH IT, CAN’T LIVE WITHOUT IT BUDGETS ARE GROWING MORE SHARPLY THE CLOUD ISN’T JUST HOT AIR SECURITY TRUMPS THE COST OF THE CLOUD PC’S ARE NOW ON ENDANGERED SPECIES LISTS OS MIGRATION IS NOT A PRIORITY BYOD POLICIES, IN SOME FORM, ARE SEEN FAIRLY FREQUENTLY
b
c
d
e
f
g
4
5
6
7
8
9
10

CHANGE – CAN’T LIVE WITH IT, CAN’T LIVE WITHOUT IT.
4
1
• Many felt their organizations had been very busy trying to keep things running smoothly and making the right choices amid an ever-changing array of demands – and supply of solutions – being presented to them.
• Those who were less satisfied with their organization’s performance felt that a lack of vision and provisions held them back from changing and progressing as much as they could have.
a
The Year in IT in your words…
BUDGETS ARE GROWING MORE SHARPLY
5
1
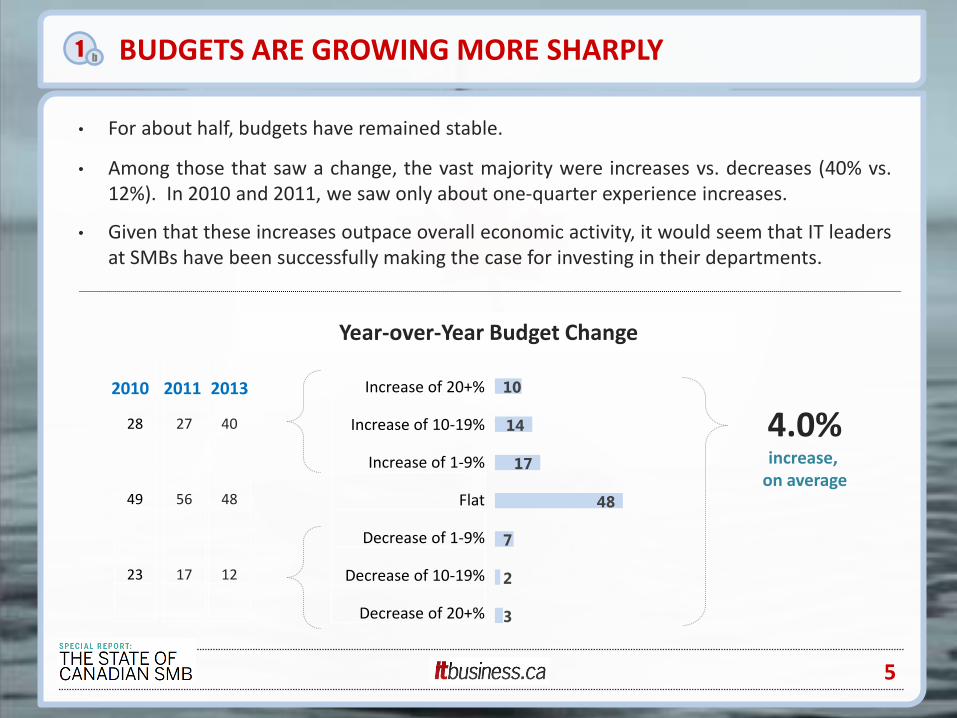
• For about half, budgets have remained stable.
• Among those that saw a change, the vast majority were increases vs. decreases (40% vs. 12%). In 2010 and 2011, we saw only about one-quarter experience increases.
• Given that these increases outpace overall economic activity, it would seem that IT leaders at SMBs have been successfully making the case for investing in their departments.
b
3
2
7
48
17
14
10
Year-over-Year Budget Change
Increase of 20+%
Increase of 10-19%
Increase of 1-9%
Flat
Decrease of 1-9%
Decrease of 10-19%
Decrease of 20+%
27
56
17
28
49
23
40
48
12
2010 2011 2013
4.0% increase,
on average

THE CLOUD ISN’T JUST HOT AIR
6
1
• In previous years, you have told us the cloud was something you were considering.
• Now, it’s something more than half of you will be undertaking next year, making it the most common type of project, edging ahead of Mobile (50%), which has much more quietly risen to be a top IT activity, when we reflect back on previous waves of our research.
• Though we’ve heard a lot about big data, it seems it’s still for the big guys – only about one-quarter of SMBs have big data project plans for next year. Almost twice as many larger organizations do.
c
20
20
22
24
28
39
50
54 Cloud computing
Mobile devices
Customer Relationship Management
Business Intelligence or big data analytics
Financial tracking and management software
VOIP
Marketing automation tools
Enterprise Resource Planning
Projects to be Undertaken Next Year
By Company Size:
Small Medium Large
20 33 45

SECURITY TRUMPS THE COST OF THE CLOUD
7
1
• Knowing that IT funding is not easy to come by at SMBs, it was interesting to note that Cost was rated as the 3rd most important consideration when it comes to the Cloud.
• Security was rated most important, with Data Sovereignty second and Feature Set least important. This is key information for marketers of Cloud Solutions to SMBs.
d
8
14
22
46
Top Cloud Considerations
% ranking as number one
Data Security
Data Sovereignty
Cost
Feature Set
By Company Size:
Small Medium Large
42 46 61
22 25 22
15 16 7
10 16 9
PC`S ARE NOW ON ENDANGERED SPECIES LISTS
8
1
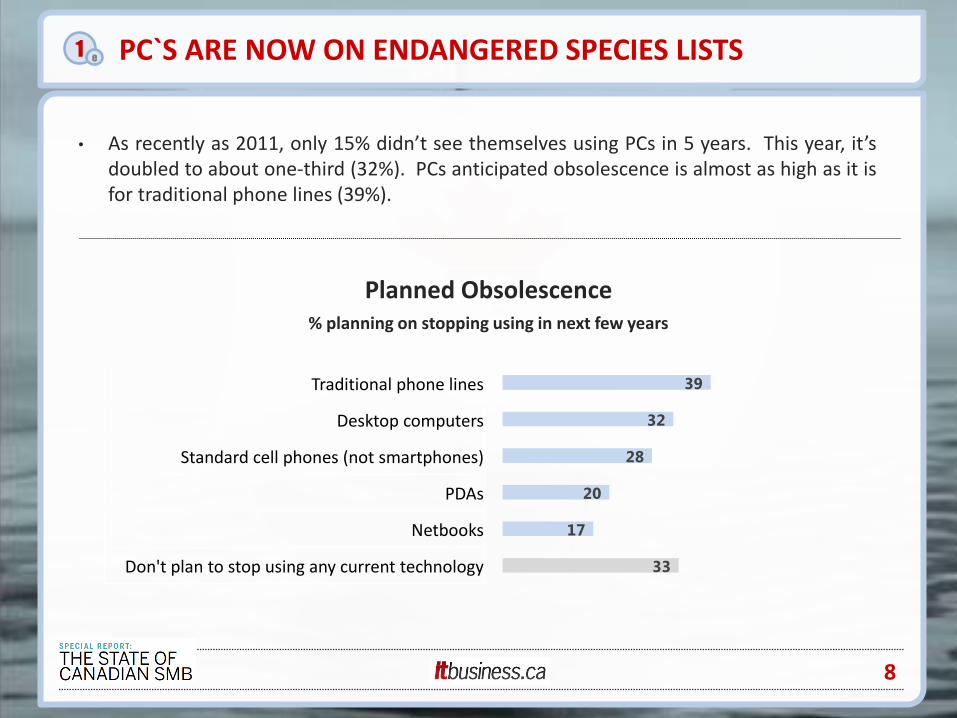
• As recently as 2011, only 15% didn’t see themselves using PCs in 5 years. This year, it’s doubled to about one-third (32%). PCs anticipated obsolescence is almost as high as it is for traditional phone lines (39%).
e
33
17
20
28
32
39
Planned Obsolescence
% planning on stopping using in next few years
Traditional phone lines
Desktop computers
Standard cell phones (not smartphones)
PDAs
Netbooks
Don't plan to stop using any current technology

OS MIGRATION IS NOT A PRIORITY
9
1
• Most (61%) are using Windows 7 or older and have no immediate plans to migrate. Among those that do, more are planning to migrate to Windows 8 than to Windows 7 (16% vs. 9%).
• For Mobile, it is common for more than one OS to be supported at the same organization (57% support more than one). Blackberry remains most common (61%), with Apple`s iOS (54%) and Google`s Android (52%) battling for a close second.
f
8
3
3
9
16
61
Operating System Migration Plans
Currently use Windows 7 or older version with no plans to migrate yet
Plan to migrate to Windows 8 in the next 12 months
Plan to migrate to Windows 7 in the next 12 months
Currently using Linux-based OS or plan to migrate to it
Currently using Mac OS X or plan to migrate to it
Other

BYOD POLICIES, IN SOME FORM, ARE SEEN FREQUENTLY
10
1
• About as many have policies as those who do not. This represents a sign of maturity among SMBs, as the incidence of BYOD policies is as high among them as it is among larger organizations.
g
Bring Your Own Device (BYOD) Policies
16
10
19
44
11 Not certain if we have one
No formal BYOD policy towards allowing employee's personal technology
Enable employees with personal technology on an ad-hoc basis
Have implemented access permissions, but don't actively train employees
Have implemented a policy including access permissions and employee training
45% have one
By Company Size:
Small Medium Large
44 45 48

SMALL VS. MEDIUM VS. LARGE PERSPECTIVE
11
2
In this year`s study, we collected an overall sample of 353 IT decision-makers.
In addition to looking at just small (0-50 employees) and medium-sized organizations (51-500), we also include larger-sized organizations (500+) in our sample to broaden our perspective.
s SMALL ORGANIZATIONS (0-50 EMPLOYEES) ARE FLYING ON THEIR OWN MEDIUM ORGANIZATIONS (50-500) ARE BUILDING THE BACKBONE LARGE ORGANIZATIONS (500+ EMPLOYEES) ARE BIGGER IN SIZE & STRESS
m
l
12
13
14

SMALL ORGANIZATIONS ARE FLYING ON THEIR OWN
12
2
• IT budgets are growing at an average rate of 4.2%, which is higher than at Large (2.0%), but lower than at Medium-sized organizations (5.9%). Small are spending about the same percentage of revenue on IT as is done at larger organizations. But relative to larger organizations, Small are spending a higher percentage of their budget on staff vs. services and hardware/software.
• Capital costs of acquiring new hardware/software represent the biggest budgetary challenge at Small organizations. For larger organizations, managing legacy equipment is their biggest budgetary challenge.
• Small are as likely to be using the Cloud, and as likely to have a BYOD plan. For Mobile, they are much less likely than larger organizations to use Blackberry, and much more likely to use Android. Also notable is that a higher percentage are using tablets than at larger organizations.
s
• Small are more likely to rely on internet searches than larger, when it comes to looking for more information. They are much less likely to interact with a rep, and more likely to make purchases online. Using whichever software is installed on new PCs is the primary pathway to upgrades, whereas purchasing bulk licenses and deploying internally is more common among larger. Practitioners are much more likely to be self-taught than at larger organizations, where in-house training is the top approach.
% of IT Budget Allocated to Staffing

MEDIUM ORGANIZATIONS ARE BUILDING THE BACKBONE
13
2
• At 5.9% year-over-year, IT budgets are up more at Medium than Small or Large organizations. Looking forward, they are the most bullish on future growth. More than one-third believe budgets will continue to grow over the next three years. This compares to about one-quarter at Smaller and Large.
• They seem to be spending a greater percentage of their budgets on Hardware (33%) than Small organizations (27%) and less on Services than Large (26% vs. 31%). They are much more likely to be planning Mobile-related projects (61%) than Small (45%). About the same percentage of each size are planning to do CRM (39%), the third most popular project type.
• The Cost of the Cloud is their third most important consideration, behind both Security and Data Sovereignty. This is similar to what is seen for Large organizations. Cost is more important for Small.
m
• Medium organizations are more likely to cite In-house training as their top approach, and to deploy new software licenses internally. Interestingly, they are much more likely to use hybrid laptops / tablets at their organizations (28% vs. 17% for Smaller and Larger).
% IT Budget Growth

LARGE ORGANIZATIONS ARE BIGGER IN SIZE & STRESS
14
2
• As mentioned above, Large organizations have experienced – and anticipate – slower budgetary growth than our SMBs. Interestingly, their spend is about evenly split across Staff, Services, and Software/Hardware. As size grows, the balance seems to shift from a focus on Staff, to Software/Hardware, to Services.
• They are much more likely to be planning Business Intelligence or Big Data projects (45%) than Medium (33%) and Small (20%). Similarly, they are much more likely to be building custom mobile apps (29% vs. 13% for SMB). For Mobile, they are much more likely to be supporting Windows Phones (27% vs. 18% for SMB). This is probably related to greater contact with Microsoft reps and their channel partners. As percentage of their spend, only 21% is done without contact with channel partner or rep. For Medium, it’s 34%. For Small, it’s 60%.
l
• When asked about the degree to which they were stressed about five different aspects of the Cloud, they revealed significantly higher anxiety levels on all fronts, especially with respect to a data breach (49% were very stressed vs. 33% for SMBs).
% `Very Stressed` about
a Data breach of customer or employee information

BEST-IN-CLASS PERSPECTIVE
15
3
Among small, medium and larger organizations, about 20% classified themselves as being best-in-class. Though their circumstances vary greatly by virtue of their very different sizes, some common themes emerged as well.
1 1 3 3 12 12
21 28 14
6
1 2 3 4 5 6 7 8 9 10
20%
61%
19%
Worst Best
7.1
Average Rating
% providing each rating, from West to Best in Class
By Company Size:
Small Medium Large
7.0 6.9 7.2
Back
Middle
Front

16
• Best-in-class is not related to revenue or size of IT budget, from a statistical point-of-view. In other words, you can be better than a similarly-sized organization, even if their topline is greater. As one best-in-classer put it, “we keep up to date with technology and our staff use it to get more done with less time and less overhead.”
• Best-in-class have been able to grow their IT budgets. The average year-over-year change among them was 6%, compared to 4% for those in the middle of the pack, and 2% at the back of the pack. As was noted by one at the back, “Management is unaware/not open to new tools and paradigms.”
• Best-in-class do not rely as heavily on self-teaching as a training tool. They are much more likely to employ External, In-Person training approaches. “We are an IT firm , we sell IT and make sure our team is top of their game.”
• Best-in-cass are taking on more different initiatives at the same time. Business Intelligence / Big Data projects are one area in particular that they are much more likely to have planned (37% vs. 27%). Interestingly, they are also much more likely to use Instant Messaging on smartphones for business purposes (74% do).
BEST-IN-CLASS PERSPECTIVE 3
# of Project Types Undertaken
2.6 2.5 3.0
Cloud computing 54 Financial tracking and management software
24
Mobile devices 50 VOIP 22
Customer Relationship Management
39 Marketing automation tools
20
Business Intelligence or big data analytics
28 Enterprise Resource Planning
20
Back
Middle
Front
% Undertaking each Project Type