Multiple Imputation for Complex Surveys: An Overview of the State of the Art Center for Statistical...
21
Multiple Imputation for Complex Surveys: An Overview of the State of the Art Center for Statistical Research and Methodology (CSRM) United States Census Bureau 19 June, 2015 Views expressed are those of the author and not necessarily those of the U.S. Census Bureau. Joe Schafer
-
Upload
elfreda-austin -
Category
Documents
-
view
215 -
download
0
Transcript of Multiple Imputation for Complex Surveys: An Overview of the State of the Art Center for Statistical...

Multiple Imputation forComplex Surveys:An Overview of the
State of the Art
Center for Statistical Research and Methodology (CSRM)United States Census Bureau
19 June, 2015
Views expressed are those of the author and not necessarily those of the U.S. Census Bureau.
Joe Schafer

Outline
1. Historical Development2. “How to” Do MI3. Complexities for Complex Surveys4. Looking Ahead
MI for complex surveys: Ready for prime time?

1. Development of MI
• First proposed by Rubin in 1977 for missing income in the March income supplement to the Current Population Survey (Scheuren 2005)
• Rationale and theory presented by Rubin (1987)
• Criticism from designed-based perspectives by Fay (1992), with response by Meng (1994) (congeniality)
• Properties of Rubin’s “variance estimate” (Wang and Robins, 1998; Robins and Wang, 2000; Kim et al., 2006) with response by Rubin (2003)
Theory
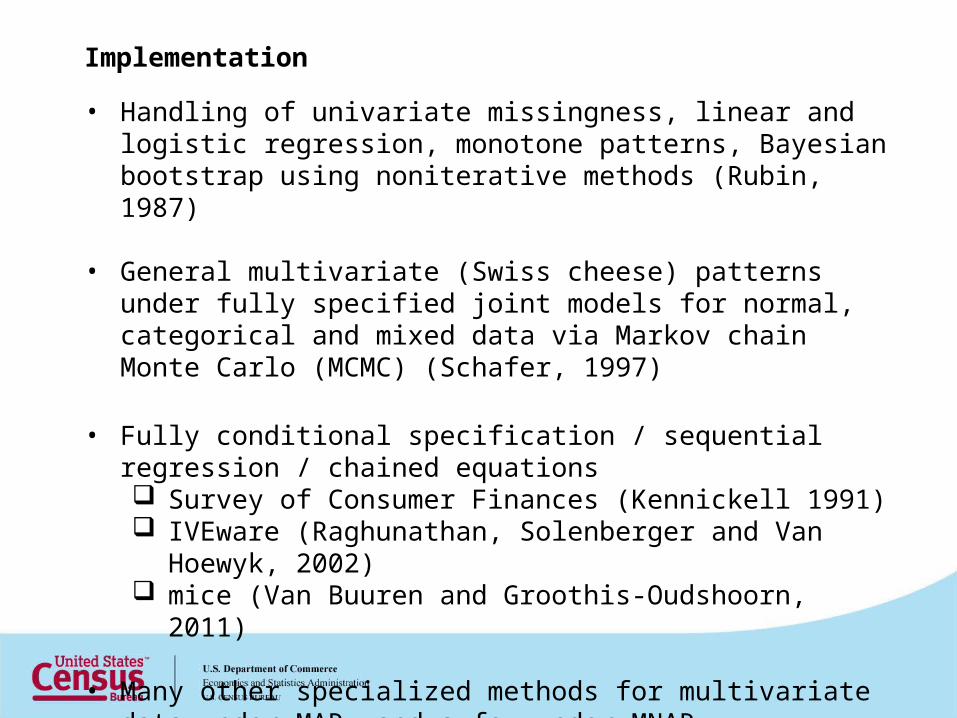
• Handling of univariate missingness, linear and logistic regression, monotone patterns, Bayesian bootstrap using noniterative methods (Rubin, 1987)
• General multivariate (Swiss cheese) patterns under fully specified joint models for normal, categorical and mixed data via Markov chain Monte Carlo (MCMC) (Schafer, 1997)
• Fully conditional specification / sequential regression / chained equations Survey of Consumer Finances (Kennickell 1991) IVEware (Raghunathan, Solenberger and Van Hoewyk,
2002) mice (Van Buuren and Groothis-Oudshoorn, 2011)
• Many other specialized methods for multivariate data under MAR, and a few under MNAR
Implementation
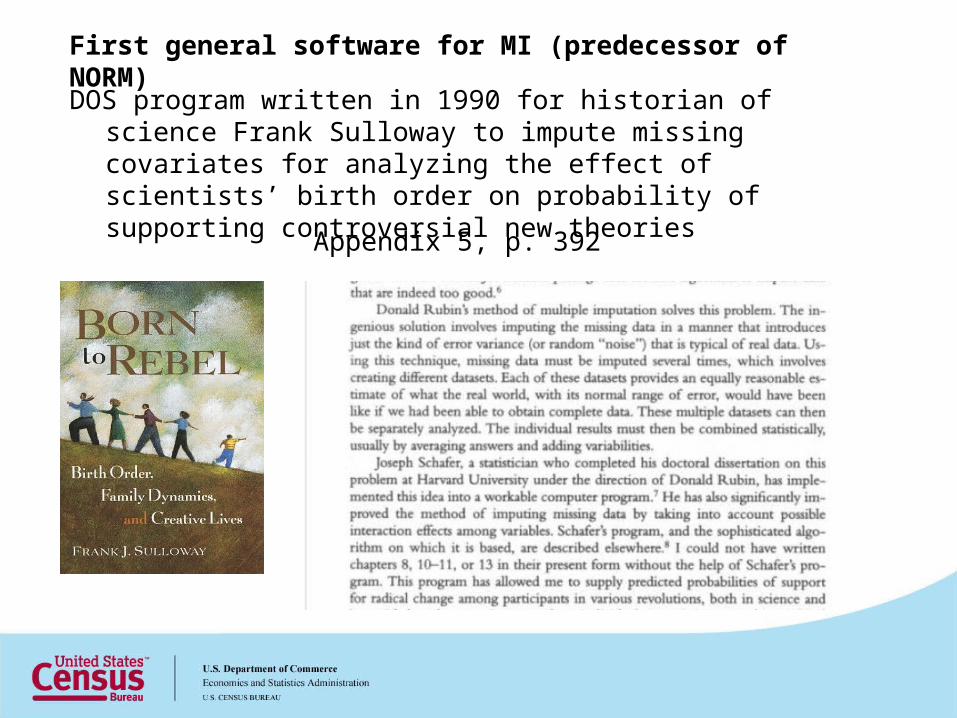
DOS program written in 1990 for historian of science Frank Sulloway to impute missing covariates for analyzing the effect of scientists’ birth order on probability of supporting controversial new theories
First general software for MI (predecessor of NORM)
Appendix 5, p. 392

Publications
from website of Stef Van Buuren http://www.stefvanbuuren.nl/mi/
•c. 2005: turning point for acceptance of MI. Now every major statistical package does MI in some fashion (Van Buuren, 2012)

Applications to Surveys, Censuses and Administrative Databases in the United States
•Census industry and occupation codes (Clogg et al., 1991)
•Fatality Analysis Reporting System (Heitjan and Rubin, 1991)
•Consumer Expenditure Survey (Raghunathan and Paulin, 1998)
•National Health and Nutrition Examination Survey (Schafer et al., 1998)
•Survey of Consumer Finances (Kennickell, 1998)
•National Health Interview Survey (Schenker et al., 2006)
•Cancer Care Outcomes Research and Surveillance (He et al., 2009)
2. “How to” Do MI
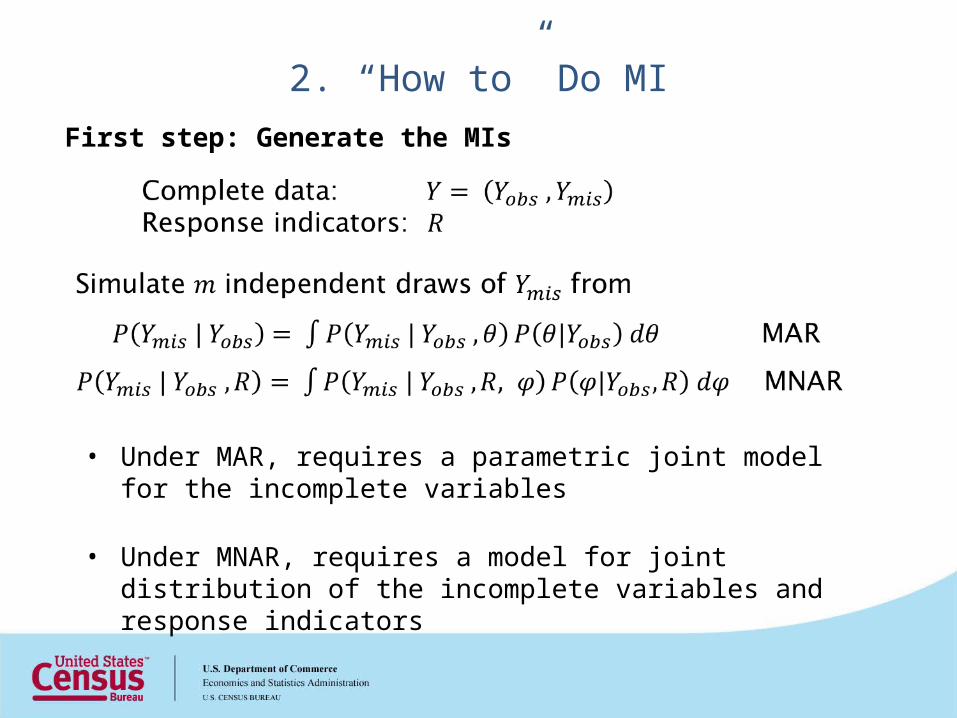
First step: Generate the MIs
• Under MAR, requires a parametric joint model for the incomplete variables
• Under MNAR, requires a model for joint distribution of the incomplete variables and response indicators
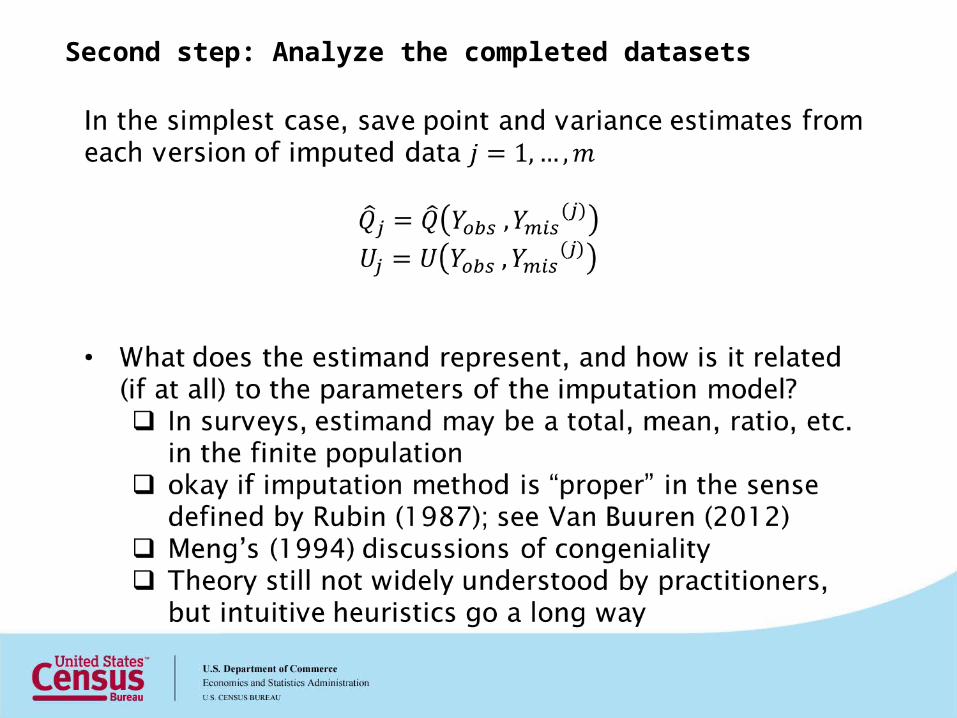
Second step: Analyze the completed datasets
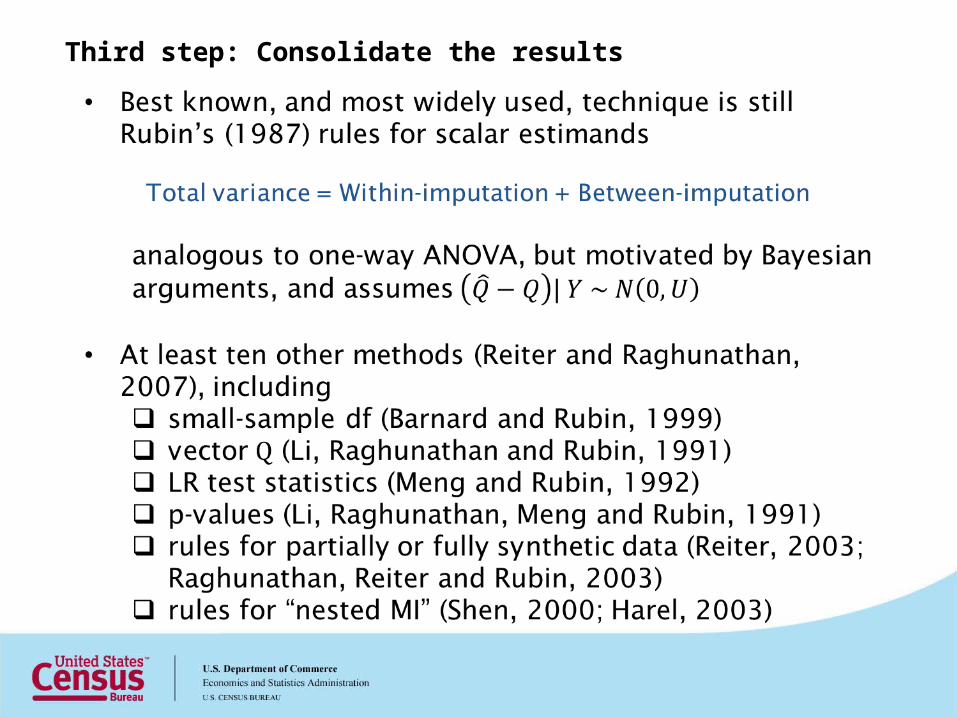
Third step: Consolidate the results

How many imputations are needed?

3. Complexities for Complex Samples
Issue: compatibility of imputation model and analysis procedures
• Rubin’s definition of proper is difficult to verify in practice (Van Buuren, 2012)
• Meng’s (1994) discussion of congeniality and superefficiency
• Imputers often have access to extra information and may make extra assumptions
• Mismatch between models may be harmful or helpful, and it depends on whether the extra assumptions are true; see heuristic discussion by Schafer (2003)

Issue: Popular MI software (joint modeling) assumes multivariate normality, but survey variables tend to be categorical or mixed types
• Loglinear and general location models (Schafer, 1997) are okay when number of variables is small (say, <20)
• Impute as normal, then categorize the imputed values by rounding or coin flipping (Allison, 2005, 2006; Bernaards, Belin and Schafer, 2007; Yucel and Zaslavsky, 2008; Demirtas, 2009, 2010)
• Models for mixed variables based on latent normal structure (Boscardin, Zhang and Belin, 2008; He, 2012); this is a special case of multivariate copula models (Pitt, Chan and Kohn, 2006; Smith and Khaled, 2011)
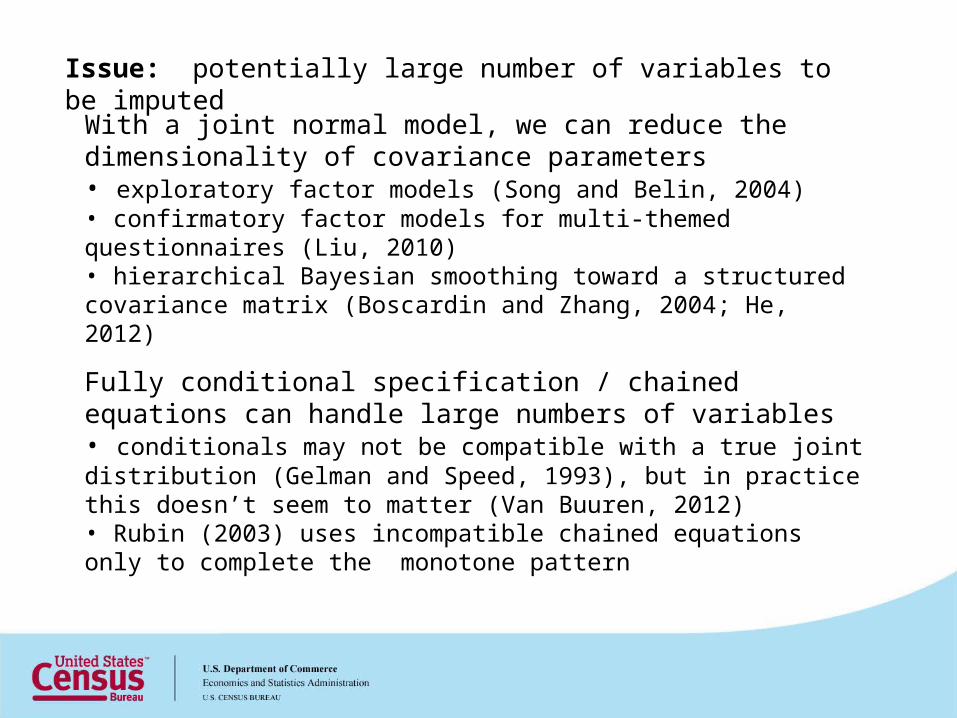
Issue: potentially large number of variables to be imputed
With a joint normal model, we can reduce the dimensionality of covariance parameters• exploratory factor models (Song and Belin, 2004)• confirmatory factor models for multi-themed questionnaires (Liu, 2010)• hierarchical Bayesian smoothing toward a structured covariance matrix (Boscardin and Zhang, 2004; He, 2012)
Fully conditional specification / chained equations can handle large numbers of variables• conditionals may not be compatible with a true joint distribution (Gelman and Speed, 1993), but in practice this doesn’t seem to matter (Van Buuren, 2012)• Rubin (2003) uses incompatible chained equations only to complete the monotone pattern
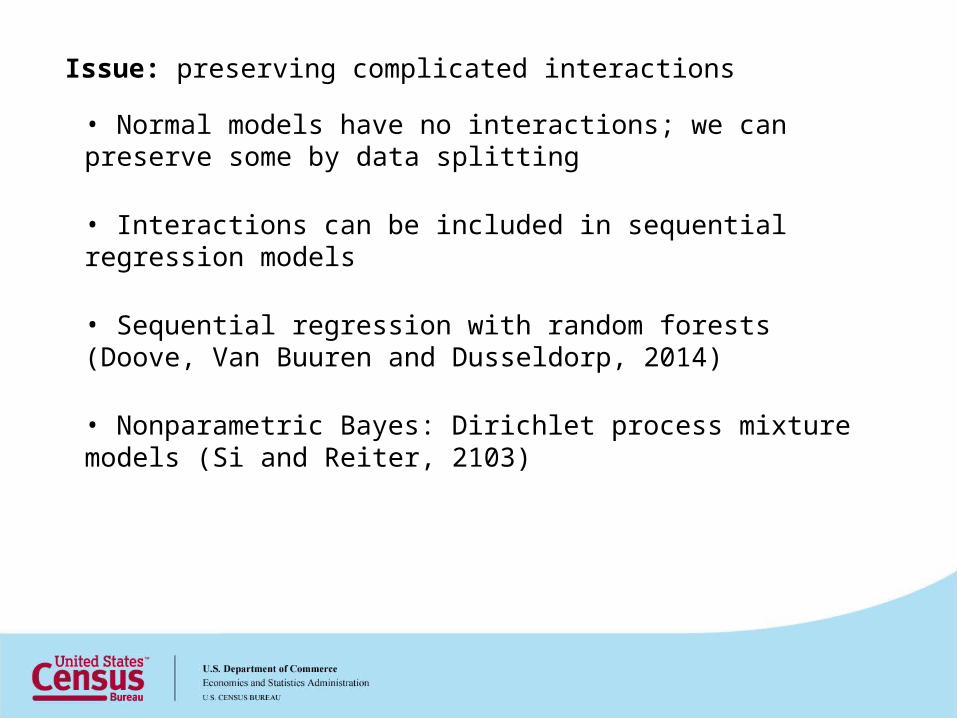
Issue: preserving complicated interactions
• Normal models have no interactions; we can preserve some by data splitting
• Interactions can be included in sequential regression models
• Sequential regression with random forests (Doove, Van Buuren and Dusseldorp, 2014)
• Nonparametric Bayes: Dirichlet process mixture models (Si and Reiter, 2103)

Issue: Important features of sample design ought to be reflected in the imputation model
• fixed effects for stratifying variables or stratum indicators
• multilevel multivariate models with random effects for clusters (Schafer et al., 1998)
• cross-wave correlations in longitudinal surveys (Schafer and Yucel, 2002)
• spline bases for functions of sample weights (Zhang and Little, 2009)
• mixed-effects models in sequential regression (Yucel, Schenker and Raghunathan, 2006; Van Buuren, 2012)
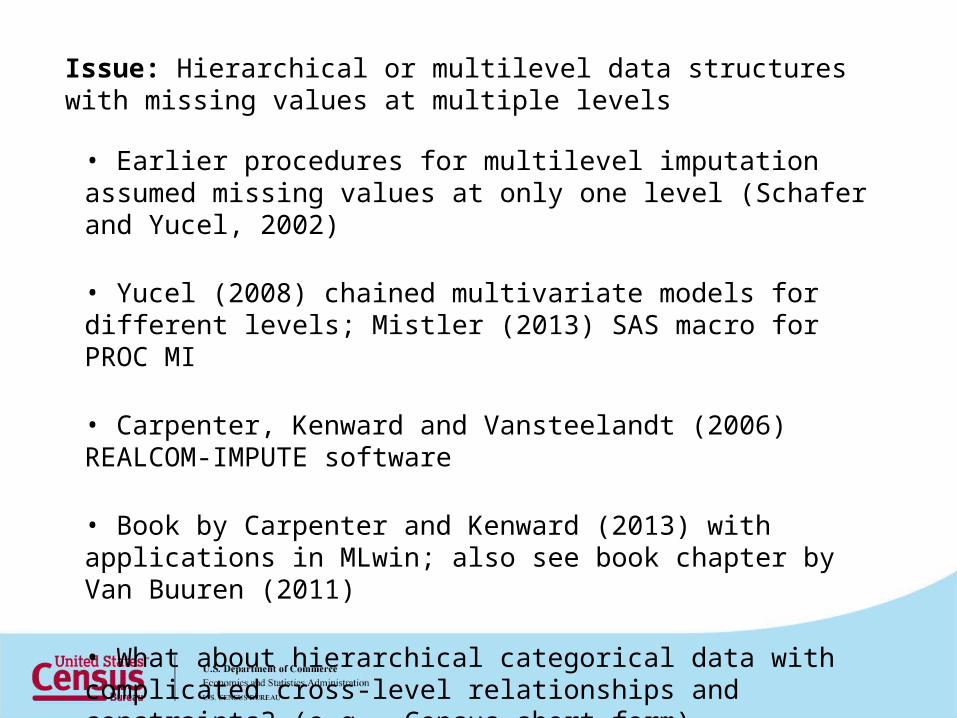
Issue: Hierarchical or multilevel data structures with missing values at multiple levels
• Earlier procedures for multilevel imputation assumed missing values at only one level (Schafer and Yucel, 2002)
• Yucel (2008) chained multivariate models for different levels; Mistler (2013) SAS macro for PROC MI
• Carpenter, Kenward and Vansteelandt (2006) REALCOM-IMPUTE software
• Book by Carpenter and Kenward (2013) with applications in MLwin; also see book chapter by Van Buuren (2011)
• What about hierarchical categorical data with complicated cross-level relationships and constraints? (e.g., Census short form)

Issue: imputed values need to satisfy logical constraints
• questionnaire skip patterns (He et al., 2009)
• sum constraints (Kim et al., 2014)
• logical zeroes induced by edit rules (Reiter et al.)
• explicit edit rules may imply other constraints (implicit edits) that must be satisfied; finding implicit edits requires set-covering algorithms and integer programming (Winkler, 1997)
• Even if observed values pass edit tests, they might not be error free; consider multiple imputation to account for response errors (Ghosh-Dastidar and Schafer, 2003)
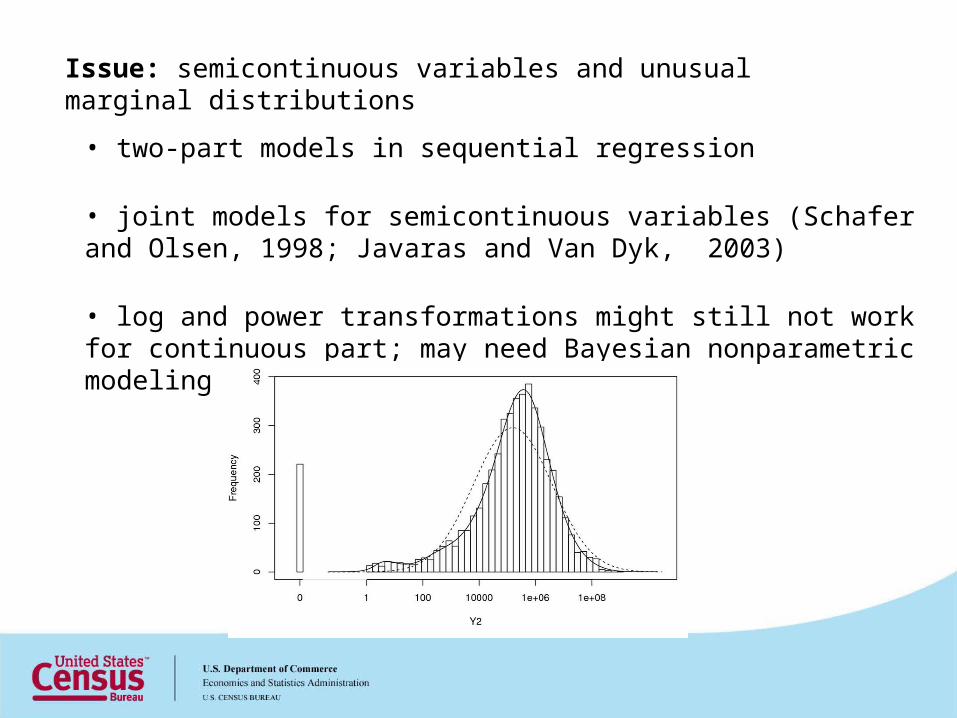
Issue: semicontinuous variables and unusual marginal distributions
• two-part models in sequential regression
• joint models for semicontinuous variables (Schafer and Olsen, 1998; Javaras and Van Dyk, 2003)
• log and power transformations might still not work for continuous part; may need Bayesian nonparametric modeling

Explosion of new models, techniques, algorithms over last 15 years. But are they ready for prime time?
Many nonstatistical issues remain…
• availability, reliability, sustainability of software
• perceived and actual difficulty of implementation for production
• perceived and actual difficulty of explaining to policymakers and public
• organizational culture and priorities
4. Looking Ahead