Multiple Imputation as a Missing Data Approach to Reject Inference on Consumer Credit Scoring
41
1 Multiple Imputation as a Missing Data Approach to Reject Inference on Consumer Credit Scoring By David J. Fogarty Affiliation David J. Fogarty is an Online Faculty Member at the University of Phoenix, Phoenix Arizona, United States. Address for Correspondence: 5 Old Clubhouse Road Old Greenwich, Connecticut USA 06870, [email protected] Abstract This paper analyzes the importance of using proper techniques for the reject inference to develop consumer credit scoring. The focus is treating reject inference as a missing data problem and using model-based imputation techniques as a way to enhance the information inferred from the rejects over that of traditional approaches when developing credit scorecards. An overview and comparison of the standard missing data approaches to reject inference are provided. Multiple imputation is also discussed as a method of reject inference which can potentially reduce some of the biases which can occur from using some of the traditional missing data techniques. A quantitative analysis is then provided to confirm the hypothesis that model-based multiple imputation is an enhancement over traditional missing data approaches to reject inference. Source-Reference The ideas for this paper originated from research work on David J. Fogarty’s Ph.D. dissertation awarded in December 2000 at Leeds Metropolitan University. The subject area was the use of advanced techniques for the imputation of incomplete multivariate data on corporate data warehouses.
Transcript of Multiple Imputation as a Missing Data Approach to Reject Inference on Consumer Credit Scoring

1
Multiple Imputation as a Missing Data Approach to Reject Inference on Consumer Credit Scoring
By
David J. Fogarty
Affiliation
David J. Fogarty is an Online Faculty Member at the University of Phoenix, Phoenix Arizona, United States.
Address for Correspondence: 5 Old Clubhouse Road Old Greenwich, Connecticut
USA 06870, [email protected]
Abstract This paper analyzes the importance of using proper techniques for the reject inference to develop consumer credit scoring. The focus is treating reject inference as a missing data problem and using model-based imputation techniques as a way to enhance the information inferred from the rejects over that of traditional approaches when developing credit scorecards. An overview and comparison of the standard missing data approaches to reject inference are provided. Multiple imputation is also discussed as a method of reject inference which can potentially reduce some of the biases which can occur from using some of the traditional missing data techniques. A quantitative analysis is then provided to confirm the hypothesis that model-based multiple imputation is an enhancement over traditional missing data approaches to reject inference.
Source-Reference
The ideas for this paper originated from research work on David J. Fogarty’s Ph.D. dissertation awarded in December 2000 at Leeds Metropolitan University. The subject area was the use of advanced techniques for the imputation of incomplete multivariate data on corporate data warehouses.

2
SURVEY OF LITERATURE
Introduction
Consumer credit is granted by banks retailers, mail order and online catalogue companies and various other lending institutions and is a sector of the economy that has seen rapid growth over the last 35 years. Credit scoring is the name used to describe the process of determining how likely an applicant is to default with repayments. Statistical models developed to give estimates of these default probabilities are referred to as scorecards or classifiers. Standard methods used for developing scorecards are discriminant analysis, linear regression and decision trees. An accept/reject decision can then be taken on a particular applicant by comparing the estimated good/bad probability within a suitable threshold. Despite the widespread use of credit scoring techniques in the consumer credit industry there are several aspects of the methodology that have not received sufficient attention in the literature. Principle reasons for this are intellectual property concerns and the lack of widely available datasets. In this paper we will examine reject inference which is an important aspect of credit scoring that has not received much attention in the literature with the aid of a real data set from a large credit granting firm. Reject inference is the process of trying to infer the true credit status of the rejects, using their characteristic vectors. Reject inference is an important topic when new scorecards are being developed since the true creditworthiness of the applicants rejected by the previous scorecards cannot be determined due to their applications being formally rejected. Thus, if a sample consisting only of accepted applicants is used to construct the new scorecard then bias may be introduced. The process of reject inference has traditionally been used to reduce this bias by inferring the true status of the rejects to produce a new scoring instrument. However, much of the published work on reject inference has been inconclusive as to when reject inference is necessary and which of the various techniques are most effective. Chandler and Coffman (1979) presented a comparison of judgmental systems with credit scoring and concluded that scoring has certain advantages not shared by judgmental methods including being based on actual and not perceived performance which can be statistically evaluated before implementation. They also noted that credit scoring produced more consistent evaluations and are more accurate than judgmental methods. Eisenbeis (1978) and Crook et. al (1992) classified the literature on credit scoring into two groups. Firstly, those papers which consider the relative merits of different classification techniques for constructing credit scoring models (e.g. discriminant analysis, decision trees and logistic regression). Secondly, those

3
which consider the underlying objectives of credit scoring and different aspects of the credit granting policy related to scoring. Among the most important contributions to the literature on the appropriate classification techniques to use for both consumer and commercial credit scoring models include the works of Durand (1941); Myers and Cordner (1957); Smith (1964); Myers and Forgy (1967); Altaman (1968); Chatterjee and Barcun (1970); Orgler (1970, 1971); Edminster (1972); Apilado et. al (1974); Blum (1974); Tousant (1974); Grablowsky and Talley (1981); Wiginton (1981); Chandler and Coffman (1983, 1984); Doreen and Farkhoomand (1983); Reichert et. al (1983); Hand (1986, 2001,); Overstreet and Kemp (1986); Leonard (1988, 1993); Srinivasan and Kim (1987); Boyle et. al (1992); Fogarty and Ireson (1993, 1994); Hand and Henley (1993, 1994); Henley (1997); Wilson and Summers (1998); Chang et. al (2000); Thomas (2000); and Hand and Kelley (2001). Among the most important contributions to the literature on the credit granting policy related to credit scoring includes the works of Mehta (1968, 1970); Blackwell and Sykes (1992); Edelman (1992); Lundy (1992); Oliver (1992); and Baestaens (1999). This paper will represent an original contribution to a more recent third class of literature on credit scoring not yet anticipated by Eisenbeis (1978) and Crook et. al (1992) which considers ways to improve the results of current scoring techniques in practice. Recent work in this area includes Kelley et. al (1999) and Hand and Adams (2000). Reject inference is a technique that is widely used by scorecard developers, although it has not been given extensive treatment in the literature. Henley (1997) describes two important reasons for needing reject inference as being the potential bias being introduced if a sample consisting only of accepted applicants is used to construct a new scorecard and also in order to obtain an accurate estimate of the portion of potential goods (from the full applicant population) being rejected by the existing scorecard. In addition, other unknown aspects of the structure of the reject population may provide further reasons for needing reject inference (e.g. if one wishes to understand the shape of the p(g|x) curve in the reject region). Eisenbeis (1978) reported that using a model based solely on the truncated population of accepted applicants can frequently generate misleading results. Other authors, including Hsia (1978); Reichert et. al (1983); Joanes (1993, 1994) and Hand (1998) have highlighted the possible bias that can result from using a sample of accepted applicants to build a scorecard with which to assess the full applicant population. Henley (1997) conducted a survey of reject inference methods proposed in the literature and compared and contrasted their relative performance. Henley described several methods for reject inference that assume no additional data including augmentation, extrapolation from the accepts and standard missing data approaches. He also described several methods of reject inference that utilize supplementary information in the form of distributional assumptions and a

4
calibration sample which includes the true status of the rejects. Finally, Henley evaluated methods using foresight data which involves information that becomes available on applicants in a data sample after the application is made (and before the model building procedure is carried out). Henley (1997) went on to conclude in his study that reliable reject inference is impossible unless extra information is incorporated in some way. This conclusion presents a dilemma to developers of credit scorecards since the threat of the potential bias which may result from not including the rejects in the development sample is well documented and understood throughout the consumer credit industry. In addition, additional data which can be used to improve the reliability of reject inference methods is often unavailable. Therefore, scorecard developers will continue to use ad hoc methods of reject inference without a full understanding of its potential impact on the final scorecard implementation.
Missing Data Mechanisms and Their Impact on Reject Inference
De Veaux and Hand (2005) describe a category of missing data arising out of the nature of the problem and use credit scoring and rejects as an example. Henley (1997) also described the process of treating reject inference as a missing data problem. Before describing the application of standard missing data approaches to the reject inference problem a brief overview of three specific assumptions that one can make about the process by which data can become missing is necessary (Rubin, 1987). It will be noted later when guidelines are given for the selection of proper imputation procedures that the understanding of these missing data mechanisms will determine the type of imputation procedure a researcher can utilize. To properly define these mechanisms, first let Y denote the data matrix, with columns (dependent and explanatory) variables and rows as observations. If Y were entirely observed, or in the context of this study there were no rejects, one would use some statistical or data mining method to analyze it and could ignore this research. If one defines M as a ‘missingness’ indicator matrix with the same dimensions as Y but with a 1 in each entry for which the corresponding entry in Y is observed and a 0 when the corresponding element of Y is missing. Finally, let Yobs and Ymis denote stacked vectors of elements of Y that are observed and missing, respectively, so Y = {Yobs,Ymis}. The three missing mechanisms can now be explained in order from least to most dependent on other information. 1. Missing Completely At Random (MCAR): neither Yobs nor Ymis helps in predicting
M. That is, P(M|Y) = P(M).

5
1. Missing At Random (MAR): Yobs, but not Ymis, helps in predicting M. That is, P(M|Y) = P(M|Yobs).
2. Nonignorable: Ymis and possibly also Yobs, helps in predicting M, so P(M|Y) does
not simplify. Rubin (1987) characterizes each of these processes according to the ability to predict the values of M. (i.e. which values of Y will be missing). For example, the missing values in the MCAR processes cannot be predicted with any information in Y, observed or not. An explicit example of an MCAR process is one in which customers decide to answer customer satisfaction survey questions on the basis of flipping a coin. Of course, the MCAR assumption rarely applies. If credit card customers who pay off their balance each month avoiding all interest charges are more likely to decline to answer a question on interest rates then the data are not MCAR. For MAR processes, the probability that a cell value is missing may depend on the observed data, but it may not depend on values of Y that are unobserved. Using the previous example, if customers who indicate that they do not pay interest on their other credit cards in a customer satisfaction survey, are more likely to decline to answer a question on interest rates, then the process is MAR so long as the interest payer identification is a question in the survey. Finally, if the probability that a cell is missing depends on the unobserved value of the missing response, the process is said to be nonignorable. An example of such a process is when high-income people are more likely to refuse to answer customer satisfaction survey questions about income and when other variables in the data set cannot predict which respondents have high income (Rubin, 1987). Methods for dealing with ignorable missing data are not unbiased in the presence of nonignorable missing data. Specific methods for dealing with nonignorable missing data include Response Function and Mean Response Function imputation proposed by Sijtisma and Van der Ark (2003). Additional methods for dealing with nonignorable missing data have been proposed by Green and Park (2003), Troxel, Harrington and Lipsitz (1998), Neuenschwander and Brandon (2004), Paik (2004) and Lipsitz et al. (2004). Note that in the case of nonignorable missing data, the missing data mechanism should be explicitly specified as in the case of selection models in econometrics in order for the missingness to be modeled accurately (Bernaards and Sijtisma, 2000). In the credit scoring problem Henley (1997) pointed out that the appropriate missing data mechanism depends upon the set of characteristics used to make the original accept/reject decision. He distinguished between two possible scenarios as described below: (1) If the set of characteristics Z available for building new scorecards does include all the characteristics from the set X used to make the original accept/reject classification then the data will be MAR. This is because the probability of response depends on the set of characteristics Z alone and not on the response. (2) If the set of characteristics Z available for building new scorecards does not include all the characteristics from the set X used to make the original accept/reject classification then the data will be nonignorable. This is because the probability of
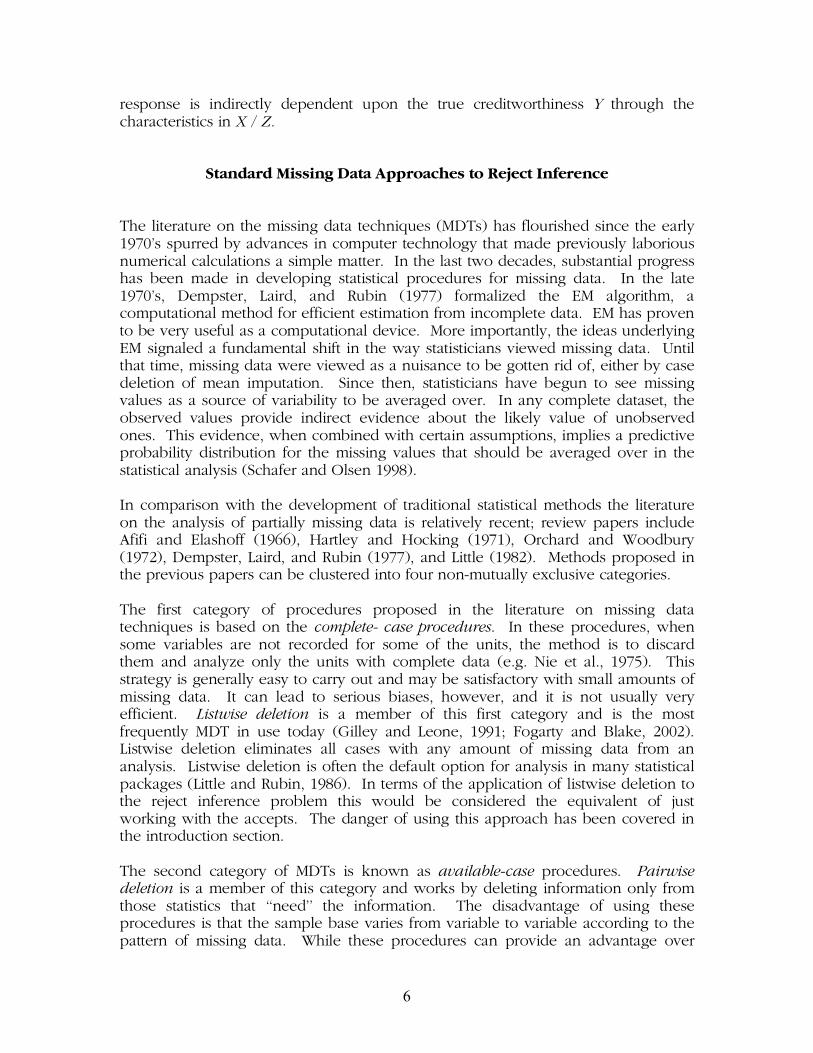
6
response is indirectly dependent upon the true creditworthiness Y through the characteristics in X / Z.
Standard Missing Data Approaches to Reject Inference
The literature on the missing data techniques (MDTs) has flourished since the early 1970’s spurred by advances in computer technology that made previously laborious numerical calculations a simple matter. In the last two decades, substantial progress has been made in developing statistical procedures for missing data. In the late 1970’s, Dempster, Laird, and Rubin (1977) formalized the EM algorithm, a computational method for efficient estimation from incomplete data. EM has proven to be very useful as a computational device. More importantly, the ideas underlying EM signaled a fundamental shift in the way statisticians viewed missing data. Until that time, missing data were viewed as a nuisance to be gotten rid of, either by case deletion of mean imputation. Since then, statisticians have begun to see missing values as a source of variability to be averaged over. In any complete dataset, the observed values provide indirect evidence about the likely value of unobserved ones. This evidence, when combined with certain assumptions, implies a predictive probability distribution for the missing values that should be averaged over in the statistical analysis (Schafer and Olsen 1998). In comparison with the development of traditional statistical methods the literature on the analysis of partially missing data is relatively recent; review papers include Afifi and Elashoff (1966), Hartley and Hocking (1971), Orchard and Woodbury (1972), Dempster, Laird, and Rubin (1977), and Little (1982). Methods proposed in the previous papers can be clustered into four non-mutually exclusive categories. The first category of procedures proposed in the literature on missing data techniques is based on the complete- case procedures. In these procedures, when some variables are not recorded for some of the units, the method is to discard them and analyze only the units with complete data (e.g. Nie et al., 1975). This strategy is generally easy to carry out and may be satisfactory with small amounts of missing data. It can lead to serious biases, however, and it is not usually very efficient. Listwise deletion is a member of this first category and is the most frequently MDT in use today (Gilley and Leone, 1991; Fogarty and Blake, 2002). Listwise deletion eliminates all cases with any amount of missing data from an analysis. Listwise deletion is often the default option for analysis in many statistical packages (Little and Rubin, 1986). In terms of the application of listwise deletion to the reject inference problem this would be considered the equivalent of just working with the accepts. The danger of using this approach has been covered in the introduction section. The second category of MDTs is known as available-case procedures. Pairwise deletion is a member of this category and works by deleting information only from those statistics that ‘‘need’’ the information. The disadvantage of using these procedures is that the sample base varies from variable to variable according to the pattern of missing data. While these procedures can provide an advantage over

7
listwise deletion in terms of loss of statistical power they can also yield problems if the data are not MCAR (Little and Rubin, 1986). The third category of methods, referred to as weighting procedures, is popular in sample survey applications. In this method, randomization inferences from data with nonresponse are commonly based on design weights, which are inversely proportional to the probability of selection. Weighting procedures modify the weights in an attempt to adjust for nonresponse and are similar to the mean imputation MDT, which will be discussed later. The fourth category of methods is referred to as imputation-based procedures. Data imputation refers to methods that impute (i.e., fill in) the values of items that are missing. Roth (1994) reported that imputation-based procedures have a number of advantages. First, imputation strategies save a great deal in terms of information over listwise deletion since an individual is not deleted from the analysis as a result of missing a small amount of information. Furthermore, the imputation strategies can save even more data than does pairwise deletion. The data ‘‘paired’’ with the missing data are also saved. Finally, the imputed data preserve deviation from the mean and the shape of the distribution. Thus, they will not attenuate correlations as much as weighing procedures. There are a variety of methodologies which have been developed in the literature for data imputation. The main methods of imputation discussed include mean imputation, hot deck imputation, cold deck imputation, regression imputation, stochastic regression imputation, composite methods, maximum likelihood, expectation maximization and multiple imputation (Little, Rubin, 1986; Efron, 1994; Roth, 1994; James, 1995; Fay, 1996; Rubin, 1996; Hedeker and Gibbons, 1997). In these methods, the missing values that are filled in can be analyzed by standard methods. There are several advantages to the imputation approach to handling missing data problems. The first major advantage which was discovered as a result of the literature review is that these methods tend to produce less biased estimates than simple MDTs such as listwise or pairwise deletion. The second major advantage of the imputation approach is that once the missing values have been filled in, standard complete-data analysis methods can be used on the entire dataset. The third major advantage of this approach is that in many cases the imputations can be created just once by the database administrator who may have much better information about and understanding of the process that creates missing data than the analyst. There are two types of imputation-based procedures as outlined in the literature. The first type is referred to as non-model based imputation procedures. The most commonly used procedure is known as mean imputation, where means from sets of recorded values are substituted. Mean imputation allows researchers to use the mean value of a variable in place of missing values for the same variable and is a very popular MDT used in current commercial analysis activities as described by Hawkins and Merriam (1991). Hawkins and Merriam further reported that while mean imputation preserves data and is easy to use, it also tends to attenuate variance estimates in statistical procedures. Furthermore, Donner (1982) reported

8
that analysts using mean imputation may also believe they have more degrees of freedom than is warranted since substituted means are not independent from other observations in the data. The second type of imputation-based procedures is referred to as model-based imputation procedures. Henley (1997) characterized model-based imputation procedures as being more flexible and less ad hoc than the other missing data procedures and used these as a starting point for his investigation of possible methods of reject inference. Henley (1997) also went on to classify extrapolation of the accepts which is a popular method of reject inference which uses information from the accepts to extrapolate the behavior of the reject population as a model-based procedure. These procedures can be further described in terms of two categories known as implicit or explicit model-based imputation approaches. Commonly used implicit model-based imputation procedures include hot deck imputation where recorded units in the sample are substituted and cold deck imputation, where a constant value from an external source, such as a value from a previous realization of the same sample, is substituted. Hot deck imputation is a popular MDT being currently used to address data quality issues in government statistical agencies and industry (Ford, 1983; Rizvi, 1983). A number of highly visible surveys have adopted hot-deck strategies. They include the British Census (Baker, Harris and O�Brien, 1989; Ford, 1983), Statistics Canada, (Rubin, 1987), Current Population Survey (Ford, 1983; Lillard, Smith and Welch, 1986), the Canadian Census of Construction (Ford, 1983), the U.S. Annual Survey of Manufacturers (Little, 1988), the National Medical Care Utilization and Expenditure Survey (Lepkowski, Landis and Stehouwer, 1987), and the U.S. Bureau of the Census. The main idea is that analysts should replace a missing value with an actual value from a similar case in the dataset. Hence, the eventual data set with the imputed values is termed ��hot�� because it is currently in use by the computer. ��Cold-deck�� imputation uses information from another data source that is not currently in use by the computer. Roth (1994) reported that proponents argue that hot-deck imputation tends to increase accuracy over simple MDT strategies because missing values are replaced by realistic values. Furthermore, these values are not just variable means that may distort variable distributions. Instead, the values preserve the distributional characteristics of the data because the categorization variables affect imputed values. Roth (1994) also discussed four disadvantages of using hot-deck procedures, which are summarized below. The first is the lack of theoretical or empirical work to determine the accuracy of the procedure. The second disadvantage is that the number of classification variables may become unmanageable in large commercial data warehouses. The third disadvantage is that categorization sacrifices information. Finally, the fourth disadvantage of using hot-deck procedures is that estimating standard error can be difficult. Despite these disadvantages, the literature review has shown that the hot deck MDT is very popular and despite a lack of theoretical research, most of the development stems from practical arguments to overcoming missing data problems in ��real world�� settings which makes it a very popular and intuitive MDT. Explicit model-based procedures are a broad class of methods generated by defining a model for the partially missing data and basing inferences on the likelihood under

9
that model, with parameters estimated by procedures such as maximum likelihood. Commonly used procedures in this category include regression imputation, where missing values are replaced by estimates of regression coefficient estimates based upon available data; and stochastic regression imputation, where missing values are replaced by a value predicted by regression imputation plus a residual, drawn to reflect uncertainty in the predicted value. Note that when using regression methods for imputation the resulting predictions are heteroscedastic because their variances are based on x variables. Maximum likelihood methods estimate parameters based on the available data, and then estimate missing units based on the parameters just estimated. The expectation maximization approach iterates through a process of estimating missing data and then estimating parameters. Composite methods combine ideas from different methods, such as hot deck and regression imputation combined by calculating predicted means from a regression but then adding a residual randomly chosen from the empirical residuals to the predicted value when forming values for imputation. Multiple imputation methods where more than one value is imputed for the missing items, is a method which allows valid estimates of the variance of estimates to be calculated using standard complete data procedures (DeSarbo, Green and Carroll, 1986; Rubin, 1987). Advantages of the explicit model-based approach are flexibility; the avoidance of ad hoc methods, and the availability of large sample estimates of variance based on the second derivatives of the log likelihood, which takes into account incompleteness in the data in those models. In addition to these advantages the assumptions underlying the resulting model-based methods can be displayed and evaluated (Rubin, 1987). Henley (1997) discussed the applicability of using model-based approaches in particular the (expectation maximization) algorithm as a missing data approach to the imputation of the rejects and concluded that the application of these techniques would not convey any advantage over simply constructing a scorecard using the accept sample. Using MDT terminology this would be equivalent to the recommendation that using a model-based imputation approach would not convey any advantage over listwise deletion. Model Based Imputation Approaches in Comparison with Listwise Deletion
Henley’s (1997) hypothesis on the equivalency of model based-approaches to listwise deletion for the imputation of missing credit performance data required in the reject inference context warrants further research since it challenges some of the MDT literature discussed in the former sections which convey an advantage to model based imputation from listwise deletion and other simple MDTs Therefore, a more extensive literature search was conducted on the comparison of the techniques in multiple contexts in order to derive a more stable knowledge base which will enable us to decide the direction of further research in this area. Roth (1994) reported that a growing number of researchers and practitioners are choosing to estimate missing data values based on other variables in the data set using regression techniques. Monte Carlo studies indicate that regression imputation strategies are more accurate than simple MDTs such as listwise deletion and mean
10
imputation (Beale and Little, 1974; Chan and Dunn, 1972; Chan, Gilman and Dunn, 1976). Roth (1994) reports that the drawback to regression imputation is that the imputed values may fall outside of the logical limits of the values for each variable. Regression imputation may also increase the factor structure clarity of the data matrix because estimated variables are functions of other variables, and they may slightly underestimate variance and covariance statistics. Finally, analysts using regression imputation must be concerned with the correct number of degrees of freedom. Maximum likelihood (ML) and the related expectation maximization algorithm (EM) approach are important departures from the ad hoc approaches to missing data discussed earlier (e.g. mean substitution). ML procedures allow explicit modeling of the imputation process that is open to scientific analysis and critique (DeSarbo, Green and Carroll, 1986; Graham, Hofer and MacKinnon, 1996; Hedeker and Gibbons, 1997). The various forms of ML estimates have generally proven to be more accurate than listwise deletion, mean substitution or regression imputation (Donner and Rosner, 1982, Lee and Chiu, 1990; Little, 1979). However, Donner and Rosner (1982) reported that differences can be small, and DeSarbo, Green and Carroll (1986) further reported that the distributional assumptions needed to use ML techniques are relatively strict. The EM algorithm (Dempster, Laird and Rubin, 1977; Laird, 1988; Ruud, 1991; Graham, Hofer and MacKinnon, 1996) is a similar approach to maximum likelihood. Typically, the first iteration involves estimating missing data and then estimating parameters using ML estimates as well as missing data estimates. The second iteration would require re-estimating the missing data based on the new parameter estimates and then recalculating the new parameter estimates based on actual and re-estimated missing data (Little and Rubin, 1986). This approach is repeated until there is convergence in the parameter estimates. Monte Carlo testing suggest that the EM approach produces less biased estimates than simple MDTs including listwise and pairwise deletion along with mean imputation (Malhotra, 1987; Azen, Van Guilder and Hill, 1989; Graham and Donaldson, 1993). Laird (1988) along with Little and Rubin (1986) reported that a primary drawback of using the EM algorithm is that it can take a long time to converge. Roth (1994) reported that another drawback of using the EM algorithm for the imputation of missing data is that the material explaining it is so complex that it is most suitable for statisticians or extremely adept quantitative researchers. The studies from the expanded literature review previously summarized overwhelmingly challenge the final conclusions of Henley (1997) that model-based imputation approaches do not convey any advantages to simply working with the accepts in reject inference applications. This challenge even held true with the use EM algorithm which was the specific MDT from which Henley derived his conclusions. From this extensive literature review on the topic it would appear that we can now conclude with some degree of confidence that the use of using model-based imputation procedures would indeed convey an advantage over simply working with the accepts in reject inference applications. Therefore, from the existing literature review it is proposed that further research is necessary in this area to provide similar evidence in a live reject inference application. In addition, further research is necessary to allow one to choose the right MDT technique from which to

11
conduct reject inference given the fact that there are many choices currently available to the credit scorecard developer.
Multiple Imputation Methods for Reject Inference
Given there are many choices in terms of imputation procedures outlined in the literature one may ask is for some guidance in choosing the appropriate model-based imputation procedure. Firstly, a distinction should be made between situations where the final product is data and where the final products are estimated coefficients and predictions. Where the final product is data this could represent public use datasets released by census bureaus and government organizations or multi-use business datasets e.g. monthly billing cycle extracts from a consumer finance company where several functions use the datasets for internal research. Rassler (2003) discusses importance of imputation for public use databases in the context of advances in data fusion. When it’s a dataset that will be used by another party other than the imputer then consideration must be taken to choose a procedure that doesn’t require complexity in conducting the final statistical analysis. Multiple imputation can be difficult in these situations while single imputation applications can be easier to understand and prevent improper use and interpretation at the final stages of the analysis. On the other hand if the imputation is being conducted by the researcher then he/she would want to maximize the accuracy of the statistical analysis by choosing the best technique given the constraints of the situation. Where the final products are estimated coefficients and predictions then choosing the appropriate technique to handle missing data during analyses is one of the most challenging decisions facing researchers (Saunders et al., 2006). Firstly, it is important for the researcher to identify any patterns to the missing data since this justifies the choice of imputation procedures used by the researcher (Schafer and Graham, 2002). Furthermore, understanding any patterns to the missing data will directly lead to the determination of whether the missing values are missing completely at random (MCAR), missing at random (MAR), or nonignorable. Knowledge of these missing data mechanisms are also extremely important to the determination of the appropriate imputation procedure. Second, since the various missing data procedures all have varying complexities the researcher must take into account the amount of time it will take to utilize a given technique. However Schafer and Graham (2002) point out that time shouldn’t be the only factor to consider since more advanced procedures like single and multiple imputation methods produced significantly higher levels of accuracy than simple techniques such as listwise deletion. Also, the percentage of missing data for each of the variables is important to consider as well. For instance, Schafer and Graham (2002) showed that the effectiveness of both simple and more complex missing data techniques was comparable with variables missing just 1% or 2% of the values. The researcher must also carefully consider the amount of missing values and whether the variable is to be used as a dependent or independent variable. Researchers are more likely to want to retain a dependent variable and therefore will be more inclined to accept higher levels of missing values and use more sophisticated

12
techniques to address the missingness. Finally, each method has its specific pros and cons which researchers must take into account when choosing the right imputation procedure for their study. For instance, while single imputation obviously has its advantage over non model based procedures such as mean imputation the major disadvantage of the single imputation procedures described in the previous section are that one imputed value cannot by itself represent any uncertainty about which value to impute. Hence, credit scoring reject inference applications that treat imputed reject values just like observed values will generally systematically underestimate uncertainty. Equally serious, single imputation cannot represent any additional uncertainty that arises when the reasons for the data being missing are unknown (Rubin, 1987; Rubin and Schenker 1991; Schafer, 1996). Rubin and Schenker (1991) showed that underrepresentation of uncertainty with single imputation can be a major problem. One of the most important recent contributions in the area of the analysis of multivariate incomplete data in recent years was first proposed by Rubin (1978, 1987) through the development of multiple imputation techniques to address this problem of missing data uncertainty. Rubin originally proposed multiple imputation to handle missing data in sample surveys. Researchers today, however, are beginning to use this technique in other application areas (Rubin and Schenker, 1991; Heitjan and Landis, 1994; Lavori, Dawson and Shera, 1996; Gomel et al., 1997, Noh, Kwak and Han, 2004, Frair et al., 2004). The use of multiple imputation as a missing data approach to the reject inference problem is one such new application area which can possibly provide a practical method for scorecard development in the future. Multiple imputation retains the three major advantages of single imputation and rectifies its major disadvantages by replacing each missing value with a vector composed of M ≥ 2 possible values. The vectors of imputations create an nmis x M matrix of multiple imputations, where nmis is the total number of missing values. Each column of this matrix is used to create a completed dataset, and so the multiple imputations lead to M completed datasets, each of which can be analyzed using statistical or data mining techniques that are appropriate when there are no missing values. For example, using standard complete-data methods, an analyst can obtain M estimates and their variance-covariance matrices or p values, which can then be combined to form a single inference under the model used to impute the missing values (Li, Raghunathan and Rubin 1991; Rubin and Schenker, 1991). Schenker, Treiman and Weidman (1993) reported that multiple imputation was developed and can be justified most easily from the Bayesian perspective. Let Yobs and Ymis denote the observed and missing values in a dataset respectively, and let Q denote the population quantity of interest. Suppose that, if the missing values were known, inferences would be in the form of a distribution for Q with density g(Q | Yobs,Ymis) (the ‘complete data posterior density’). Since the missing values are not known, however, a model must be fitted which predicts the missing values given the observed values. Suppose that this results in a posterior predictive density f (Ymis
| Yobs). The ultimate goal is to obtain the posterior density of Q (given the observed data), which can be expressed as

13
misobsmismisobsobs dYYYfYYQgYQh )|(),|()|( ∫= (1)
Equation 1 shows that the posterior density of Q can be obtained by averaging the complete data posterior density over the predictive distribution of the missing values. Thus, one way to compute h(Q | Yobs) (say, at a particular value of Q0) would be to draw values of Ymis repeatedly from f (Ymis | Yobs), to calculate g(Q0 | Yobs,Ymis) separately for each draw and then average the values. In principle, multiple imputations are repeated draws from the predictive distribution of Ymis under the posited model for the missing data. Hence, multiple imputation allows the data analyst to approximate the above equation by analyzing the completed dataset under each draw and then combining the analyses (Schenker, Treiman and Weidman 1993). The exact computation of the above equation by simulation would require the following: 1. An infinite number of draws of Ymis from its predictive distribution. 2. The calculation of g(Q0 | Yobs,Ymis) for every value Q0. An approximation to the above equation is given by Rubin and Schenker (1986) for use with only a small number of imputations of Ymis . Rubin (1987) reported that multiple imputation shares with single imputation the ability to reduce bias over simple MDTs, uses complete-data methods of analysis and has the ability to incorporate the data collector’s knowledge. In fact, Rubin (1987) further reported the latter benefit just mentioned is not only retained but enhanced because multiple imputations allow data collectors to use their knowledge to reflect uncertainty about which values to impute. This uncertainty is of two types: sampling variability assuming the reasons for nonresponses are known and variability due to uncertainty about the reasons for nonresponse. In addition to multiple imputation’s ability to retain the advantageous characteristics of single imputation, Rubin (1987) reported three extremely important advantages over single imputation. First, when imputations are randomly drawn in an attempt to represent the distribution of the data, multiple imputation increases the efficiency of estimation. The second distinct advantage of multiple imputation over single imputation is that when the multiple imputations represent repeated random draws under a model for nonresponse, valid inferences-that is, ones that reflect the additional variability due to missing values under that model-are obtained by combining complete-data inferences in a straightforward manner. The third distinct advantage of multiple imputation is that by generating repeated randomly drawn imputations under more than one model, it allows the straightforward study of the sensitivity of inferences to various models for nonresponse simply using complete-data methods repeatedly. Li, Raghunathan and Rubin (1991) reported that the practical payoffs from using multiple imputation are that (1) only standard complete-data analysis techniques need to be used to analyze each completed dataset and (2) satisfactory multiple imputations can often be created relatively easily.

14
A fairly substantial literature, both theoretical and applied, now supports the efficacy of multiple imputation. Rubin (1980), Herzog and Rubin (1983), Heitjan and Rubin (1986), Rubin and Schenker (1986, 1987), and Glynn, Laird and Rubin (1986) developed, illustrated, and evaluated procedures for scaler parameters. Rubin (1987), Treiman, Bielby and Cheng (1988), and Schenker, Treiman and Weidman (1983) considered multiparameter situations. Li, Raghunathan and Rubin (1991) developed procedures for computing significance levels from datasets whose missing values have been multiply imputed. Wei and Tanner (1991) and James (1995) developed and evaluated approximation methodologies to analyze censored regression data. Meng (1994) reviewed and explored multiple imputation inferences with uncongenial sources of input. Rubin (1996) provided an overview of some of the developments in multiple imputation since he originally introduced the concept and compared it with competing methods such as single imputation, multiple imputation with analysis other than repeated-imputation inference and weighting methods. Schafer (1996) developed and described new computational algorithms and software, which allows analysts to create proper multiple imputations in complex multivariate settings. In the applied research area, several complex applications of multiple imputation have been conducted on U.S. Census databases. Clogg et al. (1991) developed methods to create a new Census database that can be used to study comparability of industry and occupation classification systems. Also, Schenker, Treiman and Weidman (1993) described a project in which multiple imputation was used to recalibrate industry and occupation codes in 1970 U.S. census public use samples to the 1980 standard. In the applied research area of survey sampling Montalto and Sung, (1996) discovered that multiple imputation accounted for the extra variation due to missing data in the analyses resulting from the 1992 Survey of Consumer Finances. They concluded that inference on this survey from single imputation techniques ignored the extra variability due to missing values and risks misrepresenting the precision of estimates and the significance of relationships. Gelman, King and Liu (1998) performed a comparison of available-case and multiple imputation analysis and showed a marked improvement in the interpretation and results of political polling research using multiple imputation as opposed to available case analysis. Similarly, in the area of political survey research, King et al. (1998) showed that multiple imputation contributed to an efficient way of using about 50% more information in the data than are currently used by political scientists using traditional methods of analyzing incomplete multivariate data. In the medical research area, Rubin and Schenker (1991) provided an overview of multiple imputation in health-care databases. Also, Heitjan and Landis (1994) developed a multiple imputation approach to assess secular trends in blood pressure in the presence of incomplete multivariate data. Lavori, Dawson and Shera (1996) developed a multiple imputation strategy for clinical trials with truncation of patient data. Finally, Fogarty (2000) applied multiple imputation techniques in a commercial data warehousing environment in an effort to improve data mining activities in consumer financial services firms. Alternative approaches to multiple imputation for creating proper imputations, have been proposed by several researchers (Rao and Shao, 1992; Kong, Liu and Wong, 1994; Liu and Chen, 1995; Fay, 1996 and Davidian, Tsiatis and Leon, 2005). These

15
alternative approaches are not supported by substantial literature, both theoretical and applied, which now supports the efficacy of multiple imputation and which has been summarized in the preceding two paragraphs. In addition, some of these alternative approaches are either more difficult to implement than multiple imputation or prove to be accurate only under very restrictive conditions. Finally, Meng (1994) reported that while some of these new perspectives are refreshing and may provide a stimulus for methods in certain applications, they seem to move opposite to the direction of the literature on multiple imputation. The theoretical and empirical results of multiple imputation presented in literature review above show that multiple imputation techniques have some clear advantages over single imputation. It has also been shown in extended literature review in the previous section that model-based imputation techniques used in credit scorecard reject inference applications will provide some advantage over the popular method of simply working with the accepts. The combined results of the previous two sections suggest that further research needs to be conducted to test the hypothesis that multiple imputation applied to the reject inference problem in credit scoring can provide an advantage over single imputation. The next few sections will empirically explore this hypothesis.
AN APPLICATION/CASE STUDY
Sampling and Research Methodology
This sample used in this research study was developed by collecting data at random from a large German consumer finance company attempting to rebuild an application scorecard for their closed-end home equity loan product. The type of data sampled included accepts and rejects from the businesses application data and an associated credit performance variable from the behavioral data. Application data is derived from applying for credit and investment products and includes such things as age, length of residence age and gender. Behavioral data is related to credit performance and includes such things as balance delinquency, and payment. The application data is gathered by the firm’s numerous branches located throughout Germany. The behavioral data is created on the receivable system as a result of the customers’ transactions. A total of 2142 accepts and 440 rejects were sampled
Ethical Considerations

16
The most important ethical consideration in this study is related to customer privacy and data protection. This issue specifically relates to work, that deals with traceable individual data records. The countries in the European Economic Union including Germany have already adopted regulations, which relate directly to anyone working on credit scoring in general. These regulations cover such aspects as the openness of records to individual scrutiny and the fairness and legality with which the data is collected. And perhaps the most important for credit scoring, the requirement to specify in advance the purpose for which data is collected and to restrict usage to that specific purpose. The attitude and policies directed toward customer privacy and data protection in the United States, have up to now, been less conservative than in Europe. However, recently public opinion has begun to shift due to the widespread use of the Internet and the implications for invasions of customer privacy (Stephanek, 2000, Green et al, 2000). In order to comply with these regulations for the purposes of this study all personal information was removed from the samples to insure compliance with data protection regulations based on legal approval which was obtained in the home country. The multiple imputation programs were written using the SAS programming language and the SAS macro facility. The custom programs were appropriately named I.M.I.S.S. Intelligent Multiple Imputation Software System and can be requested through e-mail by contacting the author directly. These programs conduct multiple imputation on SAS data warehouses using logistic regression and can be run on any SAS data warehouse supporting the SAS enterprise Miner module.
The Missing Data Mechanism
Every analysis and usage of missing-data methods must make some largely untestable statistical assumptions about the manner in which missing values were lost. These mechanisms were discussed in detail in a previous section. In a reject inference application one already knows why the data was lost (e.g. applicants were rejected). The real question here is whether or not the missing credit performance indicator is ignorable. This study assumes that the missingness mechanism is ignorable, as defined by Rubin (1987). Another, essentially equivalent term for this is the missing at random (MAR) assumption (Rubin, 1976; Little, Rubin, 1987). MAR was an assumption made in this analysis since it satisfied the criteria that a set of characteristics Z available for building new scorecards includes all the characteristics from the set X used to make the original accept/reject classification. Therefore, the probability of response depends on the set of characteristics Z alone and not on the response.

17
The Imputation Strategy The overall goal of the imputation strategy in this study is to infer the rejects when developing a consumer credit scorecard, relying on the assumption that the rejected population in the sample does not depend on the accepts. There are basically two standard approaches to choose for imputing data within the multiple imputation procedure. The first approach relies on implicit models that define collections of accepts who are ‘‘close’’ to each reject and thereby returns to imputation methods for univariate Yi. The second approach builds explicit statistical models for the conditional distribution of Yi; given Xi such as a normal linear regression model, and creates imputations based on the model. Nonparametric regression techniques can often be viewed as falling between matching methods as parametric regression approaches (Rubin, 1987). In this study an implicit modeling approach to the multiple imputation of data was chosen for several reasons. Firstly, the key practical issue with the explicit modeling approach is defining the global model for Pr (Yi|Xi) to be accurate locally. In particular, suppose Pr (Yi|Xi) specifies that univariate YI, has a linear regression on univariate Xi, but in fact log (Yi) has a linear regression on Xi; the linear approximation can be a decent global approximation, accounting for a large proportion of the variance of Y due to X, but still can create less accurate imputations than an implicit model that matches on X. Second, hot deck imputation methods as described in earlier sections are an implicit modeling approach and are currently the preferred choice of models for the single imputation of missing data used in government, industry and academia. This fact when combined with the findings by Fogarty and Blake (2002) which showed a gap in the current literature on the widespread use more sophisticated techniques for the imputation of missing data, led to the conclusion that a modeling approach to multiple imputation which resembled approaches that are frequently used with single imputation (e.g. hot deck) were more likely to be implemented by practitioners. The choice to use an implicit modeling approach for imputation in this study has led to a technical difficulty in that a key issue with implicit modeling methods is defining ‘‘close,’’ since with high-dimensional Xi and a modest number of respondents, the closest available Xi according to one metric (i.e. definition of closeness) may be very far away with respect to another definition, and in particular with respect to the distribution of Yi given Xi (Rubin, 1987). Furthermore, the technical difficulty just described is directly related to fulfilling the key requirement of an imputation model being able to being able to preserve important aspects of the data distributions and also to preserve important relationships in the data as defined by Schafer (1998). There was a second technical difficulty which needed to be overcome when making the final choice on a multiple imputation approach which is related choosing those which can be classified as yielding Bayesian proper results. Certain properties of the simulated values of Ymis are required to enable multiple

18
imputations to yield valid inferences. Proper multiple imputations are defined by Schafer (1998) as those which are drawn for distributions possessing these properties. Proper as defined by Rubin (1987) means that the summary statistics
UQ , and B, yield approximately valid inferences for the complete-data statistics Q� and U over repeated realizations of the missing-data mechanism. Schafer (1998) describes the three conditions which are necessary for imputations to be proper under Rubin’s definition: -
1. As the number of imputations becomes large, ( ) BQQ /�− should become approximately N (0, 1) over the distribution of the response indicators R with Y held fixed.
2. As the number of imputations becomes large, U should be a consistent
estimate of U, with R regarded as random and Y regarded as fixed. 3. The true between-imputations variance (i.e. the variance of Q over an infinite number of multiple imputations) should be stable over repeated samples of the
complete data Y, with variability lower than that of .�Q Rubin (1987) showed that if the complete-data inference based on Q and U is valid over repeated samples, and the imputation method is proper, then the multiple imputation will yield inferences that are valid from a purely frequentist standpoint. Schafer’s (1998) definition of proper multiple imputations are a variant of Rubin’s definition previously described. Schafer considers multiple imputations to be Bayesianly proper if they are independent realizations of ( )obsmis YYP | , the posterior predictive distribution of the missing data under some complete-data model and prior. Note that ( )obsmis YYP | can be written as:
( ) ( ) ( ) ,||| , θθθ dYPYYPYYP obsobsmisobsmis ∫= (2)
the conditional predictive distribution of Ymis given θ , averaged over the observed-data posterior of θ. Bayesianly proper multiple imputation as described by Schafer thus reflects uncertainty about Ymis given the parameters of the complete-data model, as well as uncertainty about the unknown model parameters. In order to solve these technical difficulties it was decided to use a multiple imputation approach known as the approximate Bayesian bootstrap approach which has been applied successfully to clinical trials in the medical research field by Lavori, Dawson, and Shera (1996). This approach to the multiple imputation of missing data uses the approximate Bayesian bootstrap to draw ignorable repeated imputations from the posterior predictive distribution of the rejected population stratified by a balancing or propensity score for the accepts versus the rejects.

19
Other methods of multiple imputation currently in use include data augmentation and Markov Chain Monte Carlo Methods (MCMC). For instance, Rubin (2003) describes a method using MCMC methods and nested multiple imputations which is easily illustrated in the case of three variables A, B and C. We begin by filling in all missing B and C values. Then, fit a model of A|B, C using those units where A is observed, and impute the missing A values. Next, toss the imputed B values and fit the model of B|A, C, using those units where B is observed, and impute the missing B values. Next, toss the imputed C values, and fit a model of C|A, B using units where C is observed, and impute missing C values. Iterate. Rassler (2003) also introduced a non-iterative Bayesian based multiple imputation procedure which is particularly suited for situations with a smaller percentage of rejects as compared to the larger population of accepts. Integrating these new techniques into reject inference for consumer credit scoring is a subject for further research.
Multiple Imputation Model in Operation The task of imputing the reject data begins with a temporary variable which will be created and will be used as the dependent variable in a logistic regression model. The temporary variable will equal 0 for every reject and will equal 1 for the accepts. The independent variables for the model will be a set of baseline/fixed covariates from the application data, which are thought to be related to the credit performance variable we are imputing. Moving forward the credit performance variable for the rejects will be referred to as missing and the same variable for the accepts will be referred to as the observed. The model will facilitate the modelling of the missingness using the observed data. Using the coefficients or weights, the propensity that a subject would have a missing value in the variable in question is calculated. In other words, this propensity score is the conditional probability of missingness, given the vector of observed covariates. If the regression does not converge, it is usual to use the values of the previous period or of a baseline covariate as the propensity score. Next, the data will be divided into groups based on quintiles of the propensity score. Quintiles are a set of five values, which divide the total frequency of a variable into five equal parts. Within each quintile, we count the number of observed and missing values of the target variable. Next, a random sample is drawn with replacement, from the observed responses in the propensity quintile, equal in size to the number of observed data. This creates a posterior predictive distribution of the variable of interest. A second random sample is then drawn, with replacement, equal in size to the number of missing values in the quintile, and this second random sample is then used to fill in the missing values. This whole process will be repeated 5 times so that the result is 5 complete datasets, where the multiple imputations are independent repetitions from the posterior predictive distribution of interest. The choice to repeat the process 5 times is based on Schafer and Olsen (1998) who showed that multiple imputation can be highly efficient for even small values of m. Schafer (1998) showed that the

20
efficiency of an estimator based on m is (1 + γ/m)-1, where γ is the fraction of missing information.
Results The central theme for testing and validating this reject inference multiple imputation model will be based on the work of Rubin (1996), Schafer (1998) and Fogarty (2000). As stated previously, Rubin concluded that judging the quality of missing data procedures by the ability to recreate the individual missing values (according to hit-rate, mean square error, etc.) does not lead to choosing procedures that result in valid inference, which is the objective of this study. Schafer concurred with Rubin stating that the goal of imputation modeling should not be to predict the missing values with the greatest accuracy or to describe the data in a scientifically meaningful way. Schafer concluded that the goal of imputation modeling should be to properly reflect uncertainty, to preserve important aspects of the data distributions and also to preserve important relationships. Based on this theoretical work of Rubin and Schafer and the practical work of Fogarty the tests used in this study were designed to measure and compare the reject inference imputation method’s ability to properly reflect uncertainty, to preserve important aspects of data distributions and also to preserve important relationships. There were several tests chosen for use in this research to assess the ability of the reject inference multiple imputation models to allow the credit score developers to conduct valid inferences. The first test will be to assess and compare the segmentation power of the logistic regression propensity models developed for propensity score stratification. This will be referred to as Propensity Score Performance Test. The idea behind this test is based upon the assumption that a model with an acceptable segmentation or ‘balancing’ power according to the propensity score will likely be able to preserve important aspects of the data distributions and also to preserve important relationships under Schafer’s (1998) goal of imputation modeling. The theory for this assumption stems from the work on propensity score segmentation completed by Rubin and Rosenbaum (1983, 1985) The second test will assess the ability of the reject inference imputation model to properly reflect uncertainty. This will be referred to as the Imputation Variability Test. This test was designed to address Schafer’s (1998) first requirement of an imputation model being able to properly reflect uncertainty. The central idea of these tests were to develop actual credit scores using reject inference which are examples of those typically used in the risk management within the consumer financial services industry. Logistic regression was the modeling technique chosen

21
to develop the models due to its popularity within the consumer financial services industry and the fact that the credit performance outcome was dichotomous. The individual models developed with the rejects inferred using the multiple imputation algorithm are then combined using Rubin’s (1993) method of combining imputations under multiple imputation. The models from the five imputations along with the combined multiple imputation model, will then be scored on the validation datasets and then will be plotted on a model performance graph to compare their performance. Performance will by the models ability to segment the risk outcome. Any differences in the performance of the models on the validation datasets can then be assessed and analyzed. The expectation from this test was that quantitative differences in estimates derived from single imputed financial services datasets will misrepresent the magnitude variability and statistical significance of the parameters in these models and that rejects inferred using multiple imputation can properly reflect uncertainty when analyzing data with rejects. Overall, these tests when viewed as a whole will provide evidence for the hypothesis that multiple imputation applied to the reject inference problem in credit scoring can provide an advantage over single imputation. In addition, they will test whether applying multiple imputation to the reject inference problem in credit scoring can achieve the imputation goal by being able to properly reflect uncertainty, preserve important aspects of the data distributions and also to preserve important relationships in the data.
Analysis of the Rejects Table 1 provides an analysis of the rejects for the closed-end loan product in Germany. In Germany, the approval rate on this product is near 80% therefore the sample of rejects to accepts has been stratified to represent this ratio. The total number of observations in the dataset is considered generally considered acceptable in the industry for single scorecard development. A larger dataset would need to have been chosen had one intended to make several segmentation splits using multiple scorecard technology.
Table 1 Analysis of Rejects From the German Closed-End Loan Product
Variable Name
Description Number Observe
d
Number Missing
% Rejects
Reasons for Missing
Chargeoff Chargeoff Flag 2142 440 20% Scoring Rejects
22
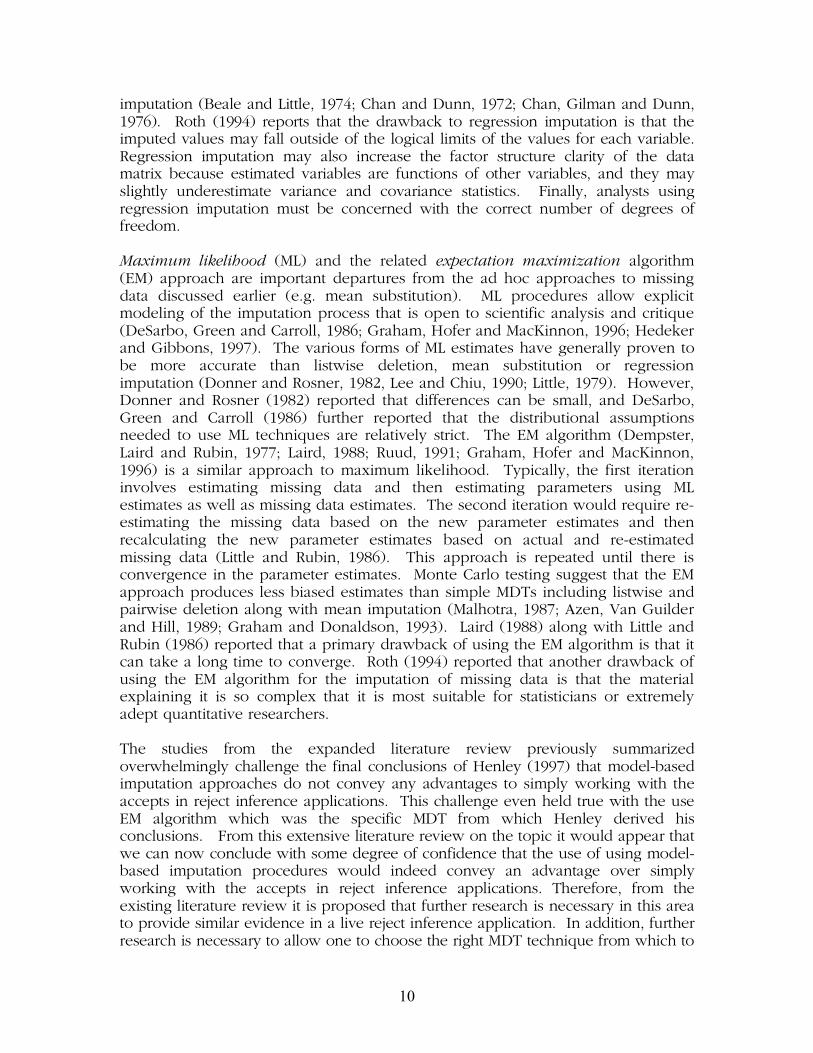
Logistic Regression Propensity Score Performance Test Results
Table 2 is the result of the Propensity Score Performance Tests for the logistic regression propensity score developed to impute the German rejects. The KS at 50.4 is significant at the .05 level. The Chi-square value at 647.82 is also significant at the .05 level. The overall Gini value of .8003 provides evidence of a good level of separation between the rejected and the accepted data throughout the entire range of the propensity score through a Gini coefficient value of .3003. The larger the Gini coefficient, the higher degree of dispersion there is between the two groups (accepts and rejects) according to the propensity score. The information value based tests including the overall and info odds along with the weight of evidence also show a large degree of systematic variation in their values by decile. For instance, the weight of evidence at the first decile is –2.276 versus 1.210 at the fifth decile and 1.529 at the tenth decile. This provides further evidence that the propensity score is segmenting the data on the rejects and the accepts according to the score deciles. Finally, the Lorentz curve in Figure 1 also shows a good level of separation with 75% of the rejected values on a cumulative basis being predicted by the top 25% of propensity scores. Basically, the further the Lorentz curve from the baseline, the greater the segmentation power of the propensity score. Based on the evidence from these tests, the null hypothesis (H0) that there is no difference in the logistic regression propensity score’s ability to segment the accepts versus the rejects on the German financial services data is rejected. This provides the needed evidence that the data is not missing completely at random and therefore justifies the use of model-based imputation techniques as a missing data approach to reject inference on consumer credit scoring applications. In addition, this test also shows evidence that this technique is able preserve important aspects of the data distributions and also to preserve important relationships under Schafer’s (1998) goal of imputation modeling. Based on the evidence from this test which also agrees with the extensive literature on missing data imputation one would find evidence to the contrary of the final conclusions put forth by Henley (1997) that model-based imputation approaches do not convey any advantages to simply working with the accepts in reject inference applications. Based on this new evidence and the extensive literature review on the topic discussed earlier it would appear that one can now conclude with a great degree of confidence that the use of using model-based imputation procedures would indeed convey an advantage over simply working with the accepts in reject inference applications.

23
TABLE 2 Propensity Score Performance Statistics: Logistic Regression Model
Developed on the German Data

24
Figure 1

25
Imputation Model Variability Tests for Germany
Since the extensive literature review and new evidence presented above gives us an increased level of confidence in using model-based imputation procedures for reject inference applications further research is now proposed based on additional gaps in the existing literature. This research will address the process of choosing the right MDT technique from which to conduct reject inference given the fact that there are many choices available to the credit scorecard developer. The hypothesis being put forth based on the evidence derived from the existing literature is that multiple imputation as opposed to single imputation models is the MDT technique which credit score developers should use to achieve superior results in their reject inference applications. A home equity installment loan application model was used to test the multiple imputation model’s ability to capture imputation variability in a multivariate framework in the German business. This model is typical of those developed and used in Germany and elsewhere to assess the future credit risk of existing customers who are applying for a closed-end loan. Every applicant typically gets a score and this score is used to make an accept/ reject decision on whether or not the customer should receive the loan. Usually this decision is usually made at the branch or point of sale. The dependent variable is binomial. Bads were defined by identifying anyone over 90 days delinquent over an 18 month time period while goods were defined as anyone less than 30 days over the same 18 month period. Indeterminates were defined as people from 30-90 days delinquent over the same time period and were excluded from the model development because their behavior cannot be specifically classified from a risk perspective. The independent variables were application data provided from the accepted and rejected applicants and extracted from the German data mart. The rejects were inferred using the multiple imputation model developed for this study. Figure 2 shows the predicted level of losses by score percentile. These losses are weighted to a level typical of that expected for this type of product in Germany. Note the difference between Imputation 5 and Imputation 4 in predicted level of losses is 4.01% at the tenth decile. Note also that difference between Imputation 1 and Imputation 4 in predicted level of losses is 1.58% at the seventh decile. This is in contrast to the difference in predicted level of losses between Imputation 2 and Imputation 4 in the sixth decile, which is only .061%. The multiple imputation estimate is generally the average between the values predicted from the individual imputation estimates. This serves to account for the increased level of variation, which can occur in a single imputation paradigm. This analysis provides evidence as to the capability of the multiple imputation model’s ability to capture imputation variability in a reject inference application. This analysis clearly show evidence that one can derive different conclusions based on the variation due to missing

26
data when using single imputation. This analysis also shows in a credit scorecard decision setting that when stable predictions are desired, then multiple imputation should always be used as a missing data approach to reject inference.

27
Figure 2

28
CONCLUSIONS
This work represents an original and unique contribution to the literature in that it expands upon the preliminary work of Henley (1997) who first suggested the use of missing data approaches for reject inference on consumer credit scorecards. The expanded literature review conducted in this study overwhelmingly challenged the final conclusions of Henley (1997) that model-based imputation approaches do not convey any advantages to simply working with the accepts in reject inference applications. Based upon the disagreement between Henley’s preliminary conclusions and the extended literature review a quantitative analysis was conducted to provide evidence to the hypothesis that using model-based imputation procedures would indeed convey an advantage over simply working with the accepts in reject inference applications. Evidence from these tests conducted in the analysis justified the use of model-based imputation techniques as a missing data approach to reject inference on consumer credit scoring applications. In addition, these tests also showed evidence that that the multiple imputation technique which was selected for this study based on the recommendations derived from the literature review was able to preserve important aspects of the data distributions and also to preserve important relationships under Schafer’s (1998) goal of imputation modeling. Based on the results from this study which also agrees with the extensive literature on missing data imputation evidence was found contrary to the final conclusions put forth by Henley (1997) that model-based imputation approaches do not convey any advantages to simply working with the accepts in reject inference applications. Based on this new evidence and the extensive literature review on the topic discussed earlier it would appear that scorecard developers can now conclude with a great degree of confidence that the use of using model-based imputation procedures would indeed convey an advantage over simply working with the accepts in reject inference applications on consumer credit scorecards. It was also demonstrated from the imputation model variability tests that scorecard developers can derive different model results based on the variation due to the missing data inference when using single imputation for reject inference. Furthermore, the analysis showed that the multiple imputation estimate is generally the average between the values predicted from the individual imputation estimates. One can conclude from this evidence that in a credit scorecard decision setting that when stable predictions are desired, then multiple imputation should always be used as a model-based missing data approach to reject inference in consumer credit scoring applications. One possible limitation of this research is that there is no comparison versus other reject inference techniques in terms of loss performance over time. The study concludes that model-based multiple imputation should be used as a whenever someone is applying a missing data approach to reject inference due to the fact that rejected data is not missing completely at random (MCAR) and also due to the fact that multiple imputation is able to capture imputation variability and therefore

29
insure more stable predictions, however, there is a need to compare the effectiveness of reject inference techniques on actual losses. This important analysis was beyond the scope of this introductory research into the use of multiple imputation for reject inference but is a suggestion for further research.
In addition, further research is necessary to allow one to choose the right multiple imputation technique from which to conduct reject inference given the fact that there are many choices currently available to the credit scorecard developers. Further research can also be conducted at properly integrating multiple imputed datasets of the rejects and accepts into some of the traditional credit scoring development techniques such as fine classing and course classing. Research in this area would provide scorecard developers with guidance as to how to properly incorporate this technique into the scorecard development process. Further research can also be conducted to compare the relative efficiencies of the Bayesian approach to imputation and other model-based imputation procedures. This idea could be extended to reject inference applications and even into an overall Bayesian approach to credit scoring which has yet to be explored. Finally, this study should be expanded in the future to include the imputation of missing data in behavioral scoring applications which will serve to improve the overall quality of these tools when used in making decisions on existing accounts applications such as credit line increase programs or shadow limit authorizations. Research in this area is extremely beneficial in order to allow credit scorecard developers to have the knowledge to treat reject inference as a science instead of the traditional approach of treating as something of an art, or worse, ignoring the problem completely. The benefits to consumer financial service firms is that they will begin to see tangible improvements in their top line results in terms of an improvement in acceptance rates and also improvements in the bottom line due to reductions in contractual credit losses and bankruptcies due to better decision tools. Furthermore, consumers of financial services products will benefit directly from this research due to the fact that the better credit quality customers will no longer have to subsidize the cost of credit losses due to inefficient risk management tools and all consumers will have a greater choice and access to consumer lending products in the marketplace. Finally, this research will also be beneficial to other industries given the recent expansion of scoring technologies to other business applications such as insurance underwriting (Banham, 2003; Imbriaco, 2005).

30
REFERENCES
Afifi, A. A., and Elashoff, R. M. (1966) Missing Observations in Multivariate Statistics I: Review of the Literature, J. Am Statist. Assoc. 61, 595-604. Altaman E. I. (1968) Financial Ratios, Discriminant Analysis and the Prediction of Corporate Bankruptcy. The Journal of Finance, Sept. Apilado V.P., Warner D.C. and Dauten, J.J. (1974) Evaluative Techniques in Consumer Finance – Experimental Results and Policy Implications. Journal of Financial and Quantitative Analysis, March. Azen S., P., Van Guilder M., Hill M., A. (1989) Estimation of Parameters and Missing Values Under a Regression Model with Non-Normally Distributed and Non-Randomly Incomplete Data, Statistics in Medicine, vol. 8, pp. 217-228. Baestaens D.E (1999) Credit Risk Modeling Strategies: The Road to Serfdom? International Journal of Intelligent Systems in Accounting, Finance and Management, 8(4), pp. 225-251. Baker K., Harris P., O’Brien J. (1989) Data Fusion: An Appraisal and Experimental Evaluation, Journal of Market Research Society, vol. 31, pp 153-212. Banham, R. (2003) Scoring Points, Reactions, vol. 23(12), pp. 23-24. Beale E., M., Little R., J. (1975) Missing Values in Multivariate Analysis, Journal of the Royal Statistical Society, Series B, vol. 37, pp. 129-145. Bernaards, C., A., Sijtisma, K. (2000) Influence of Imputation and EM Methods on Factor Analysis When Item Nonresponse in Questionnaires is Nonignorable. Multivariate Behavioral Research. 35 (3) 321-364. Blackwell, M. and Sykes, C. (1992) The Assignment of Credit Limits With a Behavioral Scoring System. IMA Journal of Mathematics Applied in Business and Industry. 4 (1). Blum, M. (1974) Failing Company Discriminant Analysis. Journal of Accounting Research, Spring. Boyle, M., Crook, J.N., Hamilton R. and Thomas, L.C. (1992) Methods of Credit Scoring Applied to Slow Payers. In Proceedings of the IMA Conference on Credit Scoring and Credit Control, ed: Thomas, L.C., Crook, J.N. and Edelman, D.B. 75-90. Clarendon Press, Oxford.

31
Chan L., S., Dunn O., J. (1972) The Treatment of Missing Values in Discriminant Analysis-I: The Sampling Experiment, Journal of the American Statistical Association, vol. 67, pp. 473-477. Chan L., S., Gilman J., A., Dunn O., J. (1976) Alternative Approaches to Missing Values in Discriminant Analysis, Journal of the American Statistical Association, vol. 71, pp. 842-844. Chan, Chandler, G. C., Coffman J.,Y. (1979) A Comparative Analysis of Empirical vs. Judgmental Credit Evaluation. Journal of Retail Banking, vol. 1 no.2, pp. 15-25. Chandler, G. C., Coffman J.,Y. (1983/4) Applications of Performance Scoring of Accounts Receivable Management in Consumer Credit. Journal of Retail Banking 5(4), pp. 1-10. Chang, B., Fung, R., Lucas, A., Oliver, R. and Shikaloff, N. (2000) Bayesian Networks Applied to Credit Scoring. IMA Journal of Mathematics Applied in Business and Industry, 11(1), pp. 1-18. Chatterjee, S., Barcun, S. (1970) A Nonparametric Approach to Credit Screening. Journal of American Statistical Association, vol. 65 no. 329, pp. 150-154. Clogg C., C., Rubin D., B., Schenker N., Schultz B., Weidman L. (1991) Multiple Imputation of Industry and Occupation Codes in Census Public-use Samples Using Bayesian Logistic Regression, Journal of the American Statistical Association, vol. 86, no. 413, pp. 68-78. Crook J.N., Hamilton, R. and Thomas, L.C. (1992) A Comparison of Discriminators Under Alternative Definitions of Credit Default. In Proceedings of the IMA Conference on Credit Scoring and Credit Control, ed: Thomas, L.C., Crook, J.N. and Edelman, D.B. pp. 217-245. Clarendon Press, Oxford. Dempster, A. P., Laird, N. M., and Rubin D. B. (1977). Maximum Likelihood From Incomplete Data Via the EM Algorithm (with discussion), J. Roy. Statist. Soc. B39, 1-38. DeSarbo W., S., Green P., E., Carroll J., D. (1986) Missing Data in Product-Concept Testing, Decision Sciences, vol. 17, pp. 163-185. De Veaux R., D., Hand D., J. (2005) How to Lie With Bad Data, Statistical Science, vol. 20, pp. 231-238. Donner A. (1982) The Relative Effectiveness of Procedures Commonly Used in Multiple Regression Analysis for Dealing with Missing Values, The American Statistician, vol. 36, pp. 378-381.

32
Donner A., Rosner B. (1982) Missing Value Problems in Multiple Linear Regression With Two Independent Variables, Communication in Statistics, vol. 11, pp. 127-140. Doreen, D.D. and Farkhoomand, F. (1983) A Decision Model for Small Business Loans. Journal of Small Business (Canada), Fall. Durand, D. (1941) Risk Elements in Consumer Installment Financing. Financial Research Program, Study 8, National Bureau of Economic Research. Edelman, D.B. (1992) An Application of Cluster Analysis in Credit Control. IMA Journal of Mathematics Applied in Business and Industry 4(1), pp. 81-88. Edminster, R.O. (1972) An Empirical Test of Financial Ratio Analysis for Small Business Failure Prediction. Journal of Financial and Quantitative Analysis, March. Efron, B. (1994) Missing Data, Imputation, and the Bootstrap. Journal of the American Statistical Association. (89), pp. 426-463 Eisenbeis, R.A. (1978) Pitfalls in the Application of Discriminant Analysis in Business, Finance and Economics. Journal of Finance 32(3), pp. 875-900. Fay, R.E. (1996) Alternative Paradigms for the Analysis of Imputed Survey Data. Journal of the American Statistical Association. (63) 1996 pp. 223-231. Fogarty (2000) Intelligent e-Imputation: A New Methodology For Data Quality Management of Commercial Data Warehousing Applications Using Artificial Neural Networks To Support The Critical Role of Business Intelligence in e-Business, Unpublished Ph.D. dissertation, Leeds Metropolitan University. Fogarty, D., Blake J. (2002) Utilizing Recent Advancements in Techniques for the Analysis of Incomplete Multivariate Data to Improve the Data Quality Management of Current Academic Research, Journal of Quantity and Quality 36(3), pp. 277-289. Fogarty, T.C. and Ireson, N.S. (1993/4) Evolving Bayesian Classifiers for Credit Control – a Comparison With Other Machine Learning Methods. IMA Journal of Mathematics Applied in Business and Industry 5(1), pp. 63-75. Ford B., L. (1983) An Overview of Hot-Deck Procedures, In Madow, Olkin And Rubin (Eds.), Incomplete Data in Sample Surveys, Vol. III: Theory and Bibliographies, (pp.185-207), New York: Academic Press. Frar, J., L., Nelson, S., F., Merril, E.,H., Lele, S., R., Boyce, M., S., Munro, R., H., Stenhouse, G.,B., Beyer, H., L. (2004) Removing GPS Collar Bias in Habitat Selection Studies. Journal of Applied Ecology (41), pp. 201-212.
33
Gilley O., W., Leone R., P. (1991) A Two-Stage Imputation Procedure for Item Nonresponse in Surveys, Journal of Business Research, vol. 22, pp. 281-291. Glynn R., Laird N., Rubin D., B. (1986) Selection Modeling Versus Mixture Modeling With Nonignorable Nonresponse, in Drawing Inferences form Self-Selected Samples, ed. H. Wainer, New York: Springer-Verlag, pp. 119-146. Gomel M., K., Oldenburg B., Simpson J., M., Chilvers M., Owen N. (1997) Composite Cardiovascular Risk Outcomes of a Work-Site Intervention Trial, American Journal of Public Health, vol. 87, pp. 673-676. Grablowsky, B.J. and Talley, W.K (1981) Probit and Discriminant Functions for Classifying Credit Applicants: A Comparison. Journal of Economics and Business 33, pp. 254-261. Graham J., W., Donaldson S., W. (1993) Evaluating Interventions with Differential Attrition: The Importance of Nonresponse Mechanisms and Use of Follow-up Data, Journal of Applied Psychology, vol. 78, pp. 119-128. Graham J., W., Hofer S., M., Mackinnnon D.,P. (1996) Maximizing the Usefulness of Data Obtained with Planned Missing Patterns, Multivariate Behavioral Research, vol. 31, no. 2, pp. 197-218. Green D., France E., Stepanek M., Borrus B. (2000) Online Privacy: It’s Time for Rules in Wonderland, Businessweek, March 20, pp. 83-96. Green P., Park T. (2003) A Bayesian Hierarchical Model for Categorical Data for Nonignorable Nonresponse, Biometrics, December, (59), pp. 886-896. Hand, D.J. (1986) Recent Advances in Error Rate Estimation. Pattern Recognition Letters 4, pp. 335-346. Hand, D.J. (1998) Reject Inference in Credit Operations. In Credit Risk Modeling Design and Application, ed. E. Mays. Chicago: Glenlake Publishing. pp. 181-190. Hand, D.J. (2001) Modeling Consumer Credit Risk. IMA Journal of Management Mathematics, 12, pp. 139-155. Hand, D.J. and Adams N.M. (2000) Defining Attributes for Scorecard Construction in Credit Scoring. Journal of Applied Statistics, 27 (5), pp. 527-540. Hand, D.J. and Henley, W.E. (1993/4) Can Reject Inference Ever Work? IMA Journal of Mathematics Applied in Business and Industry 5, pp. 45-55. Hand, D.J. and Kelley, M.G. (2001) Lookahead Scorecards for New Fixed Term Products. Journal of Operational Research Society 52, pp. pp. 989-996.

34
Hartley, H.O., and Hocking, R. R. (1971). The Analysis of Incomplete Data, Biometrics 27, 783-808. Hawkins M., R., Merriam V., H. (1991) An Overmodeled World, Direct Marketing, February, pp. 21-24. Hedeker D., Gibbons R., D. (1997) Application of Random-Effects Pattern-Mixture Models for Missing Data in Longitudinal Studies, Psychological Methods, vol. 2, no. 1, 64-79. Heitjan D., F. (1997) Annotation: What Can Be Done about Missing Data? Approaches to Imputation, American Journal of Public Health, vol. 87, no. 4, pp. 548-550. Heitjan D., F., Rubin D., B. (1986) Inference From Course Data Using Multiple Imputation, in Proceedings of the 18th Symposium on the Interface of Computer Science and Statistics, ed. T. Boardman, Washington DC: American Statistical Association, pp. 138-143. Heitjan D., F., Landis J., R. (1994) Assessing Secular Trends in Blood Pressure: A Multiple-Imputation Approach, Journal of the American Statistical Association, vol. 89, pp. 750-759. Henley, W.E. and Hand, D.J. (1995) Some Developments in Statistical Credit Scoring. Machine Learning and Statistics: The Interface, ed. Taylor C.C., pp. 123-131. John Wiley and Sons. Henley, W.E. (1997) The Statistical Aspects of Credit Scoring, Unpublished PhD. Dissertation, The Open University. Herzog T., N., Rubin D., B. (1983) Using Multiple Imputations to Handle Nonresponse in Sample Surveys, in Incomplete Data in Sample Surveys, Volume 2, Theory and Bibliographies, eds. W., G. Madow, I. Olkin, and D., B. Rubin, New York: Academic Press, pp. 209-245. Hsia, D.C. (1978) Credit Scoring and the Equal Credit Opportunity Act. The Hastings Law Journal 30, pp. 371-448. Imbriaco, S., E. (2005) Credit Scoring. Insurance Advocate, vol. 116(5), pp.14-19. James, I.R. (1995) A Note on the Analysis of Censored Regression Data by Multiple Imputation. Biometrics. (51), pp. 358-362. Joanes, D.N. (1993/4) Reject Inference Applied to Logistic Regression for Credit Scoring. IMA Journal of Mathematics Applied in Business and Industry, 5(1), pp. 35-43 Kelley, M.G., Hand, D.J. and Adams, N.M. (1999) The Impact of Changing Populations on Classifier Performance. Proceedings of the Fifth International

35
Conference on Knowledge Discovery and Data Mining, ed. S. Chaudhuri and D. Madigan. ACM Press, pp. 367-371. King G., Honaker J., Joseph A., Scheve K. (1998) Listwise Deletion is Evil: What to Do About Missing Data in Political Science, http://Gking.Harvard.Edu, Unpublished. Kong A., Liu J., Wong W., H. (1994) Sequential Imputation and Bayesian Missing Data Problems, Journal of the American Statistical Association, vol. 89, no. 1, pp. 278-288. Laird N., M. (1988) Missing Data in Longitudinal Studies, Statistics in Medicine, vol. 7, pp. 305-315. Laird, N., M., Louise, T., A. (1987) Empirical Bayesian Confidence Intervals Based On Bootstrap Sampling, Journal of the American Statistical Association, vol. 82, pp. 739-750. Lavori P., Dawson R., Shera D. (1996) A Multiple Imputation Strategy for Clinical Trials with Truncation of Patient Data, Statistics in Medicine, vol. 14, pp. 1913-1925. Lee S., Y., Chiu Y., M. (1990) Analysis of Multivariate Polychoric Correlation Models with Incomplete Data, British Journal of Mathematical and Statistical Psychology, vol. 43, pp. 145-154. Leonard, K.J. (1988) Credit Scoring via Linear Logistic Models With Random Parameters. P.h.D. Dissertation, Department of Decision Sciences and Management Information Systems, Concordia University, Montreal, Canada. Leonard, K.J. (1993) Empirical Bayes Analysis of the Commercial Loan Evaluation Process. Statistics and Probability Letters, 18, pp. 289-296. Lepkowski J., M., Landis J., R., Stehouwer S., A. (1987) Strategies for the Analysis of Imputed Data from a Sample Survey: The National Medical Care Utilization and Expenditure Survey, Medical Care, vol. 25, pp. 705-716. Li K., H., Raghunathan T., B., Rubin D., B. ( 1991) Large Sample Significance Levels from Multiply Imputed Data Using Moment-Based Statistics & an F Reference Distribution, Journal of the American Statistical Association, vol. 86, no. 1, pp. 1065-1073. Lillard, L., Smith, J.,P., Welch F. (1986) What Do We Really Know About Wages? The Importance of Nonreporting and Census Information. Journal of Political Economy, (94) No. 31, pp. 489-506. Lipsitz, S., R., Molenberghs, G., Fitzmaurice G., M., Ibrahim J., G. (2004) Protevtive Estimator for Linear Regression with Nonignorably Missing Gaussian Outcomes. Statistical Modelling: An International Journal, 4 (1), pp. 3-17.

36
Little, R., J. (1979) Maximum Likelihood Inference for Multiple Regression with Missing Values: A Simulation Study, Journal of the Royal Statistical Society, Series B, vol. 41, pp. 76-87. Little R.J., Smith P.J. (1987) Editing and Imputation for Quantitative Survey Data, Journal of the American Statistical Association, (82), pp. 56-68. Little R., J. (1988) Missing Data Adjustment in Large Surveys, Journal of Business and Economic Statistics, vol. 6, pp. 296-297. Liu J., S., Chen R. (1995) Blind Deconvolution via Sequential Imputations, Journal of the American Statistical Association, vol. 90, no. 430, pp. 567-576, Little, R. J. A. (1982). Models for Nonresponse in Sample Surveys, J. Am Statist. Assoc. 77, 237-250. Little R., Rubin D. (1986) Statistical Analysis with Missing Data. New York: Wiley. Lundy, M. (1992) Cluster Analysis in Credit Scoring. In Proceedings of the IMA Conference on Credit Scoring and Credit Control, ed: Thomas, L.C., Crook, J.N. and Edelman, D.B. pp. 91-107. Clarendon Press, Oxford. Malhotra N., K. (1987) Analyzing Marketing Research Data with Incomplete Information on the Dependent Variable, Journal of Marketing Research, vol. 24, pp. 74-84. Mehta, D. (1968) The Formulation of Credit Policy Models. Management Science 15(2), pp. B30-B50. Mehta, D. (1970) Optimal Credit Policy Selection: A Dynamic Approach. Journal of Financial and Quantitative Analysis, December. Meng X., L. (1994) Multiple-Imputation Inferences with Uncongenial Sources of Input, Statistical Science, vol. 9, no. 4, 538-558. Montalto C., P. Sung J. (1996) Multiple Imputation in the 1992 Survey of Consumer Finances, Financial Counseling and Planning, vol. 7, pp. 133-146. Myers, J.H. and Cordner, W. (1957) Increase Credit Operation Profits. The Credit World, February, pp. 12-13. Myers, J.H. and Forgy, E.Q. (1963) The Development of Numerical Credit Evaluation Systems. Journal of the American Statistical Association. 58, pp. 799-806. Myers, J.H. and Forgy, E.Q. (1967);

37
Neuenschwander, B., and Brandon M. (2004) Modeling Missingness for Time-To-Event Data: A Case Study in Osteoporosis. Journal of Biopharmaceutical Studies. 14 (4), pp. 1015-1019. Nie, N. H., Hull, C. H., Jenkins, J. G., Steinbrenner, K., and Brent, D. H. (1975). SPSS, 2nd ed. McGraw-Hill, New York. Noh, H., Kwak, M., Han I. (2004) Improving the Prediction Performance of Customer Behavior Through Multiple Imputation. Intelligent Data Analysis. 8, pp. 563-577. Orchard, T., and Woodbury, M. A. (1972). A Missing Information Principle: Theory and Applications. Proc. 6th Berkeley Symposium on Math. Statist. and Prob. 1, pp. 697-715. Oliver (1992). Orgler, Y.E. (1970) A Credit Scoring Model for Commercial Loans. Journal of Money, Credit and Banking, November. Orgler, Y.E. (1971) Evaluation of Bank Consumer Loans With Credit Scoring Models. Journal of Bank Research, Spring. Overstreet, G.A. and Kemp, R.S. (1986) Managerial Control in Credit Scoring Systems. Journal of Retail Banking 8(182) pp. 79-86. Paik, M., C. (2004) Nonignorable Missingness in Matched Case-Control Data-Analysis. Biometrics 60 pp. 306-314. Rao J., N., K., Shao J. (1992) Jackknife Variance Estimation with Survey Data Under Hot-Deck Imputation, Biometrica, vol. 79, pp. 811-822. Rassler, S. (2003) A Non-Iterative Bayesian Approach to Statistical Matching, Statistica Neerlandica, vol. 57 (1), pp. 58-74. Reichert, A.K., Cho, C.C. and Wagner, G.M. (1983) An Examination of the Conceptual Issues Involved in Developing Credit Scoring Models. Journal of Business and Economic Statistics 1, pp. 101-114. Rizvi M., H. (1983) Hot-Deck Procedures: Introduction, In Madow, Olkin And Rubin (Eds.), Incomplete Data in Sample Surveys, Vol. III: Proceedings of the Symposium, (pp. 351-352), New York: Academic Press. Roth, P. (1994) Missing Data: Conceptual Review for Applied Psychologists, Personnel Psychology, vol. 47, pp. 537-560. Rubin, Donald B. (1977) The Design of a General and Flexible System For Handling Non-response in Sample Surveys, Manuscript Prepared for the US Social Security Administration, July 1, 1997.
38
Rubin, Donald B. (1978) Multiple Imputations in Sample Surveys-a phenomenological Bayesian Approach to Non-response, Proceedings of the Survey Research Methods Section of the American Statistical Association, pp. 20-34. Rubin, Donald B. (1986) Statistical Analysis with Missing Data, John Wiley & Sons. Rubin, Donald B. (1987) Multiple Imputation for Nonresponse in Surveys, John Wiley & Sons. Rubin, Donald B. (1996) Multiple Imputation after 18+ Years, Journal of the American Statistical Association, June. Rubin D., B., Scheneker N. (1986) Multiple Imputation for Interval Estimation From Simple Random Samples With Ignorable Nonresponse, Journal of the American Statistical Association, vol. 81, pp. 366-374. Rubin D., B. (1976a) Matching Methods That Are Equal Percent Bias Reducing: Some Examples, Biometrics, vol. 32, pp. 109-120. Rubin D., B. (1976b) Multivariate Matching Methods That Are Equal Percent Bias Reducing: Maximums On Bias Reduction For Fixed Sample Sizes, Biometrics, vol. 32, pp. 121-132. Rubin D., B. (1980) Illustrating the Use of Multiple Imputations to Handle Nonresponse in Sample Surveys, 42nd Session of the International Statistical Institute, 1979, Book 2, pp. 517-532. Rubin D., B. (1993) Satisfying Confidentiality Constraints Through the Use of Synthetically Multiply-Imputed Micro Data, Journal of Official Statistics, vol. 9, no. 2, pp. 461-468. Rubin’s (1993) Rubin, D.B. and Rosenbaum, P. (1983) The Central Role of the Propensity Score in Observational Studies for Casual Effects, Biometrika, 70, pp. 41-55. Rubin, D.B. and Rosenbaum, P. (1985) Constructing a Control Group Using Multivariate Matches Sampling Methods That Incorporate the Propensity Score, The American Statistician, 39, pp. 33-38. Rubin D., B., Scheneker N. (1978) Multiple Imputation for Interval Estimation From Saimple Random Samples With Ignorable Nonresponse, Journal of the American Statistical Association, vol. 81, pp. 366-374. Rubin D., B., Scheneker N. (1987) Interval Estimation From Multiply Imputed Data: A Case Study Using Census Agricultural Industry Codes, Journal of the Official Statistics, vol. 3, pp. 375-387. Rubin, D., B., Scheneker N. (1991) Multiple Imputation in Health Care Data Bases: An Overview of Some Applications, Statistics in Medicine, vol. 10, pp. 585-598.

39
Rubin, D., B. (2003) Nested Multiple Imputation of NMES via Partially Incompatible MCMC, Statistica Neerlandica, vol. 57 (1), pp. 3-18. Ruud P., A. (1991) Extensions of Estimation Methods Using the EM Algorithm, Journal of Econometrics, vol. 49, pp. 305-341. Saunders, J., A., Morrow-Howell N., Spitznagel E., Dore’ P., Proctor E., K., Pescarino R. (2006) Imputing Missing Data: A Comparison of Methods for Social Work Researchers, Social work Research, vol. 30 (1), pp. 19-31. Schafer, J.L. (1996) Analysis of Incomplete Multivariate Data, Chapman & Hall. Schafer, J.L. Olsen, M.K. (Submitted 1998) Multiple Imputation for Multivariate Missing Data Problems: A Data Analyst’s Perspective, Journal of the American Statistical Association. Schafer, J.L. Graham, J.W. (2002) Missing Data: Our View of the State of the Art. Psychological Methods., 7. 147-177. Schenker N., Treiman D., J., Weidman L. (1993) Analysis of Public Use Decennial Census Data with Multiply Imputed Industry and Occupation Codes, Applied Statistics, vol. 42, no. 3, pp. 545-556. Sijtsma K., van der Ark L., A. (2003) Investigation and Treatment of Missing Item Scores in Test and Questionnaire, Multivariate Behavioral Research, vol. 38, no. 4, pp. 505-528. Smith, P.F. (1964) Measuring Risks on Consumer Installment Credit. Management Science, November. Srinivasan, V. and Kim, Y.H. (1987) Credit Granting: A Comparative Analysis of Classification Procedures. Journal of Finance 92, pp. 665-681. Stepanek M. (2000) Weblining: Companies Are Using Your Personal Data to Limit Your Choices-and Force You to Pay More for Products, Business Week, April 3, pp. 26-35. Thomas, L.C. (2000) A Survey of Credit and Behavioral Scoring: Forecasting Financial Risk of Lending to Consumers. International Journal of Forecasting, (16)2 pp. 149-172. Toussant, G.T. (1974) Bibliography on Estimation of Misclassification. IEEE Transactions of Information Theory 20, pp. 472-479. Treiman D., J. Bielby W., Cheng M. (1988) Evaluating a Multiple-Imputation Method for Recalibrating 1970 Census Detailed Industry Codes to the 1980 Standard, Sociological Methodology, vol. 18, pp. 309-345.

40
Troxel A., B. Harrington D., P., Lipsitz S., R. (1998) Analysis of Logitudinal Data with Non-ignorable Non-monotone Missing Values, Journal of Applied Statistics, 47 (3), pp. 425-438. Wei G., C., Tanner M., A. (1991) Applications of Multiple Imputation to the Analysis of Censored Regression Data, Biometrics, vol. 47, pp. 1297-1309. Wiginton, J.C. (1980) A Note on the Comparison of Logit and Discriminant Models of Consumer Credit Behavior. Journal of Finance and Quantitative Analysis 15, pp. 757-770. Wilson N., Summers B. (1998) Using Neural Networks for Credit Risk Management, Journal of Credit Management, vol.1, pp. 4-10. .
Appendix
LIST OF TABLES
Table 1: Analysis of Rejects From the German Closed-End Loan
Product…………..…..20

41
Table 2: Propensity Score Performance Statistics: Logistic Regression Model Developed on the German Data……………………………………………………………….………..22
LIST OF FIGURES Figure 1: Lorentz Diagram: Germany Logistic Regression………………..……………...23 Figure 2: German New Account Risk Model - Losses by Decile - Home Equity Loan Product…………………………………………………………………..………….…...25


![[MI] Multiple Imputation - Stata](https://static.fdocuments.us/doc/165x107/62039c6dda24ad121e4b6a82/mi-multiple-imputation-stata.jpg)