MULTIPLE AMORPHOUS–AMORPHOUS …aux.uibk.ac.at/c724117/publications/loerting09-acp.pdfThe...
54
MULTIPLE AMORPHOUS–AMORPHOUS TRANSITIONS THOMAS LOERTING Institute of Physical Chemistry, University of Innsbruck, Innrain 52a, A-6020 Innsbruck, Austria VADIM V. BRAZHKIN Institute for High Pressure Physics, Troitsk, Moscow Region, 142190 Russia TETSUYA MORISHITA Research Institute for Computational Sciences (RICS), National Institute of Advanced Industrial Science and Technology (AIST), Central 2, 1-1-1 Umezono, Tsukuba, Ibaraki, 305-8568 Japan CONTENTS I. Introduction II. Covalent Oxide Glasses A. Silica B. Other Oxide Glasses III. Water A. Preparation of Amorphous Ices B. Structural Information C. Irreversible Structural Transitions by Heating at 1 Bar D. Reversible in situ Structural Transitions E. Are the Amorphous Solids Glasses or Nanocrystallites? IV. Semiconductors A. General Comments B. Amorphous Si Advances in Chemical Physics, Volume 143, edited by Stuart A. Rice Copyright # 2009 John Wiley & Sons, Inc. 29
Transcript of MULTIPLE AMORPHOUS–AMORPHOUS …aux.uibk.ac.at/c724117/publications/loerting09-acp.pdfThe...

MULTIPLE AMORPHOUS–AMORPHOUS
TRANSITIONS
THOMAS LOERTING
Institute of Physical Chemistry, University of Innsbruck, Innrain 52a, A-6020
Innsbruck, Austria
VADIM V. BRAZHKIN
Institute for High Pressure Physics, Troitsk, Moscow Region, 142190 Russia
TETSUYA MORISHITA
Research Institute for Computational Sciences (RICS), National Institute of
Advanced Industrial Science and Technology (AIST), Central 2, 1-1-1 Umezono,
Tsukuba, Ibaraki, 305-8568 Japan
CONTENTS
I. Introduction
II. Covalent Oxide Glasses
A. Silica
B. Other Oxide Glasses
III. Water
A. Preparation of Amorphous Ices
B. Structural Information
C. Irreversible Structural Transitions by Heating at 1 Bar
D. Reversible in situ Structural Transitions
E. Are the Amorphous Solids Glasses or Nanocrystallites?
IV. Semiconductors
A. General Comments
B. Amorphous Si
Advances in Chemical Physics, Volume 143, edited by Stuart A. RiceCopyright # 2009 John Wiley & Sons, Inc.
29

C. Amorphous Ge
D. Liquid Si and Ge (l-Si and l-Ge)
V. Discussion and Conclusions
Acknowledgments
References
I. INTRODUCTION
The amorphous solid state of matter has traditionally received much less
attention than the crystalline solid state [1–4]. By contrast to crystalline solids,
which are ordered and can be defined using a periodically repeated unit cell,
amorphous solids are disordered on long-range scales. Amorphous solids show a
short-range order, e.g., tetrahedrality, which is similar to the short-range order
found in crystalline solids. However, long-range order in amorphous solids does
not exist because order typically disappears at distances of 20–50 A. Because of
their inherent disorder, amorphous solids are metastable with respect to the well-
ordered crystals. The difference in Gibbs free energies is often called ‘‘excess
free energy.’’ Many methods of producing amorphous solids are available using
the gas, the liquid, and the solid as starting materials. All of them share the
principle that excess free energy has to be provided, e.g., by mechanical, thermal,
or chemical treatment, which is taken up by the material [5]. Amorphous solids
are often divided in two subgroups—glasses and nonglassy amorphous solids.
One of the most traditional routes of producing glasses is by cooling the liquid
below the melting temperature without crystallizing it [6, 7]. Thus, glasses are
synonymously also called vitrified liquids. After reheating a glassy solid, it turns
into a supercooled liquid above the glass! liquid transition temperature Tg. In
the transition region from the glassy solid to the supercooled liquid near Tg
the microscopic structure does not change—rather the relaxation dynamics
change [8]. Whereas glasses are nonequilibrium states, which slowly relax
toward the metastable equilibrium on the experimental time scale, the metastable
equilibrium is reached within the experimental time scale in case of supercooled
liquids. By contrast, a nonglassy amorphous solid does not turn into a
supercooled liquid during heating. Instead, either it remains in the amorphous
solid state or it crystallizes. As an explanation why these amorphous solids
behave unlike glasses, often the concept of ‘‘nanocrystalline’’ material is invoked
[9–11], which basically implies that the material is made of a huge number of
very small crystal grains, each of which contains on the order of a few hundred
molecules. In this view, the sharp Bragg peaks in scattering experiments
characteristic of crystalline material are not observed because they are massively
broadened because of the small crystal sizes. For example, the X-ray pattern
cannot be distinguished then from true glassy material, and thus, the
‘‘nanocrystalline’’ material looks ‘‘X-ray amorphous.’’ Although both ‘‘nano-
30 thomas loerting, vadim v. brazhkin, and tetsuya morishita
crystalline’’ and ‘‘glassy’’ solids do not show long-range order, they can be
distinguished in terms of how the short-range order disappears at intermediate
ranges [12]. In the glassy state, the order disappears more or less continuously by
variation of interbond angles and (to a lesser extent) interatomic distances. In the
‘‘nanocrystalline’’ state, the order is lost more or less discontinuously at the grain
boundaries—almost no variation of interbond angles and interatomic distances is
observed inside the nanocrystals, but strong variation exists at the intergrain
boundaries (although the size of the nanograin and the intergrain boundary may
be compatible to each other). Instead of grain boundaries, defective crystals
distorted by linear defects (disclinations, dispirations, and displanations) have
been considered [13]. So, in amorphs one speaks about three distance ranges as
follows: (1) the short-range order, which typically reaches the direct neighbors of
a central atom or molecule, i.e., the first coordination sphere (sometimes the
second coordination sphere); (2) the intermediate range order, which typically
encompasses the second to the fifth through seventh coordination spheres, where
the loss of order occurs [14–20]; and (3) the long range beyond the fifth through
seventh coordination spheres, where there is no order.
During variation of pressure and/or temperature, the amorphous solids may
experience different processes, which can be superimposed as follows: (1) elastic
reversible behavior, that is, the connectivity in the network remains the same—
just isothermal compression and/or thermal expansion take place; (2) inelastic
behavior associated with the change of intermediate-range order; (3) inelastic
behavior associated with a change of short-range order including coordination
changes in the first through second spheres; and (4) irreversible structural
relaxation associated with the equilibration process toward the metastable
equilibrium.Whereas (1) is found for any material and (4) is related to the kinetics
of relaxation, (2) and especially (3) represent structural transitions governed by
the laws of thermodynamics analogous to phase transitions for crystals. In this
sense, structural transitions in amorphs have been called ‘‘phase’’ transitions, even
though amorph (nonequilibrium nature) and phase (equilibrium nature) are in
direct contradiction. Glasses and amorphous solids are nonergodic, non-
equilibrium states, and a strict physical meaning of the ‘‘phase’’ can be applied
to them only conditionally (‘‘metastable phase’’) [21]. The use of terminology
reserved for true equilibrium transitions (phase, latent heat, first-order nature,
nucleation, etc.) seems to be justified in view of the experimental finding that the
metastable amorphous states can be stabilized for very long times, if not infinitely,
under suitable conditions [i.e., process (4) can be suppressed effectively]. That is,
the term ‘‘phase’’ can be applied conditionally for ‘‘metastable phase.’’ In this
sense, the amorphs can be viewed to be in a metastable quasiequilibrium rather
than in nonequilibrium. Such a metastable quasiequilibrium allows for the
definition of a coexistence line, where Gibbs free energies of two amorphous
states are identical, and the possibility of ‘‘first-order’’ transitions that involve
multiple amorphous–amorphous transitions 31

jump-like changes in entropy, volume, and enthalpy arises. Also the possibility of
a critical point located at the end of the coexistence line arises. Another
complicating circumstancewith respect to amorphous solids and glasses is that the
transformations between different ‘‘phases’’ during the experimental times occur,
as a rule, under conditions that are far from equilibrium; these transformations
are determined by kinetic parameters, much like low-temperature phase
transitions with a large hysteresis found in crystals [22].
Structural phase transitions in crystals under changes of the P,T-parameters
are a well-studied phenomenon from both the experimental and theoretical
viewpoints. The concept of ‘‘polymorphism,’’ i.e., the occurrence of more than
one crystal structure for a single component, is a well-known and traditional
concept. For many components, the phase diagram of stable polymorphs has
been constructed and shows lines in the P,T diagram, where two polymorphs can
coexist in thermodynamic equilibrium. Crossing these lines then causes a sharp
structural transition, i.e., a change of short-range order in the unit cell [very
much like mechanism (3)] [23]. However, the concept of ‘‘poly-amorphism,’’
i.e., the occurrence of more than one amorph, and structural transitions between
these amorphs is relatively new and not well understood. Disordered systems
possess additional, more essential characteristics that differentiate them from
crystals, namely, the inhomogeneity of their structure and the dispersion of their
properties on the scales smaller than the correlation length of a medium order in
disordered systems. For this reason, the disordered systems follow two scenarios
of phase transformations: Either they can experience a first-order phase
transition, provided the minimum size of a nucleus of an emerging phase is
larger than the correlation length of a disordered state, or, by contrast, they
undergo smeared changes (at all temperatures) [24]. For the smooth transitions,
there is a series of intermediate states, each being in compliance with the
condition of minimum of the Gibbs free energy. This particular scenario cannot
be realized in crystals, where just two definite phases exist whose macroscopic
mixture may be thermodynamically equilibrated in the transition point only. Thus,
the experimental observation of sharp changes of the structure and properties in
the disordered systems, as opposed to crystals, is a necessary but insufficient
evidence for a first-order transition, for there always remains the possibility of this
transition occurring in a fairly narrow but finite P,T-interval. As a result, the
principal evidence for the first-order transition in the disordered media is the
observation of a macroscopic mixture of phases during transition [22].
The concept of a single structural transition in amorphous material, i.e., an
amorphous–amorphous transition, was coined in 1985 by Mishima et al. [25] on
the example of water. Today, in many respects the nature of pressure- and/or
temperature-induced transformations in glasses and amorphous solids remains
unclear. In most cases, the pressure treatment of glasses and amorphous solids
results in residual densification. In the process, the densified glasses and
32 thomas loerting, vadim v. brazhkin, and tetsuya morishita

amorphous solids do not undergo any significant change in a short-range order
(coordination number Z) as a rule; it is only amorphous network topology (ring
statistics, etc.) that varies. Nevertheless, there are some examples of
coordination transformations in amorphous solids, glasses, and liquids, which
can take place in a sharp manner or smeared over a wide pressure and
temperature range, e.g., amorphous H2O, SiO2, GeO2, B2O3, Si, Ge (for
references, see Sections II through IV), A3B5-compounds, Se, S, P, AlCl3,
ZnCl2, ZnSe, amorphous irradiated zircon [26], some metallic glasses (e.g.,
Ce45Al55) [27], and in aluminates [28]. These examples, where a coordination
transformation in the amorphous solid can be observed, are the candidates for
possible multiple amorphous–amorphous transitions, which are the focus of the
current review. Among these candidates, some evidence has been accreted for a
possible multiple nature of amorphous–amorphous transitions. Therefore, we
discuss covalent oxide glasses such as SiO2, GeO2, and B2O3 in Section II, H2O
in Section III, and the semiconductors Si and Ge in Section IV. Interestingly, a
good correlation exists between the few glasses that show coordination
transformations and the few liquids known to show anomalous behavior, such as
an apparently diverging heat capacity and compressibility during supercooling,
the negative melting slope in the P-T phase diagram, or a density maximum.
Although the possibility of structural transformations under compression in
some glasses is beyond doubt, the question whether the phase diagram of the
glass (and melt) is a shifted reflection of the pressure–temperature phase
diagram of the crystal remains to be answered. Multiple-phase transitions under
pressure for one substance in the crystalline state are possible often; whether
multiple structural transformations can similarly be observed in a respective
glass and melt is a matter of debate. Whereas there is barely any experimental
information on true multiple liquid–liquid transitions (except for the case of
AsS [29]), simulations have suggested the possibility of multiple first-order
liquid–liquid transitions [30–36].
Although we focus here on the status quo concerning the debated aspect of
multiple amorphous–amorphous structural transitions, we want to emphasize
that there are numerous reviews on the topic of polyamorphism and single
amorphous–amorphous transitions worth reading [37–48].
II. COVALENT OXIDE GLASSES
A. Silica
Of greatest interest is the study of pressure-induced transformations in such an
archetypical glass as a-SiO2. Besides the fundamental importance of research on
transformations in disordered media, a deeper insight into the transitions that
occur in a-SiO2 and other amorphous and liquid silicates is of much importance
for the physics of the Earth and planetary interiors. Thus, we pay the most
multiple amorphous–amorphous transitions 33

attention to the a-SiO2 study, whereas other oxide glasses such as GeO2 and B2O3
will be considered more concisely.
Silica (SiO2) is the substance whose properties and phase-transition behavior
are vital for understanding the puzzling processes and phenomena existing in the
Earth’s upper mantle and in Earth-like planets [49, 50]. Silica, being one of the
most abundant components of the Earth, ‘‘plays a major role in the deep interior,
both as a product of chemical reactions and as an important secondary phase’’ [51].
The equilibrium pressure-temperature (P-T) phase diagram of silica is relatively
well understood, and it has been extensively reviewed elsewhere [51] (Fig. 1).
Under compression, the SiO2 crystal undergoes a set of transitions from a-quartz(the silicon atom coordination number relative to oxygen atom number, Z¼ 4)
! coesite (Z¼ 4) (P� 3 GPa) ! stishovite (rutile structure) (Z¼ 6) (P � 9
GPa) ! CaCl2-structure type (Z¼ 6) (P � 70 GPa) ! a-PbO2-structure type
(Z¼ 6) (P � 100 GPa) – pyrite-structure type (Z¼ 8) (P � 260 GPa)[51–63].
The behavior of the SiO2 glass under pressure has been intensely studied as
well [39, 53, 64–83]. It was established long ago that the high-pressure, high-
temperature treatment causes a significant residual densification of silica glass
1401201008060402010500
1000
2000
3000
4000
5000
6000
7
5
melt
melt
1 - low-pressure phases (tridimite, crystobalite)2 - β-quartz3 - α-quartz4 - coesite5 - stishovite6 - CaCl2-type
7 - PbO2-type
6
54
3
2
1
Tem
pera
ture
(K
)
Pressure (GPa)
Figure 1. Schematic high P-T phase diagram of SiO2 determined from static compression
experiments. Rectangles are areas already studied. The bottom left rectangle (with 1–5 phases)
is part of a diagram by both in situ and quenching techniques in a large volume press apparatus
[51–54]. The upper right rectangle was studied by shock-wave and laser heating in diamond anvil
study of the melting curve [55–57]. The bottom right middle rectangle with 5/6 is the study (laser
heating with diamond anvils) of stishovite to CaCl2 transition [58] with a line of 5/6 phase transition
[59]. The bottom right rectangle with 7 is an area investigated by which includes Dubrovinsky et al.
[60], laser heating with diamond anvils.
34 thomas loerting, vadim v. brazhkin, and tetsuya morishita

[14, 66–68, 70, 71, 76, 84–87]. The maximum densification of 18–20% is
achieved after a pressure of 16–20 GPa—room temperature treatment or after
5–8 GPa—800–1000 K treatment. The densified glasses have predominantly
tetrahedral coordination of silica atoms, Z � 4–4.5 [14, 71, 88]. Elastic moduli
and optical characteristics of densified glasses are distinctly different from those
of pristine silica glasses.
The extensive studies on the structure [72, 89] and Raman and Brillouin
spectra [68–70, 73], as well as computer simulation results [77–82] have
revealed that in the 8–50 GPa pressure range and at room temperatures, the
silica glass is subject to a broad transformation accompanied by a change in the
short-range order structure and an increase in the coordination number from 4 to
6. It should be noted that during coordination transformation at intermediate
pressures, many silicon atoms have a fivefold coordination. The main part of
the transformation takes place in a narrower pressure range of 10–40 GPa.
The earlier data did not shed light on how closely this coordination
transformation is related to residual densification of the glass. Another
unanswered question was whether glass densification after 20 GPa pressure at
room-temperatures treatment and the one at 5–8 GPa and high-temperatures
treatment are of a similar nature.
Recent years have witnessed a significant advance in the understanding of the
behavior of glassy silica under compression. By using a strain gauge technique,
direct in situ measurements of the relative volume of the glass in a wide range of
pressures (0–10 GPa) and temperatures (30–730 K) have been conducted
(see Fig. 2) [90]. It has been found that at increased temperatures and pressures
of 4–8 GPa, the a-SiO2 glass undergoes a transformation accompanied by
moderate volume changes of 2–7%, depending on the pressure. The computer
simulation data [91, 92] perfectly fit those obtained by volumetric measure-
ments (see Fig. 3). Here, we note that the data in Ref. [85] on the existence of a
sharp volumetric anomaly (�20%) at 3.6 GPa and 850 K are not corroborated
by the results of other independent measurements. High residual densification
(�20%) in the glasses after decompression is caused by a considerably lower
(by almost two times) compressibility of a densified glass [90]. Thus, the
position in the T,P-plane of the zone of the transformation responsible for
densification was determined (Fig. 4). A recently conducted in situ structural
study on the SiO2 glass under high-pressure, high-temperature conditions [17]
(see Fig. 5) as well has revealed the existence of this transformation region,
which is in perfect agreement with the volumetric data (see Fig. 4). The
computer simulation data [91, 92] and in situ X-diffraction study [17] have
allowed us to clarify the nature of this transformation. The coordination number
during this transformation changes insignificantly, whereas the topology of
tetrahedron connectivity substantially changes toward more efficient packing of
the tetrahedra. Thus, the changes during this transformation primarily affect the
multiple amorphous–amorphous transitions 35

intermediate-range order rather than the short-range one. In terms of the
‘‘rigidity percolation’’ [93], the transformation of the amorphous network
with floppy modes toward the rigid network occurs [92]. The analysis of
structural data has revealed that the number of small rings in the network
increases during transformation; this change in the ring statistics leads to the
decrease in the number and size of interstitial voids in the network. Apart from
a change in the intermediate-range order, the first transformation also involves a
change in the coordination of some part of silicon atoms in the fivefold and
sixfold coordination states.
30
40
50
60
70
80
90 B
T =290 K
T=545 K
T = 290 K
Bulk
m
odulu
s (G
Pa)
Pressure (GPa)
-25
-20
-15
-10
-5
0A
T= 290 K
T= 545 K
T = 290 K
Δ V
/V
0 (%
)
0 2 4 6 8 10
Figure 2. Relative change of a-SiO2 volume in the compression and decompression cycles at
545 K (a) and the corresponding bulk modulus obtained by the numerical differentiation of volume
curves (b). The data corresponding to the a-SiO2 compression at room temperature are given for the
comparison (from Ref. [90]).
36 thomas loerting, vadim v. brazhkin, and tetsuya morishita

Thus, the first transformation in a-SiO2 happens with a small change in the
coordination number and is irreversible at room temperatures, which gives rise
to residual densification (see Fig. 4). The second transformation, accompanied
by the further increase of the first coordination number up to Z¼ 6 and
occurring already within the rigid network, takes place at higher pressures; it is
almost independent of the temperature (see Fig. 4) and is nearly fully reversible.
At room temperature, these two transformations significantly pressure overlap,
whereas at higher temperatures, they can be conditionally separated.
The pressure range for the second transformation is still debatable. Note that
the recent study on the bonding changes in the SiO2 glass conducted by using an
inelastic X-ray scattering technique [94] gives an unreliable estimate of the
degree of coordination transformation. According to Ref. [94], the transforma-
tion in the SiO2 glass to the sixfold coordination state of silicon atoms is
completed at P � 20 GPa. At the same time, the direct structural study of the
SiO2 glass indicates that this coordination transformation is not completed
even at P � 40 GPa [72, 89]. At P �18 GPa, the coordination changes only
begin [17]. A very recent inelastic X-ray Si L-edge scattering study has revealed
that there is no domination of six coordinated Si atoms even at 74 GPa [95].
Fukui et al. [95] suggested that a significant fraction of five coordinated Si
atoms exist up to the highest pressures. Thus, the assessments of the degree of
coordination transformation in glasses made from inelastic X-ray scattering data
(e.g., Refs. [94, 96, 97]) should be treated with caution.
Figure 3. Temperature-induced densification in SiO2 and GeO2 glasses from Ref. [91]. A
circled line is the experimental results; solid lines are the results from MD simulation.
multiple amorphous–amorphous transitions 37
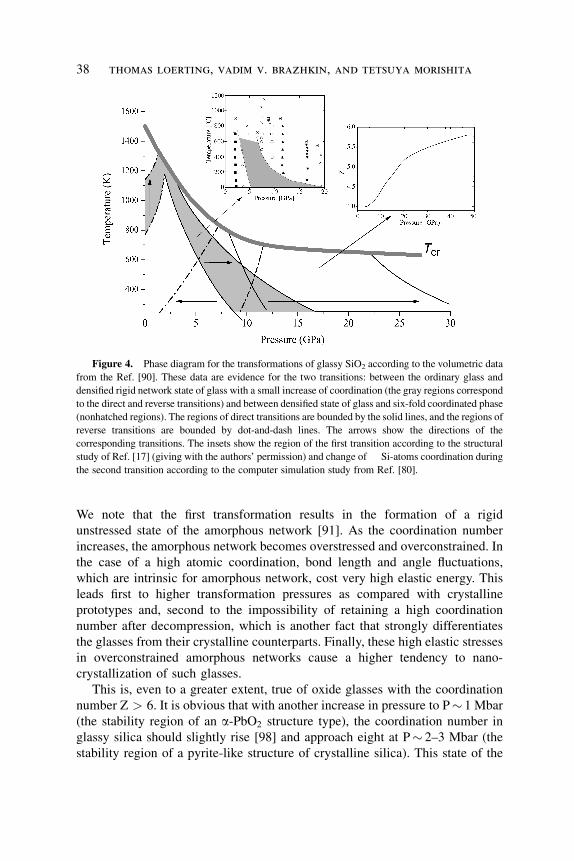
We note that the first transformation results in the formation of a rigid
unstressed state of the amorphous network [91]. As the coordination number
increases, the amorphous network becomes overstressed and overconstrained. In
the case of a high atomic coordination, bond length and angle fluctuations,
which are intrinsic for amorphous network, cost very high elastic energy. This
leads first to higher transformation pressures as compared with crystalline
prototypes and, second to the impossibility of retaining a high coordination
number after decompression, which is another fact that strongly differentiates
the glasses from their crystalline counterparts. Finally, these high elastic stresses
in overconstrained amorphous networks cause a higher tendency to nano-
crystallization of such glasses.
This is, even to a greater extent, true of oxide glasses with the coordination
number Z > 6. It is obvious that with another increase in pressure to P� 1 Mbar
(the stability region of an a-PbO2 structure type), the coordination number in
glassy silica should slightly rise [98] and approach eight at P� 2–3 Mbar (the
stability region of a pyrite-like structure of crystalline silica). This state of the
Figure 4. Phase diagram for the transformations of glassy SiO2 according to the volumetric data
from the Ref. [90]. These data are evidence for the two transitions: between the ordinary glass and
densified rigid network state of glass with a small increase of coordination (the gray regions correspond
to the direct and reverse transitions) and between densified state of glass and six-fold coordinated phase
(nonhatched regions). The regions of direct transitions are bounded by the solid lines, and the regions of
reverse transitions are bounded by dot-and-dash lines. The arrows show the directions of the
corresponding transitions. The insets show the region of the first transition according to the structural
study of Ref. [17] (giving with the authors’ permission) and change of Si-atoms coordination during
the second transition according to the computer simulation study from Ref. [80].
38 thomas loerting, vadim v. brazhkin, and tetsuya morishita

glass should be overstressed even more and should have a strong tendency to
crystallization at nanoscales.
The presence of several structural phase transformations in the glassy state
permits suggesting the respective structural changes in the melt. Thus, for
example, in liquid SiO2, the smooth transition with a change in the
intermediate-range structure at P� 3–5 GPa is manifested in the degree of
densification of glasses obtained by quenching from melt under pressure [99],
whereas the other transition is associated with a considerable rearrangement of
the atomic short-range order and accounts for the anomalies of the properties of
the SiO2 melt [100–105].
B. Other Oxide Glasses
The SiO2 glass seems to be the most well-known glass but is not the only one to
reveal the complicated behavior of its structural characteristics under compres-
sion. The GeO2 substance is analogous to SiO2. The P,T diagram of GeO2 is
similar to that of SiO2 (in fact, even more simple as it lacks many four
coordinated phases, which includes a coesite-like one). A rutile-like phase of
GeO2 (Z¼ 6) transits to a CaCl2 structure type (Z¼ 6) (P � 30 GPa), then to an
Figure 5. The pressure dependence of the structure factor for SiO2 glass at room temperature
(from Ref. [17] with the authors’ permission)
multiple amorphous–amorphous transitions 39
a-PbO2-structure type (Z¼ 6) (P� 50 GPa), and finally to a pyrite-like structure
(Z¼ 8) (P � 85 GPa) [63, 106, 107]. As with a-SiO2, the P,T-treatment of the
GeO2 glass brings about residual densification of�14–16% without a significant
change of short-range order coordination [16, 108].
The coordination transformation in glassy GeO2 under compression with
an increase in Z from 4 to 6 takes place in the 5–20-GPa pressure range,
which is attested by both experimental data of the extended X-ray absorp-
tion fine structure (EXAFS) [109], volumetric [76, 110], and X-ray diffraction
[111, 112] measurements, as well as computer simulation result [113, 114].
The coordination number in a-GeO2 rises nonmonotonically with pressure: At
P � 9–10 GPa, the rate of rise of the Z value slows down [112]. According to
Guthrie et al. an intermediate fivefold coordinated state of a-GeO2, exsits;
however, it is more likely that this intermediate state includes Ge atoms of
different coordinations, of 4, 5, and 6 [113, 114]. Recent structural studies on
a-GeO2 performed simultaneously at high pressures and temperatures obtained
at isobaric heating [115] and isothermal pressure runs [116] have revealed a
complicated picture of structural changes. Similar to a-SiO2, the a-GeO2
substance in the region of moderate pressures (1–4 GPa) and high temperatures
(400–600 K) experiences the intermediate-range order changes accompanied
only by an insignificant increase in the coordination number [115, 116]. The
computer simulation study of the GeO2 glass has also revealed a transition to the
rigid network state at heating at P � 1 GPa [91] (see Fig. 3).
Thus, for a-GeO2 at high temperatures, we may conditionally consider the
existence of two overlapping structural transformations under compression. It is
obvious that at additional increases in pressure, a-GeO2 is bound to undergo,
similarly to a-SiO2, transformations accompanied by the rise in the coordination
number to eight [98]. Glassy GeO2 oxides with Z� 6 and Z� 8 are
overstressed and cannot be quenched to normal pressure conditions.
The presence of several structural phase transformations in glassy GeO2
suggests the respective structural changes in the melt, which is already partially
confirmed by both experimental study [117] and computer simulation study [118].
B2O3 represents an archetypical oxide glass alongside such glasses as SiO2
and GeO2 [119], with the important difference that at the ambient conditions,
the structural units are planar BO3 triangles as opposed to tetrahedra. As was
found long ago [120, 121], pressure-treated B2O3 glasses show residual
densification �r/r� 5–10%, which depend on the pressure-temperature
conditions of treatment. The ex situ studies of densified glasses point to the
breakup of the boroxol rings in the glass structure and to the buckling of the
‘‘ribbons’’ formed by the BO3 triangles, without any significant coordination
change of the boron and oxygen atoms [122, 123]. The in situ investigations of
B2O3 glass under pressure have been performed using Raman and Brillouin
spectroscopies [124–126] and through inelastic X-ray scattering spectroscopy
40 thomas loerting, vadim v. brazhkin, and tetsuya morishita

[97]. In addition, there have been attempts to examine the B2O3 glass under
pressure by molecular dynamics computer simulation, using empirical
interatomic potentials [127, 128]. According to the data of Nicholas et al.
[125], B2O3 glass under compression experiences a transformation in the
pressure range P� 6–15 GPa; according to Ref. [97] B2O3 glass, under com-
pression, features a considerable change in the bonding type in the 6–20-GPa
pressure range. These changes were attributed to the modification of the short-
range order in glass, with the coordination of boron atoms increasing from 3 to 4
in a similar way to crystalline phases.
We have recently reported the results of the in situ diffraction experiments
and the in situ volumetric measurements, and we have complemented them with
the data from ab initio calculations [129].
The behavior of B2O3 glass under pressure is in a certain sense similar to the
behavior of other archetypical oxide glasses, a-SiO2 and GeO2. Under pressure,
B2O3 glass equally features two overlapping diffuse transformations (see
Fig. 6). The first transformation is irreversible at room temperature without the
change in the first coordination number and is accompanied by the change of
864200
20
40
60
80
100
120 B= –V(dP/dV )
B (G
Pa)
Pressure (GPa)
141210864202.9
3.0
3.1
3.2
3.3
3.4
3.5
3.6
Z
Pressure (GPa)
Figure 6. Pressure dependencies of the bulk modulus obtained by the direct numerical
differentiation of the in situ volumetric measurements of the glassy B2O3 under pressure (‘‘relaxed’’
modulus) in the two different runs of compression (solid symbols) and decompression (open
symbols). The significant jumps of the effective bulk modulus between the final of compression and
onset of decompression for both runs correspond to the jumps between ‘‘relaxed’’ and almost
‘‘unrelaxed’’ values. The inset shows pressure dependences of the first coordination number for B
from the recent X-ray diffraction data. Both data are from Ref. [129].
multiple amorphous–amorphous transitions 41

intermediate range order; the second transformation is reversible, and it occurs
at higher pressures and is accompanied by the change in the coordination of the
B atoms from 3 to 4. In B2O3 glass, the increased coordination number of cation
atoms is not retained at room temperature after decompression either. Similar to
silica, the behavior of the glass greatly differs from that of its crystalline
counterpart: The B2O3 II phase can be retained at normal conditions and has
high temperature stability. Ab initio simulations predict one more transition to
the glassy state with sixfold coordinated B in the megabar pressure region [129].
Thus, in all discussed oxides, the structural transformations under pressure
can be described as a multiple set of transformations. First, changes occur in the
intermediate-range order with a slight increase in the coordination number and a
transition to the rigid network state; then, a coordination transformation with the
increase of the first coordination number follows. According to the computer
simulation data, additional buildup of pressure to the megabar range causes a
subsequent complementary increase in the coordination number.
It is evident that similar sets of multiple-phase transitions are bound to be
observed in the respective melts. Such structural studies on the oxide melts have
not yet been carried out, which is because of greater experiment complexity.
Nevertheless, the chalcogenide melts, which experience structural transforma-
tions at more moderate temperatures and pressures, give examples of multiple
phase transitions. Thus, the AsS [29] and CdTe [130] melts feature at least two
pressure-induced transitions accompanied by a change in the short-range order
structure and properties of the liquids.
III. WATER
A. Preparation of Amorphous Ices
Metastable amorphous solids can in general be prepared from stable phases by
bringing in excess free energy [5]. In the case of water, amorphous solids have
been prepared from stable phases in all three aggregate states: from the gas, the
liquid, and the crystalline solid [131].
1. Preparation from the Gas Phase: Amorphous Solid Water (ASW)
The formation of an amorphous solid was first reported in 1935 [132, 133]. These
authors used the route of depositing warm water vapor on a cold substrate, which
freezes in excess free energy by the rapid change in temperature. At substrate
temperatures above �160 K, the deposit was found to be crystalline ice I,
whereas below this temperature, an amorphous solid was obtained. These
deposits are referred to as ASW, which is a microporous material that can adsorb
gases [134, 135]. In fact, ASWalso condenses on interstellar dust particles and is
likely the most abundant form of solid water in the universe. Therefore, studies
on ASW bear an astrophysical relevance [134, 136]. The microporosity can be
reduced greatly by sintering the sample to no more than 120 K.
42 thomas loerting, vadim v. brazhkin, and tetsuya morishita

The density of the ASW films depends highly on the experimental conditions,
e.g., on the angle of incidence of the molecular beam. For a deposition
temperature of 22 K and at a normal angle, a maximum density of 0.94 g/cm3 is
observed, whereas a density of 0.16 g/cm3 is observed close to glancing
incidence, which implies a porosity of 80% [137]. ASW anneals or relaxes
during heating in vacuo to a structural state approaching that of hyperquenched
glassy water (HGW) [138].
Using different deposition rates, even a highly compacted form of amorphous
solid water of density >1 g/cm3 could be obtained at deposition temperature
T < 30 K, which transforms gradually in the temperature range 38–68 K to the
lower density form of density 0.94 g/cm3 [139, 140]. This transition was
proposed to be at the origin of crack-formation processes in comets [141]. We
note, however, that the formation of this high-density amorph at very low
temperatures has been doubted [142, 143]. Only photolysis at 20 K induces a
transition to a high-density amorph [143].
2. Preparation from the Liquid Phase: HGW
Instead of water vapor, also the liquid can be turned into an amorphous solid by
cooling. Quenching is a standard method of glass formation for many
substances, both organic and inorganic in nature [3, 7]. In fact, it is believed
that all liquids can, in principle, be vitrified by cooling. Some liquids can be
vitrified easily even by slow cooling (‘‘good glass formers’’), whereas others
can be vitrified only with difficulties by very rapid cooling (‘‘bad glass
formers’’). Water is a particularly bad glass former, and a cooling rate of the
order of 106–107 K/s is necessary for avoiding crystallization to ice I.
Achieving such high cooling rates had required the invention of new
techniques, which are called ‘‘hyperquenching’’ or ‘‘splat cooling’’ techniques.
Mayer and Brueggeller were the first to succeed by projecting a thin jet of water
into a liquid cryomedium [144, 145]. Later, Mayer improved the technique by
spraying micrometer-sized droplets on a solid cryoplate, thus avoiding the use
of a cryomedium [146]. The droplets are sprayed into a vacuum chamber,
which results in the formation of a supersonic jet of droplets. This jet of
droplets hits a piece of copper cooled to 77 K, where the droplets are
immobilized almost instantaneously. The deposit is called HGW.
3. Preparation from the Solid Phase
3.1. High-Density Amorphous Ice (HDA). When hexagonal ice (ice Ih) is
pressurized melting can occur, e.g., at 253 K and 0.2 GPa, because one of water’s
anomalies is its negative melting volume, which results in a negatively sloped
melting curve according to the Clausius-Clapeyron equation (c.f. Fig. 7).
Extrapolating the ice Ih melting curve to lower temperatures, one would expect
melting at pressures exceeding�1.0GPa at 77 Kor� 0.6 GPa at 170 K if one could
avoid recrystallization to high-pressure polymorphs of ice. Whereas at 170 K,
multiple amorphous–amorphous transitions 43
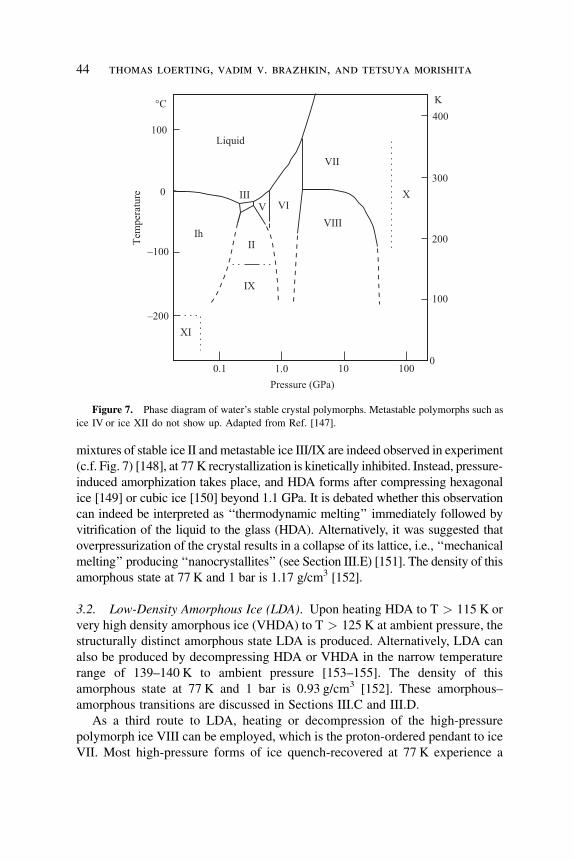
mixtures of stable ice II and metastable ice III/IX are indeed observed in experiment
(c.f. Fig. 7) [148], at 77 K recrystallization is kinetically inhibited. Instead, pressure-
induced amorphization takes place, and HDA forms after compressing hexagonal
ice [149] or cubic ice [150] beyond 1.1 GPa. It is debated whether this observation
can indeed be interpreted as ‘‘thermodynamic melting’’ immediately followed by
vitrification of the liquid to the glass (HDA). Alternatively, it was suggested that
overpressurization of the crystal results in a collapse of its lattice, i.e., ‘‘mechanical
melting’’ producing ‘‘nanocrystallites’’ (see Section III.E) [151]. The density of this
amorphous state at 77 K and 1 bar is 1.17 g/cm3 [152].
3.2. Low-Density Amorphous Ice (LDA). Upon heating HDA to T > 115 K or
very high density amorphous ice (VHDA) to T > 125 K at ambient pressure, the
structurally distinct amorphous state LDA is produced. Alternatively, LDA can
also be produced by decompressing HDA or VHDA in the narrow temperature
range of 139–140 K to ambient pressure [153–155]. The density of this
amorphous state at 77 K and 1 bar is 0.93 g/cm3 [152]. These amorphous–
amorphous transitions are discussed in Sections III.C and III.D.
As a third route to LDA, heating or decompression of the high-pressure
polymorph ice VIII can be employed, which is the proton-ordered pendant to ice
VII. Most high-pressure forms of ice quench-recovered at 77 K experience a
100
0
–100
–200
°C K
Tem
per
ature
Pressure (GPa)
0.1 1.0 10 1000
100
200
300
400
IhII
IIIV VI
VII
VIII
XI
X
Liquid
IX
Figure 7. Phase diagram of water’s stable crystal polymorphs. Metastable polymorphs such as
ice IV or ice XII do not show up. Adapted from Ref. [147].
44 thomas loerting, vadim v. brazhkin, and tetsuya morishita

transition to ice Ic when heated above 145–150 K, namely the metastable
poymorphs ice IV and ice XII (which can be produced in the stability fields of
ice V and ice VI in Fig. 7) [156] and the stable polymorphs ice II, ice III, ice V,
ice VI, and ice VII [157, 158]. When ice VIII is heated at 1 bar, temperature-
induced amorphization takes place, however [159]. A sequential transformation
to first HDA and then LDA was observed when heating ice VIII at 1 bar [160].
Also, the direct route from ice VIII to LDA has been reported: Ice VIII
decompressed to 1 bar at 80 K and then heated to 125 K directly transforms to
LDA [161]. Also isothermal pathways to LDA by decompression are feasible:
By decompressing partially hydrogen ordered ice VII’ or ice VIII at 135 K, a
transformation directly to LDA is observed using in situ Raman spectroscopy in
a diamond anvil cell [162, 163].
Finally, radiation can be employed to produce LDA. Ice III or its proton-
ordered counterpart ice IX are amorphized by particle bombardment at electron
doses above 2400 electrons nm�2 [164]. Ice I amorphizes by keV ion-
bombardment at 10–80 K [165]. Similarly, after a dose of few eV per mol of UV
photons amorphization of ice I is observed [166, 167]. The conversion rates
increase as the temperature decreases [168]. Using 700 keV proton irradiation at
13 K, even oscillations between crystalline and amorphous ice can be achieved,
whereas above 27 K, the amorphous ice remains [169].
3.3. Very High Density Amorphous Ice (VHDA). By annealing HDA to
T > 160 K at pressures > 0.8 GPa, a state structurally distinct from HDA can be
produced, which is called VHDA ice [152]. The structural change of HDA to a
distinct state by pressure annealing was first noticed in 2001 [152]. Even though
VHDAwas produced in experiments prior to 2001 [170], the structural difference
and the density difference of about 10% at 77 K, and 1 bar in comparison with
HDA remained unnoticed. Powder X-ray diffraction, flotation, Raman spectro-
scopy, [152] neutron diffraction [171], and in situ densitometry [172, 173] were
employed to show that VHDA is a structural state distinct from HDA.
Alternatively, VHDA can be prepared by pressurization of LDA to P > 1.1
GPa at 125 K [173, 174] or by pressure-induced amorphization of hexagonal ice
at temperatures 130K < T < 150K [170]. The density of this amorphous state
at 77 K and 1 bar is 1.26 g/cm3 [152].
B. Structural Information
Structure factors and radial distribution functions (RDFs) were found to be
nearly identical for ASW, HGW, and LDA by X-ray and neutron diffraction
measurements [175]. A more recent isotope substitution neutron diffraction
study on three sets of samples (D2O, HDO, and H2O) allowed determining the
partial OO-, OH-, and HH-radial distribution functions [20]. As an example, the
OO-RDF for ASW, HGW, and LDA is shown together with HDA and VHDA in
multiple amorphous–amorphous transitions 45

Fig. 8. All the partial RDFs for ASW, HGW, and LDA agree within the
experimental error, which suggests that ASW, HGW, and LDA all represent the
same structural state at 77 K and 1 bar. The basic short-range order structural
motif is the ‘‘Walrafen pentamer’’ (i.e., a central oxygen atom, which is
surrounded tetrahedrally by four oxygen atoms; c.f. inset Fig. 8.). However,
whereas their structures appear identical, it was suggested from inelastic
incoherent neutron scattering that the dynamics of lattice and internal vibrations
of water molecules differ significantly in HGW and LDA [176].
By contrast, HDA and VHDA differ substantially from ASW, HGW, and
LDA in terms of local structure. Most importantly, there is an increased
probability of finding water molecules at an OO-distance of 3.0–3.5 A from the
central water molecule. In case of HDA, one molecule is found at an interstitial
Figure 8. The EPSR estimated intermolecular oxygen–oxygen pair distribution function
gOO(r). For clarity, the functions are offset by a unit. The inset shows the Walrafen pentamer, which
is the structural motif common to all known amorphous ices. Adapted from Ref. [20]. See color
insert.
46 thomas loerting, vadim v. brazhkin, and tetsuya morishita

position [177], and in the case of VHDA, two molecules occupy the interstitial
positions [171]. That is, the coordination number increases from roughly 4 to 5
and 6 for LDA, HDA, and VHDA, respectively.
Information on the nearest-neighbor OO-distances was provided from
nuclear magnetic resonance (NMR) measurements at 77 K, which resulted in
2.84 A for HDA and 2.79 A for LDA [178]. Raman measurements on H2O
samples that contain 5 mol% D2O can be used to infer near-neighbor OO-
distances by calling on a good correlation with the frequency of the decoupled
OH stretching band. This correlation suggests OO-distances of 2.85 A for
VHDA, 2.82 A for HDA, and 2.77 A for LDA [152]. Thus, increasing density is
coupled with increasing OD. . .O distance. This seemingly paradox situation has
been attributed to an increase in coordination number [179].
LDA and HDAwere interpreted to be similar to two limiting structural states of
supercooled liquid water up to pressures of 0.6 GPa and down to 208 K. In this
interpretation, the liquid structure at high pressure is nearly independent of
temperature, and it is remarkably similar to the known structure of HDA. At a low
pressure, the liquid structure approaches the structure of LDA as temperature
decreases [180–182]. The hydrogen bond network in HDA is deformed strongly
in a manner analogous to that found in water at high temperatures, whereas the
pair correlation function of LDA is closer to that of supercooled water [183]. At
ambient conditions, water was suggested to be a mixture of HDA-like and LDA-
like states in an approximate proportion 2:3 [184–186].
C. Irreversible Structural Transitions by Heating at 1 Bar
All amorphous ices transform to cubic ice when heated to T > 150 K at 1 bar,
which subsequently recrystallizes to hexagonal ice. However, the high-density
amorphous states HDA and VHDA also show an irreversible transition to LDA
when heated to temperatures slightly below crystallization. Using ultrasonic sound
propagation measurements, three distinct stages were found for the temperature-
induced HDA!LDA transformation at 110–115 K, namely shear elastic soft-
ening, bulk softening, and main volume jump [187]. Whereas the first stages
involve structural relaxation, the final stage is consistent with a ‘‘first-order like’’
transition—that is, the amorphous–amorphous transition shows a complex
nonergodic nature that involves more than one process [65]. The relaxation stages
of this combined process were studied in detail using neutron scattering [188, 189].
After heating VHDA at 1 bar to �125–130 K, LDA is produced. There is
only one exothermic peak in differential scanning calorimetry(DSC) measure-
ments related to this transition [190]. However, elastic and inelastic neutron
scattering experiments performed at narrowly spaced temperatures indicate that
an amorphous structure indiscernible from HDA (produced by pressurizing ice
Ih at 77 K) forms as an intermediate stage [191] The small angle scattering
indicates that both VHDA and LDA are homogeneous, whereas the intermediate
multiple amorphous–amorphous transitions 47

HDA shows heterogeneities on a length scale of a few nanometers [192]. The
activation energy for the VHDA!LDA transition is at least 20 kJ/mol higher
than the activation energy for the HDA!LDA transition [191] (i.e., VHDA is
thermally more stable at 1 bar than HDA) [170, 190]. Similarly, deuteron spin-
lattice relaxation time T1-measurements for the VHDA!LDA transition
suggest that an HDA-like state is incurred on the way. The HDA-like state on
the way shows a much higher transition temperature to LDA than HDA
(produced by pressurizing ice Ih at 77 K), which suggests that it is in a relaxed
HDA state [193]. Mishima and Suzuki have performed Raman measurements on a
VHDA sample and have monitored the transition to LDA as a function of
temperature, time, and position on the amorphous sample [194]. In Fig. 9, it is
shown that the measured VHDA Raman peak shift and intensity as well as
the estimated sample density first continuously change toward HDA in the
temperature range 100–115 K and then discontinuously change (marked by the
arrows in Fig. 9) at � 116 K. Mishima and Suzuki [194] noticed that in the course
of the transition, a ‘‘phase’’ boundary propagates through the sample. These results
confirm a picture of a combined process that first involves structural relaxation at 1
bar followed by a ‘‘first-order like’’ transition that involves HDA-LDA
coexistence. Please note, however, that these transitions are irreversible in the
sense that going back to 77 K, the back transformation to HDA or VHDA, cannot
be achieved. Thus, equality of Gibbs free energies is not involved in this case—
rather, LDA has a much lower Gibbs free energy at 1 bar than HDA or VHDA.
D. Reversible in situ Structural Transitions
By contrast, after changing the pressure, a reversible transition is observed. The
upstroke transition from LDA to HDAwas first observed by noticing a sharp 20%
volume change at 0.55–0.65 GPa and 77 K, which causes a shift in the halo peak
of the powder X-ray diffractogram of the quench-recovered state [25]. At higher
temperatures, the sharp LDA!HDA transition shifts to lower pressures [153]
(e.g., to 0.40–0.50 GPa at 125 K) [174]. Whereas HDA can be quench recovered
at 77 K without structural change, it transforms back to LDA on the downstroke
between 130 K and 140 K [153]. Under strictly isothermal conditions, the sharp
downstroke transition is observable solely in a narrow temperature region. The
transition is observed at 139 K and � 0.03 GPa [154] and at 140 K and � 0.06
GPa [155], whereas no such transition is observed at 136 K. Instead, HDA is
recovered after decompressing to ambient pressure at 136 K. At 142 K,
crystallization of HDA to an ice IX/ice V mixture is observed rather than the
downstroke HDA!LDA transition. An observation of the HDA!LDA
transition at temperatures T < 136 K would require negative pressure (i.e., a
substantial hysteresis is involved).
When pressurizing LDA and by monitoring the structural state using in situ
neutron diffraction, double-peaked diffraction patterns and a progressing
48 thomas loerting, vadim v. brazhkin, and tetsuya morishita
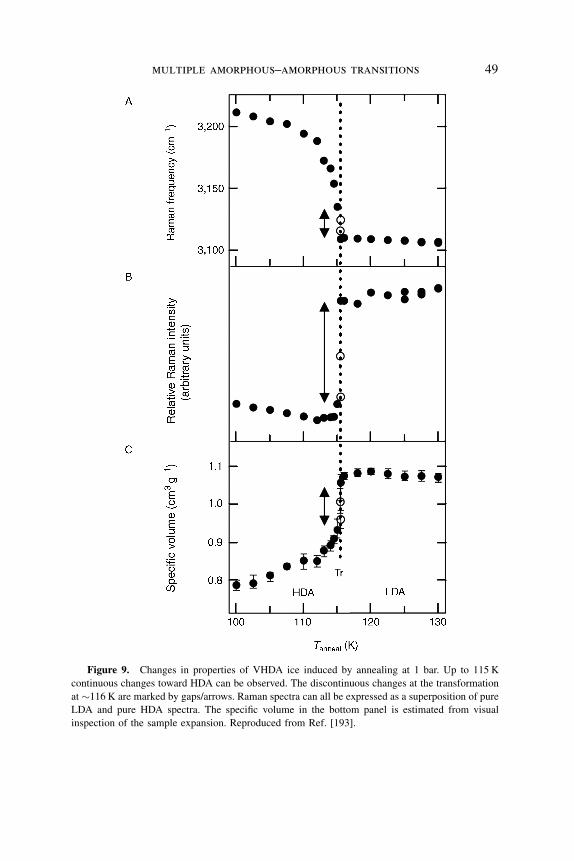
Figure 9. Changes in properties of VHDA ice induced by annealing at 1 bar. Up to 115 K
continuous changes toward HDA can be observed. The discontinuous changes at the transformation
at �116 K are marked by gaps/arrows. Raman spectra can all be expressed as a superposition of pure
LDA and pure HDA spectra. The specific volume in the bottom panel is estimated from visual
inspection of the sample expansion. Reproduced from Ref. [193].
multiple amorphous–amorphous transitions 49
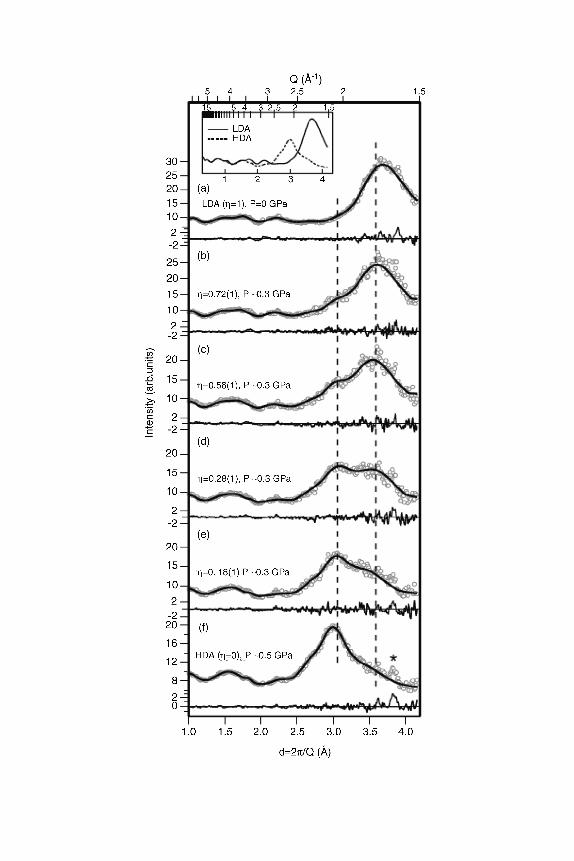
transformation to HDA were observed at �0.3 GPa and 130 K [195]. The
intermediate double-peaked patterns shown in Fig. 10, panels (b)–(e), can be
decomposed into a linear combination of the patterns of pure LDA and HDA,
which suggests coexistence of the two amorphs. A progressive transformation
from one state (LDA) to another state (HDA) is consistent with the data obtained
during pressurization and is suggested by the authors to be evidence for a ‘‘classic
first-order,’’ transition. Please note, however, that there is an inherent none-
quilibrium character to amorphous–amorphous transitions, because amorphous
states by definition structurally relax on the time-scale of the experiment. This
structural relaxation, even though it is very slow and so small that it cannot be
resolved within their experimental setup, is superimposed on the first-order
transition. Therefore, we prefer the notion of a ‘‘first-order like,’’ a ‘‘quasi first-
order,’’ or an ‘‘apparently first-order’’ transition, which was first used by Mishima
et al. [25]. We also note that the conclusion of coexistence was doubted, and the
occurrence of intermediate amorphous ices was suggested because (1) neutrons
rather than X-rays were employed, (2) pressure gradients may blur the analysis,
and (3) a peak shift parameter was necessary in the fit procedure [197].
We now turn from the single, possibly ‘‘first-order like’’ nature of the LDA–
HDA transition to the multiple amorphous–amorphous transitions in water.
When pressurizing LDA at slow rates at 125 K, a stepwise transition
LDA!HDA!VHDA is observed [173]. The piston displacement and density
data as obtained from a piston-cylinder experiment that shows the stepwise
nature are depicted in Fig. 11. The upstroke HDA!VHDA densification of 5%
takes place in the pressure range 0.80–0.95 GPa and is somewhat less sharp
when comparing with the upstroke LDA!HDA densification of 20% at 0.40–
0.50 GPa. During fast compression, the LDA!HDA transition is still sharp,
whereas the HDA!VHDA transition is smeared out over a broad pressure
range [173]. These findings support the possibility of an LDA–HDA first-order
like transition but leave the question open whether a first-order like transition
underlies the HDA!VHDA transition and/or whether the observed second step
Figure 10. Neutron diffraction patterns as LDA (top, Z ¼ 1) transforms to HDA (bottom,
Z ¼ 0) at 130 K. The measured data are shown using open circles. Parameterizations to the data are
shown using lines. Parameterizations of pure LDA at 0 GPa [panel (a)] and pure HDA at 0.5 GPa
[panel (f)] are shown in the inset. The measured data on the upstroke transition at a roughly
estimated pressure of �0.3 GPa [panels (b)–(e)] can be fitted to linear combinations of pure LDA
and pure HDA patterns, where Z indicates the fraction of LDA in the binary LDA–HDA mixture.
Peak shift parameters were employed to account for the peak shift incurred by bringing LDA from
0.0 GPa to 0.3 GPa and HDA from 0.5 GPa to 0.3 GPa. The subtraction of the fitted data from the
measured data is shown below each pattern. The asterisk in panel (f) marks a peak of a small amount
of untransformed hexagonal ice. The amount of the ice contamination remains constant during the
whole experiment because the amorphization of hexagonal ice at 130 K requires pressures much
higher than 0.5 GPa [174, 196]. Reproduced from Ref. [195].
"
50 thomas loerting, vadim v. brazhkin, and tetsuya morishita

is caused by a slow relaxation of HDA to the metastable equilibrium state at
125 K. One way of answering this question is by accelerating the relaxation
dynamics by working at higher temperatures (i.e., by working as close as
possible to the metastable equilibrium). The highest possible temperature at
which crystallization does not interfere is 140 K in case of the downstroke
transition [154]. When decompressing VHDA at 140 K, a single density step is
observed at �0.06 GPa, which is caused by the HDA!LDA downstroke
transition [154]. No density step is related to the VHDA!HDA transition.
Whereas the structural state of VHDA does not change in the pressure range
from 1.1 GPa down to �0.4 GPa, a continuous structural transition to HDA is
observed in the range from �0.40 GPa down to �0.06 GPa. The corresponding
X-ray diffractograms are shown in Fig. 12 [panel (a)] together with an analysis
of the peak position [panel (b)] and full width at half maximum [panel (c)] for
the first broad diffraction peak. Many intermediate states exsist between HDA
and VHDA, which can be quench-recovered, whereas no intermediate states can
be quench-recovered between LDA and HDA. The HDA state quench-recovered
at 0.7 GPa in the upstroke transition at 125 K (cf. Fig. 11) resembles state
A4,0
3,0
2,0
1,0
0,01,4
1,3
1,2
1,1
1,0
0,90,0 0,4 0,6 0,8 1,0 1,2
p / GPa
pist
on d
ispl
acem
ent /
mm
dens
ity /
gcm
-3
1,61,40,2
B
Figure 11. (a) Three curves of ‘‘raw’’ piston displacement data obtained on compressing
300 mg of LDA at 125 K in a piston-cylinder apparatus with a bore diameter of 8 mm at a rate of 20
MPa/min, quenching to 77 K at 1.5 GPa and subsequent pressure release at 77 K (top curves)
together with the apparatus correction (straight line at bottom). (b) Density data calculated from the
‘‘raw’’ piston displacement curve and the apparatus correction with the use of Eq. (1) given in Ref.
[174]. Adapted from Ref. [174].
52 thomas loerting, vadim v. brazhkin, and tetsuya morishita

number 6 in Fig. 12, which was quench-recovered on the downstroke transition
from 140 K and 0.14 GPa. The occurrence of intermediate states is evidence that
no first-order character underlies the HDA$VHDA transition, even though
both the upstroke and the downstroke transition take place in a narrow pressure
interval. We note that the HDA, which transforms to LDA in a first-order-like
manner, is a structural state distinct from the HDA, which is produced by
pressure-induced amorphization of hexagonal ice at 77 K, because the latter is
unrelaxed and far away from the metastable equilibrium state, whereas the
former is structurally relaxed and much closer to the metastable equilibrium.
Nelmes et al. [199], therefore, suggested distinguishing the two states by calling
the latter ‘‘unrelaxed HDA’’ (uHDA) and the former ‘‘expanded HDA’’ (eHDA).
Figure 12. (a) Powder X-ray diffractograms obtained by isothermal decompression of VHDA
(sample 1) at 140 K to several selected pressures, subsequent quenching to 77 K and recovery to
ambient pressure (samples 2–11). The diffractograms (Cu Ka) were recorded at �83 K on a
diffractometer in �–� geometry (Siemens, New York, NY; model D 5000), equipped with a low-
temperature camera of Anton Paar. Curves are shown on the same scale and smoothed with a
21-point Savitzky-Golay polynomial of fifth order. Data are offset and scaled for clarity. The right
panel shows (b) the peak position and (c) the full width at half maximum (FWHM) of the first broad
diffraction peak as a function of the selected decompression pressure. For part (b), the experimental
error of a single measurement is � 0.5�. In some powder diffractograms, sharp features marked by
the dashed lines can be observed. They develop from traces of Ih, which had formed by condensation
of water vapor during transfer of the sample onto the precooled sample holder [198], the X-ray
sample holder itself (chrome-plated Cu: 2� ¼ 44.5�), or remnants of indium. The samples
themselves are fully amorphous. Reproduced from Ref. [155].
multiple amorphous–amorphous transitions 53

The density of eHDA is 1.13 g/cm3, which is about 4% less than the density of
uHDA [200]. The different degree of structural relaxation should be evident
when studying the thermal stability at 1 bar. The well-relaxed state is expected
to be thermally more stable, and this expectation is confirmed experimentally:
At 1 bar, eHDA is stable up to �135 K, whereas uHDA is stable merely up to
�115 K [190, 194, 196]. Earlier, Johari [201] had noticed that HDA produced
from LDA (‘‘eHDA’’) shows ultrasonic properties that differ from HDA
produced from ice Ih (‘‘uHDA’’).
A summary in the form of a ‘‘diagram of metastable amorphous states’’ is
depicted in Fig. 13, in which the upstroke–downstroke hysteresis has been
averaged out. The vertical arrow represents the pressure annealing from
Figure 13. Schematic phase diagram of water’s metastable states. Line (1) indicates the
upstroke transition LDA!HDA!VHDA discussed in Refs. [173, 174]. Line (2) indicates the
standard preparation procedure of VHDA (annealing of uHDA to 160 K at 1.1 GPa) as discussed in
Ref. [152]. Line (3) indicates the reverse downstroke transition VHDA!HDA!LDA as discussed
in Ref. [155]. The thick gray line marked Tx represents the crystallization temperature above which
rapid crystallization is observed (adapted from Mishima [153]). The metastability fields for LDA and
HDA are delineated by a sharp line, which is the possible extension of a first-order liquid–liquid
transition ending in a hypothesized second critical point. The metastability fields for HDA and
VHDA are delineated by a broad area, which may either become broader (according to the
singularity free scenario [202, 203]) or alternatively become more narrow (in case the transition is
limited by kinetics) as the temperature is increased. The question marks indicate that the
extrapolation of the abrupt LDA$HDA and the smeared HDA$VHDA transitions at 140 K to
higher temperatures are speculative. For simplicity, we average out the hysteresis effect observed
during upstroke and downstroke transitions as previously done by Mishima [153], which results in a
HDA$VHDA transition at T¼ 140 K and P� 0.70 GPa, which is � 0.25 GPa broad and a
LDA$HDA transition at T¼ 140 K and P� 0.20 GPa, which is at most 0.01 GPa broad (i.e.,
discontinuous) within the experimental resolution.
54 thomas loerting, vadim v. brazhkin, and tetsuya morishita

unrelaxed HDA (produced at 77 K from ice Ih) at 1.1 GPa to 160 K to VHDA.
VHDA represents the ultimately densified amorphous state of water, which
crystallizes rather than densifies when compressed beyond 2 GPa [204]. The
left-facing arrow shows the downstroke transition at 140 K. VHDA gradually
transforms to HDA in a finite pressure interval. To distinguish this relaxed form
of HDA from uHDA, the term ‘‘expanded HDA’’ is preferable. eHDA represents
the ultimately expanded state of HDA, which transforms to LDA possibly in a
first-order like transition and which may coexist with LDA. Such a coexistence
has been inferred for the upstroke transition [195]. Continued compression of
HDA along the right-facing arrow results in a second transition to VHDA,
which is continuous but confined to a finite pressure interval. Both eHDA and
VHDA are well relaxed and at least close to being metastable equilibrium states.
uHDA, however, is an instable state and inevitably relaxes structurally during
heating. As a working hypothesis, one can assume that eHDA is the closest
possible amorphous state directly related to a deeply supercooled high-density
liquid on the low pressure side (e.g., at 0.2 GPa) and that VHDA is the closest
possible proxy of a deeply supercooled very high-density liquid on the high-
pressure side (e.g., at 1.5 GPa). In addition, there is a possible low-density liquid
related to LDA, and hence, there may be three deeply supercooled liquids. A
direct experimental proof for such a correspondence between amorphous states
and deeply supercooled liquids is missing currently. What needs to be done here
is to measure the in situ relaxation times directly and to determine whether a
glass!liquid transition occurs during isobaric heating. The first results
obtained by dielectric relaxation spectroscopy of VHDA at 1 GPa suggest
that VHDA indeed shows liquid-like relaxation behavior at 140 K [205, 206].
The question of whether the amorphous states of water behave like glasses (i.e.,
vitrified liquids), which turn into liquids during heating, or whether they behave
like crystals, which do not liquify during heating, is highly disputed as outlined
in the following section.
E. Are the Amorphous Solids Glasses or Nanocrystallites?
The question of whether there is a true glassy nature of amorphous ices is of
interest when speculating about possible liquid–liquid transitions in (deeply)
supercooled water. For true glasses, the amorphous–amorphous transitions
described here can be viewed as the low-temperature extension of liquid–liquid
transitions among LDL, HDL, and possibly VHDL. That is, the first-order like
LDA$HDA transition may map into a first-order LDL$HDL transition, and
the continuous HDA$VHDA transition may map into a smeared HDL$VHDL
transition. Many possible scenarios are used how to explain water’s anomalies
[40], which share the feature of a liquid–liquid transition [202, 207–212]. They
differ, however, in the details of the nature of the liquid–liquid transition: Is it
continuous or discontinuous? Does it end in a liquid–liquid critical point or at the
reentrant gas–liquid spinodal?
multiple amorphous–amorphous transitions 55

Except for HGW, which is commonly accepted to be a true glass, there is a
lot of debate and scientific discourse regarding a possible nanocrystalline nature
of amorphous ices. Evidence is abundant in the literature both for a ‘‘pro-glass’’
and a ‘‘contra-glass’’ view.
In the case of LDA, it has been suggested that it behaves in many respects
similar to ice I. Comparison of vibrational spectra and oxygen K-edge X-ray
absorption spectra of LDAwith ice [151, 213, 214] and an analysis of Gibbs free
energies (which indicates that LDA would need to transform to ice Ih by
pressurizing to 0.7 GPa at 77 K rather than HDA if LDA were indeed a glass)
suggest that LDA is not a truly amorphous material [215]. The absence of fast
precursor dynamics in LDA during heating from 2 K to 170 K in elastic high-Q
backscattering neutron diffraction was interpreted as evidence against the glassy
nature of LDA, because fast precursor dynamics would be expected from
predictions by mode coupling theory near the glass transition [216]. Inelastic
X-ray scattering in the 1–15 nm�1 momentum transfer (Q) range shows sharp,
crystal-like phonons [217]. Also, crystal-like features in the thermal con-
ductivity of LDA indicate that phonon–phonon scattering is dominant [218].
LDA, like cubic ice and hexagonal ice, shows a negative Bridgman parameter,
which characterizes the density dependence of the thermal conductivity.
However, the 1H-spin lattice relaxation time of LDA (and also HDA) at 77 K is
very different from the 1H-spin lattice relaxation time of crystalline ices [178].
Also, a thermally reversible glass! liquid transition was measured in LDA at a
temperature of 134 K, which is accompanied by a change in heat capacity
�cp� 0.7 J/Kmol [219]. (Please note that Tg for LDAwas initially erroneously
reported to be 129 K [220–222]). The DSC curves for LDA are remarkably
similar to the DSC curves of annealed ASW [138] and HGW [223–226], which
both show a Tg of 136 K at a heating rate of 30 K/min. The activation energy of
structural relaxation near Tg was determined to be �55 kJ/mol [224]. So,
judging from DSC experiments, HGW, ASW, and LDA are very similar not only
in terms of static structure as outlined in Section III.B, but also in terms of their
glass! liquid transition [138, 219]. Ultrafast scanning of pure ASW samples at
a heating rate of up to 105 K/s seems to be in contradiction, because no sign of a
glass!liquid transition up to�205 K was reported, where it crystallizes to ice Ic
[227]. However, Johari [228] suggested that this conclusion was made
prematurely, and a reanalysis of the data is necessary. To resolve the question
of whether a difference exists between LDA, which may be nanocrystalline or a
glass, and HGW, which is definitely a glass, it would be highly instructive to study
vibrational spectra and thermal conductivity in HGW samples and compare the
results directly with the LDA case.
In the case of ASW, the self-diffusivity shows contradicting experimental
evidence. At temperatures up to 125 K, the mobility of protons injected into
annealed D2O-ASW at 80 K was shown to be consistent with orientational
56 thomas loerting, vadim v. brazhkin, and tetsuya morishita
diffusion based on L-defect activity rather than molecular diffusion. This
finding suggests that fluidity does not develop when heating to above the
glass!liquid transition at 136 K and that the isotopic exchange behavior in
annealed D2O-ASW resembles the behavior in cubic ice [229]. However, the
self-diffusivity as measured by hydrogen/deuterium (H/D) isotope exchange in
the 150–160 K range is roughly a millionfold greater than that expected for
crystalline ice and is in accordance with a fluid-like translational diffusive
motion. This is consistent with an amorphous solid that melts into a deeply
supercooled liquid prior to crystallization [230, 231]. Self-diffusivity measure-
ments performed by thermal desorption spectroscopy in layered films of ASW
and organic spacers indicate that interlayer mixing in the 150–160 K range does
not occur by diffusion through a dense phase but through an interconnected
network of cracks/fractures created within the ASW film during crystallization.
This implies that the self-diffusivity of ASW below crystallization is inconsistent
with a ‘‘fragile’’ liquid and leaves the two options of (1) Tg > 160 K or (2) the
liquid above Tg� 136 K is a ‘‘strong’’ liquid [232, 233]. The picture of ASW
transforming into a ‘‘strong’’ liquid above Tg � 136 K is supported by electron
diffraction studies of the crystallization behavior of ASW. These studies show an
onset of the amorphous relaxation (coincident with the glass transition) prior to
crystallization. Above the glass transition temperature, the crystallization kinetics,
film morphology changes, changes in binding energy of water molecules, and
band shape changes are consistent with the amorphous solid becoming a ‘‘strong’’
ultraviscous liquid [234, 235]. The concept of a dynamic crossover from ‘‘fragile’’
(at T > 230 K) to ‘‘strong’’ (at T< 150 K) was also invoked for the case of HGW.
Although it was suggested initially that theweak glass! liquid transition in HGW
at �136 K [222] would merely be a shadow of a pronounced but hidden
glass! liquid transition at �160–165 K [236, 237], the consensus is now that the
weak endothermic step observed at �136 K is a real glass! liquid transition to a
deeply supercooled ‘‘strong’’ liquid [212, 225, 226, 238].
In the case of HDA, it has been proposed that HDA may be a mixture of highly
strained nanocrystalline high-pressure phases of ice instead of being a homo-
geneously random structure [239]. Also for VHDA, it was suggested [240] that its
structure factor is highly reminiscent of the structure factor obtained for a
mechanically collapsed and densified ice [241]. From inelastic neutron scattering,
it was inferred that HDA shows vibrational spectra similar to ice VI [242], (i.e.,
short-range atomic correlations and force constants are similar in HDA and ice VI,
whereas the degree of disorder on a long-range scale differs). Inelastic neutron
scattering (INS) shows that the first phonon peak in the 0.5–20meV range is softer
for LDA compared with HDA [243]. However, INS in the energy transfer region
2–500 meV (i.e., 16–4025 cm�1) shows HDA to behave glass-like in the
translational and librational regions (<150 meV) [214]. Other INS studies
illustrate clearly an excess number of modes in the HDA density of states at 5 K
multiple amorphous–amorphous transitions 57

centered at 0.65 THz, which is not found in LDA, ice Ic, or ice Ih [244]. The
thermal conductivity of HDA ice under pressure, by contrast to LDA, follows the
behavior expected for a glass and a positive Bridgman parameter [218]. Similarly,
the Gruneisen parameter that characterizes low-frequency phonons is negative for
LDA (i.e., crystal like), but is positive for HDA (i.e., glass like) [245]. Also, the
two-level system density of states in HDA is comparable with that found in many
conventional glasses (by contrast to LDA) [246].
The phonon dispersion of hexagonal ice measured by inelastic neutron
scattering up to 0.5 GPa at 140 K reveals a pronounced softening (e.g., for a
transverse acoustic phonon branch), which is suggested to be at the origin of
anomalous features of hexagonal ice, such as its negative thermal expansion
coefficient below 60 K and solid-state amorphization [247]. Extrapolation of the
data to 2.5 GPa, where some mode frequencies approach zero, suggests that
pressure-induced amorphization of hexagonal ice is caused by mechanical
melting rather than by thermodynamic melting. An ultrasonic study suggests
that the ice Ih!HDA transition is, very much alike the LDA!HDA transition,
preceded by elastic softening. This finding can be interpreted in favor of the
crystal lattice instability paradigm [187, 248]. Whereas at low temperatures
(<162K), the Born stability criterion of lattices is violated (‘‘mechanical
melting’’), at higher temperatures (>162 K) a Lindemann transition is observed
(‘‘thermodynamic melting’’) [151, 249]. It has been noted that the mechanism
of solid-state amorphization is not only temperature dependent but also time-
and pressure-dependent, and it cannot be described in terms of Born/Lindemann
criteria as long as crystal-size effects (stresses at grain boundaries, etc.) and
production of lattice faults during uniaxial pressurization are incorporated
properly [239, 250].
The best evidence so far for the glassy nature of HDA was provided (1) by
measurements of the dielectric relaxation time under pressure at 140 K
[206, 251], (2) by the direct vitrification of a pressurized liquid water emulsion
to HDA [252], and (3) by a high-pressure study of the glass!liquid transition
using differential thermal analysis (DTA) [253]. We note here that these studies
probe structurally relaxed HDA (eHDA) rather than unrelaxed HDA. It is
possible that structurally relaxed HDA behaves glass like, whereas structurally
uHDA shows a distinct behavior. Thus, more studies are needed in the future,
which directly compare structurally relaxed and unrelaxed HDA.
IV. SEMICONDUCTORS
A. General Comments
The tetrahedral open network is a specific characteristic not only of water and
silica but also of covalent systems such as Si and Ge (group IV semiconductors)
[254, 255]. These substances share many characteristics with water, such as
58 thomas loerting, vadim v. brazhkin, and tetsuya morishita
locally tetrahedral coordination at ambient pressure, negative melting slope in
the P-T phase diagram, denser liquid than its crystalline form, and so on. All of
these characteristics come from the tetrahedral network structure, which in fact
plays a key role in water’s polyamorphism. Because the tetrahedral network in Si
and Ge is preserved in amorphous forms as well as in crystalline forms at
ambient pressure, one naturally expects that Si and Ge exhibit polyamorphic
transformations similar to those in water (ice).
Unlike that in water, the tetrahedral network in Si and Ge mainly consists of
covalent interatomic bonding, which makes the network more rigid than
hydrogen bonding, leading to relatively high melting temperatures (e.g., 1687 K
for c-Si). Although crystalline and amorphous states at ambient pressure hold
the rigid network that exhibits a semiconducting nature, liquid and solid states
under high pressure contain a highly distorted or collapsed tetrahedral network,
which results in a metallic nature. The semiconductor–metal transition would
thus be likely to accompany polyamorphic transformations in Si and Ge, in
contrast to those in water. Because of such a substantial change in the electronic
state (interatomic bonding), a two-state model [256–259] has often been
invoked to describe polyamorphic transformations in Si and Ge. This model was
originally developed by Rapoport [256] to account for the anomalous (negative)
slope of the melting curve in tetrahedrally coordinated liquids.
B. Amorphous Si
Convincing evidence for multiple amorphous phases in Si has been provided
only recently. The first indication of pressure-induced amorphous–amorphous
transition in Si was reported by Shimomura and colleagues [260, 261]. The
electronic resistance of an amorphous Si (a-Si) film of about 1 mm thickness was
measured in a compression–decompression cycle [260]. The electronic
resistance showed a substantial drop at about 10 GPa in the compression
process, which indicates a transition to a metallic state. In the decompression
process, in contrast, the electronic resistance showed a large hysteresis and
returned to the original semiconducting value only gradually. X-ray diffraction
patterns were measured at 0 GPa for both the initial and final samples in the
compression–decompression cycle, and amorphous patterns were obtained for
both samples [260]. However, the X-ray diffraction patterns were not obtained
for the metallic sample under pressure, so it remains uncertain whether densified
metallic Si retained an amorphous form at �10 GPa. In fact, other experiments
have shown that a-Si is transformed to b-tin crystal (a high-pressure polymorph
[255]) above 10 GPa [262], which may have been realized in the experiment of
Shimomura et al. [260].
Instead of pressurizing a-Si, Deb et al. [263] obtained a densified a-Si via
pressurizing porous Si. They prepared films of porous Si having crystallite of
�5 nm (on average). In situ measurements of X-ray diffraction patterns and
multiple amorphous–amorphous transitions 59

Raman spectra for the sample were conducted in a compression–decompression
cycle. In this experiment, the crystalline diffraction began to disappear above
7–8 GPa during compression, and pressure-induced amorphization was
indicated by the Raman spectra above �13 GPa (Fig. 14). The resultant HDA
Si exhibits the Raman spectrum that differs from the spectrum of normal a-Si
(LDA Si). Rather, the characteristics of the spectrum for HDA Si resemble those
of the b-tin crystal, which indicates that HDA Si has a (locally) analogous
structure to the b-tin structure. The synthesis of the HDA form of Si by Deb
et al. [263] has a strong resemblance to that of water (ice) by Mishima et al.
[149, 196]. Whereas compression induced amorphization that was almost
completed at 13–15 GPa, decompression induced an HDA–LDA transition
below 10 GPa, which is clearly shown in the Raman spectra (Fig. 14). This is
the first direct observation of an amorphous–amorphous transition in Si. The
spectrum at 0 GPa after the pressure release exhibits the characteristic bands of
tetrahedrally coordinated a-Si (LDA Si). Based on their experimental findings
Deb et al. [263] discussed the possible existence of liquid–liquid transition
in Si by invoking a bond-excitation model [258, 259]. They have predicted a
first-order transition between high-density liquid (HDL) and low-density liquid
Figure 14. Raman spectra of porous Si in a compression–decompression cycle [263]. In the
compression process, the characteristic spectrum of nanocrystalline Si disappears above �13 GPa
and a broad amorphous feature emerges. In the decompression process, the characteristic spectrum
of the LDA form grows below �9 GPa, which indicates an HDA-to-LDA transition.
60 thomas loerting, vadim v. brazhkin, and tetsuya morishita

(LDL) below 1600 K at 1 atm and a second critical point at a negative pressure
[263].
The transition from LDA to HDA Si was observed in the successive
experiment by McMillan et al. [264]. In situ Raman spectra and electronic
resistance measurements were performed with optical observation. After
compression, the LDA form prepared by solid-state metathesis synthesis [10]
was found to be transformed to the HDA form at �14 GPa. The electronic
resistance exhibited a sharp decrease at 10–14 GPa (Fig. 15), which is consistent
with the early experimental findings by Shimomura et al. [260]. Optical
micrographs show that HDA Si is highly reflective, whereas LDA Si is dark
colored and nonreflective. This finding again supports that the LDA–HDA
transition of Si is accompanied by a semiconductor–metal transition. Reverse
transitions with large hysteresis were also observed; LDA Si began to form from
HDA Si at 4–6 GPa after decompression from �20 GPa.
It should be noted that no direct structural information about HDA Si was
obtained in the experiments by Deb et al. [263] and McMillan et al. [264]. Their
experimental data imply that HDA Si is structurally based on the b-tin structure,but the data are not sufficient to experimentally determine the structure of
HDA Si.
Computer simulation studies have taken the lead in disclosing structural
properties of HDA Si. In particular, ab initio calculations are playing a
significant role in predicting the structural properties of HDA Si [265, 266].
Ab initio molecular-dynamics (MD) simulations based on plane-wave density
functional theory (DFT) were performed by Morishita [265] to investigate the
1000
100
Res
ista
nce
(Ω
)
10
0 3 6 9 12
Pressure (GPa)
Decompression
Compression
15 18 21
Figure 15. Electrical resistance measurements of a-Si in a compression–decompression cycle
[264].
multiple amorphous–amorphous transitions 61

LDA–HDA transition of Si at an atomistic level. LDA Si was pressurized in a
stepwise manner, whereas the temperature was maintained at 300 K. At 12 GPa,
the LDA form was transformed to the HDA form with large volume reduction
(�10%). The pair correlation functions g(r) for the LDA form and the HDA
form thus obtained are given in Fig. 16. The first peak of g(r) is considerably
broadened and becomes less intense after the transition to HDA. The second
peak shifts to smaller r, and the separation between the first and second peaks is
not as clear in HDA as in LDA. The coordination number Nc obtained by
integrating 4pr2r*g(r) up to the first minimum is 4.0 for LDA, whereas it is 5.1
for HDA (where r* is the number density). Detailed structural analyses indicate
that the first four neighboring atoms in HDA still form a (distorted) tetrahedral
configuration, but the fifth neighboring atom is located at an open space of the
tetrahedron (Fig. 16). It is thus considered that the HDA structure is constructed
by forcing the fifth neighboring atom, which is outside of the first coordination
shell of the LDA structure, into an interstitial position. This mechanism
Figure 16. Structural profiles of LDA and HDA Si obtained from the plane-wave DFT
calculations [265]. (a) Pair correlation functions g(r) for HDA (at 12 GPa, solid lines) and LDA (at
0 GPa, dashed lines). (b) Structure factors S(Q) for HDA (at 12 GPa, solid lines) and LDA (at 0 GPa,
dashed lines). (c, d) Atomic configurations for (c) LDA and (d) HDA. Atoms separated by 2.55 A or
less are linked by thick lines (covalent-like bonds), whereas those separated by 2.857 A or less are
linked by thin lines.
62 thomas loerting, vadim v. brazhkin, and tetsuya morishita
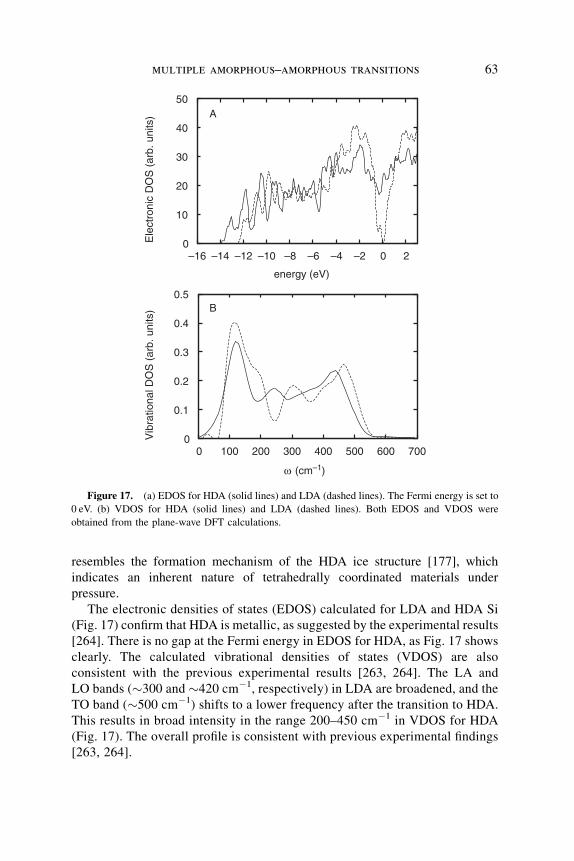
resembles the formation mechanism of the HDA ice structure [177], which
indicates an inherent nature of tetrahedrally coordinated materials under
pressure.
The electronic densities of states (EDOS) calculated for LDA and HDA Si
(Fig. 17) confirm that HDA is metallic, as suggested by the experimental results
[264]. There is no gap at the Fermi energy in EDOS for HDA, as Fig. 17 shows
clearly. The calculated vibrational densities of states (VDOS) are also
consistent with the previous experimental results [263, 264]. The LA and
LO bands (�300 and �420 cm�1, respectively) in LDA are broadened, and the
TO band (�500 cm�1) shifts to a lower frequency after the transition to HDA.
This results in broad intensity in the range 200–450 cm�1 in VDOS for HDA
(Fig. 17). The overall profile is consistent with previous experimental findings
[263, 264].
0
10
20
30
40
50A
B
–16 –14 –12 –10 –8 –6 –4 –2 0 2
Ele
ctro
nic
DO
S (
arb.
uni
ts)
energy (eV)
0
0.1
0.2
0.3
0.4
0.5
0 100 200 300 400 500 600 700
Vib
ratio
nal D
OS
(ar
b. u
nits
)
ω (cm–1)
Figure 17. (a) EDOS for HDA (solid lines) and LDA (dashed lines). The Fermi energy is set to
0 eV. (b) VDOS for HDA (solid lines) and LDA (dashed lines). Both EDOS and VDOS were
obtained from the plane-wave DFT calculations.
multiple amorphous–amorphous transitions 63

HDA Si obtained in Morishita’s simulation shares traits with the b-tin form in
the short-range atomic configuration. Both forms contain distorted tetrahedral
configurations with Nc of 5–6. However, ab initio calculations by Durandurdu and
Drabold [266] demonstrated that other types of high-density amorphous Si could
be formed by densification. On the basis of DFT calculation with a local-orbital
basis set, they simulated a dynamical relaxation process from 800 K to 0 K for the
LDA form at various pressures in the range of 0–17 GPa. The LDA form was
preserved up to�16 GPa, but it relaxed to a completely different amorphous form
at a slightly higher pressure (16.25 GPa). The density of the resultant amorphous
form is over 20% higher than that of the LDA form, and it is still higher than that
of the HDA form obtained in Morishita’s calculation [265]. We thus call this
amorphous form VHDA Si to echo the terminology used to describe VHDA ice
[152, 171, 265]. The characteristics of g(r) for the VHDA form (Fig. 18) are
similar to those of the HDA form. However, the Nc of VHDA is 8–9, which is
much higher than that of HDA. The atomic configurations in VHDA, in fact, seem
to contain fragments of the simple-hexagonal (sh) structure whose Nc is 8. Note
that the sh structure is experimentally obtained by pressurizing the b-tin structureof Si above �16 GPa. [255]. VHDA Si is also found to be metallic and to have a
relatively structureless profile of VDOS (Fig. 18).
These theoretical studies suggest the possibility of multiple amorphous–
amorphous transitions in Si like those observed in water, although this has
not yet been confirmed experimentally (Fig. 19). The notable point is that the
pressure-induced sequence of amorphous Si (LDA, HDA, and VHDA) resem-
bles that of crystalline Si (the diamond, b-tin, and sh structures [255]). This
similarity suggests that amorphous structures are formed based on the
corresponding crystalline structures according to the external pressure. We
would like to point out, however, that many metastable crystalline structures are
observed in Si [255]. This means that the free energy landscape is immensely
complicated, and many local minima, each corresponding to an amorphous or
crystalline form, are located in the landscape. It is therefore likely that many
variants of the HDA or VHDA forms can be observed experimentally,
depending on the sample preparation as well as on the external conditions
(temperature and pressure).
Very recently, the structure of HDA-Si was experimentally disclosed by
means of X-ray diffraction measurements [267, 268]. Daisenberger et al.
[267] have attempted to obtain the structure factor S(Q) for the HDA form under
pressure. Figure 20 shows the experimentally obtained S(Q) for LDA (3–13.5
GPa) and HDA (16.5 GPa). As the pressure is increased from 13.5 to 16.5 GPa,
the first peak becomes more intense than the second peak and shifts to larger Q.
The shift of the first peak indicates a large densification, and the overall features
are in good agreement with the ab initio MD results [265] (Fig.16). Un-
fortunately, however, g(r) calculated from the S(Q) by Fourier transformation
64 thomas loerting, vadim v. brazhkin, and tetsuya morishita

has insufficient accuracy to compare it with the theoretical g(r) because of the
finite Q range. Partial recrystallization to the b-tin phase during the
measurements also made it difficult to refine the raw S(Q) data. These problems
prevent us from obtaining real-space structural information such as g(r) and Nc.
To gain deeper insights into the HDA structure, Daisenberger et al. also
performed classic MD simulations of the LDA–HDA transition [267, 268] using
the Stillinger–Weber (SW) potential [269]. Their MD results are consistent with
their experiment and the previous ab initio MD result [265], and concluded that
fivefold-coordinated Si atoms are a major component of the HDA structure.
Figure 18. (a) Pair correlation functions g(r) for a-Si at various pressures. (b) VDOS for c- and
a-Si at various pressures. Both g(r) and VDOS were obtained from the DFT calculations with a local-
orbital basis set [266].
multiple amorphous–amorphous transitions 65
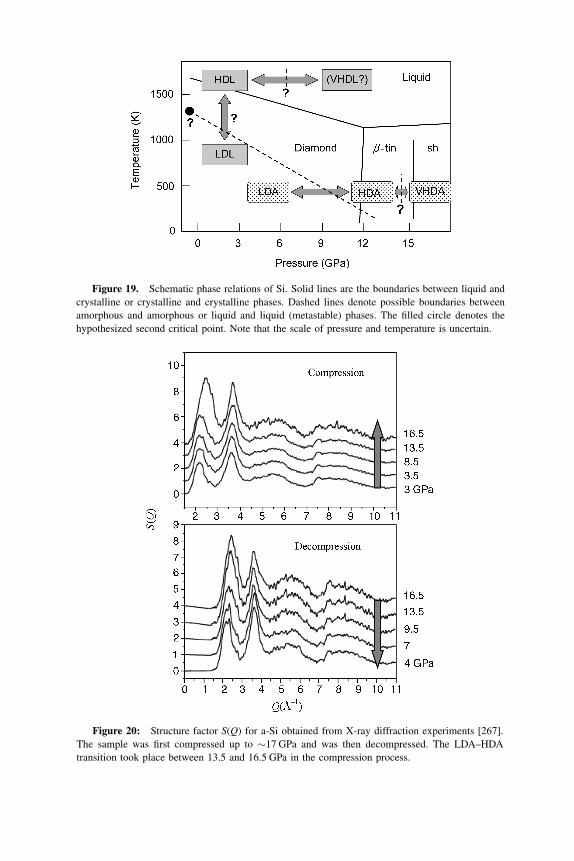
Figure 19. Schematic phase relations of Si. Solid lines are the boundaries between liquid and
crystalline or crystalline and crystalline phases. Dashed lines denote possible boundaries between
amorphous and amorphous or liquid and liquid (metastable) phases. The filled circle denotes the
hypothesized second critical point. Note that the scale of pressure and temperature is uncertain.
Figure 20: Structure factor S(Q) for a-Si obtained from X-ray diffraction experiments [267].
The sample was first compressed up to �17 GPa and was then decompressed. The LDA–HDA
transition took place between 13.5 and 16.5 GPa in the compression process.

Experimental difficulties often lie in obtaining structural data of metastable
(amorphous) forms under pressure. Simulation results that complement
experimental results are therefore of significant help to interpret experimental
data, as demonstrated by Daisenberger et al.
C. Amorphous Ge
In contrast to what is known about a-Si, much less is understood about
polyamorphism in Ge. The authors of most early experiments reported no direct
evidence of LDA–HDA transition in Ge [260–262, 270, 271]. Shimomura et al.
[260] observed a stepwise drop of the electronic resistance (at 6 and 10 GPa)
after compression of an a-Ge film. This decrease, however, may have resulted
from (partial) recrystallization to a metallic high-pressure polymorph under
pressure. Tanaka [270] measured X-ray diffraction patterns and optical
absorption spectra of a-Ge at pressures up to 10 GPa. In this experiment, the
sample was indeed partly transformed to the b-tin crystalline phase (�25% in
volume) at 6 GPa. Imai et al. [262] also observed an amorphous to b-tin crystal
transition. Freund et al. [271], in contrast, have observed no sign of crystal-
lization or transition to an HDA form after compression up to �9 GPa.
Although LDA–HDA transitions were not observed directly in these
experiments, recent experimental [272] and theoretical studies [273] have
demonstrated that Ge actually exhibits amorphous–amorphous transition. Using
X-ray absorption spectroscopy (XAS), Principi et al. [272] have detected an
abrupt change in the local structure and electronic states at �8 GPa in a
compression–decompression cycle of a-Ge. The first-neighbor average distance
gradually shrank during compression, but it abruptly expanded at �8 GPa. This
structural transition is, in contrast to a-Si, irreversible: The modified XAS
spectra above 8 GPa was preserved after decompression to 0 GPa (Fig. 21). The
obtained new amorphous form shows signatures of a metallic character, and its
Nc is roughly estimated to be �4.5 (increase by �12%).
Ab initio calculations by Durandurdu and Drabold [273] also support the
existence of amorphous–amorphous transition in Ge. They found that LDA Ge
was abruptly transformed to an HDA form at 12.75 GPa by using the same
computational protocol as that used in their LDA–VHDA transition study of Si
[266]. The density of the resultant HDA form is about 20% higher than that of
LDA Ge, and its Nc is calculated as �8. This HDA form therefore strongly
resembles the VHDA form of Si, rather than the HDA form of Si. This
simulation in passing shows that the transition is irreversible, which is
consistent with the experiment by Principi et al. [272].
A tight-binding (TB) MD study to examine the pressure effect on structural
and dynamical properties of a-Ge has also been reported [274]. The calculations
were performed based on the order-N nonorthogonal TB framework using the
Fermi operator expansion method [275]. The TB MD calculations were run with
multiple amorphous–amorphous transitions 67

linear 1% increases in density from 4.79 (LDA Ge) to 7.69 g/cm3. Only a
gradual structural change was observed with increasing density, but the first-
peak position of g(r) showed anomalous density dependence: It shifted to
smaller r as the density was increased up to 6.0 g/cm3 but then began to shift to
larger r with the density up to 7.0 g/cm3. Although no abrupt structural change
was observed, an HDA form structurally based on the b-tin structure was found
to be formed at the density above �6.5 g/cm3. The b-tin structure of Ge is
experimentally stable in a very wide pressure range (10–75 GPa) [255]. Thus,
the formation of such a ‘‘b-tin-like’’ HDA form is highly plausible. It is worth
noting that, in a recent experiment, vitrification of l-Ge under pressure has been
attempted, where the ‘‘b-tin-like’’ HDA Ge is expected to form [276].
Unfortunately, the experimental and theoretical studies described above do not
provide a consistent picture of polyamorphic transformations of Ge. The ab initio
calculations [273] have predicted a highly densified a-Ge with Nc of �8, which
may be categorized as VHDA (a third amorphous form). However, considering
the stability of the b-tin structure in a wide pressure range, a ‘‘b-tin-like’’ HDAform is more likely to be formed in Ge, as suggested in Refs. [272, 274, and 276].
Additional experimental evidence is eminently desirable.
D. Liquid Si and Ge (l-Si and l-Ge)
The discovery of multiple amorphous phases has put the spotlight on underlying
liquid–liquid (L–L) transitions. Here, attempts thus far to discover possible L–L
transitions of Si and Ge will be briefly reviewed. By analogy with L–L transition
Figure 21. X-ray absorption spectroscopy data of a-Ge in a compression–decompression
cycle [272]. See color insert.
68 thomas loerting, vadim v. brazhkin, and tetsuya morishita

in water, supercooling l-Si or Ge is a promising route to induce possible L–L
(HDL–LDL) transitions (see Fig. 19).
Many experiments have been conducted to measure S(Q) and density, as well
as other thermodynamic properties, such as heat capacity, of supercooled l-Si
using the containerless levitation technique [277–286]. Almost the same profile
of S(Q) is obtained in all these experiments around the melting temperature
(1687 K). However, different tendencies of structural changes during super-
cooling have been reported among these experiments. For instance, some
experiments show that Nc decreases during cooling [277, 279], whereas others
show that Nc increases or is retained at a constant down to �1400 K (Fig. 22)
[278, 280, 281]. This inconsistency in structural information may partially come
from the enormous difficulty in measuring supercooled l-Si in situ, which results
in the strong dependence on each experimental measurement. Interestingly,
based on their experimental finding that Nc is constant during supercooling, Kim
et al. [280] have concluded that Si exhibits no L–L transition.
A recent ab initio MD study [287] has revealed an anomalous structural change
of l-Si after cooling and has resolved the controversial experimental findings
described above. This ab initio (plane wave DFT) study has shown that Nc is
indeed constant after supercooling down to�1400 K, as found experimentally by
Kim et al. [280] and Higuchi et al. [281]. However, the calculations have also
shown that Nc begins to decrease below �1200 K, the temperature at which the
density maximum occurs [287] (Fig. 22). The tetrahedral network structure is
found to grow rapidly during cooling below �1200 K, which has called Kim’s
conclusion (no L–L transition) into question (note that no experimental
measurement is currently accessible below �1350 K).
5
5.2
5.4
5.6
5.8
6
6.2
6.4
1000 1200 1400 1600 1800
Coo
rditi
on n
umbe
r N
c
Temperature (K)
Morishita [287]Ansell et al. [277]
Kimura et al. [278]Jakse et al. [279]
Kim et al. [280]
Figure 22. Temperature dependence of Nc in l-Si during supercooling. All data are
experimentally obtained [277–280], except those indicated by the filled circles, which are the ab
initio MD results [287].
multiple amorphous–amorphous transitions 69

Clear evidence of L–L transitions has been found only in l-Si modeled by the
SW potential [269]. Sastry and Angell [288] performed MD simulations of
supercooled l-Si using the SW potential. After cooling at ambient pressure, the
liquid (HDL) was transformed to LDL at �1060 K. The Nc in LDL is almost 4,
and the diffusivity is low compared with that in HDL. The structural properties
of LDL, such as g(r) and Nc, are very close to those of LDA, which indicates
that this HDL–LDL transition is a manifestation of the multiple amorphous
forms (LDA and HDA) of Si. McMillan et al. [264] and Morishita [289] have
also found structural fluctuations between LDL-like and HDL-like forms in
their MD calculations for l-Si at 1100 K. Morishita has demonstrated that such a
structural fluctuation induces spatial and temporal dynamical heterogeneity, and
this heterogeneity accounts for the non-Debye relaxation process that becomes
noticeable in the supercooled state [289].
However, we point out that the nature of the L–L transition in SW MD
calculations strongly depends on the external conditions and details of the
parameters used in the SW potential [290]. For instance, a slight change of the
external pressure simply results in a gradual structural change during
supercooling [290]. In fact, the SW model gives much lower density than the
experimental density for l-Si at ambient pressure [289]. An external pressure of
5–6 GPa is necessary to obtain the experimental density in the SW model, but
the L–L transition can never be observed under this pressure, and the liquid
simply vitrifies to an HDA-like solid [287, 289, 291]. Additional improvements
in both experiments and theoretical calculations are thus necessary to clarify
whether l-Si actually exhibits L–L transitions.
The situation is the same in l-Ge. Although X-ray absorption measurements
[292] and TB MD calculations [293] have been carried out for supercooled
l-Ge, L–L transitions have not yet been firmly confirmed.
Pressurization is another possible way to observe L–L transitions or related
phenomena (Fig. 19), but many difficulties lie in measuring l-Si and l-Ge in situ
under high pressure. Therefore, only a few experimental studies have been
reported to date [294–296]. Tsuji and colleagues measured l-Si and l-Ge in
relatively wide pressure ranges: 4-23 GPa for l-Si [294] and 1- 25 GPa for l-Ge
[295, 296]. Although no discontinuous structural change was observed in either
liquid, anomalous pressure dependence of the nearest neighbor distance was
revealed in l-Si, which expanded about 1.6% between 8 and 14 GPa despite the
pressurization. This finding may reflect an underlying drastic structural change
at lower temperatures (likely below the melting lines; see Fig. 19). It was also
found that anisotropy of the local structure in l-Ge, which is estimated by the
ratio of the second peak position to the first peak position of S(Q), persists up to
25 GPa.
Simulation studies [297, 298] have supported the experimental results of
Tsuji et al. [295]. In addition to structural information, ab initio MD
70 thomas loerting, vadim v. brazhkin, and tetsuya morishita

calculations have predicted dynamical properties of l-Si under pressure, such as
the intermediate scattering function F(q; t) [297] and self-diffusion coefficients
D [298]. What should be stressed here is that deeply supercooled l-Si
exhibits anomalous pressure dependence of the diffusivity [298]. At 1100 K, D
increases as the pressure increases up to �10 GPa, but it begins to decrease
above �10 GPa. This diffusive anomaly has already been observed in water
[299, 300] and silicate melts [301–303], and it is attributed to the collapse of the
open tetrahedral network by densification. The fact that the diffusive anomaly
is also exhibited in l-Si strongly suggests that tetrahedrally coordinated liquids
(e.g., water, silicate melts, and l-Si) share common characteristics that would
play a fundamental role in polyamorphism in these substances.
V. DISCUSSION AND CONCLUSIONS
Overall, recent experimental and theoretical studies have supported the existence
of multiple amorphous phases in oxide glasses, water, and semiconductors.
Although many parallels exist regarding the amorphous–amorphous transitions,
there are also substantial differences. Parallels include the change of coordina-
tion number and intermediate range order during compression while retaining an
amorphous character. The most prominent difference is the sharp transition with
a possible first-order nature from LDA-water to HDA-water, which has not been
observed in any other substance. Of course, also temperature and pressure ranges
where the transitions are observed differ substantially because of the different
interactions involved (e.g., hydrogen-bond interaction versus van der Waals
interaction). However, the continuous HDA–VHDA transition in water
resembles the broader transitions also observed in silica, even though the nature
of intermolecular forces is different.
In the case of oxides, one can conclude that transformations in the glasses in
many respects are similar to the transitions that occur in their crystalline
counterparts. The most prominent phenomenon in the oxide glasses under
compression is coordination increase: 4-to-6 in the case of a-SiO2 and a-GeO2,
and 3-to-4 in the case of a-B2O3. Computer simulations predict an additional
increase of coordination number at pressures exceeding 100 GPa—up to 8 for
a-SiO2 and a-GeO2, and up to 6 for a-B2O3, with the analogy of corresponding
crystalline substances. These transformations still have to be discovered
experimentally in the future. However, several aspects of the phase transition
delineate the behavior of oxide glasses from the behavior in the crystals.
The coordination transformation occurs in broad pressure intervals and inter-
mediate coordination—five-fold, which does not exist in the crystalline high-
pressure modifications, is very important in the case of a-SiO2 and a-GeO2.
Second, in all glasses at lower pressures there are transformations, which modify
the intermediate-range order (ring-statistics etc.). These transformations are
multiple amorphous–amorphous transitions 71

strongly promoted by heating under pressure, and they have no direct analogs in
the corresponding crystals.
In the case of water, the three amorphous states LDA, HDA, and VHDA can
be distinguished by the number zero, one, or two interstitial water molecules near
the faces of the tetrahedron called the ‘‘Walrafen pentamer.’’ The tetrahedron
itself is not much distorted except for a slight increase of OO-distance caused
by the repulsion of interstitial water molecules. Recent studies have suggested
that a clear distinction between structurally unrelaxed HDA (uHDA) and struc-
turally relaxed HDA (eHDA or VHDA) has to be made in the future. Although
currently it is not entirely clear whether the amorphous ices are glasses struc-
turally related to deeply supercooled liquids or nanocrystals, this distinction
may help in sorting out the issue. It is clear now that there is at most one
first-order-like transition in amorphous ices and in addition a continuous transition
taking place in a finite pressure interval.
In case of Si, it seems that the degree of tetrahedrality is the key to
characterizing disordered phases. Degradation of tetrahedrality in HDA Si is
moderate, whereas that in VHDA Si is considerable. The striking similarity
between the pressure–induced transition sequence of a-Si (LDA-HDA-VHDA)
and that of c-Si (D-b-tin-sh) may give a hint to the essential mechanism for
polyamorphism in Si. We would like to stress that many metastable crystalline
phases such as BC8 (Si-III) have been observed in Si [252], which indicates that
the free energy landscape is likely to be highly complicated and that many
variations of each amorphous form may be formed.
Although supporting evidence of the multiple amorphous phases in Ge is not
currently sufficient, it seems likely that Ge exhibits amorphous–amorphous and
L–L transitions by analogy with Si. It is worth noting that the b-tin phase in Ge isstable in an extremely wide pressure range (10–75 GPa) compared with the b-tinSi phase (10–16 GPa) [252]. The third amorphous phase in Ge (e.g., VHDA Ge)
could therefore be expected to form at relatively high pressures (if such a phase
exists). It is known that the large 3d-electron core radius, which is absent in Si,
accounts for the high stability of b-tin Ge over a wide pressure range. Such an
effect of the electronic properties on structural stability is of course significant in
amorphous solids. Because the interatomic interaction (electronic structure) plays
a fundamental role in polyamorphism, a microscopic description that includes the
electronic structure is indispensable for profound understanding of polyamorph-
ism, particularly in semiconductors such as Si and Ge.
Acknowledgments
T.L. is grateful to his M.Sc. and Ph.D. students, Katrin Winkel, Marion Bauer, Michael Elsaesser,
Markus Seidl, and Juergen Bernard, for their devotion to the subject and for discussion, to Erwin
Mayer for inspiring many experiments and improving the manuscript, to the Austrian Science Fund
(FWF projects R37-N11 and Y391), and to the European Research Council (ERC Starting Grant,
72 thomas loerting, vadim v. brazhkin, and tetsuya morishita

SULIWA) for financial support. V.B. is grateful to A.G. Lyapin, O.B. Tsiok, K. Trachenko, and Y.
Katayama for their help and useful discussions and to the Russian Foundation for Basic Research (07-
02-01275 and 08-02-00014) and the Programs of the Presidium of RAS for financial support. T.M. is
grateful to O. Mishima and T. Ikeshoji for useful discussion and to the Ministry of Education, Culture,
Sports, Science and Technology, Japan for financial support.
References
1. R. Zallen, The Physics of Amorphous Solids, Wiley, New York, 1983.
2. S. R. Elliott, Physics of Amorphous Materials, Longman Group Limited, New York, 1983.
3. J. Zarzycki,Glasses and the Vitreous State, CambridgeUniversity Press, Cambridge, UK, 1991.
4. P. M. Ossi,DisorderedMaterials—An Introduction, 2nd ed., Springer-Verlag, Berlin, Germany,
2006.
5. G. P. Johari, J. Chem. Edu. 51, 23 (1974).
6. W. Kauzmann, Chem. Rev. 43, 219 (1948).
7. A. Eisenberg, in Physical Properties of Polymers A. E. James E. Mark, William W. Graessley,
Leo Mandelkern, Edward T. Samulski, Jack L. Koenig, and George D. Wignall, eds., American
Chemical Society, Washington, DC, 1993.
8. C. A. Angell, K. L. Ngai, G. B. McKenna, P. F. McMillan, and S. W. Martin, Appl. Phys. Rev.
88, 3113 (2000).
9. A. Navrotsky, Nat. Mater. 2, 571 (2003).
10. P. F. McMillan, J. Gryko, C. Bull, R. Arledge, A. J. Kenyon, and B. A. Cressey, J. Solid State
Chem. 178, 937 (2005).
11. A. Hedoux, Y. Guinet, and M. Descamps, Phys. Rev. B: Condens. Matt. Mater. Phys. 58, 31
(1998).
12. G. P. Johari, S. Ram, G. Astl, and E. Mayer, J. Non-Cryst. Solids 116, 282 (1990).
13. V. A. Likhachev, Glass Physics and Chemistry (Translation of Fizika i Khimiya Stekla) 22, 80
(1996).
14. S. Susman, K. J. Volin, D. L. Price, M. Grimsditch, J. P. Rino, R. K. Kalia, P. Vashishta, G.
Gwanmesia, Y. Wang, and R. C. Liebermann, Phys. Rev. B 43, 1194 (1991).
15. T. Grande, S. Stolen, A. Grzechnik, W. A. Crichton, and M. Mezouar, Physica A 314, 560
(2002).
16. S. Sampath, C. J. Benmore, K. M. Lantzky, J. Neuefeind, K. Leinenweber, D. L. Price, and J. L.
Yarger, Phys. Rev. Lett. 90, 115502/1 (2003).
17. Y. Inamura, Y. Katayama, W. Utsumi, and K.-i. Funakoshi, Phys. Rev. Lett. 93, 015501 (2004).
18. J. Urquidi, C. J. Benmore, P. A. Egelstaff, M. Guthrie, S. E. McLain, C. A. Tulk, D. D. Klug, and
J. F. C. Turner, Molec. Phys. 102, 2007 (2004).
19. C. J. Benmore, R. T. Hart, Q. Mei, D. L. Price, J. Yarger, C. A. Tulk, and D. D. Klug, Phys. Rev.
B 72, 132201 (2005).
20. D. T. Bowron, J. L. Finney, A. Hallbrucker, I. Kohl, T. Loerting, E. Mayer, and A. K. Soper,
J. Chem. Phys. 125, (2006).
21. V. V. Brazhkin, J. Phys. Condens. Matt. 18, 9643 (2006).
22. V. V. Brazhkin, Phys. Rev. Lett. 98, 069601 (2007).
23. J. Bernstein, Polymorphism in Molecular Crystals, Oxford University Press, Oxford, UK, 2002.
24. V. V. Brazhkin and A. G. Lyapin, Jetp. Lett-Engl. Tr. 78, 542 (2003).
25. O. Mishima, L. D. Calvert, and E. Whalley, Nature 314, 76 (1985).
multiple amorphous–amorphous transitions 73

26. K. Trachenko, V. V. Brazhkin, O. B. Tsiok, M. T. Dove, and E. K. H. Salje, Phys. Rev. Lett. 98,
135502 (2007).
27. H.W. Sheng, H. Z. Liu, Y. Q. Cheng, J. Wen, P. L. Lee,W. K. Luo, S. D. Shastri, and E.Ma,Nat.
Mater. 6, 192 (2007).
28. M. C. Wilding, P. F. McMillan, and A. Navrotsky, Physica A 314, 379 (2002).
29. V. V. Brazhkin, Y. Katayama, M. V. Kondrin, T. Hattori, A. G. Lyapin, and H. Saitoh, Phys. Rev.
Lett. 100, 145701/1 (2008).
30. S. V. Buldyrev and H. E. Stanley, Physica A 330, 124 (2003).
31. I. Brovchenko, A. Geiger, and A. Oleinikova, J. Chem. Phys. 118, 9473 (2003).
32. I. Brovchenko, A. Geiger, and A. Oleinikova, J. Chem. Phys. 123, 044515 (2005).
33. I. Brovchenko and A. Oleinikova, J. Chem. Phys. 124, 164505 (2006).
34. P. Jedlovszky and R. Vallauri, J. Chem. Phys. 122, 081101/1 (2005).
35. P. Jedlovszky, L. B. Partay, A. P. Bartok, G. Garberoglio, and R. Vallauri, J. Chem. Phys. 126,
241103/1 (2007).
36. P. Jedlovszky, L. B. Partay, A. P. Bartok, V. P. Voloshin, N. N. Medvedev, G. Garberoglio, and
R. Vallauri, J. Chem. Phys. 128, 244503/1 (2008).
37. S. M. Sharma and S. K. Sikka, Prog. Mater. Sci. 40, 1 (1996).
38. H. E. Stanley, Pramana 53, 53 (1999).
39. V. V. Brazhkin, A. G. Lyapin, S. V. Popova, and R. N. Voloshin, NATO Sci. Ser., II Math., Phys.
Chem. 81, 15 (2002).
40. P. G. Debenedetti, J. Phys. Condens. Matter 15, R1669 (2003).
41. V. V. Brazhkin, and A. G. Lyapin, J. Phys. Cond. Matter 15, 6059 (2003).
42. P. F. McMillan, J. Mater. Chem. 14, 1506 (2004).
43. J. L. Yarger and G. H. Wolf, Science 306, 820 (2004).
44. C. A. Angell, Annu. Rev. Phys. Chem. 55, 559 (2004).
45. S. Petit and G. Coquerel, Polymorphism 259 (2006).
46. T. Loerting, K. Winkel, C. G. Salzmann, and E. Mayer, Phys. Chem. Chem. Phys. 8, 2810
(2006).
47. T. Loerting and N. Giovambattista, J. Phys. Cond. Matt. 18, R919 (2006).
48. G. P. Johari and O. Andersson, Thermochim. Acta 461, 14 (2007).
49. W. B. Hubbard, Planetary Interiors, Van Nostrand Reinhold, New York, 1984.
50. D. L. Anderson, Theory of the Earth., Blackwell Scientific Publications, Boston, MA,
1989.
51. R. J. Hemley, J. Badro, and D. M. Teter, Phys. Meets Min. 173 (2000).
52. A. Putnis, Introduction to Mineral Sciences, Cambridge University Press, Cambridge, U.K.,
1992.
53. R. J. Hemley, C. T. Prewitt, and K. J. Kingma, Rev. Mineral. 29, 41 (1994).
54. V. Swamy, S. K. Saxena, B. Sundman, and J. Zhang, J. Geophys. Res. 99, 11 (1994).
55. G. A. Lyzenga, T. J. Ahrens, and A. C. Mitchell, J. Geophys. Res. 88, 2431 (1983).
56. D. R. Schmitt and T. J. Ahrens, J. Geophys. Res. 94, 5851 (1989).
57. J. A. Akins and T. J. Ahrens, Geophys. Res. Lett. 29, 31/1 (2002).
58. D. Andrault, G. Fiquet, F. Guyot, and M. Hanfland, Science 282, 720 (1998).
59. S. Ono, Abstracts of AGU 2001 Fall Meeting, San Francisco, 2001.
74 thomas loerting, vadim v. brazhkin, and tetsuya morishita

60. L. S. Dubrovinsky, S. K. Saxena, P. Lazor, R. Ahuja, O. Eriksson, J. M.Wills, and B. Johansson,
Nature 388, 362 (1997).
61. Y. Kuwayama, K. Hirose, N. Sata, and Y. Ohishi, Science 309, 923 (2005).
62. S. R. Shieh, T. S. Duffy, and G. Shen, Earth Planet. Sci. Lett. 235, 273 (2005).
63. V. P. Prakapenka, G. Shen, L. S. Dubrovinsky, M. L. Rivers, and S. R. Sutton, J. Phys. Chem.
Solids 65, 1537 (2004).
64. A. G. Lyapin, V. V. Brazhkin, E. L. Gromnitskaya, O. V. Stal’gorova, and O. B. Tsiok, Phys.
Uspekhi 42, 1059 (1999).
65. A. G. Lyapin, V. V. Brazhkin, E. L. Gromnitskaya, V. V.Mukhamadiarov, O. V. Stal’gorova, and
O. B. Tsiok, NATO Sci. Seri., II Math., Phys. Chem. 81, 449 (2002).
66. P. W. Bridgman and I. Simon, J. Appl. Phys. 24, 405 (1953).
67. H. M. Cohen and R. Roy, Phys. Chem. Glasses 6, 149 (1965).
68. M. Grimsditch, Phys. Rev. Lett. 52, 2379 (1984).
69. R. J. Hemley, H. K. Mao, P. M. Bell, and B. O. Mysen, Phys. Rev. Lett. 57, 747 (1986).
70. M. Grimsditch, Phys. Rev. B 34, 4372 (1986).
71. T. Gerber, B. Himmel, H. Lorenz, and D. Stachel, Cryst. Res. Technol. 23, 1293 (1988).
72. C. Meade, R. J. Hemley, and H. K. Mao, Phys. Rev. Lett. 69, 1387 (1992).
73. C.-s. Zha, R. J. Hemley, H.-k.Mao, T. D. Duffy, and C.Meade,Phys. Rev. B: Condens. Matt. 50,
13105 (1994).
74. E. M. Stolper and T. J. Ahrens, Geophys. Res. Lett. 14, 1231 (1987).
75. V. G. Karpov and M. Grimsditch, Phys. Rev. B Condens. Matt. 48, 6941 (1993).
76. O. B. Tsiok, V. V. Brazhkin, A. G. Lyapin, and L. G. Khvostantsev, Phys. Rev. Lett. 80, 999
(1998).
77. L. Stixrude and M. S. T. Bukowinski, Phys. Rev. B Condens. Matt. 44, 2523 (1991).
78. J. S. Tse, D. D. Klug, and Y. Le Page, Phys. Rev. B Condens. Matt. 46, 5933 (1992).
79. R. G. Della Valle and E. Venuti, Phys. Rev. B Condens. Matt. 54, 3809 (1996).
80. D. J. Lacks, Phys. Rev. Lett. 80, 5385 (1998).
81. D. J. Lacks, Phys. Rev. Lett. 84, 4629 (2000).
82. E. Demiralp, T. Cagin, and W. A. Goddard, III, Phys. Rev. Lett. 82, 1708 (1999).
83. J. R. Rustad, D. A. Yuen, and F. J. Spera, Phys. Rev. B Condens. Matt. 44, 2108 (1991).
84. Y. Inamura, M. Arai, N. Kitamura, S. M. Bennington, and A. C. Hannon, Physica B 241-243,
903 (1998).
85. G. D. Mukherjee, S. N. Vaidya, and V. Sugandhi, Phys. Rev. Lett. 87, 195501 (2001).
86. P. McMillan, B. Piriou, and R. Couty, J. Chem. Phys. 81, 4234 (1984).
87. T. Rouxel, H. Ji, T. Hammouda, and A. Moreac, Phys. Rev. Lett. 100, 225501/1 (2008).
88. R. A. B. Devine, R. Dupree, I. Farnan, and J. J. Capponi, Phys. Rev. B Condens. Matt. 35, 2560
(1987).
89. V. P. Prakapenka, G. Shen, M. L. Rivers, and S. R. Sutton, AGU Fall Meet. Suppl. Abstract 84,
V41E (2003).
90. F. S. El’kin, V. V. Brazhkin, L. G. Khvostantsev, O. B. Tsiok, and A. G. Lyapin, JETP Lett. 75,
342 (2002).
91. K. Trachenko, M. T. Dove, V. Brazhkin, and F. S. El’kin, Phys. Rev. Lett. 93, 135502 (2004).
92. K. Trachenko and M. T. Dove, Phys. Rev. B Condens. Matt. Mater. Phys. 67, 064107/1 (2003).
multiple amorphous–amorphous transitions 75

93. M. F. Thorpe, J. Non-Cryst. Solids 57, 355 (1983).
94. J.-F. Lin, H. Fukui, D. Prendergast, T. Okuchi, Y. Q. Cai, N. Hiraoka, C.-S. Yoo, A. Trave,
P. Eng, M. Y. Hu, and P. Chow, Phys. Rev. B Condens. Matter 75, 012201/1 (2007).
95. H. Fukui, M. Kanzaki, N. Hiraoka, and Y. Q. Cai, Phys. Rev. B Condens. Matt. 78, 012203/1
(2008).
96. S. K. Lee, P. J. Eng, H.-k. Mao, Y. Meng, and J. Shu, Phys. Rev. Lett. 98, 105502/1 (2007).
97. S. K. Lee, P. J. Eng, H.-k. Mao, Y. Meng, M. Newville, M. Y. Hu, and J. Shu,Nature Mat. 4, 851
(2005).
98. V. V. Brazhkin and K. Trachenko, unpublished data.
99. M. Kanzaki, J. Am. Ceram. Soc. 73, 3706 (1990).
100. E. Ohtani, F. Taulelle, and C. A. Angell, Nature 314, 78 (1985).
101. X. Xue, J. F. Stebbins, M. Kanzaki, and R. G. Tronnes, Science 245, 962 (1989).
102. J. Zhang, R. C. Liebermann, T. Gasparik, C. T. Herzberg, and Y. Fei, J. Geophys. Res. 98, 19785
(1993).
103. I. Saika-Voivod, F. Sciortino, and P. H. Poole, Phys. Rev. E 63, 11202 (2000).
104. J. Horbach, J. Phys. Condens. Matt. 20, 244118/1 (2008).
105. P. K. Hung, N. V. Hong, and L. T. Vinh, J. Phys. Condens. Matt. 19, 466103/1 (2007).
106. V. B. Prakapenka, L. S. Dubrovinsky, G. Shen, M. L. Rivers, S. R. Sutton, V. Dmitriev, H. P.
Weber, and T. Le Bihan, Phys. Rev. B Condens. Matt. 67, 132101/1 (2003).
107. S. Ono, T. Tsuchiya, K. Hirose, and Y. Ohishi, Phys. Rev. B Condens. Matt. 68, 014103/1 (2003).
108. C. E. Stone, A. C. Hannon, T. Ishihara, N. Kitamura, Y. Shirakawa, R. N. Sinclair, N. Umesaki,
and A. C. Wright, J. Non-Cryst. Solids 293-295, 769 (2001).
109. J. P. Itie, A. Polian, G. Calas, J. Petiau, A. Fontaine, and H. Tolentino, Phys. Rev. Lett. 63, 398
(1989).
110. K. H. Smith, E. Shero, A. Chizmeshya, and G. H. Wolf, J. Chem. Phys. 102, 6851 (1995).
111. M. Guthrie, C. A. Tulk, C. J. Benmore, J. Xu, J. L. Yarger, D. D. Klug, J. S. Tse, H. K. Mao, and
R. J. Hemley, Phys. Rev. Lett. 93, 115502/1 (2004).
112. X. Hong, G. Shen, V. B. Prakapenka, M. Newville, M. L. Rivers, and S. R. Sutton, Phys. Rev. B
Condens. Matt. 75, 104201/1 (2007).
113. M. Micoulaut, L. Cormier, and G. S. Henderson, J. Phys. Condens. Matt. 18, R753 (2006).
114. K. V. Shanavas, N. Garg, and S. M. Sharma, Phys. Rev. B Condens. Matt. 73, 094120/1 (2006).
115. G. Shen, H.-P. Liermann, S. Sinogeikin,W. Yang, X. Hong, C.-S. Yoo, and H. Cynn, Proc. Natl.
Acad. Sci. U.S.A. 104, 14576 (2007).
116. A. G. Lyapin, V. V. Brazhkin, Y. Katayama, and Y. Inamura, Abstracts of Joint 21st AIRAPTand
45th EHPRG International Conference, Catania, 2007, 246.
117. O. Ohtaka, H. Arima, H. Fukui, W. Utsumi, Y. Katayama, and A. Yoshiasa, Phys. Rev. Lett. 92,
155506/1 (2004).
118. V. V. Hoang, N. H. T. Anh, and H. Zung, Phys. B 390, 17 (2007).
119. J. Krogh-Moe, J. Non-Cryst. Solids 1, 269 (1969).
120. D. R. Uhlmann, J. F. Hays, and D. Turnbull, Phys. Chem. Glasses 8, 1 (1967).
121. J. D. Mackenzie, J. Am. Ceram. Soc. 46, 461 (1963).
122. A. C.Wright, C. E. Stone, R. N. Sinclair, N. Umesaki, N. Kitamura, K. Ura, N. Ohtori, and A. C.
Hannon, Phys. Chem. Glasses 41, 296 (2000).
123. E. Chason and F. Spaepen, J. Appl. Phys. 64, 4435 (1988).
76 thomas loerting, vadim v. brazhkin, and tetsuya morishita

124. M. Grimsditch, R. Bhadra, and Y. Meng, Phys. Rev. B Condens. Matt. Mater. Phys. 38, 7836
(1988).
125. J. Nicholas, S. Sinogeikin, J. Kieffer, and J. Bass, Phys. Rev. Lett. 92, 215701/1 (2004).
126. M. Grimsditch, A. Polian, and A. C. Wright, Phys. Rev. B Condens. Matt. 54, 152 (1996).
127. A. Takada, Phys. Chem. Glasses 45, 156 (2004).
128. L. Huang, J. Nicholas, J. Kieffer, and J. Bass, J. Phys. Condens. Matter 20, 075107/1 (2008).
129. V. V. Brazhkin, Y. Katayama, K. Trachenko, O. B. Tsiok, A. G. Lyapin, E. Artacho, M. Dove,
G. Ferlat, Y. Inamura, and H. Saitoh, Phys. Rev. Lett. 101, 035702 (2008).
130. T. Hattori, T. Kinoshita, T. Narushima, K. Tsuji, and Y. Katayama, Phys. Rev. B Condens. Matt.
Mater. Phys. 73, 054203/1 (2006).
131. G. Widmann and R. Riesen, J. Thermal Anal. Calorim. 52, 109 (1998).
132. E. F. Burton and W. F. Oliver, Proc. R. Soc. Ser. A 153, 166 (1935).
133. E. F. Burton and W. F. Oliver, Nature 135, 505 (1935).
134. E. Mayer and R. Pletzer, Nature 319, 298 (1986).
135. R. Pletzer and E. Mayer, J. Chem. Phys. 90, 5207 (1989).
136. E. Mayer and R. Pletzer, J. Phys. Colloq. 48, 581 (1987).
137. Z. Dohnalek, G. A. Kimmel, P. Ayotte, R. S. Smith, and B. D. Kay, J. Chem. Phys. 118, 364
(2003).
138. A. Hallbrucker, E. Mayer, and G. P. Johari, J. Phys. Chem. 93, 4986 (1989).
139. P. Jenniskens and D. F. Blake, Science 265, 753 (1994).
140. P. Jenniskens, D. F. Blake, M. A. Wilson, and A. Pohorille, Astrophys. J. 455, 389 (1995).
141. P. Jenniskens and D. F. Blake, Planet. Space Sci. 44, 711 (1996).
142. B. Guillot and Y. Guissani, J. Chem. Phys. 120, 4366 (2004).
143. P. Parent, S. Lacombe, F. Bournel, and C. Laffon, Physics and Chemistry of Ice, W. F. Kuhs, ed.,
RSC Publishing, Cambridge, U.K., 2007.
144. P. Brggeller and E. Mayer, Nature 288, 569 (1980).
145. E. Mayer and P. Brueggeller, Nature 298, 715 (1982).
146. E. Mayer, J. Appl. Phys., 58, 663 (1985).
147. V. F. Petrenko and R. W. Whitworth, Physics of Ice, Oxford University Press, Oxford, U.K.,
1999.
148. M. Bauer, M. S. Elsaesser, K. Winkel, E. Mayer, and T. Loerting, Phys. Rev. B 77, 220105/1
(2008).
149. O. Mishima, L. D. Calvert, and E. Whalley, Nature 310, 393 (1984).
150. T. Loerting, I. Kohl, W. Schustereder, A. Hallbrucker, and E. Mayer, Chem. Phys. Chem. 7,
1203 (2006).
151. J. S. Tse, D. D. Klug, C. A. Tulk, I. Swainson, E. C. Svensson, C. K. Loong, V. Shpakov, V. R.
Belosludov, R. V. Belosludov, and Y. Kawazoe, Nature 400, 647 (1999).
152. T. Loerting, C. Salzmann, I. Kohl, E. Mayer, and A. Hallbrucker, Phys. Chem. Chem. Phys. 3,
5355 (2001).
153. O. Mishima, J. Chem. Phys. 100, 5910 (1994).
154. K.Winkel, M. S. Elsaesser, M. Seidl, M. Bauer, E. Mayer, and T. Loerting, J. Phys. Cond. Matt.
in press.
155. K. Winkel, M. S. Elsaesser, E. Mayer, and T. Loerting, J. Chem. Phys. 128, 044510/1 (2008).
156. C. G. Salzmann, E. Mayer, and A. Hallbrucker, Phys. Chem. Chem. Phys. 6, 1269 (2004).
multiple amorphous–amorphous transitions 77

157. J. E. Bertie, L. D. Calvert, and E. Whalley, J. Chem. Phys. 38, 840 (1963).
158. J. E. Bertie, L. D. Calvert, and E. Whalley, Can. J. Chem. 42, 1373 (1964).
159. D. D. Klug, Y. P. Handa, J. S. Tse, and E. Whalley, J. Chem. Phys. 90, 2390 (1989).
160. A. I. Kolesnikov, V. V. Sinitsyn, E. G. Ponyatovsky, I. Natkaniec, L. S. Smirnov, and J. C. Li,
J. Phys. Chem. B 101, 6082 (1997).
161. Y. Yoshimura, S. T. Stewart, M. Somayazulu, H.-k. Mao, and R. J. Hemley, J. Chem. Phys. 124,
024502 (2006).
162. C. McBride, C. Vega, E. Sanz, and J. L. F. Abascal, J. Chem. Phys. 121, 11907 (2004).
163. Y. Yoshimura, H.-k. Mao, and R. J. Hemley, Chem. Phys. Lett. 420, 503 (2006).
164. N. Sartori, J. Bednar, and J. Dubochet, J. Microscop. 182, 163 (1996).
165. G. A. Baratta, G. Leto, F. Spinella, G. Strazzulla, and G. Foti, Astron. Astrophys. 252, 421
(1991).
166. A. Kouchi and T. Kuroda, Nature 344, 134 (1990).
167. G. Leto and G. A. Baratta, Astron. Astrophys. 397, 7 (2003).
168. M. H. Moore and R. L. Hudson, Astrophys. J. 401, 353 (1992).
169. R. L. Hudson and M. H. Moore, J. Phys. Chem. 96, 6500 (1992).
170. O. Mishima, Nature 384, 546 (1996).
171. J. L. Finney, D. T. Bowron, A. K. Soper, T. Loerting, E. Mayer, and A. Hallbrucker, Phys. Rev.
Lett. 89, 205503 (2002).
172. C. G. Salzmann, T. Loerting, S. Klotz, P. W. Mirwald, A. Hallbrucker, and E. Mayer, Phys.
Chem. Chem. Phys. 8, 386 (2006).
173. T. Loerting, W. Schustereder, K. Winkel, C. G. Salzmann, I. Kohl, and E. Mayer, Phys. Rev.
Lett. 96, 025702 (2006).
174. K.Winkel,W. Schustereder, I. Kohl, C. G. Salzmann, E.Mayer, and T. Loerting,Proc. 11th Intl.
Conf. on the Physics and Chemistry of Ice, W. F. Kuhs, ed., RSC, Dorchester, U.K., 2007,
pp. 641.
175. M. C. Bellissent-Funel, L. Bosio, A. Hallbrucker, E. Mayer, and R. Sridi-Dorbez, J. Chem.
Phys. 97, 1282 (1992).
176. D. D. Klug, C. A. Tulk, E. C. Svensson, and C. K. Loong, Phys. Rev. Lett. 83, 2584
(1999).
177. J. L. Finney, A. Hallbrucker, I. Kohl, A. K. Soper, and D. T. Bowron, Phys. Rev. Lett. 88, 225503
(2002).
178. J. A. Ripmeester, C. I. Ratcliffe, and D. D. Klug, J. Chem. Phys. 96, 8503 (1992).
179. D. D. Klug, O. Mishima, and E. Whalley, J. Chem. Phys. 86, 5323 (1987).
180. M. C. Bellissent-Funel, and L. Bosio, J. Chem. Phys. 102, 3727 (1995).
181. M. C. Bellissent-Funel, Europhys. Lett. 42, 161 (1998).
182. F. W. Starr, M.-C. Bellissent-Funel, and H. E. Stanley, Phys. Rev. E 60, 1084 (1999).
183. M. C. Bellissent-Funel, J. Teixeira, and L. Bosio, J. Chem. Phys. 87, 2231 (1987).
184. E. G. Ponyatovsky, V. V. Sinitsyn, and T. A. Pozdnyakova, J. Chem. Phys. 109, 2413 (1998).
185. M. Sasai and E. Shiratani, Nippon Kessho Gakkaishi 40, 101 (1998).
186. V. V. Sinitsyn, E. G. Ponyatovsky, A. I. Kolesnikov, U. Dahlborg, andM. Calvo-Dahlborg, Solid
State Ionics 145, 415 (2001).
187. E. L. Gromnitskaya, O. V. Stal’gorova, V. V. Brazhkin, and A. G. Lyapin, Phys. Rev. B 64,
094205 (2001).
78 thomas loerting, vadim v. brazhkin, and tetsuya morishita

188. C. A. Tulk, C. J. Benmore, J. Urquidi, D. D. Klug, J. Neuefeind, B. Tomberli, and P. A.
Egelstaff, Science 297, 1320 (2002).
189. M. M. Koza, H. Schober, H. E. Fischer, T. Hansen, and F. Fujara, J. Phys. Condens. Matt. 15,
321 (2003).
190. K. Winkel, E. Mayer, and T. Loerting, in press.
191. M. M. Koza, B. Geil, K. Winkel, C. Koehler, F. Czeschka, M. Scheuermann, H. Schober, and
T. Hansen, Phys. Rev. Lett. 94, 125506 (2005).
192. M. M. Koza, T. Hansen, R. P. May, and H. Schober, J. Non-Cryst. Solids 352, 4988 (2006).
193. M. Scheuermann, B. Geil, K. Winkel, and F. Fujara, J. Chem. Phys. 124, 224503/1 (2006).
194. O. Mishima and Y. Suzuki, Nature 419, 599 (2002).
195. S. Klotz, T. Straessle, R. J. Nelmes, J. S. Loveday, G. Hamel, G. Rousse, B. Canny, J. C.
Chervin, and A. M. Saitta, Phys. Rev. Lett. 94, 025506 (2005).
196. O. Mishima and H. E. Stanley, Nature 396, 329 (1998).
197. C. A. Tulk, C. J. Benmore, D. D. Klug, and J. Neuefeind, Phys. Rev. Lett. 96, 149601 (2006).
198. C. G. Salzmann, E. Mayer, and A. Hallbrucker, Phys. Chem. Chem. Phys. 6, 5156 (2004).
199. R. J. Nelmes, J. S. Loveday, T. Straessle, C. L. Bull, M. Guthrie, G. Hamel, and S. Klotz, Nat.
Phys. 2, 414 (2006).
200. T. Loerting, K. Winkel, and E. Mayer, in press.
201. G. P. Johari, J. Chem. Phys. 121, 8428 (2004).
202. S. Sastry, P. G. Debenedetti, F. Sciortino, and H. E. Stanley, Phys. Rev. E 53, 6144 (1996).
203. P. G. Debenedetti, Nature 392, 127 (1998).
204. R. J. Hemley, L. C. Chen, and H. K. Mao, Nature 338, 638 (1989).
205. O. Andersson, Phys Rev. Lett. 95, 205503 (2005).
206. O. Andersson and A. Inaba, Phys. Rev. B 74 (2006).
207. R. J. Speedy, J. Phys. Chem. 86, 3002 (1982).
208. R. J. Speedy, J. Phys. Chem. 86, 982 (1982).
209. P. H. Poole, F. Sciortino, U. Essmann, and H. E. Stanley, Nature 360, 324 (1992).
210. H. E. Stanley, C. A. Angell, U. Essmann, M. Hemmati, P. H. Poole, and F. Sciortino, Physica A
206, 1 (1994).
211. L. P. N. Rebelo, P. G. Debenedetti, and S. Sastry, J. Chem. Phys. 109, 626 (1998).
212. C. A. Angell, Science 319, 582 (2008).
213. J. S. Tse, D. M. Shaw, D. D. Klug, S. Patchkovskii, G. Vanko, G. Monaco, andM. Krisch, Phys.
Rev. Lett. 100, 095502 (2008).
214. J. C. Li and P. Jenniskens, Planet. and Space Sci. 45, 469 (1997).
215. G. P. Johari, J. Chem. Phys. 112, 8573 (2000).
216. B.Geil,M.M.Koza, F. Fujara, H. Schober, and F. Natali,Phys. Chem. Chem. Phys. 6, 677 (2004).
217. H. Schober, M.M. Koza, A. Tolle, C. Masciovecchio, F. Sette, and F. Fujara, Phys. Rev. Lett. 85,
4100 (2000).
218. O. Andersson and H. Suga, Phys Rev. B 65, 140201 (2002).
219. C. G. Salzmann, I. Kohl, T. Loerting, E. Mayer, and A. Hallbrucker, Phys. Chem. Chem. Phys.
5, 3507 (2003).
220. A. Hallbrucker, E. Mayer, and G. P. Johari, J. Phys. Chem. 93, 7751 (1989).
221. G. P. Johari, A. Hallbrucker, and E. Mayer, J. Phys. Chem. 94, 1212 (1990).
multiple amorphous–amorphous transitions 79

222. E. Mayer, in J. Mol. Struct., 250, 403 (1991).
223. G. P. Johari, A. Hallbrucker, and E. Mayer, Nature 330, 552 (1987).
224. A. Hallbrucker, E. Mayer, and G. P. Johari, Philos. Mag. B, 60, 179 (1989).
225. I. Kohl, L. Bachmann, E. Mayer, A. Hallbrucker, and T. Loerting, Nature 435, E1 (2005).
226. I. Kohl, L. Bachmann, A. Hallbrucker, E. Mayer, and T. Loerting, Phys. Chem. Chem. Phys. 7,
3210 (2005).
227. M. Chonde, M. Brindza, and V. Sadtchenko, J. Chem. Phys. 125, 094501/1 (2006).
228. G. P. Johari, J. Chem. Phys. 127, 157101 (2007).
229. M. Fisher and J. P. Devlin, J. Phys. Chem., 99, 11584 (1995).
230. R. S. Smith and B. D. Kay, Nature 398, 788 (1999).
231. R. S. Smith, Z. Dohnalek, G. A. Kimmel, K. P. Stevenson, and B. D. Kay,Chem. Phys., 258, 291
(2000).
232. S. M. McClure, E. T. Barlow, M. C. Akin, D. J. Safarik, T. M. Truskett, and C. B. Mullins,
J. Phys. Chem. B 110, 17987 (2006).
233. S. M. McClure, D. J. Safarik, T. M. Truskett, and C. B. Mullins, J. Phys. Chem. B 110, 11033
(2006).
234. P. Jenniskens and D. F. Blake, Astrophy. J. 473, 1104 (1996).
235. P. Jenniskens, S. F. Banham, D. F. Blake, and M. R. S. McCoustra, J. Chem. Phys. 107, 1232
(1997).
236. N. Giovambattista, C. A. Angell, F. Sciortino, and H. E. Stanley, Phys Rev. Lett. 93, 047801/1
(2004).
237. Y. Yue and C. A. Angell, Nature 427, 717 (2004).
238. C. A. Angell, J. Phys. Condens. Matt. 19, 205112/1 (2007).
239. G. P. Johari, Phys. Chem. Chem. Phys. 2, 1567 (2000).
240. D. D. Klug, Nature 420, 749 (2002).
241. J. S. Tse and M. L. Klein, Phys. Rev. Lett. 58, 1672 (1987).
242. A. I. Kolesnikov, V. V. Sinitsyn, E. G. Ponyatovsky, I. Natkaniec, and L. S. Smirnov, Phys. B
Condens. Matt. 213-214, 474 (1995).
243. H. Schober, M. Koza, A. Tolle, F. Fujara, C. A. Angell, and R. Bohmer, Phys. B Condens. Matt.
241-243, 897 (1998).
244. C. A. Tulk, D. D. Klug, E. C. Svensson, V. F. Sears, and J. Katsaras, Appl. Phys. A Mater. Sci.
Proc. 74, S1185 (2002).
245. O. Andersson and A. Inaba, J. Chem. Phys. 122, 124710/1 (2005).
246. N. I. Agladze and A. J. Sievers, Phys. B Condens. Matt. 316-317, 513 (2002).
247. T. Strassle, A. M. Saitta, S. Klotz, and M. Braden, 93 (2004).
248. E. L. Gromnitskaya, O. V. Stal’gorova, A. G. Lyapin, V. V. Brazhkin, and O. B. Tarutin, JETP
Lett. 78, 488 (2003).
249. T. Strassle, S.Klotz, G.Hamel,M.M.Koza, andH. Schober,Phys. Rev. Lett. 99, 175501/1 (2007).
250. G. P. Johari and O. Andersson, Phys. Rev. B Condens. Matt. Mater. Phys. 70, 184108/1 (2004).
251. O. Andersson, J. Phys. Cond. Matt. 20, 244115 (2008).
252. O. Mishima, J. Chem. Phys. 115, 4199 (2001).
253. O. Mishima, J. Chem. Phys. 121, 3161 (2004).
254. H. E. Stanley, S. V. Buldyrev, N. Giovambattista, E. La Nave, A. Scala, F. Sciortino, and F. W.
Starr, in New Kinds of Phase Transitions: Transformations in Disordered Substances, Vol.
80 thomas loerting, vadim v. brazhkin, and tetsuya morishita

NATO Science Series, Vol. 81, V. V. Brazhkin, S. V. Buldyrev, V. N. Ryzhov, and H. E. Stanley,
eds., Kluwer Academic Publishers, Dordrecht, Germany, 2002, p. 309.
255. A. Mujica, A. Rubio, A. Munoz, and R. J. Needs, Rev. Mod. Phys. 75, 863 (2003).
256. E. Rapoport, J. Chem. Phys. 46, 2891 (1967).
257. E. G. Ponyatovskii and O. I. Barkalov, Mat. Sci. Rep. 8, 147 (1992).
258. C. A. Angell and C. T. Moynihan, Metallurg. Mat. Transact. B 31B, 587 (2000).
259. C. T. Moynihan and C. A. Angell, J. Non-Cryst. Solids 274, 131 (2000).
260. O. Shimomura, S. Minomura, N. Sakai, K. Asaumi, K. Tamura, J. Fukushima, and H. Endo,
Phil. Mag. 29, 547 (1974).
261. O. Shimomura, inHigh Pressure and Low Temperature Physics, C. W. Chu and J. A. Woollam,
eds., Plenum Press, New York, 1978, p. 483.
262. M. Imai, T. Mitamura, K. Yaoita, and K. Tsuji, High Press. Res. 15, 167 (1996).
263. S. K. Deb, M. Wilding, M. Somayazulu, and P. F. McMillan, Nature 414, 528 (2001).
264. P. F. McMillan, M. Wilson, D. Daisenberger, and D. Machon, Nat. Mat. 4, 680 (2005).
265. T. Morishita, Phys. Rev. Lett. 93, 055503 (2004).
266. M. Durandurdu and D. A. Drabold, Phys. Rev. B Condens. Matt. 64, 014101 (2001).
267. D. Daisenberger, M. Wilson, P. F. McMillan, R. Q. Cabrera, M. C. Wilding, and D. Machon,
Phys. Rev. B 75, 224118 (2007).
268. P. F. McMillan, M. Wilson, M. C. Wilding, D. Daisenberger, M. Mezouar, and G. N. Greaves,
J. Phys. Condens. Matter 19, 415101/1 (2007).
269. F. H. Stillinger and T. A. Weber, Phys. Rev. B Condens. Matt. 31, 5262 (1985).
270. K. Tanaka, Phys. Rev. B Condens. Matt. 43, 4302 (1991).
271. J. Freund, R. Ingalls, and E. D. Crozier, J. Phys. Chem. 94, 1087 (1990).
272. E. Principi, A. Di Cicco, F. Decremps, A. Polian, S. De Panfilis, and A. Filipponi, Phys. Rev. B
69, 201201 (2004).
273. M. Durandurdu and D. A. Drabold, Phys. Rev. B 66, 041201 (2002).
274. J. Koga, K. Nishio, T. Yamaguchi, and F. Yonezawa, J. Phys. Soc. Jpn. 73, 388 (2004).
275. S. Goedecker and L. Colombo, Phys. Rev. Lett. 73, 122 (1994).
276. M. H. Bhat, V. Molinero, E. Soignard, V. C. Solomon, S. Sastry, J. L. Yarger, and C. A. Angell,
Nature 448, 787 (2007).
277. S. Ansell, S. Krishnan, J. J. Felten, and D. L. Price, J. Phys. Condens. Matt. 10, L73 (1998).
278. H. Kimura, M. Watanabe, K. Izumi, T. Hibiya, D. Holland-Moritz, T. Schenk, K. R.
Bauchspiess, S. Schneider, I. Egry, K. Funakoshi, and M. Hanfland, Appl. Phys. Lett. 78,
604 (2001).
279. N. Jakse, L. Hennet, D. L. Price, S. Krishnan, T. Key, E. Artacho, B. Glorieux, A. Pasturel, and
M.-L. Saboungi, Appl. Phys. Lett. 83, 4734 (2003).
280. T. H. Kim, G. W. Lee, B. Sieve, A. K. Gangopadhyay, R. W. Hyers, T. J. Rathz, J. R. Rogers,
D. S. Robinson, K. F. Kelton, and A. I. Goldman, Phys. Rev. Lett. 95, 085501/1 (2005).
281. K. Higuchi, K. Kimura, A.Mizuno,M.Watanabe, Y. Katayama, and K. Kuribayashi,Meas. Sci.
Technol. 16, 381 (2005).
282. K. Ohsaka, S. K. Chung, W. K. Rhim, and J. C. Holzer, Appl. Phys. Lett. 70, 423 (1997).
283. W. K. Rhim, S. K. Chung, A. J. Rulison, and R. E. Spjut, Int. J. Thermophys. 18, 459 (1997).
284. M. Langen, T. Hibiya, M. Eguchi, and I. Egry, J. Cryst. Growth 186, 550 (1998).
285. W. K. W. K. Rhim and K. Ohsaka, J. Cryst. Growth 208, 313 (2000).
multiple amorphous–amorphous transitions 81

286. Z. Zhou, S. Mukherjee, and W.-K. Rhim, J. Cryst. Growth 257, 350 (2003).
287. T. Morishita, Phys. Rev. Lett. 97, 165502/1 (2006).
288. S. Sastry and C. A. Angell, Nat. Mat. 2, 739 (2003).
289. T. Morishita, Phys. Rev. E 77, 020501/1 (2008).
290. P. Beaucage and N. Mousseau, J. Phys. Condens. Matt. 17, 2269 (2005).
291. T. Morishita, unpublished.
292. A. Filipponi and A. Di Cicco, Phys. Rev. B 51, 12322 (1995).
293. J. Koga, K. Nishio, T. Yamaguchi, and F. Yonezawa, J. Phys. Soc. Jpn. 73, 136 (2004).
294. N. Funamori and K. Tsuji, Phys. Rev. Lett. 88, 255508 (2002).
295. K. Tsuji, T. Hattori, T. Mori, T. Kinoshita, T. Narushima, and N. Funamori, J. Phys. Condens.
Matter 16, S989 (2004).
296. M. Ohtani, K. Tsuji, H. Nosaka, N. Hosokawa, and N. Funamori, Proc. 17th AIRAPT
Conference, Hawaii 1999, p. 498.
297. A. Delisle, D. J. Gonzalez, and M. J. Stott, J. Phys. Condens. Matt. 18, 3591 (2006).
298. T. Morishita, Phys. Rev. E 72, 021201 (2005).
299. C. A. Angell, E. D. Finch, L. A. Woolf, and P. Bach, J. Chem. Phys. 65, 3063 (1976).
300. F. X. Prielmeier, E. W. Lang, R. J. Speedy, and H. D. Ludemann, Phys. Rev. Lett. 59, 1128
(1987).
301. I. Kushiro, J. Geophys. Res. 81, 6347 (1976).
302. I. Kushiro and H. S. Yoder, Jr., B. O. Mysen, J. Geophys. Res. 81, 6351 (1976).
303. G. H. Wolf and P. F. McMillan, in Reviews in Mineralogy, J. F. Stebbins, P. F. McMillan, and
D. B. Dingwell, eds., Mineralogical Society of America, Washington, DC, 1995, p. 505.
82 thomas loerting, vadim v. brazhkin, and tetsuya morishita


![Amorphous ices: experiments and numerical simulationsaux.uibk.ac.at/c724117/publications/loerting06-jpcm.pdf · 2007. 11. 16. · low temperature [62–64] (the resulting glass being](https://static.fdocuments.us/doc/165x107/60ff4e8ac0b67628ee13cbcb/amorphous-ices-experiments-and-numerical-2007-11-16-low-temperature-62a64.jpg)