Multiobjective Optimization in Recommender Systems …rehorto2/files/minimum.pdf · Multiobjective...
45
Outline Introduction Main Contents Experiments Discussion Multiobjective Optimization in Recommender Systems using Ensemble Methods Tom´ aˇ s ˇ Rehoˇ rek Department of Theoretical Computer Science Faculty of Information Technology Czech Technical University in Prague June 27, 2013
Transcript of Multiobjective Optimization in Recommender Systems …rehorto2/files/minimum.pdf · Multiobjective...

Outline Introduction Main Contents Experiments Discussion
Multiobjective Optimizationin Recommender Systemsusing Ensemble Methods
Tomas Rehorek
Department of Theoretical Computer ScienceFaculty of Information Technology
Czech Technical University in Prague
June 27, 2013

Outline Introduction Main Contents Experiments Discussion
Outline I
1 Outline
2 Introduction
3 Main Contents
4 Experiments

Outline Introduction Main Contents Experiments Discussion
Recommender Systems
Recommender Systems [F. Ricci et al., 2011]
Recommender Systems are software tools and techniques providingsuggestions for items to be of use to a user.
Input data typically consist of:
1 Users database• set of unique identifiers of real people using the system,
2 Items catalog• set of products (e.g., movies, CDs, books, web pages, . . . )
available to the users,
3 Transactions made by users among items• product purchases, ratings (number of stars), page views. . .

Outline Introduction Main Contents Experiments Discussion
W
X
Y
Z
A
B
C
D
E
F

Outline Introduction Main Contents Experiments Discussion
Recommender Systems
Based on her past interaction with some items, the systemgenerates personalized recommendations of other items that arelikely to be relevant to the given user.
Three main approaches to personalized recommendation:
• Knowledge-based recommendation• exploits specific knowledge about the domain,• uses set of hard-coded rules,
• Content-based recommendation• exploits meta-data about the items,• builds predictive model for each user,
• Collaborative Filtering• exploits similarities between users,• does not require any knowledge about the domain

Outline Introduction Main Contents Experiments Discussion
Knowledge-based Recommendation
if camera ∧ ¬memory-card then memory card;
if camera ∧memory-card ∧ ¬tripod then tripod;
. . .
Several disadvantages:
• suitable for small catalogs only,
• requires human expertise,
• expensive to implement and maintain
Outline Introduction Main Contents Experiments Discussion
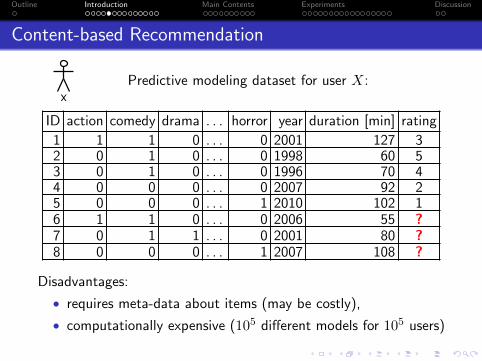
Content-based Recommendation
X
Predictive modeling dataset for user X:
ID action comedy drama . . . horror year duration [min] rating
1 1 1 0 . . . 0 2001 127 32 0 1 0 . . . 0 1998 60 53 0 1 0 . . . 0 1996 70 44 0 0 0 . . . 0 2007 92 25 0 0 0 . . . 1 2010 102 16 1 1 0 . . . 0 2006 55 ?7 0 1 1 . . . 0 2001 80 ?8 0 0 0 . . . 1 2007 108 ?
Disadvantages:
• requires meta-data about items (may be costly),
• computationally expensive (105 different models for 105 users)
Outline Introduction Main Contents Experiments Discussion
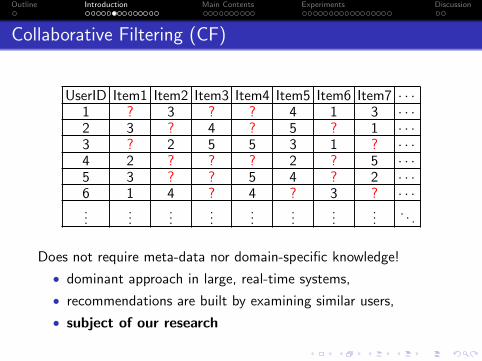
Collaborative Filtering (CF)
UserID Item1 Item2 Item3 Item4 Item5 Item6 Item7 · · ·1 ? 3 ? ? 4 1 3 · · ·2 3 ? 4 ? 5 ? 1 · · ·3 ? 2 5 5 3 1 ? · · ·4 2 ? ? ? 2 ? 5 · · ·5 3 ? ? 5 4 ? 2 · · ·6 1 4 ? 4 ? 3 ? · · ·...
......
......
......
.... . .
Does not require meta-data nor domain-specific knowledge!
• dominant approach in large, real-time systems,
• recommendations are built by examining similar users,
• subject of our research

Outline Introduction Main Contents Experiments Discussion
Netflix Prize
• Open competition held by Netflix, an American online movieretailer
• Grand prize of $1,000,000, awarded in 2009
• Goal was to improve the performance of an existing CF modelused by Netflix by 10 %
• Encouraged researchers to put huge effort into research in thearea of CF
• Contestants were to publish their algorithms during thecompetition
Outline Introduction Main Contents Experiments Discussion
Netflix Prize: Consequences
• Put a lot of bias into the research
• Techniques and criterions used in Netflix Prize are nowconsidered standard, most notably:
• there are numerical, explicit ratings provided by users,• predictive accuracy of the model is the only criterion,• data matrices must be dense enough
• These conditions do not necessarily hold in all practicalproblems!
• ratings may be only implicit and binary, generated frompurchase history,
• predictive accuracy might not fit business needs,• data matrices may be very sparse,• all of these are subject to our research
Outline Introduction Main Contents Experiments Discussion
Formalization
We are given:
• Totally ordered set of items I = {i1, . . . , in},• Totally ordered set of users U = {U1, . . . , Un} such that∀Ui ∈ U : Ui ⊆ I
Users are thought as sets of items
• Each user is expressed as a set of items she haspurchased/viewed,
• Strong practical motivations: does not require explicit ratingsto be collected
For users from U , we are solving problem known as Top-Nrecommendation
Outline Introduction Main Contents Experiments Discussion
Top-N Recommendation
• Problem of generating recommendations from purchase/ratinghistory
• Searching for predictive model that would recommend Nitems most likely to be relevant
• recommendations must be personalized, user-specific
• Frequently utilized in e-commerce• fixed space for recommended items
Outline Introduction Main Contents Experiments Discussion
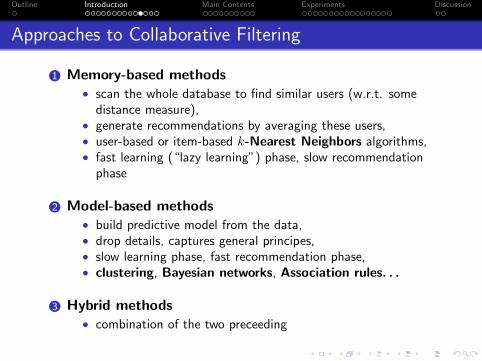
Approaches to Collaborative Filtering
1 Memory-based methods• scan the whole database to find similar users (w.r.t. some
distance measure),• generate recommendations by averaging these users,• user-based or item-based k-Nearest Neighbors algorithms,• fast learning (“lazy learning”) phase, slow recommendation
phase
2 Model-based methods• build predictive model from the data,• drop details, captures general principes,• slow learning phase, fast recommendation phase,• clustering, Bayesian networks, Association rules. . .
3 Hybrid methods• combination of the two preceeding

Outline Introduction Main Contents Experiments Discussion
Measuring Performance of CF Models
• General approach: measuring predictive accuracy
• Set of test users is used to evaluate the model• we split each test user’s history into observation and testing
portion• models are to generate predictions based on observation• prediction generated are compared to known testing portion
• In Netflix Prize: Root Mean Square Error (RMSE)
RMSE(model) =
√ ∑i∈rated(U)
(model(U, i)− rating(U, i)
)2• In our case of Top-N recommendation: Precision on N
precision(model) =model(U,N) ∩ testing(U)
N

Outline Introduction Main Contents Experiments Discussion
Predictive Accuracy: Issues
• Predictive accuracy may not reflect actual business needs
• Models are pushed towards bestseller items• This is because the predictions are compared to existing
ratings• Recommending bestsellers is generally good strategy to
maximize accuracy
• Long tail recommendation: We want to recommend surprisingnew items of high value for a specific user
• Other measures were designed to overcome this deficiency,namely the Catalog coverage:
coverage(model) =
∣∣⋃U∈U model(U,N)
∣∣|I|

Outline Introduction Main Contents Experiments Discussion
Accuracy vs. Coverage
• Accuracy and Coverage are conflicting criterions
• High accuracy leads to low coverage and vice versa
• Accuracy may be viewed as a function of Coverage
• In our research, we consider maximizing both measures asa multi-objective optimization problem

Outline Introduction Main Contents Experiments Discussion
Contributions of the Report
1 Defining selection and parametrization of proper CF algorithmfor a given data as an multi-objective optimizationproblem
• Simultaneous optimization of both the accuracy and thecoverage of the model,
2 Experimental analysis of several CF algorithms consideringAccuracy-Coverage tradeoff
3 Special emphasis on Association Rules• interesting model for binary-rated data• proposal of unifying framework for evaluation multiple variants
of rule-based recommendation
4 Experiments with model ensembles• promising method for generating new Pareto-optimal states in
Accuracy-Coverage optimization
Outline Introduction Main Contents Experiments Discussion
Algorithms Used in Experiment
We experiment with following algorithms:
• k-Nearest Neighbors• standard approach to CF
• Association Rules• both weighted and unweighted variants• using different rule-quality measures: confidence, lift,
conviction
• (Sequential Patterns)

Outline Introduction Main Contents Experiments Discussion
k-Nearest Neighbors
• Treats users as vectors (either from Rn of {0, 1}n),
• For given user U ∈ U , selects the k most similar users w.r.t.some distance measure,
• Sums the user vectors up, and recommends the movies thatcorrespond to positions of highest values in the resultingvector
• Cosine similarity is the typical distance measure for a,b ∈ Rn:
sim(a,b) =a • b
||a|| · ||b||
• In our case of binary ratings, we are using much fasterformula:
sim(A,B) =|A ∩B|√|A| · |B|

Outline Introduction Main Contents Experiments Discussion
k-Nearest Neighbors: Pseudo-code
Algorithm 1: k-NN-Based Recommendation
input : Set of users U , Target user U ∈ U ,Number of items to be recommended N ∈ N,Number of neighbors to be examined k ∈ N
output: Top-N recommendations R(U) ∈ IN
dist ← init table()
foreach U′ ∈ U such that U′ 6= U dodist[U′]← distance(U,U′)
sorted users ← ascending sort by value(dist)cand items ← init table()for i← 1 to k do
foreach item ∈ sorted users[k] doif item /∈ cand items then
cand items[item]← 0
cand items[item]← cand items[item] + 1
sorted items ← descending sort by value(cand items)recomms ← ∅for i← 1 to min (N, length (sorted items)) do
recomms ← recomms ∪ {sorted items[i]}return recomms
Outline Introduction Main Contents Experiments Discussion
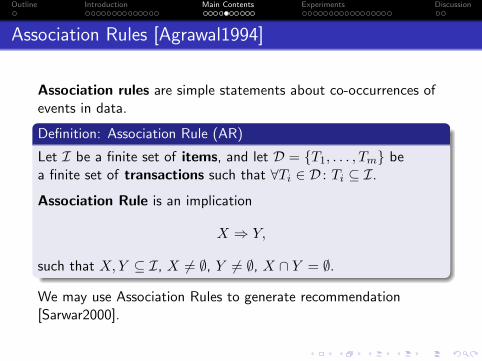
Association Rules [Agrawal1994]
Association rules are simple statements about co-occurrences ofevents in data.
Definition: Association Rule (AR)
Let I be a finite set of items, and let D = {T1, . . . , Tm} bea finite set of transactions such that ∀Ti ∈ D : Ti ⊆ I.
Association Rule is an implication
X ⇒ Y,
such that X,Y ⊆ I, X 6= ∅, Y 6= ∅, X ∩ Y = ∅.
We may use Association Rules to generate recommendation[Sarwar2000].
Outline Introduction Main Contents Experiments Discussion
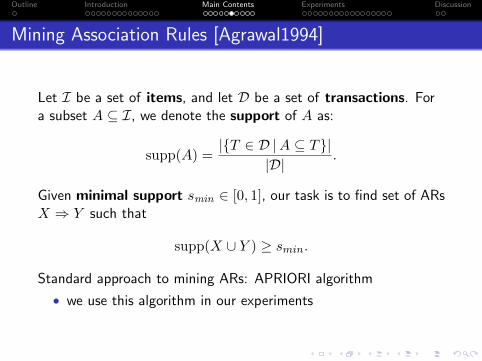
Mining Association Rules [Agrawal1994]
Let I be a set of items, and let D be a set of transactions. Fora subset A ⊆ I, we denote the support of A as:
supp(A) =|{T ∈ D |A ⊆ T}|
|D|.
Given minimal support smin ∈ [0, 1], our task is to find set of ARsX ⇒ Y such that
supp(X ∪ Y ) ≥ smin.
Standard approach to mining ARs: APRIORI algorithm
• we use this algorithm in our experiments
Outline Introduction Main Contents Experiments Discussion
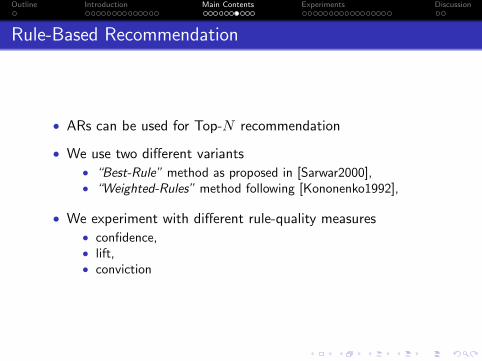
Rule-Based Recommendation
• ARs can be used for Top-N recommendation
• We use two different variants• “Best-Rule” method as proposed in [Sarwar2000],• “Weighted-Rules” method following [Kononenko1992],
• We experiment with different rule-quality measures• confidence,• lift,• conviction
Outline Introduction Main Contents Experiments Discussion
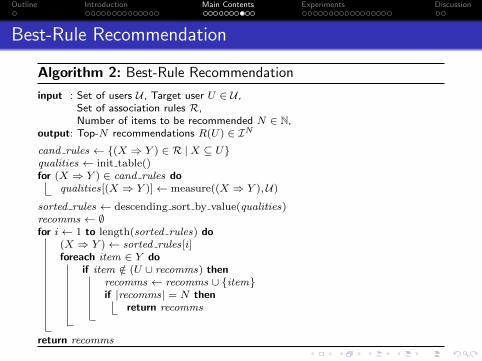
Best-Rule Recommendation
Algorithm 2: Best-Rule Recommendation
input : Set of users U , Target user U ∈ U ,Set of association rules R,Number of items to be recommended N ∈ N,
output: Top-N recommendations R(U) ∈ IN
cand rules ← {(X ⇒ Y ) ∈ R |X ⊆ U}qualities ← init table()for (X ⇒ Y ) ∈ cand rules do
qualities[(X ⇒ Y )]← measure((X ⇒ Y ),U)
sorted rules ← descending sort by value(qualities)recomms ← ∅for i← 1 to length(sorted rules) do
(X ⇒ Y )← sorted rules[i]foreach item ∈ Y do
if item /∈ (U ∪ recomms) thenrecomms ← recomms ∪ {item}if |recomms| = N then
return recomms
return recomms
Outline Introduction Main Contents Experiments Discussion
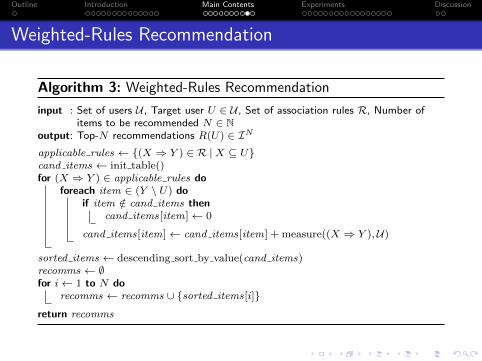
Weighted-Rules Recommendation
Algorithm 3: Weighted-Rules Recommendation
input : Set of users U , Target user U ∈ U , Set of association rules R, Number ofitems to be recommended N ∈ N
output: Top-N recommendations R(U) ∈ IN
applicable rules ← {(X ⇒ Y ) ∈ R |X ⊆ U}cand items ← init table()for (X ⇒ Y ) ∈ applicable rules do
foreach item ∈ (Y \ U) doif item /∈ cand items then
cand items[item]← 0
cand items[item]← cand items[item] + measure((X ⇒ Y ),U)
sorted items ← descending sort by value(cand items)recomms ← ∅for i← 1 to N do
recomms ← recomms ∪ {sorted items[i]}
return recomms

Outline Introduction Main Contents Experiments Discussion
Rule-Quality Measures
When sorting rules by quality, we may use several measures:
• Confidence
conf(X ⇒ Y ) =supp(X ∪ Y )
supp(X)
• Lift
lift(X ⇒ Y ) =conf(X ⇒ Y )
supp(Y )
• Conviction
conv(X ⇒ Y ) =1− supp(Y )
1− conf(X ⇒ Y )

Outline Introduction Main Contents Experiments Discussion
Experiments
• Several experiments were done with all the aforementionedalgorithms
• We used real-world datasets from IPTV industry, namely theVideo-on-Demand (VoD) service,
• Different installations of nangu.TV platform, a comprehensivesolution allowing ISPs to run IPTV services on their networks
• Only purchase history available → binary ratings
Outline Introduction Main Contents Experiments Discussion
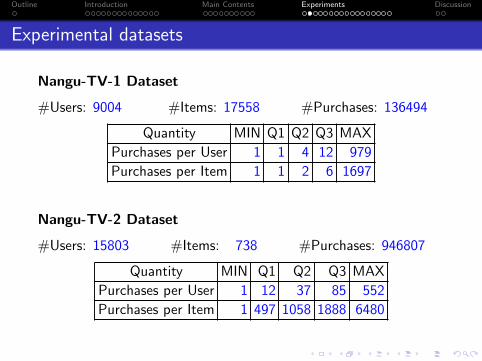
Experimental datasets
Nangu-TV-1 Dataset
#Users: 9004 #Items: 17558 #Purchases: 136494
Quantity MIN Q1 Q2 Q3 MAX
Purchases per User 1 1 4 12 979
Purchases per Item 1 1 2 6 1697
Nangu-TV-2 Dataset
#Users: 15803 #Items: 738 #Purchases: 946807
Quantity MIN Q1 Q2 Q3 MAX
Purchases per User 1 12 37 85 552
Purchases per Item 1 497 1058 1888 6480

Outline Introduction Main Contents Experiments Discussion
k-NN on Nangu-TV-1
0.02
0.03
0.04
0.05
0.06
0.07
0.08
0.09
0.01 0.015 0.02 0.025 0.03 0.035 0.04 0.045 0.05 0.055
Covera
ge
Precision
k-NN
1
2
35
10
20
50
100
200500
2000
Figure : Precision-Coverage tradeoff for different values of k on theNangu-TV-1 dataset

Outline Introduction Main Contents Experiments Discussion
Association Rules on Nangu-TV-1
0
0.01
0.02
0.03
0.04
0.05
0.06
0.07
0.08
0.09
0.015 0.02 0.025 0.03 0.035 0.04 0.045 0.05 0.055
Covera
ge
Precision
conf-bestconf-weighted
conv-bestconv-weighted
lift-bestlift-weighted
0.0005
0.002
0.0030.004
0.0005
0.0005
0.0005
0.001
0.010.02
0.0005
0.0007
0.0008
0.001
0.002
0.003
0.004
0.01
0.0005
0.0007
0.0008
0.001
0.002
0.003
0.004
Figure : Precision-Coverage tradeoff for different configurations ofAR-based recommender on the Nangu-TV-1 dataset

Outline Introduction Main Contents Experiments Discussion
Comparison of k-NN and ARs on Nangu-TV-1
0
0.02
0.04
0.06
0.08
0.1
0.01 0.015 0.02 0.025 0.03 0.035 0.04 0.045 0.05 0.055 0.06
Covera
ge
Precision
conf-bestconf-weighted
conv-bestconv-weighted
lift-bestlift-weighted
k-NN
Figure : Different variants of Association Rules compared with k-NN onthe Nangu-TV-1 dataset
Outline Introduction Main Contents Experiments Discussion
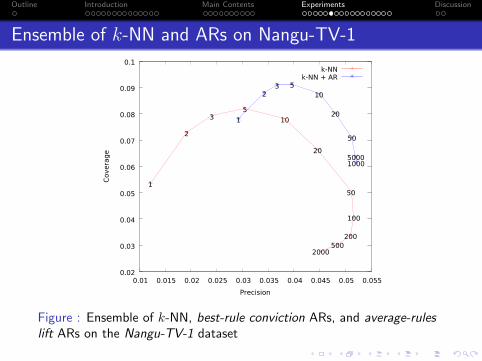
Ensemble of k-NN and ARs on Nangu-TV-1
0.02
0.03
0.04
0.05
0.06
0.07
0.08
0.09
0.1
0.01 0.015 0.02 0.025 0.03 0.035 0.04 0.045 0.05 0.055
Covera
ge
Precision
k-NN
1
2
35
10
20
50
100
200500
2000
k-NN + AR
1
23 5
10
20
50
10005000
Figure : Ensemble of k-NN, best-rule conviction ARs, and average-ruleslift ARs on the Nangu-TV-1 dataset

Outline Introduction Main Contents Experiments Discussion
k-NN on Nangu-TV-2
0
0.1
0.2
0.3
0.4
0.5
0.6
0.7
0.04 0.05 0.06 0.07 0.08 0.09 0.1 0.11 0.12 0.13 0.14 0.15
Covera
ge
Precision
k-NN1
2 35
10
20
50
100
200
500
1000
2000
500010000
Figure : Precision-Coverage tradeoff for different values of k on theNangu-TV-2 dataset

Outline Introduction Main Contents Experiments Discussion
Association Rules on Nangu-TV-2
0
0.1
0.2
0.3
0.4
0.5
0.6
0.7
0.02 0.03 0.04 0.05 0.06 0.07 0.08 0.09 0.1 0.11 0.12 0.13
Covera
ge
Precision
conf-bestconf-weighted
conv-bestconv-weighted
lift-bestlift-weighted
0.01
0.1
0.01
0.010.02
0.03
0.04
0.05
0.06
0.07
0.08
0.090.1
0.010.02
0.03
0.04
0.05
0.06
0.07
0.080.090.1
Figure : Precision-Coverage tradeoff for different configurations ofAR-based recommender on the Nangu-TV-2 dataset

Outline Introduction Main Contents Experiments Discussion
Comparison of k-NN and ARs on Nangu-TV-2
0
0.1
0.2
0.3
0.4
0.5
0.6
0.7
0.8
0.02 0.04 0.06 0.08 0.1 0.12 0.14 0.16 0.18
Covera
ge
Precision
conf-bestconf-weighted
conv-bestconv-weighted
lift-bestlift-weighted
k-NN
Figure : Different variants of Association Rules compared with k-NN onthe Nangu-TV-2 dataset

Outline Introduction Main Contents Experiments Discussion
Ensemble of k-NN and ARs on Nangu-TV-1
0
0.1
0.2
0.3
0.4
0.5
0.6
0.7
0.8
0.04 0.05 0.06 0.07 0.08 0.09 0.1 0.11 0.12 0.13 0.14 0.15
Covera
ge
Precision
k-NN
12 3
5
10
20
50
100
200
500
1000
2000
500010000
k-NN + AR
12 3 5
1020
50100200
5001000
20005000
Figure : Ensemble of k-NN, best-rule conviction ARs, and average-ruleslift ARs on the Nangu-TV-2 dataset

Outline Introduction Main Contents Experiments Discussion
Ensembling k-NN, ARs, and Sequential Patterns
On another dataset, Nangu-TV-3, we experimented withSequential Patterns (SPs).
0 0.01 0.02 0.03 0.04 0.05 0.06 0.07 0.080
0.02
0.04
0.06
0.08
0.1
0.12
F-Measure
Cov
era
ge
k-NNSequentialPPatternsP(SP)AssociationPRulesP(SP)k-NNP+PSPk-NNP+PARk-NNP+PSPP+PARBestsellers
Figure : Different ensembles of k-NN, Association Rules, and SequentialPatterns on the Nangu-TV-3 dataset

Outline Introduction Main Contents Experiments Discussion
Visualizing Association Rules for Nangu-TV-1
Figure : Association Rules Graph for the Nangu-TV-1 Dataset

Outline Introduction Main Contents Experiments Discussion
Visualizing Association Rules for Nangu-TV-2
Figure : Association Rules Graph for the Nangu-TV-2 Dataset

Outline Introduction Main Contents Experiments Discussion
Visualizing Association Rules for Nangu-TV-2
Figure : Filtered Association Rules Graph for the Nangu-TV-2 Dataset
Outline Introduction Main Contents Experiments Discussion
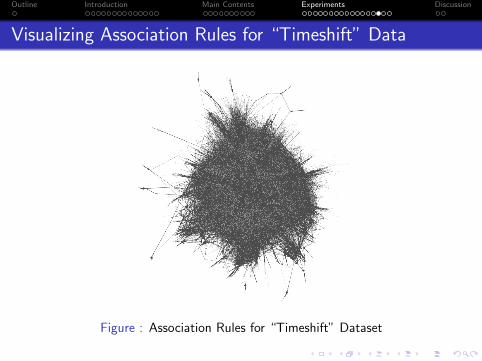
Visualizing Association Rules for “Timeshift” Data
Figure : Association Rules for “Timeshift” Dataset

Outline Introduction Main Contents Experiments Discussion
Confidence-driven AR-based Recommendation onMovieLens Dataset
Figure : Recommendations for a Specific User from the Database on theMovieLens Dataset, using Confidence as the Rule-Quality Metric

Outline Introduction Main Contents Experiments Discussion
Lift-driven AR-based Recommendation on MovieLensDataset
Figure : Recommendations for a Specific User from the Database on theMovieLens Dataset, using Lift as the Rule-Quality Metric

Outline Introduction Main Contents Experiments Discussion
Proposed Doctoral Thesis
Title: Meta-Learning Templates for Collaborative Filtering
Topics:
• Multi-Objective Optimization in Recommender Systems
• Extending results from this report
• Making more experiment with more algorithms and datasets
• Meta-Learning Templates in Collaborative Filtering
• Searching algorithm ensembles maximizing all the performancemeasures
• universally applicable?• data-dependent?

Outline Introduction Main Contents Experiments Discussion
Thank you for your attention!
Tomas [email protected]
Acknowledgements
Our research is partially supported by the following grants:
• Novel Model Ensembling Algorithms (SGS10/307/OHK3/3T/181) grant of the Czech Technical Universityin Prague,
• Research and development of the interactive and platform services for the interactive digital TV broadcastMPO/FR grant (FR-TI2/128).
We would like to thank the Alnair, a.s. company (developer of the nangu.TV platform) for supporting our researchand providing us with the data.


![A Fuzzy Recommender System for eElections - unifr.ch Fuzzy Recommender System for eElections 63 2 Recommender Systems for eCommerce According to Yager [4], recommender systems used](https://static.fdocuments.us/doc/165x107/5b08be647f8b9a93738cdc60/a-fuzzy-recommender-system-for-eelections-unifrch-fuzzy-recommender-system-for.jpg)