Multinational Comparisons of Health Systems Data, 2014 Chloe Anderson The Commonwealth Fund November...
29
Multinational Comparisons of Health Systems Data, 2014 Chloe Anderson The Commonwealth Fund November 2014
-
Upload
cecil-robertson -
Category
Documents
-
view
215 -
download
1
Transcript of Multinational Comparisons of Health Systems Data, 2014 Chloe Anderson The Commonwealth Fund November...

Multinational Comparisonsof Health Systems Data, 2014
Chloe AndersonThe Commonwealth Fund
November 2014

2
Health Care Spending
Source: OECD Health Data 2014.
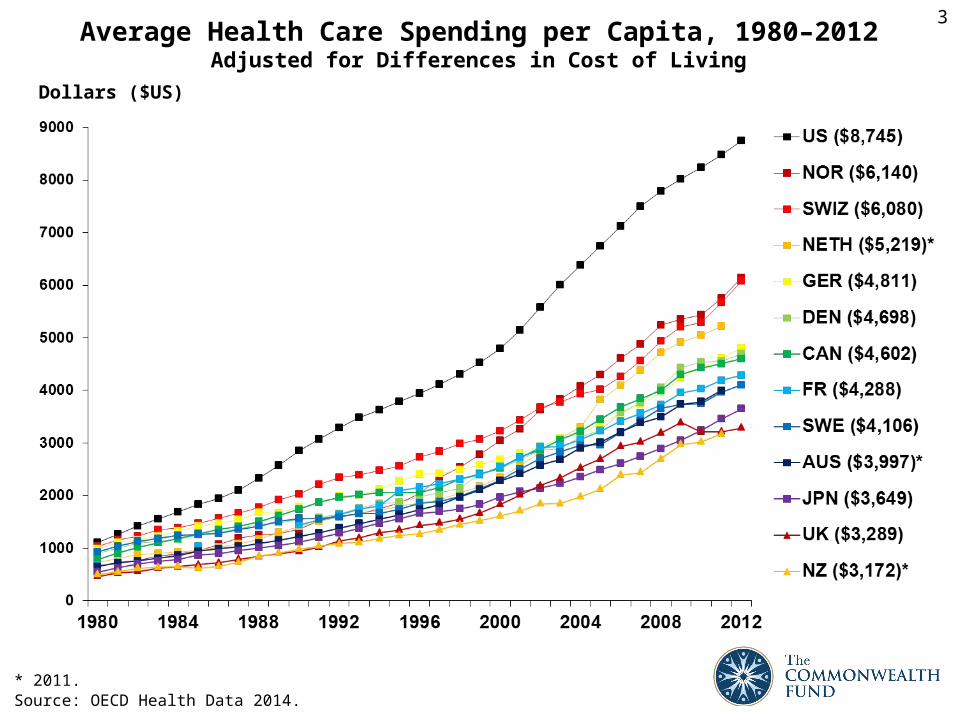
Average Health Care Spending per Capita, 1980–2012Adjusted for Differences in Cost of Living
3
Dollars ($US)
* 2011.
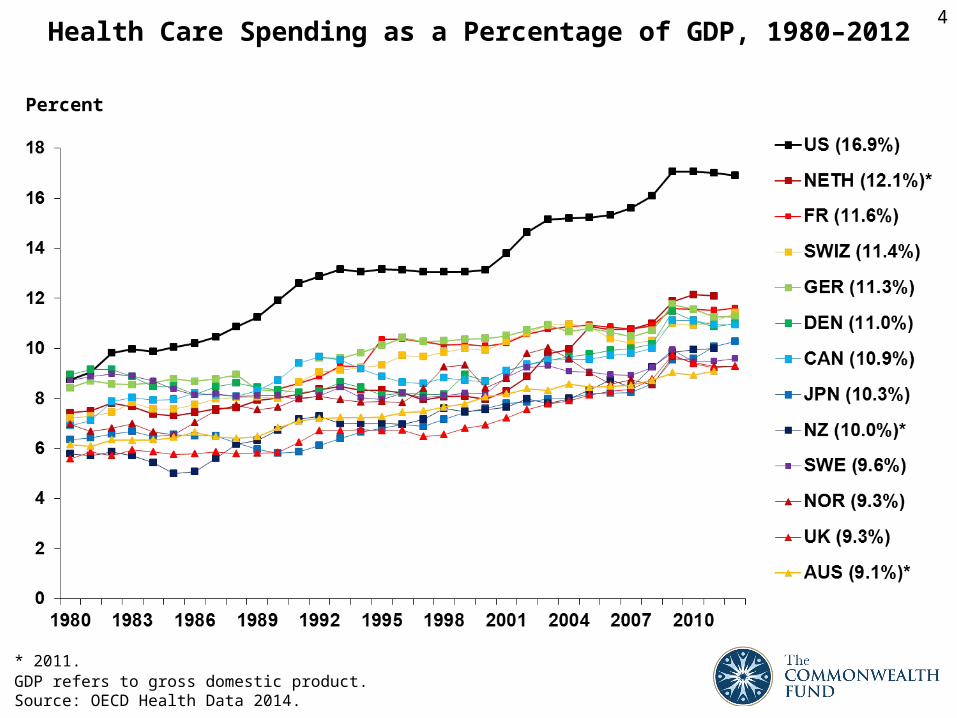
GDP refers to gross domestic product. Source: OECD Health Data 2014.
Health Care Spending as a Percentage of GDP, 1980–2012
Percent
* 2011.
4
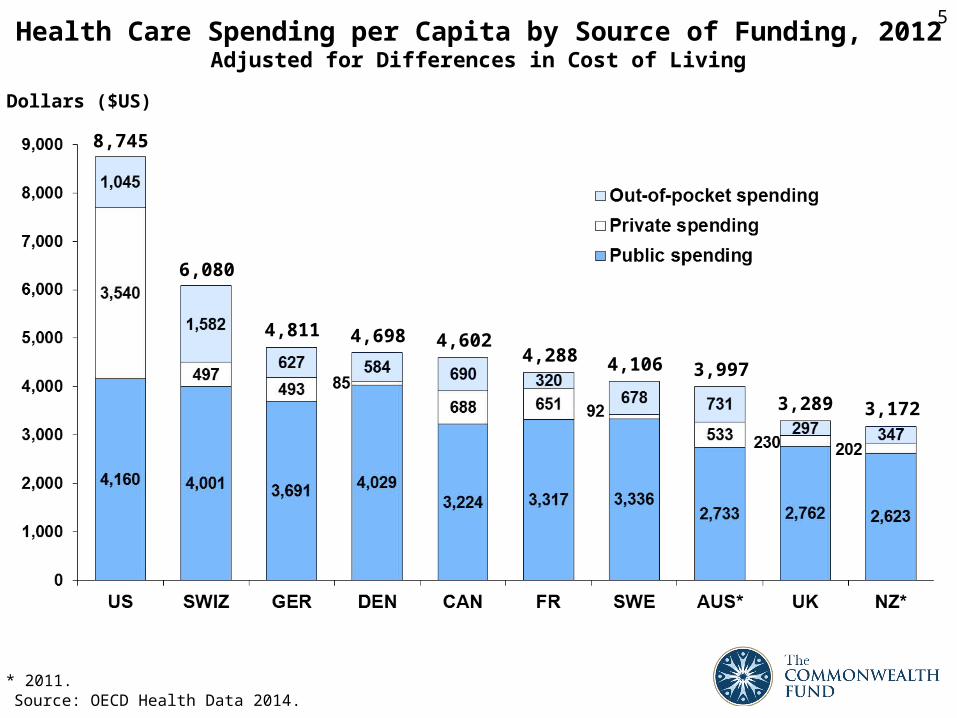
5Health Care Spending per Capita by Source of Funding, 2012
Adjusted for Differences in Cost of Living
* 2011.
Dollars ($US)
Source: OECD Health Data 2014.
8,745
6,080
4,811 4,698 4,6024,288 4,106 3,997
3,289 3,172

Spending per Hospital Discharge, 2012Adjusted for Differences in Cost of Living
Dollars ($US)
6
* 2011.** 2010.Source: OECD Health Data 2014.

7Pharmaceutical Spending per Capita, 2012
Adjusted for Differences in Cost of Living
* 2011.Source: OECD Health Data 2014.
Dollars ($US)

Spending on Health Insurance Administration per Capita, 2012Adjusted for Differences in Cost of Living
Source: OECD Health Data 2014.
Dollars ($US)
* 2011.
8

9
Health Care Supply and Utilization

Number of Practicing Physicians per 1,000 Population, 2012
Source: OECD Health Data 2014.
10
* 2011.

11Magnetic Resonance Imaging (MRI) Machines
per Million Population, 2012
* 2011.Source: OECD Health Data 2014.

Hospital Discharges per 1,000 Population, 2012
* 2011.** 2010.Source: OECD Health Data 2014.
12

13Average Annual Number of Physician Visits per Capita, 2012
* 2011.** 2010.Source: OECD Health Data 2014.

14Hip Replacement
Inpatient Cases per 100,000 Population, 2012
* 2011.** 2010.*** Data from publicly-funded hospitals only.Source: OECD Health Data 2014.

15
Health Promotion and Disease Prevention

Cervical Cancer Screening Rates, 2012
Percent of women screened
Note: UK, NZ, NOR, DEN, and AUS based on program data; all other countries based on survey data.* 2010.Source: OECD Health Data 2014.
16

Flu Immunization Among Adults Age 65 or Older, 2012Percent
* 2011.** 2010.Source: OECD Health Data 2014.
17
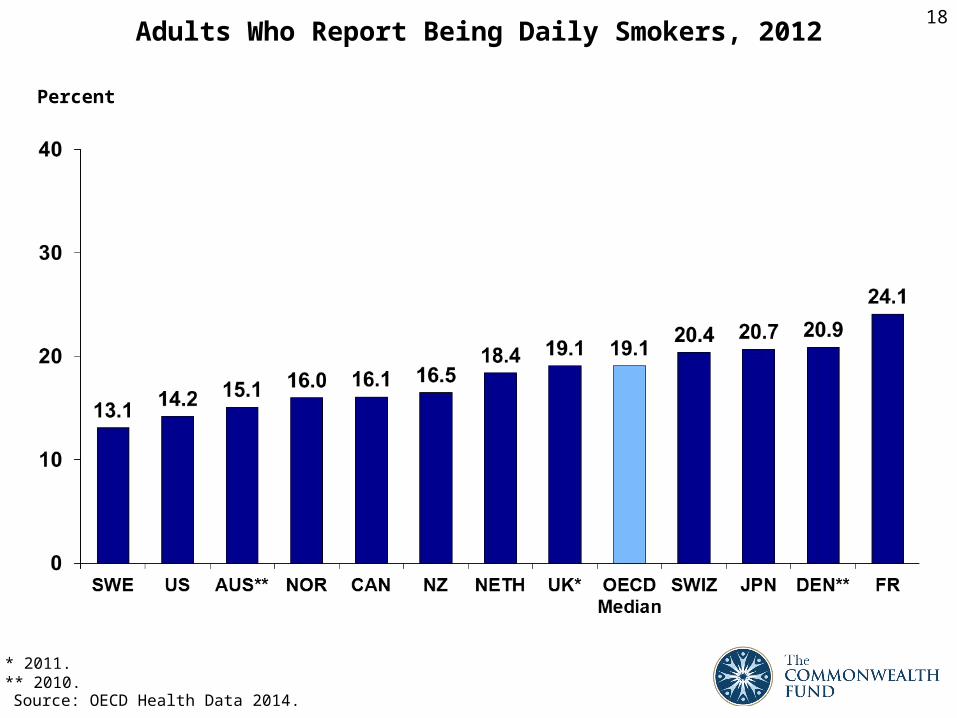
18Adults Who Report Being Daily Smokers, 2012
Percent
Source: OECD Health Data 2014.
* 2011.** 2010.

19
Quality and Patient Safety

Mortality Amenable to Health Care
Deaths per 100,000 population*
* Countries’ age-standardized death rates before age 75; including ischemic heart disease, diabetes, stroke, and bacterial infections. Analysis of World Health Organization mortality files and CDC mortality data for U.S.Source: Adapted from E. Nolte and M. McKee, “Variations in Amenable Mortality—Trends in 16 High-Income Nations,” Health Policy, published online Sept. 12, 2011.
20

Breast Cancer Five-Year Relative Survival Rate, 2007–2012(or nearest period)
Source: OECD Health Data 2014.
Percent
21
Note: UK and SWE data are from 2007–2012; NZ, NOR, NET, and DEN data are from 2006–2011; AUS data are from 2005–2010; US and GER data are from 2004–2009; CAN data are from 2003–2008; JPN data are from 2000–2005.

* 2012.** 2010.*** 2009.Source: OECD Health Data 2014.
Diabetes Lower Extremity Amputation Rates per 100,000 Population, 2011
22

23
Prices

Total Hospital and Physician Costs, 2013
Dollars ($US)
24
Appendectomy Bypass Surgery
Notes: US refers to the commercial average. Appendectomy prices reflect a blend of inpatient and outpatient prices based on relative utilization in each setting. Source: International Federation of Health Plans, 2013 Comparative Price Report.
Dollars ($US)

Diagnostic Imaging Prices, 2013
Notes: US refers to the commercial average. MRI refers to magnetic resonance imaging; CT refers to computed tomography.Source: International Federation of Health Plans, 2013 Comparative Price Report.
25
MRI CT Scan (abdomen)Dollars ($US) Dollars ($US)
26
Long-Term Care and Social Supports

Source: OECD Health Data 2014.
Percent of Population Age 65 or Older, 201227
Percent

* 2011.Source: OECD Health Data 2014.
Beds in Residential Long-Term Care Facilitiesper 100,000 Population Age 65 or Older, 2012
28
Note: Long-term care facilities include nursing and residential care facilities that provide accommodation and long-term care services. The data used in this measure vary across countries—such as the inclusion of private institutions (in addition to public institutions), psychiatric hospital units, substance abuse treatment centers, and rehabilitation centers—and different countries may have different types or a different mix of facilities. Thus, caution is in order in interpreting cross-national differences.

Source: E. H. Bradley, L. A. Taylor, and H. V. Fineberg, The American Health Care Paradox: Why Spending More is Getting Us Less, Public Affairs, 2013.
Health and Social Care SpendingPercent of GDP
Percent
29