Click Prediction for Web Image Reranking Using Multimodal Sparse ...

Multimodal Scanning Laser Ophthalmoscopy for Image Guided Treatment of Age-Related Macular Degeneration
Daniel X. Hammer*1, R. Daniel Ferguson1, Ankit H. Patel1, Nicusor V. Iftimia1, Mircea Mujat1,
and Deeba Husain2
1Physical Sciences Inc., 20 New England Business Center, Andover MA 01810 2Boston University School of Medicine, 85 East Concord Street #814, Boston MA 02118
ABSTRACT
Subretinal neovascular membranes (SRNM) are a deleterious complication of laser eye injury and retinal diseases such as age-related macular degeneration (AMD), choroiditis, and myopic retinopathy. Photodynamic therapy (PDT) and anti-vascular endothelial growth factor (VEGF) drugs are approved treatment methods. PDT acts by selective dye accumulation, activation by laser light, and disruption and clotting of the new leaky vessels. However, PDT surgery is currently not image-guided, nor does it proceed in an efficient or automated manner. This may contribute to the high rate of re-treatment. We have developed a multimodal scanning laser ophthalmoscope (SLO) for automated diagnosis and image-guided treatment of SRNMs associated with AMD. The system combines line scanning laser ophthalmoscopy (LSLO), fluorescein angiography (FA), indocyanine green angiography (ICGA), PDT laser delivery, and retinal tracking in a compact, efficient platform. This paper describes the system hardware and software design, performance characterization, and automated patient imaging and treatment session procedures and algorithms. Also, we present initial imaging and tracking measurements on normal subjects and automated lesion demarcation and sizing analysis of previously acquired angiograms. Future pre-clinical testing includes line scanning angiography and PDT treatment of AMD subjects. The automated acquisition procedure, enhanced and expedited data post-processing, and innovative image visualization and interpretation tools provided by the multimodal retinal imager may eventually aid in the diagnosis, treatment, and prognosis of AMD and other retinal diseases.
Keywords: Age-related macular degeneration, subretinal neovascular membranes, line scanning laser ophthalmoscopy, retinal tracking, fluorescein angiography, indocyanine green angiography, photodynamic therapy
1. INTRODUCTION
Vascularized lesions that invade the retinal pigment epithelium (RPE) and photoreceptors from the choriocapillaris through Bruch’s membrane are called subretinal neovascular membranes (SRNM) or choroidal neovascular membranes (CNV) and can result from diseases such as age-related macular degeneration (AMD), choroiditis, and myopic retinopathy. Approximately 7.3 million Americans over age 40 years have AMD and 1.75 million have advanced AMD including the wet form with SRNM [1]. Current treatment methodology includes surgical and laser therapies such as photodynamic therapy (PDT) [2] and drug therapies such as intravitreal injections of anti-vascular endothelial growth factors (VEGF) [3, 4]. Combined strategies that effectively employ both methods are also being explored [5].
AMD is usually diagnosed with simple visual tests (Amsler grid) and fundus examination. Standard retinal imaging techniques, including angiography and optical coherence tomography (OCT) are also used to make diagnoses and quantify various properties of retinal lesions. Indocyanine green angiography (ICGA) and fluorescein angiography (FA) are often employed to identify specific areas of blood vessel leakage in the choriocapillaris and retinal vasculature. Fluorescein absorbs in the 485-490 nm wavelength range and emits at ~530 nm and so is useful for visualization of retinal vasculature in front of the highly-pigmented RPE layer. Unbound sodium fluorescein is contained in the retinal vasculature by their tight junctions but diffuses through choriocapillaris vessels [6]. ICG is excited and fluoresces at longer wavelengths in the near infrared (800 and 835 nm) and so these more deeply penetrating wavelengths are useful for visualization of choroidal circulation. ICG also has a higher molecular weight and binds nearly completely to plasma proteins and so the dye leakage, and hence available imaging time, is longer. OCT is a low-coherence interferometry technique capable of generation of cross-sectional scans through retinal and sub-retinal layers [7].

Current strategies predominantly rely on fluorescein angiography (FA) for diagnosis but rarely use imaging to guide PDT treatment or drug injection. In fact, most treatment sessions involve many steps with at least two instruments. Approximately 50% of PDT surgeries require re-treatment. This high re-treatment rate may be due mostly to the efficacy of the PDT dye at disrupting the disease’s angiogenesis, but it may also be complicated by eye motion, poor imaging, improper alignment of the laser beam and lesion, and other factors related to laser delivery. An image-guided automated laser treatment delivery system will allow for more rapid diagnosis and treatment via a single platform and remove treatment variations in factors related to operator skill, but may also increase treatment effectiveness and reduce the number of required re-treatments.
We have developed a multimodal scanning laser ophthalmoscope (SLO) for automated diagnosis and image-guided treatment of SRNMs associated with AMD. The system combines line scanning laser ophthalmoscopy (LSLO) [8], FA, ICGA, PDT laser delivery, and retinal tracking [9, 10] in a compact, efficient platform.
2. METHODS
2.1 System and Program Overview
The retinal imaging instrument described, designated in this paper as the multimodal TSLO/PDT system, is a unique clinical prototype instrument that combines retinal tracking, confocal imaging, fluorescein and indocyanine green angiography, and PDT laser beam delivery in a compact slit-lamp-mounted platform. The conceptual design approach for the multifunctional retinal imaging instrument was to integrate hardware for angiography and treatment beam delivery into a tracking scanning laser ophthalmoscope (TSLO). The TSLO combines retinal tracker and LSLO techniques into a single instrument for wide-field confocal retinal imaging and stabilization of image/stimulus/treatment beams through all lateral eye movements. It has proven effective in applications such as retinal hemodynamics that traditionally suffer severely from eye motion artifacts [11]. A conceptual block diagram of the TSLO/PDT system is shown in Fig. 1.
Fig. 1. Conceptual block diagram of the multimodal retinal imaging system. The system includes a confocal LSLO imager configured for angiography (490-nm and 800-nm excitation), a retinal tracker (915-nm) and a PDT treatment laser (690 nm beam) delivered through tracking scanners to fixed retinal coordinates. The system continuously provides high contrast images of the fundus to monitor PDT laser spot and eye position data during any imaging or therapeutic procedure.
In addition to the design, fabrication, and testing of TSLO hardware for angiography and PDT laser beam delivery, we have developed new automated clinical procedures for treatment of SNRMs. The procedures will allow the surgeon to rapidly diagnose and treat lesions from a single platform. The platform will use image guidance for various laser- or drug-based interventions. They will also employ new techniques and software for unique presentation and quantification of diagnostic information.
We have tested the system in a preliminary human subject investigation on eyes without retinal disease. A future clinical investigation will be conducted at the Boston University Medical Center Eye Clinic on patients with eye disease. The investigation involves several incremental steps, including characterization and optimization of the system using a limited number of normal volunteers, complementary imaging on patients undergoing standard fundus camera angiography to verify instrument performance, and full procedure testing on patients for the diagnosis and treatment of retinal disease. The system design, operation, and first stages of the human subject testing are described in this paper.
2.2 Optical Setup
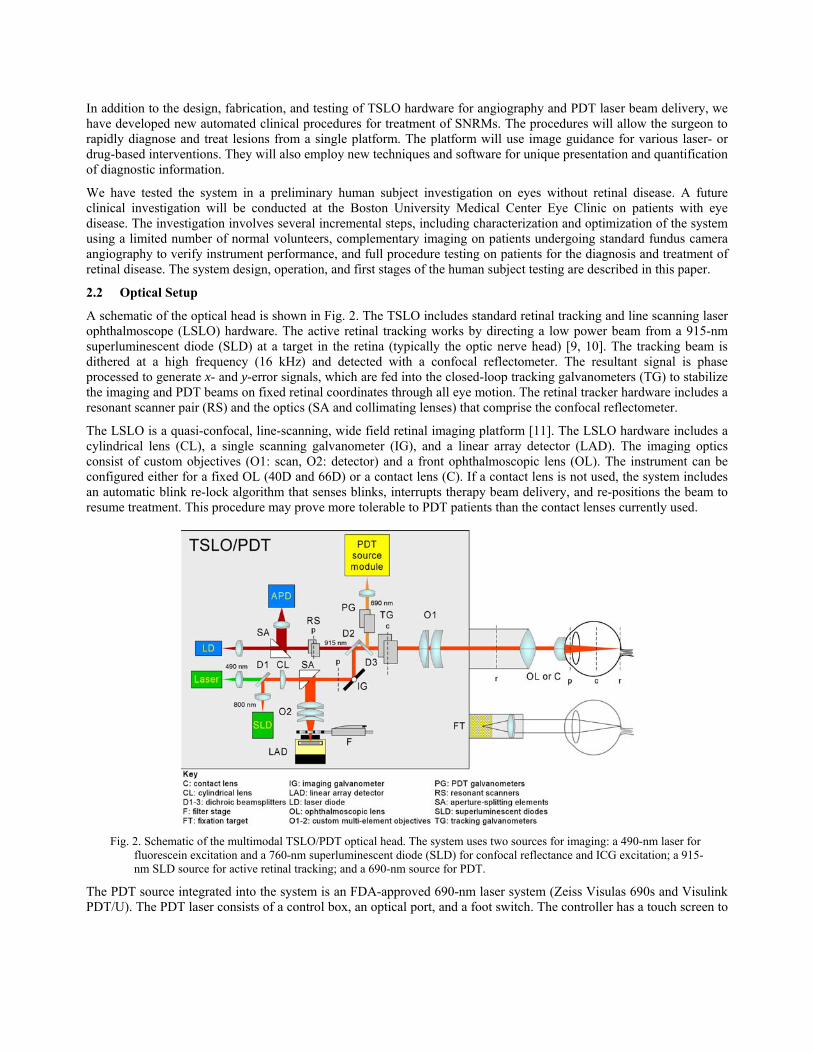
A schematic of the optical head is shown in Fig. 2. The TSLO includes standard retinal tracking and line scanning laser ophthalmoscope (LSLO) hardware. The active retinal tracking works by directing a low power beam from a 915-nm superluminescent diode (SLD) at a target in the retina (typically the optic nerve head) [9, 10]. The tracking beam is dithered at a high frequency (16 kHz) and detected with a confocal reflectometer. The resultant signal is phase processed to generate x- and y-error signals, which are fed into the closed-loop tracking galvanometers (TG) to stabilize the imaging and PDT beams on fixed retinal coordinates through all eye motion. The retinal tracker hardware includes a resonant scanner pair (RS) and the optics (SA and collimating lenses) that comprise the confocal reflectometer.
The LSLO is a quasi-confocal, line-scanning, wide field retinal imaging platform [11]. The LSLO hardware includes a cylindrical lens (CL), a single scanning galvanometer (IG), and a linear array detector (LAD). The imaging optics consist of custom objectives (O1: scan, O2: detector) and a front ophthalmoscopic lens (OL). The instrument can be configured either for a fixed OL (40D and 66D) or a contact lens (C). If a contact lens is not used, the system includes an automatic blink re-lock algorithm that senses blinks, interrupts therapy beam delivery, and re-positions the beam to resume treatment. This procedure may prove more tolerable to PDT patients than the contact lenses currently used.
Fig. 2. Schematic of the multimodal TSLO/PDT optical head. The system uses two sources for imaging: a 490-nm laser for fluorescein excitation and a 760-nm superluminescent diode (SLD) for confocal reflectance and ICG excitation; a 915-nm SLD source for active retinal tracking; and a 690-nm source for PDT.
The PDT source integrated into the system is an FDA-approved 690-nm laser system (Zeiss Visulas 690s and Visulink PDT/U). The PDT laser consists of a control box, an optical port, and a foot switch. The controller has a touch screen to

allow the user to change parameters such as light dose and exposure time. The laser is designed to be mounted on several different manufacturers’ slit lamps. For the TSLO, the Zeiss PDT laser is mounted outside of the enclosure with a plate attached to the optical head. The PDT port optics (lens and turning mirror) are mounted to the side of the optical head and are designed to transfer the PDT beam to the retinal with unity magnification. The PDT beam can be independently steered (with galvanometers, PG) anywhere within the field of view of the LSLO imager and with tracking, can be locked to fixed retinal coordinate throughout a treatment session.
In addition to confocal NIR reflectance images, the LSLO is configured with hardware to acquire confocal FA and ICGA images and videos. The input beam port combines two illumination beams into the primary imaging path: the near infrared (760 nm) light for confocal reflectance images and ICG angiograms, and 490-nm light for fluorescein angiograms. Off-the-shelf and custom-designed dichroic beamsplitters and barrier filters are used to combine the four beams into the eye and to detect fluorescein and ICG emission at 500-560 nm and 810-860 nm, respectively. A low-pass (~600 nm) dichroic beamsplitter (D1) directs the 490-nm FA laser source into the optical path. A high-pass (~1000 nm) dichroic beamsplitter (D2) combines the tracking and imaging beams. A band-pass filter at 690-nm (D3) directs the PDT laser into the optical path.
A high-speed linear actuator driven filter stage allows rapid switching between modes for acquisition of confocal, FA, and ICGA videos using a single linear detector. A filter stage includes detector barrier filters (F) and a Quickshaft linear actuator (MicroMo Electronics Inc.). The actuator has a top speed of 1.9 m/s and uses Hall sensors to achieve a resolution of 6 μm, a repeatability of 40 μm, and a precision of 120 μm (actuator specification terms as defined by manufacturer in product literature). Three filter slots house barrier filters for ICGA and FA and Schott glass for confocal reflectance LSLO imaging. The filters were made the same thickness to prevent optical path length differences that would affect image focus. The linear actuator is driven by commands from the PC (serial interface) with a small motion controller board that has been integrated into the electronics box.
The TSLO hardware also includes a computer-controlled 8×8 LED fixation target. Fellow eye fixation is used. Fellow-eye fixation may introduce eye position errors but the fixation target will only be used to grossly position the subject’s gaze direction to track on particular targets and to establish re-lock. A photograph of the system and optical head are shown in Fig. 3.
Fig. 3. Photographs of the TSLO/PDT system. (a) Entire system showing slit lamp table-mounted optical head and computer and electronics rack. (b) Optical head.
The multimodal TSLO/PDT system was modeled in Zemax optical design software to insure good imaging performance for the custom objectives at both the designed wavelength (~800 nm), where reflectance and ICGA imaging will be performed, and at ~500 nm, where FA will be performed (Fig. 4). The design shows the illumination and detection paths as well as the focused illumination line and the retinal spots from off-axis positions for ray bundles corresponding to ~2 mm at the pupil. The retinal spots essentially show the optical transfer function of a line from the detector to the

retina. Nearly-diffraction-limited performance is achieved across a wide 34-deg field at ~800 nm while some residual coma exists for large field angles at ~500 nm, away from the original near-infrared range (700-900 nm) for which the objectives were designed and optimized. Overall, the Zemax optical design shows relatively good performance of the optics at both 490 and 800 nm.
Fig. 4. Zemax optical layout and spot diagrams for the LSLO setup. (a) illumination path, (b) illumination path retinal point
spread function (green=490 nm, blue=800 nm), (c) detection path, (d) focused spot diagram for ~2 mm diameter beam at the pupil across ± 5 mm (± 17 deg) on the retina (green=530 nm, blue=830 nm). Circle on the spot diagrams indicates Airy disc.
2.3 Electronics and Instrumentation
The schematic for the system electronics and instrumentation are shown in Fig. 5. The electronics are built around two custom boards, a motherboard and field programmable gated array (FPGA)-based tracker controller board, and includes several commercial OEM driver electronics boards. The primary function of the tracker controller board is to execute the feedback loop between the detector and galvanometers in real time independent of the host processor.
The motherboard has hardware to interface with OEM driver boards for the galvanometers (Cambridge Technology), resonant scanners (EOPC), and laser diodes (Exalos and Q-Photonics). It also includes integrated laser diode thermo-electric coolers and drivers, integrated custom detector electronics, power regulation electronics, and header slots to mount and communicate with the custom retinal tracker control board. The motherboard design can accommodate future revisions of the tracking control board. The tracker control electronics are composed of two boards: a Xilinx Virtex-4 FPGA mini-module board and an analog front-end (AFE) that includes a 6-channel 250-kHz analog-to-digital converter (ADC), a 4-channel, 100-kHz digital-to-analog converter (DAC), and digital input/output (DI/O) lines. The silicon tracking detector signal is sampled at 208 kHz and the eye position data is transferred to PC at a decimated rate
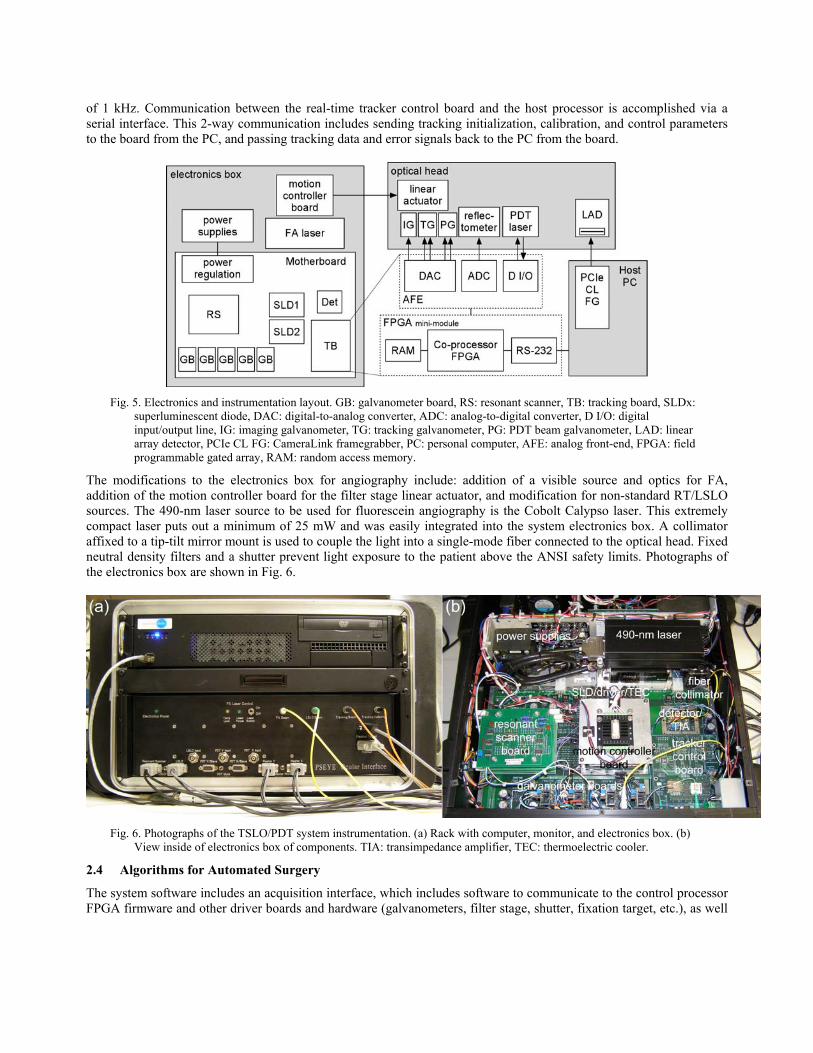
of 1 kHz. Communication between the real-time tracker control board and the host processor is accomplished via a serial interface. This 2-way communication includes sending tracking initialization, calibration, and control parameters to the board from the PC, and passing tracking data and error signals back to the PC from the board.
Fig. 5. Electronics and instrumentation layout. GB: galvanometer board, RS: resonant scanner, TB: tracking board, SLDx: superluminescent diode, DAC: digital-to-analog converter, ADC: analog-to-digital converter, D I/O: digital input/output line, IG: imaging galvanometer, TG: tracking galvanometer, PG: PDT beam galvanometer, LAD: linear array detector, PCIe CL FG: CameraLink framegrabber, PC: personal computer, AFE: analog front-end, FPGA: field programmable gated array, RAM: random access memory.
The modifications to the electronics box for angiography include: addition of a visible source and optics for FA, addition of the motion controller board for the filter stage linear actuator, and modification for non-standard RT/LSLO sources. The 490-nm laser source to be used for fluorescein angiography is the Cobolt Calypso laser. This extremely compact laser puts out a minimum of 25 mW and was easily integrated into the system electronics box. A collimator affixed to a tip-tilt mirror mount is used to couple the light into a single-mode fiber connected to the optical head. Fixed neutral density filters and a shutter prevent light exposure to the patient above the ANSI safety limits. Photographs of the electronics box are shown in Fig. 6.
Fig. 6. Photographs of the TSLO/PDT system instrumentation. (a) Rack with computer, monitor, and electronics box. (b) View inside of electronics box of components. TIA: transimpedance amplifier, TEC: thermoelectric cooler.
2.4 Algorithms for Automated Surgery
The system software includes an acquisition interface, which includes software to communicate to the control processor FPGA firmware and other driver boards and hardware (galvanometers, filter stage, shutter, fixation target, etc.), as well
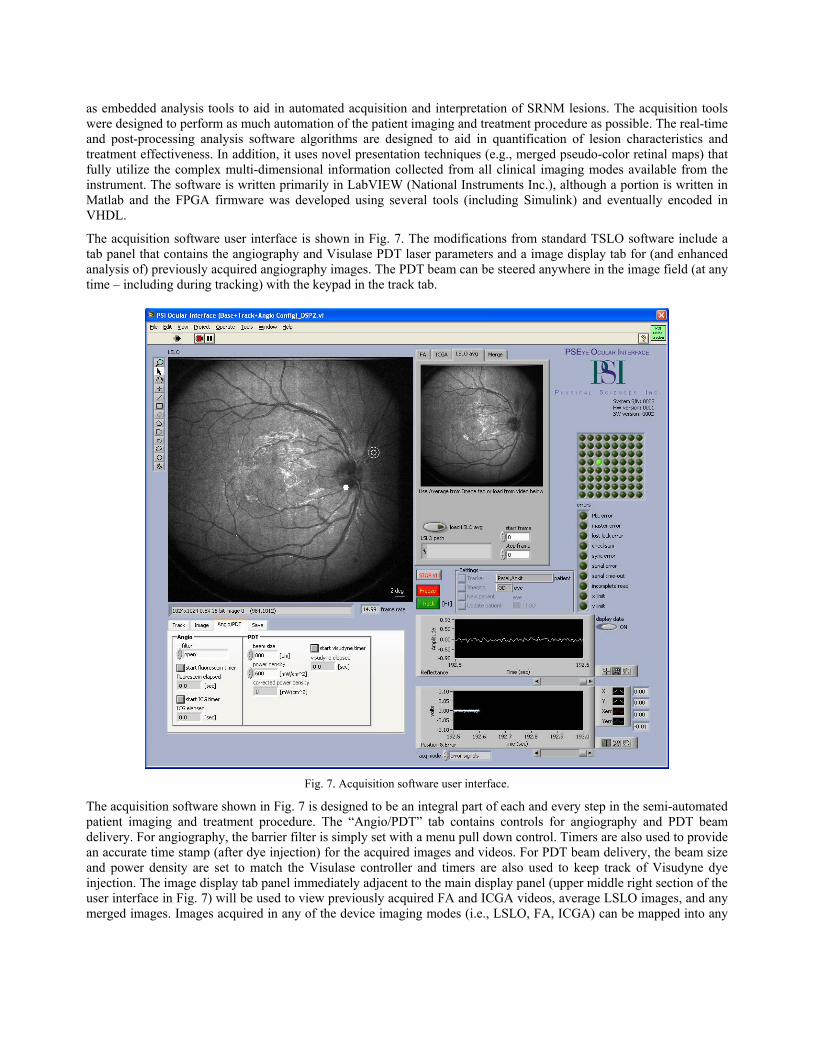
as embedded analysis tools to aid in automated acquisition and interpretation of SRNM lesions. The acquisition tools were designed to perform as much automation of the patient imaging and treatment procedure as possible. The real-time and post-processing analysis software algorithms are designed to aid in quantification of lesion characteristics and treatment effectiveness. In addition, it uses novel presentation techniques (e.g., merged pseudo-color retinal maps) that fully utilize the complex multi-dimensional information collected from all clinical imaging modes available from the instrument. The software is written primarily in LabVIEW (National Instruments Inc.), although a portion is written in Matlab and the FPGA firmware was developed using several tools (including Simulink) and eventually encoded in VHDL.
The acquisition software user interface is shown in Fig. 7. The modifications from standard TSLO software include a tab panel that contains the angiography and Visulase PDT laser parameters and a image display tab for (and enhanced analysis of) previously acquired angiography images. The PDT beam can be steered anywhere in the image field (at any time – including during tracking) with the keypad in the track tab.
Fig. 7. Acquisition software user interface.
The acquisition software shown in Fig. 7 is designed to be an integral part of each and every step in the semi-automated patient imaging and treatment procedure. The “Angio/PDT” tab contains controls for angiography and PDT beam delivery. For angiography, the barrier filter is simply set with a menu pull down control. Timers are also used to provide an accurate time stamp (after dye injection) for the acquired images and videos. For PDT beam delivery, the beam size and power density are set to match the Visulase controller and timers are also used to keep track of Visudyne dye injection. The image display tab panel immediately adjacent to the main display panel (upper middle right section of the user interface in Fig. 7) will be used to view previously acquired FA and ICGA videos, average LSLO images, and any merged images. Images acquired in any of the device imaging modes (i.e., LSLO, FA, ICGA) can be mapped into any

color (RGB) in the merged image. The tab panel also links to the lesion demarcation and sizing software described below so that this can be accomplished directly during the procedure.
As described above, the advanced analysis libraries will contain several programs rather than a unified analysis platform. These include the lesion demarcation and sizing software, software for advanced image analysis and processing (similar to the image display tab just discussed in the acquisition software), and a reader, in which the LSLO, FA, and ICGA videos and eye position data can be examined in post-processing.
The automated lesion demarcation and sizing software is shown in Fig. 8. The automated demarcation software uses several steps including multi-class thresholding (lower right frame in Fig. 8), morphological operations (open and close), particle filtering, particle hole filling, removal of border particles, edge detection (with a differentiation convolution filter), and finally particle analysis to determine the lesion size.
Fig. 8. Automated lesion demarcation analysis software.
2.5 Subjects and Clinical Testing Procedure
The system was tested in preliminary sessions on a small number of subjects (five) without retinal disease for the purpose of performance characterization and optimization. Pre-clinical testing on subjects with AMD at Boston Medical Center is schedule in the coming year, where FA, ICGA, and PDT laser treatments will be performed.
The semi-automated patient imaging and treatment procedure will be conducted as follows. First, initial LSLO confocal reflectance images will be acquired. Second, FA and ICGA videos will be acquired after dye injection into the patient. Early and late phase FA imaging are usually accomplished in the first few minutes and from 10-20 minutes after injection, respectively. Early phase ICG is accomplished immediately after FA early phase acquisition. Late phase ICG takes place at regular intervals between FA late phase imaging. The barrier (emission) filters can be rapidly switched between LSLO, FA, and ICGA modes at any point during video acquisition from the software. Third, the lesion will be automatically sized, probably from the late phase FA images (although merged images and other analysis techniques may be used to better define lesion boundaries). Fourth, the PDT beam will be aligned to the lesion, the therapy beam fluence set, and the light dose delivered after PDT dye injection. LSLO imaging and tracking (with blink re-lock detection) can be accomplished at any point during this procedure.
3. RESULTS
3.1 System Characterization
The PDT beam power through the system was measured to determine optical losses from surface reflections. This was performed at the retinal conjugate where only a single ophthalmoscopic lens (2 surfaces) with NIR anti-reflection

coating will contribute an additional 1% loss before the beam enters the eye. Between the Visulase output and the retinal conjugate, there are 5 mirror surfaces (turning mirror, 2 tracking galvanometer mirrors, and 2 PDT beam steering galvanometers) and 6 lens surfaces (relay lens and 2 lenses in the scan objective), and 1 dichroic beamsplitter. Since each mirror surface has ~4% loss, each lens surface has 0.5% loss (NIR anti-reflection coating), and the dichroic has 2% loss at the 690-nm PDT laser wavelength, the total estimated power at the retinal conjugate is 75.2% of the laser output power. The power measured was 75.3% of the laser output power in very close agreement with the calculated optical losses through the system.
In order to verify that the relay lens was correctly positioned and that the beam was correctly relayed through the system to the retina, a spot size measurement was performed. The PDT beam was adjusted over its range from 0.8 and 4.9 mm. Images were collected at the retinal conjugate and the beam size was measured with custom profiling software. The measured values were corrected for the 1.67 magnification of the 40D Volk lens that transfers the retinal conjugate image to the retina. Figure 9 shows the results. The average measurement error across the entire range was 3.48% and only 4 or 16 data points (25%) had an error over 5%. No data point had an error above 10%. This indicates proper beam alignment and relay lens positioning.
Fig. 9. PDT spot size measurements.
3.2 Imaging Performance
Figure 10 shows LSLO images of the eagle on a dollar bill and an AF resolution chart acquired from the TSLO/PDT system at the retinal conjugate (focus plane between ophthalmoscopic and scan lenses). The eagle image indicates the system has good field flatness. The inset of Fig. 10(b) shows separation of line pairs at approximately group 4-1 or 4-2 (16 and 17.95 line pairs per mm or 55.7 and 62.5 μm per line pair, respectively). The magnified pixel size at the retinal conjugate is 22.7 μm so the system can resolve features down to 2-3 pixels.

Fig. 10. LSLO images of test targets. (a) Dollar bill. (b) Air Force resolution chart. Inset of (b) shows groups 2-5 magnified by 2×.
Initial images were also collected from 5 subjects without retinal disease, three of which are shown in Fig. 11. These images are composite images created from averaging 50 frames of a video acquired during tracking. The images show very good contrast and resolution of small features such as thin vessels and the foveal pit, indicating good imaging and tracking performance.
Fig. 11. Initial LSLO images of PSI subjects. (a) Male, normal vision, age 25. (b) Male, normal vision (presbyopia), age 49. (c) Male, normal vision (presbyopia), age 52. Foveal pit and small capillaries are visible in all subjects. Subject (a) also has bright reflection from nerve fiber layer near the macula and optic nerve head. Scale bar = 3 deg.
3.3 Tracking Performance
Initial retinal tracking was successful on all individuals tested, although tracking fidelity and performance of the blink re-lock algorithm varied somewhat depending upon retinal anatomy. Figure 12 shows an example of tracking on one subject. Shown are a single averaged image and the eye position data (collected from the tracking mirror galvanometer signals) for a ~9-sec. video during tracking. The subject slewed from a central fixation LED to the eight nearest neighbor LEDs surrounding the central LED (first the corner LEDs and then the horizontal and vertical LEDs). The distance between LEDs is a little over 2 deg. The LED display was controlled by the operator. The image is the composite generated from averaging all 142 frames of the video (15 Hz frame rate). The foveal reflex (dark region near fixation target overlay) and small capillaries surrounding the fovea are visible in the composite image, indicating good tracking accuracy.

Fig. 12. Retinal tracking performance on 38-year old male (7D myopia, imaged with contacts). (a) Composite image generated from 142 video frames acquired during eye movement sequence. Overlay shows tracking beam position in the ONH and fixation target position. (b) Eye position data. Scale bar = 2 deg.
3.4 Automated Analysis Software
The automated lesion demarcation and sizing software described in Section 2.4 was tested on fluorescein angiograms previously acquired from 8 AMD subjects with an assortment of lesion sizes and under various imaging artifacts and conditions. The results are shown in Fig. 13. The overlay shows both the manual sizing by an untrained scientist (i.e., not an ophthalmologist) and the automatic demarcation by the software. The automatic lesion boundary has a more jagged edge. Note the poor image quality of the angiograms from subjects c and g.
Fig. 13. Results of automatic lesion demarcation algorithm. (a-h) 8 subjects corresponding to the PDT spot sizes listed in Table 1. The manual and automatic demarcation are shown in yellow (manual sizing has smooth boundary).
Table 1 lists the sizing results for this analysis (columns 3 through 6) in comparison to the actual PDT beam size measured and delivered by the ophthalmologist in the clinic (column 2). The error between the trained measurement and the untrained and automatic measurement is also listed. In general, the results were good – an error on average less than 15%. The error was particularly large in the analysis for subjects d, e, and g. We have already noted the poor quality of image g. Also, in d, e, and g, there is some question as to the demarcation of the central wet lesion in the presence of other areas of drusen. The software identified the central smooth bright lesion as distinguished from background drusen – the small, punctate, mottled pattern that surrounds the lesion and also covers much of the retina – or at least the

macula and the region around the disc. This led to an underestimation of the beam size (for d and e). Had the mottled region been included (by decreasing the threshold level), the lesion size would have been overestimated. Perhaps the ophthalmologist split the difference between these regions to treat as much of the area as possible with a relatively small spot size.
Table 1. List of calculated PDT spots sizes for three cases: Manual demarcation by trained ophthalmologist using conventional software; Manual demarcation by untrained scientist using current software; Automatic demarcation using current software.
Spot size (mm) Subject Trained Untrained Δ Auto Δ
a 5.852 6.003 2.6% 5.814 0.6% b 3.524 4.091 16.1% 3.689 4.7% c 4.367 4.133 5.4% 3.854 11.7% d 3.855 3.133 18.7% 2.946 23.6% e 3.224 2.679 16.9% 2.448 24.1% f 5.195 4.937 5.0% 4.743 8.7% g 4.575 6.666 45.7% 5.584 22.1% h 6.334 6.254 1.3% 6.146 3.0%
AVG 13.9% 12.3%
In addition to the demarcation software, we have developed several innovative techniques for enhanced lesion visualization using all the information available from the multimodal system. An example of two-dye angiography encoded in RGB color planes is illustrated in Fig. 14. (Note: these images were not acquired with the multimodal SLO system.) The pattern of choroidal vascularization in the region beneath the lesion is better visualized in the composite image than the individual angiograms. Various presentation modes and pseudo-color overlays may eventually enhance the information that can be extracted from the multimodal system, which has the capabilities to acquire confocal reflectance, FA, and ICGA images.
Fig. 14: Pseudo-color composite angiogram of wet AMD created from early phase ICGA (green) and late-phase FA (blue) images.
4. DISCUSSION AND CONCLUSION
Anti-vascular endothelial growth factor (VEGF) therapies such as Lucentis have been approved for use in humans since 2006 and are rapidly replacing PDT laser surgery as the treatment of choice by patients and clinicians alike. This is because the initial clinical trials showed that approximately 95% of patients maintained or improved vision at one year

when treated with Lucentis injections compared to approximately 62% of the controls [3, 4]. However, there are some drawbacks to the new pharmaceutical interventions. Lucentis and other anti-angiogenic agents last only 4-6 weeks in the eye and so intravitreal injections must be administered continually for 2 years. The process of intravitreal injection carries the risk of infection, bleeding and retinal detachment, which can be devastating to the eye. Therefore there is a real need to find new, effective, long-duration treatment methods for SRNMs. PDT in combination with anti-angiogenic agents and targeted PDT are currently being explored to potentially prolong treatment effect and achieve higher selectivity for treatment of SRNMs [5]. Also, laser surgery is often the only treatment option for other retinal diseases that do not involve neovascularization. The instrument described herein is well-suited for other types of laser therapies including novel combination therapies.
The instrument will soon be installed at the Boston University Medical Center Eye Clinic, where a multi-stage pre-clinical human subject investigation on subjects with AMD will take place. The system will be tested in all available modes from confocal reflectance to FA and ICGA. Retinal tracking performance on a clinical population will also be characterized. A small number of PDT laser surgeries are planned for those subjects that elect not to have anti-VEGF intravitreal injections. These tests will determine the benefit of the multimodal, automated treatment strategy for retinal diseases such as AMD.
ACKNOWLEDGEMENTS
This work was supported by DoD contract W81XWH-06-C-0397.
REFERENCES
1. The Eye Diseases Prevalence Research Group, “Prevalence of Age-Related Macular Degeneration in the United States,” Arch. Ophthalmol., 122, 564-572 (2004).
2. TAP study group, “Photodynamic therapy of subfoveal choroidal neovascularisation in age-related macular degeneration with verteporfin. One-year results of 2 randomised clinical trials - TAP report 1,” Arch. Ophthalmol., 117, 1329-1345 (1999).
3. P. J. Rosenfeld, D. M. Brown, J. S. Heier, D. S. Boyer, P. K. Kaiser, C. Y. Chung, R. Y. Kim; MARINA Study Group, “Ranibizumab for neovascular age-related macular degeneration,” N. Engl. J. Med., 355, 1419-1431 (2006).
4. D. M. Brown, P. K. Kaiser, M. Michels, G. Soubrane, J. S. Heier, R. Y. Kim, J. P. Sy, S. Schneider; ANCHOR Study Group, “Ranibizumab versus verteporfin for neovascular age-related macular degeneration,” N. Engl. J. Med., 355, 1432-1444 (2006).
5. R. F. Spaide, J. Sorenson, and L. Maranan, “Photodynamic therapy with verteporfin combined with intravitreal injection of triamcinolone acetonide for choroidal neovascularization,” Ophthalmol., 112, 301-304 (2005).
6. A. H. Rogers and A. Witkin, “Neovascular Age-Related Macular Degeneration,” in Retinal Imaging, D. Huang, P. K. Kaiser, C. Y. Lowder, and E. I. Traboulsi (eds.), Elsevier Inc., Philadelphia, Chapter 11, 152-163 (2006).
7. D. Huang, O. Tan, J. G. Fujimoto, W. Drexler, J. F. de Boer, M. Wojtkowski, and A. Kowalczyk, “Optical Coherence Tomography,” in Retinal Imaging, D. Huang, P. K. Kaiser, C. Y. Lowder, and E. I. Traboulsi (eds.), Elsevier Inc., Philadelphia, Chapter 3, 47-65 (2006).
8. D. X. Hammer, R. D. Ferguson, T. E. Ustun, C. E. Bigelow, N. V. Iftimia, and R. H. Webb, “Line-scanning Laser Ophthalmoscope,” J. Biomed. Opt., 11, 041126 (2006).
9. D. X. Hammer, R. D. Ferguson, J. C. Magill, M. A. White, A. E. Elsner, and R. H. Webb, “Image stabilization for scanning laser ophthalmoscopy,” Opt. Express, 10, 1542-1549 (2002). http://www.opticsexpress.org/abstract.cfm?URI=OPEX-10-26-1542.
10. D. X. Hammer, R. D. Ferguson, J. C. Magill, M. A. White, A. E. Elsner, and R. H. Webb, “Compact scanning laser ophthalmoscope with high speed retinal tracker,” Appl. Opt., 42, 4621-4632 (2003).
11. R. D. Ferguson, D. X. Hammer, A. E. Elsner, R. H. Webb, S. A. Burns, and J. J. Weiter, “Wide-field retinal hemodynamic imaging with the tracking scanning laser ophthalmoscope,” Opt. Express, 12, 5198-5208 (2004). http://www.opticsexpress.org/abstract.cfm?URI=OPEX-12-21-5198.