
Multimedia Wireless Networks from a Teletraffic Perspective · UMSC, SGSN, GGSN 2. Physical L2/L3...
194
Mobility Conference 2004 MULTIMEDIA WIRELESS NETWORKS FROM A TELETRAFFIC PERSPECTIVE MOSHE ZUKERMAN Electronic Engineering Department, City University of Hong Kong On Leave from ARC Special Research Centre for Ultra-Broadband Information Networks, Electrical and Electronic Engineering Department The University of Melbourne Several examples of recently published papers related to teletraffic applications to mobile and wireless networks are presented. The first provides performance evaluation of mobile networks where call repeated attempts are considered. The second is about an enhanced handoff control mechanism for multimedia wireless networks and its analysis. The third describes a new approach for performance evaluation of IEEE 802.11. The fourth evaluates the performance of packet transmissions using type-II hybrid ARQ over a correlated error channel. Finally, we discuss a relatively new scheme for congestion control where priority is given to small messages over large ones. INTRODUCTION Teletraffic is a branch of applied mathematics, which applies to: • performance evaluation of systems and networks • routing protocols • network dimensioning • forecasting • network traffic management. Teletraffic relies on queueing theory, mathematical programming, control theory, numerical analysis, simulation, graph theory, and complexity theory. Teletraffic applies to all timescales: buffer (queueing theory), congestion control (control theory of delay feedback systems), connection admission control (statistics and probability models), and network design and dimensioning (mathematical programming). We discuss here several examples of teletraffic applications to mobile and/or wireless networks and systems. We begin with a new approach to compute bounds for call blocking and dropping probabilities which considers repeated attempts. Next, we consider a wireless multimedia network and discuss an enhanced handoff scheme and its performance analysis. Then, we describe a new approach for performance evaluation of IEEE 802.11. Afterwards, a new technique for evaluation of packet performance, over Type-II Hybrid ARQ (Type-II HARQ), over a correlated error channel is discussed. Finally, we promote a relatively new scheme for congestion control where priority is given to small messages (mice) over large ones (elephants). 1
Transcript of Multimedia Wireless Networks from a Teletraffic Perspective · UMSC, SGSN, GGSN 2. Physical L2/L3...

Mobility Conference 2004
MULTIMEDIA WIRELESS NETWORKS FROM A TELETRAFFIC PERSPECTIVE
MOSHE ZUKERMAN
Electronic Engineering Department,
City University of Hong Kong On Leave from
ARC Special Research Centre for Ultra-Broadband Information Networks,
Electrical and Electronic Engineering Department The University of Melbourne
Several examples of recently published papers related to teletraffic applications to mobile and wireless networks are presented. The first provides performance evaluation of mobile networks where call repeated attempts are considered. The second is about an enhanced handoff control mechanism for multimedia wireless networks and its analysis. The third describes a new approach for performance evaluation of IEEE 802.11. The fourth evaluates the performance of packet transmissions using type-II hybrid ARQ over a correlated error channel. Finally, we discuss a relatively new scheme for congestion control where priority is given to small messages over large ones. INTRODUCTION Teletraffic is a branch of applied mathematics, which applies to: • performance evaluation of systems and networks • routing protocols • network dimensioning • forecasting • network traffic management. Teletraffic relies on queueing theory, mathematical programming, control theory, numerical analysis, simulation, graph theory, and complexity theory. Teletraffic applies to all timescales: buffer (queueing theory), congestion control (control theory of delay feedback systems), connection admission control (statistics and probability models), and network design and dimensioning (mathematical programming). We discuss here several examples of teletraffic applications to mobile and/or wireless networks and systems. We begin with a new approach to compute bounds for call blocking and dropping probabilities which considers repeated attempts. Next, we consider a wireless multimedia network and discuss an enhanced handoff scheme and its performance analysis. Then, we describe a new approach for performance evaluation of IEEE 802.11. Afterwards, a new technique for evaluation of packet performance, over Type-II Hybrid ARQ (Type-II HARQ), over a correlated error channel is discussed. Finally, we promote a relatively new scheme for congestion control where priority is given to small messages (mice) over large ones (elephants).
1

Mobility Conference 2004
PERFORMANCE BOUNDS FOR A CELLULAR NETWORK Lee et al. [1] promotes the idea that by considering product-form network models that closely approximate a realistic model, one can accurately bound and approximate the blocking probabilities of a cellular mobile network based on fixed channel allocation. We show that commonly-used Erlang-based approximations provide exact blocking probabilities within the context of these models. To allow considerations of call repeated attempts, worst case (M/M/k-type network) and best case (M/M/k/k-type network) scenarios are considered. Assuming Poisson arrivals, and exponential holding and cell sojourn times, Markov chain analyses and simulations are used to evaluate performance for both approaches. Two 49-cell architectures of cellular mobile networks based on: (1) a symmetric traffic scenario and (2) a highway are considered. HANDOFF CONTROL FOR MULTIMEDIA CELLULAR NETWORK Huang et al. [2] proposes a handoff control scheme that allows dynamic bandwidth sharing among various services in multimedia mobile cellular networks. The aim is to enhance bandwidth utilization subject to given specified quality of service requirements. The scheme is based on a combination of reservation and priority scheduling. Analytical performance results of the scheme are obtained and are confirmed by simulation. The performance results demonstrate the improvement in bandwidth utilization obtained by the proposed scheme. PERFORMANCE EVALUATION OF IEEE 802.11 Foh and Zukerman [3] introduce a new approach for modeling and performance analysis of medium access control protocols with particular focus on IEEE 802.11. The idea is to study the statistical behavior of the protocol operations and to approximate the total service time of a packet by a phase-type distribution. This leads to the construction of a queueing model that is amenable to analysis. The versatility of the model is demonstrated by considering Markov Modulated and on/off arrival processes, various data frame size distributions, and various IEEE 802.11 versions. The accuracy of the analytical results is verified by simulation. PACKET TRANSMISSION PERFORMANCE OVER TYPE-II HARQ OVER A CORRELATED CHANNEL Mukhtar et al. [4] presents a Markov-chain based method to analyze packet performance over a wireless link employing Type-II HARQ assuming the channel is subject to correlated transmission errors. This provides a tool for system parameter optimization. Numerical results for a wide range of channel statistics are presented. They illustrate the effect of bit error rate and correlation, and block size on packet latency and loss.
2
Mobility Conference 2004
MICE AND ELEPHANTS Guo and Matta [5] promote the idea of congestion control by eliminating large bursts (elephants) in favor of short messages (mice) during period of congestions. We would like to propose that this idea applies to the wireless access environment [6] whereby congestion alarms are broadcasted (red alert, yellow alert, etc.) by base stations to sources where each alarm level disallows transmission of burst beyond a certain size. REFERENCES [1] C. M. Lee, P. G. Taylor and M. Zukerman “Bounds and approximations for
cellular networks with repeated attempts”, submitted for publication. Earlier version presented in: M. Zukerman and C. M. Lee, Proceedings of IEEE VTC 2001, Rhodes, Greece, May 2001, pp. 996-1000.
[2] Q. Huang, S. Chan, K. T. Ko, and M. Zukerman, “An enhanced handoff control scheme for multimedia traffic in cellular networks”, IEEE Communications Letters, Vol. 8, No. 3, March 2004, pp. 195-197.
[3] C. H. Foh and M. Zukerman, “Performance evaluation of IEEE 802.11”, Proceedings of IEEE VTC 2001, pp. 841-845, Rhodes, Greece, May 2001.
[4] R. G. Mukhtar, S. Hanly, M. Zukerman and F. Cameron, “A model for the performance evaluation of packet transmissions using type-II hybrid ARQ over a correlated error channel”, Wireless Networks, Vol. 10, No. 1, January 2004, pp. 7-16.
[5] L. Guo and I. Matta, “The war between mice and elephants”, In Proceedings of ICNP'2001: The 9th IEEE International Conference on Network Protocols, Riverside, CA, November 2001.
[6] Ron Addie, private communications.
3
Recent Development &Challenge for 3G
Amer G. El-NahiExecutive DirectorMobility Marketing & StrategyAsia PacificMobile: +65 9128 6009Email: [email protected]

One thing for sure: the future will be unlike anything we know!
3 © Lucent Technologies 2004 - All Rights Reserved
Amer G. El-Nahi
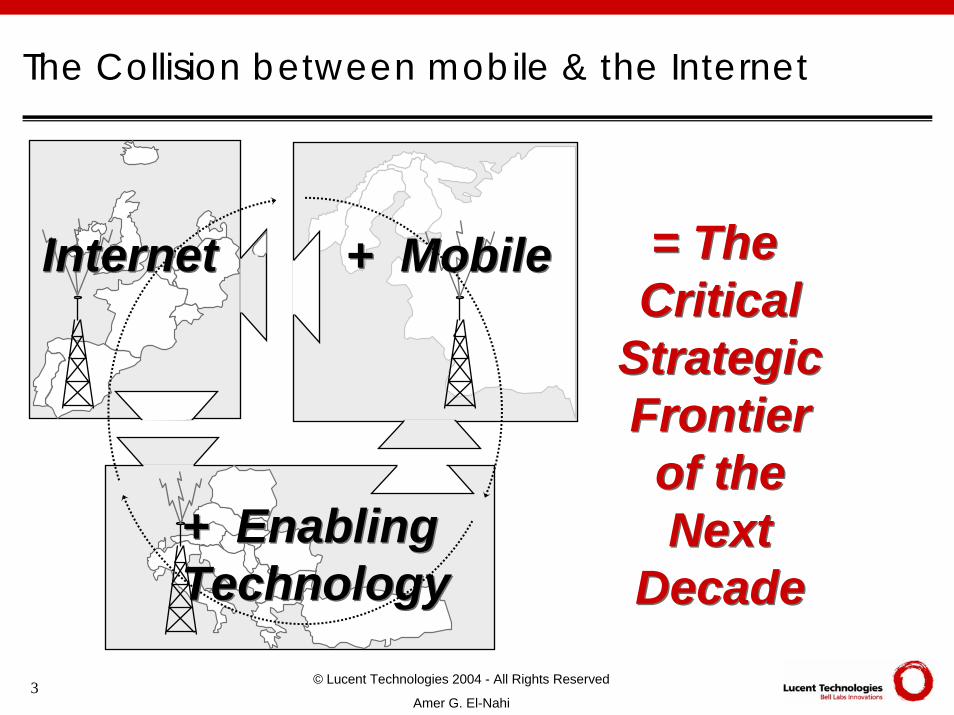
The Collision between mobile & the Internet
= The Critical
Strategic Frontier of the Next
Decade
= The Critical
Strategic Frontier of the Next
Decade
+ Mobile+ MobileInternetInternet
+ EnablingTechnology+ EnablingTechnology
4 © Lucent Technologies 2004 - All Rights Reserved
Amer G. El-Nahi
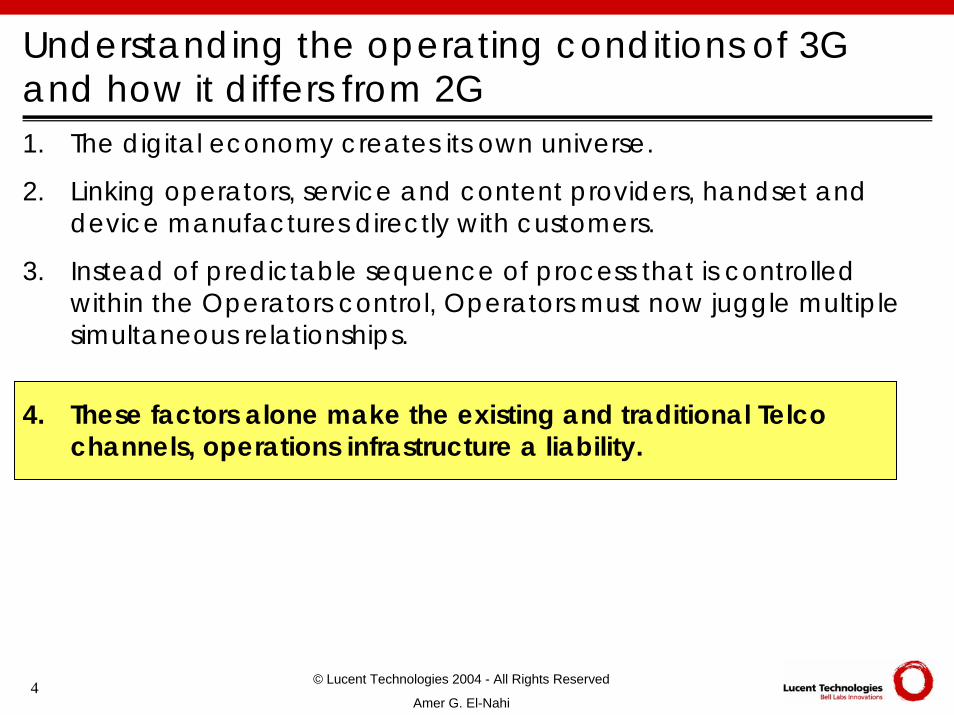
Understanding the operating conditions of 3G and how it differs from 2G1. The digital economy creates its own universe.
2. Linking operators, service and content providers, handset and device manufactures directly with customers.
3. Instead of predictable sequence of process that is controlled within the Operators control, Operators must now juggle multiplesimultaneous relationships.
4. These factors alone make the existing and traditional Telco channels, operations infrastructure a liability.

5 © Lucent Technologies 2004 - All Rights Reserved
Amer G. El-Nahi
Culture Shock!
ConservativenessRanking
1. Telecom/Wireless2. IT3. Internet
Internal tug of war.
Engineering Marketing
PersonalityClash
ITgurus
Internetgurus
Wirelessgurus
Telecomgurus
Internet cultureEngineering Culture
Speed: Time to market

6 © Lucent Technologies 2004 - All Rights Reserved
Amer G. El-Nahi
Food for thought:
“The ‘surplus society’ has a surplus of similarcompanies, employing similar people, with similar educational backgrounds, working in similar jobs, coming up with similar ideas, producing similar things, with similar prices and similar quality.”
Kjell Nordstrom and Jonas Ridderstrale,- Funky Business
7 © Lucent Technologies 2004 - All Rights Reserved
Amer G. El-Nahi
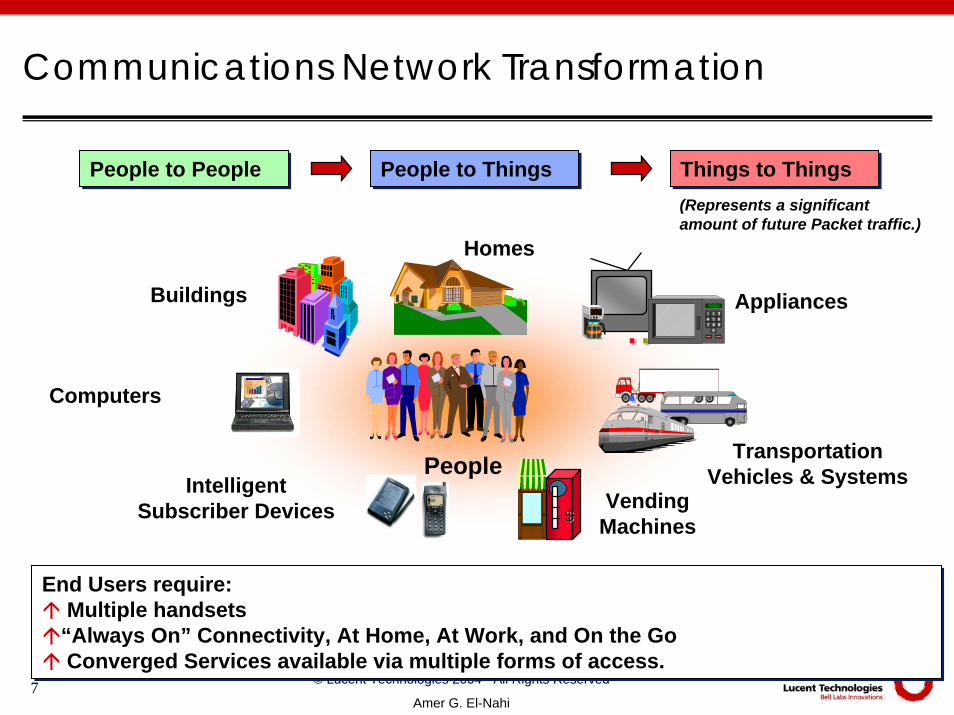
Communications Network Transformation
Buildings
Computers
People
Homes
Appliances
TransportationVehicles & Systems
VendingMachines$$
....
..
IntelligentSubscriber Devices
People to PeoplePeople to People People to ThingsPeople to Things Things to ThingsThings to Things(Represents a significant amount of future Packet traffic.)
End Users require:Multiple handsets
“Always On” Connectivity, At Home, At Work, and On the Go Converged Services available via multiple forms of access.
End Users require:Multiple handsets
“Always On” Connectivity, At Home, At Work, and On the Go Converged Services available via multiple forms of access.
8 © Lucent Technologies 2004 - All Rights Reserved
Amer G. El-Nahi
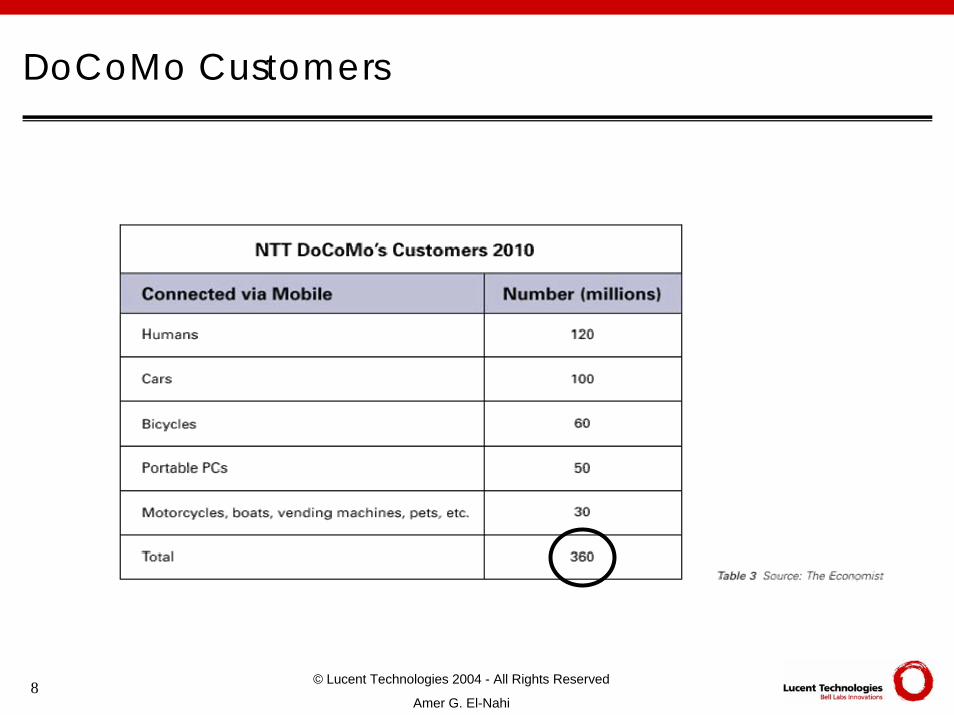
DoCoMo Customers

9 © Lucent Technologies 2004 - All Rights Reserved
Amer G. El-Nahi
The Internet is Driving Technology Convergence and Disrupting Business Models
INTERNETINTERNETDistribution
Channels
Media / ContentMedia / Content
Books
MusiciansAuthors
NewspaperCDs
Reporters
TelephonyTelephony
Data Networks
WirelessNetwork
Fixed Networks
Networking
Distribution Channels
Software Providers
Hardware Providers
ComputingComputing
The Internet is critical and important, but the networking revolution is about more than the next generation of Data Networking (IP/ATM), It’s about:
Broadband & Narrowband, Wired & Wireless Access Technologies
Breaking Down Barriers Between Historically Separate Industry Segments
Networks that will work together to deliver services seamlessly
Convergence Frontier

10 © Lucent Technologies 2004 - All Rights Reserved
Amer G. El-Nahi
IMT-2000 Network Reference Model
Packet Core Network:1. UMSC, SGSN, GGSN2. Physical L2/L3 Network
Network Services:1. Personalisation Mediation;2. Data services: Data VPN, WAP, Messaging;3. Security Infra: AAA, PKI;4. L3 Infra: Firewalls, network storage;5. Basic Services: HLR, Pre-Paid, Voice VPN, Service Mgmt;6. Location Infra: GMLC, SMLC
Mobile Applications Infrastructure:1. Portal Infra: Personalisation, Content/Device Adaptors;2. Application Servers Database;3. EAI: BSS Integration, Web Integration: B2B/B2C integration;4. Hosting Infra: Servers, Storage, Caching, Load Balancing
Applications:1. Trusted & untrusted Applications
Bus
ines
s Su
ppor
t Sys
tem
sN
etw
ork
Mgm
t Sys
tem
s
Radio:1. Node B. UMTS2. Radio Topology
Control layerControl layer
Transport layerTransport layer
Access layerAccess layer

11 © Lucent Technologies 2004 - All Rights Reserved
Amer G. El-Nahi
Transformation to seamless Services
Replication of servicesNetwork-specific content
wirelessnetwork
wirelessaccess
sub
mgm
tm
essa
ging
netw
ork
adm
in
secu
rity
billi
ng
wirelinenetwork
wirelineaccess
sub
mgm
tm
essa
ging
netw
ork
adm
in
secu
rity
billi
ng
Internet
dataaccess
sub
mgm
tm
essa
ging
netw
ork
adm
in
secu
rity
billi
ng
Today’s Business Environment
Content-driven environmentsSeamless, integrated servicesAccess distinctions minimized
wireless and wirelinevoice and data
wireless wired data
Internet / packet network(ATM / IP)
unifiedmessage
centralsecurity
networkadmin
intelligentsub mgmt
centralbilling
Next Generation Communications Networks
Feature and service logic moving further into network and away from access systems.Feature and service logic moving further into network and away from access systems.

12 © Lucent Technologies 2004 - All Rights Reserved
Amer G. El-Nahi
Next Generation Communications Networks
unifiedmessaging
centralsecurity
customercare
intelligentsub mgmt
integratedbilling
Application Layer
Core Network LayerInternet / packet network(IP/ATM)
Access Layerwireless wired data
13 © Lucent Technologies 2004 - All Rights Reserved
Amer G. El-Nahi
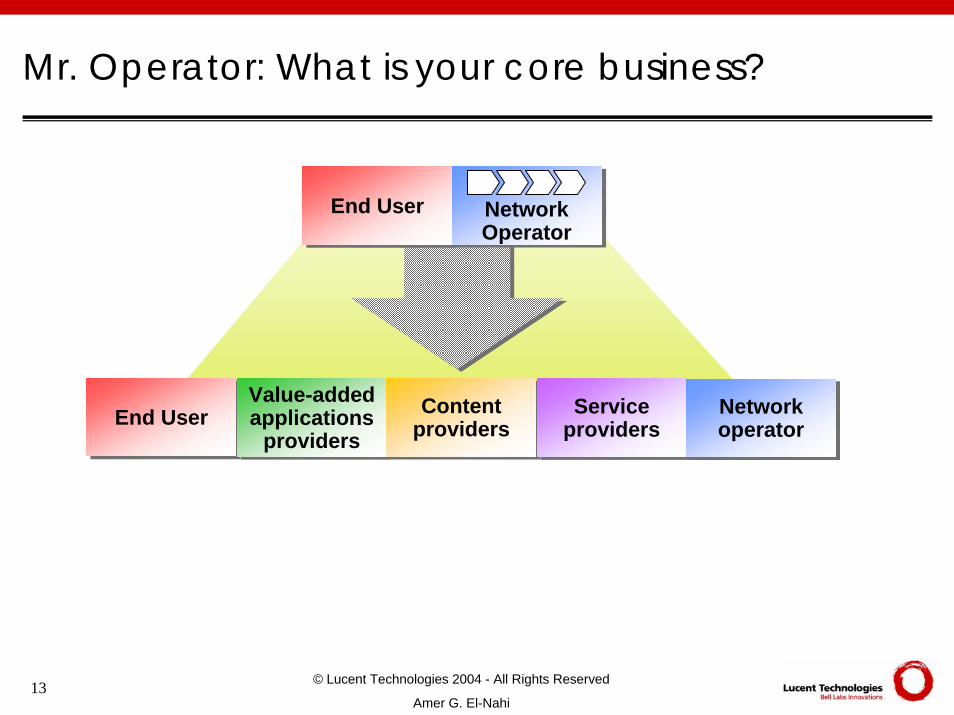
Mr. Operator: What is your core business?
End UserEnd UserValue-added applications
providers
Value-added applications
providersContent
providersContent
providersService
providersService
providersNetworkoperatorNetworkoperator
End UserEnd User Network Operator
14 © Lucent Technologies 2004 - All Rights Reserved
Amer G. El-Nahi
Food for thought:
3G (& 2.5G) is not just about new technology (that’s the easy part), 3G is new business, a totally different business!

15 © Lucent Technologies 2004 - All Rights Reserved
Amer G. El-Nahi
As industries converge, mobile operators’ customer management functions will compete directly with other consumer brands
As customer relationship management business in different industries seek further economies of scope, it becomes a question of when rather than if they will ultimately converge and compete directly for ownership of the consumer relationship
Services Customer ManagementTransport
Commerce One30m customers
AOL30m customers
General Motors
K-mart?Coles-Myer?Wal-mart…
Vodafone is developing multi-platform access portal
Tesco (UK based supermarket) has the most successful internet shopping platform in Europe and cross-sells products as diverse as financial services and cars. Tesco is now establishing an MVNO to
package its own mobile services.
Commerce One has been one of the most successful cross-seller in the financial services industry. Established a
mobile service provider on Sprint PCS but then sold it to Sprint. Establishing a telecoms division in Europe
General Motors are becoming a mobile virtual network operator (MVNO) in the UK
Electronic service packaging
Retailing
Retailing
Mobile services
Credit card issuing, financial services
16 © Lucent Technologies 2004 - All Rights Reserved
Amer G. El-Nahi
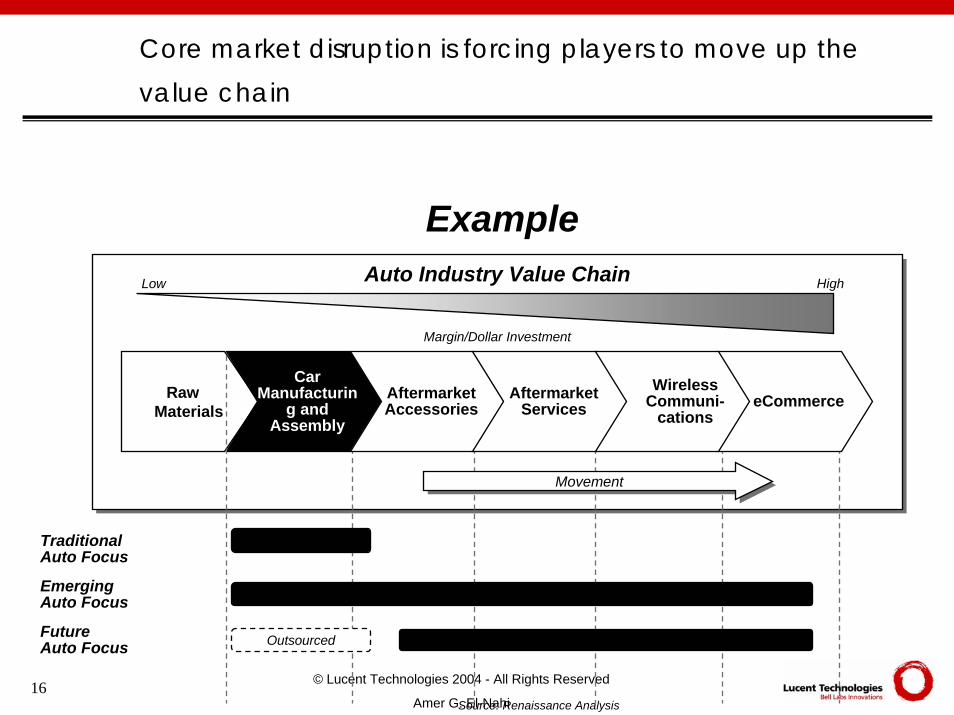
Core market disruption is forcing players to move up the value chain
Auto Industry Value Chain
ExampleAuto Industry Value ChainLow High
Margin/Dollar Investment
MovementMovement
Traditional Auto Focus
Emerging Auto Focus
Future Auto Focus Outsourced
Raw Materials
Car Manufacturin
g and Assembly
Aftermarket Accessories
Aftermarket Services eCommerce
Wireless Communi-
cations
Source: Renaissance Analysis

17 © Lucent Technologies 2004 - All Rights Reserved
Amer G. El-Nahi
Food for thought:
“One cannot be tentative about this.Excuses like ‘channel conflict’ or ‘marketing and sales aren’t ready’ cannot be allowed. Delay and you risk being cut out of your own market, perhaps not by traditional competitors but by companies you never heard of 24 months ago.”
Jack Welch [07.00/Forbes.com]

18 © Lucent Technologies 2004 - All Rights Reserved
Amer G. El-Nahi
E-Business is a Global business
“A web server in someone's garage has the potential to be the next ‘killer wireless application’ accessible locally, nationally and internationally” . The Internet has become the “poor-man’s” distribution system, accessible via Wired or wirelessly network.

19 © Lucent Technologies 2004 - All Rights Reserved
Amer G. El-Nahi
Food for thought:
“The corporation as we know it, which is now 120 years old, is not likely to survive the next 25 years. Legally and financially, yes, but not structurally and economically.”
Peter Drucker, Business 2.0 (08.00)

20 © Lucent Technologies 2004 - All Rights Reserved
Amer G. El-Nahi
Understanding the operating conditions of 3G and how it differs from 2G
The processes & the methodologies that Telco's developed to rule the Analogue (2G) world have become barriers to the Digital (3G) world.
“Age of the Digital Economy”Is
“Age of Customer Control”

21 © Lucent Technologies 2004 - All Rights Reserved
Amer G. El-Nahi
Food for thought:
The future is not about the BIG that will eat the SMALL, but the FAST that will eat the SLOW.

Thank You!
www.lucent.com
NETWORK COORDINATES POSITIONING FOR PROXIMITY DISCOVERY
ENG KEONG LUA
University of Cambridge, United Kingdom This talk focuses on the introduction of network coordinate techniques and highlighting interesting issues of using network coordinate system as a scalable positioning tool for proximity discovery of nearby nodes in the networks. These novel techniques can be used for scalable and distributed location-based applications and services in wireless and fixed networks. This is a joint research work done at the Intel Research Laboratory, with Dr. Tim Griffin and Dr. Marcelo Pias.
Mobility Conference 2004
1

VISUALIZING INFORMATION ON MOBILE DEVICES
LUCA CHITTARO Human-Computer Interaction Lab (HCI Lab)
Dept. of Math and Computer Science, University of Udine via delle Scienze 206, 33100 Udine, Italy
http://hcilab.uniud.it
People are used to rely on visualizations to better understand problems they have to solve and to take better decisions in less time. Thanks to the continuous increase in power and graphics capabilities of computers, visualization has a growing role in almost every domain of computer applications, ranging from business to medicine, from engineering to science. It is thus natural to think about bringing visualization techniques to mobile devices such as PDAs and mobile phones to harness the power of visualizations anytime, anywhere. Unfortunately, current limitations of mobile devices (such as limited screen size, colors, input peripherals, processing power, storage, bandwidth) make it impossible to follow a trivial porting approach of visualization techniques from desktop PCs and workstations to mobile devices. Moreover, some of these limitations are not likely to disappear in the near future because mobile devices need to remain compact in size. A considerable research effort is thus needed to understand how to design effective visualizations for mobile devices and how to efficiently implement them. This keynote talk will deal with the different aspects of visualizing information on mobile devices. It will discuss what can be visualized and what is worth visualizing on mobile devices. For each class of visualizations it identifies, it will highlight the main current research results and provide specific examples of applications. Indications will be given about how one should proceed in the design of a visualization for the mobile context, considering the different activities involved (selection, mapping, presentation, interaction, evaluation). REFERENCES [1] Alonso D., Rose A., Plaisant C., and Norman K. Viewing Personal History Records: A
Comparison of Tabular Format and Graphical Presentation Using LifeLines. Behavior and Information Technology 17, 5, 1998, 249-262.
[2] Baudisch P., Rosenholtz R. Halo: a technique for visualizing off-screen objects, Proceedings of the CHI 2003 Conference on Human factors in computing systems, ACM Press, New York, 2003, pp. 481-488.
Mobility Conference 2004
1

[3] Bederson, B. B. Fisheye Menus. Proceedings UIST 2000: ACM Symposium on User Interface Software and Technology, ACM Press, New York, 2000, pp. 217-225.
[4] Bederson B.B., Clamage A., Czerwinski M.P., Robertson G.G. DateLens: A fisheye calendar interface for PDAs, ACM Transactions on Computer-Human Interaction, vol. 11, no.1, 2004, pp. 90-119.
[5] Campbell C., Tarasewich P. What Can You Say With Only Three Pixels?, Proceedings of MOBILE HCI 2004: 6th International Conference on Human-Computer Interaction with Mobile Devices, Springer-Verlag, Berlin, 2004.
[6] Card S, Mackinlay J. The Structure of the Information Visualization Design Space. Proceedings of the InfoVis ’97 IEEE Symposium on Information Visualization, IEEE Computer Society Press, Los Alamitos, CA, 1997, pp. 92-99.
[7] Card S.K., Mackinlay J.D., Shneiderman B. Readings in Information Visualization: Using Vision to Think, Morgan Kaufmann, San Mateo, CA, 1999.
[8] Chittaro L. (ed.) Human-Computer Interaction with Mobile Devices and Services, Lecture Notes in Computer Science Vol. 2795, Springer Verlag, Berlin, 2003.
[9] Chittaro L. (ed.) Special Issue on HCI Aspects of Mobile Devices and Services, Personal and Ubiquitous Computing Journal, Vol. 8, No.2, 2004.
[10] Chittaro L. Visualizing the Thematic Update Status of Web and WAP Sites on Mobile Phones, Proceedings of MOBILE HCI 2004: 6th International Conference on Human-Computer Interaction with Mobile Devices, Springer-Verlag, Berlin, 2004.
[11] Chittaro L., Burigat S. 3D Location-pointing as a Navigation Aid for Virtual Environments, Proceedings of AVI 2004: 6th International Conference on Advanced Visual Interfaces, ACM Press, New York, 2004, pp.267-274.
[12] Chittaro L., Burigat S. Location-aware visualization of a 3D world to select tourist information on a mobile device, Proceedings of the 3rd International Workshop on HCI in Mobile Guides, Glasgow, UK, 2004.
[13] Chittaro L., Camaggio A. Visualizing Bar Charts on WAP Phones, Proceedings of MOBILE HCI 2002: 4th International Symposium on Human-Computer Interaction with Mobile Devices, Springer-Verlag, Berlin, 2002, pp. 411-415.
[14] Chittaro L., Dal Cin P. Evaluating Interface Design Choices on WAP Phones: Navigation and Selection, Personal and Ubiquitous Computing Journal, vol. 6, no. 4, 2002, pp. 237-244.
[15] Chittaro L., De Marco L. Driver Distraction Caused by Mobile Devices: Studying and Reducing Safety Risks, Proceedings of the International Workshop on Mobile Technologies and Health: Benefits and Risks, Udine (Italy), 2004.
[16] Chittaro L., Ieronutti, L. A Visual Tool for Tracing Behaviors of Users in Virtual Environments, Proceedings of AVI 2004: 6th International Conference on Advanced Visual Interfaces, ACM Press, New York, 2004, pp.40-47.
[17] Custinne G., Noirhomme M., Chittaro L. Visualisation d’informations boursières sur téléphones mobiles, Proceedings of IHM-2004: 16th Conférence Francophone sur l'Interaction Homme-Machine, ACM Press, New York, 2004.
[18] Dunlop M., Morrison A., McCallum S., Ptaskinski P., Risbey C., Stewart F. Focussed palmtop information access through starfield displays and profile matching, In Crestani F., Dunlop M.,
Mobility Conference 2004
2

Mizzaro S. (Eds.) Mobile and Ubiquitous Information Access, Springer Verlag, Berlin, 2004, pp. 79-89.
[19] Gershon N., Eick S.G., Card S. Information Visualization. ACM Interactions, vol. 5, no. 2, 1998, pp. 9-15.
[20] Gutwin C., Fedak C. Interacting with big interfaces on small screens: a comparison of fisheye, zoom, and panning techniques, Proceedings of Graphics Interface 2004 (ACM International Conference Proceeding Series), A K Peters Ltd., Wellesley, MA, 2004, pp. 145-152.
[21] Hao L. , Xing X., Wei-Ying M. , Hong-Jiang Z. Automatic Browsing of Large Pictures on Mobile Devices, Proceedings of Multimedia 2003: 11th ACM International Conference on Multimedia, ACM Press, New York, 2003, pp. 148-155.
[22] Kray C., Baus J., Cheverst K. A survey of map-based Mobile Guides, In A. Zipf, T. Reichenbacher, L. Meng (Eds.) Map-based mobile services – Theories, Methods and Implementations, Springer-Verlag, Berlin, 2004.
[23] Lipman R.R. Mobile 3D Visualization for Construction, Proceedings of ISARC-2002: 19th International Symposium on Automation and Robotics in Construction, National Institute of Standards and Technology, Gaithersburg, Maryland, 2002, pp. 53-58.
[24] MacKay B., Watters C. The Impact of Migration of Data to Small Screens on Navigation, IT & Society, vol. 3, no. 1, 2003, pp. 90-101.
[25] Mamykina L., Goose S., Hedqvist D., Beard D.V. CareView: Analyzing Nursing Narratives for Temporal Trends. Proceedings CHI 2004: Conference on Human Factors in Computing Systems, Late Breaking Results Volume, ACM Press, New York.
[26] Masoodian M., Budd D. Visualization of travel itinerary information on PDAs. Proceedings of the 5th Australasian User Interface Conference (ACM International Conference Proceeding Series), Australian Computer Society Inc., 2004, pp. 65-71.
[27] Mills, C.B. and Weldon, L.J. Reading text from computer screens. ACM Computing Surveys, vol. 19, no. 4, 1987.
[28] Norman A., Svanteson S., Wiking J. Visual and Interaction Design for 3G Mobile Phone Interfaces, Tutorial Notes distributed at the Mobile HCI 2003 Symposium, 8-11 September 2003, Udine, Italy.
[29] Öquist, G. and Goldstein, M. Towards an improved readability on mobile devices: Evaluating Adaptive Rapid Serial Visual Presentation. Proceedings of Mobile HCI 2002: 4th International Symposium on Human-Computer Interaction with Mobile Devices, Lecture Notes in Computer Science, Springer-Verlag, Berlin, 2002, pp. 225-240.
[30] Plaisant C. The Challenge of Information Visualization Evaluation, Proceedings of AVI 2004: 6th International Conference on Advanced Visual Interfaces, ACM Press, New York, 2004, pp. 109-116.
[31] Powsner S.M. and Tufte E.R. Graphical Summary of Patient Status, The Lancet 344 (August 6, 1994), 386-389.
[32] Randolet F., Chittaro L., Noirhomme M. Visualization of Annual Time Series on PDAs, in preparation, 2004.
Mobility Conference 2004
3

[33] Raubal M., Winter S. Enriching Wayfinding Instructions with Local Landmarks. In: Egenhofer M. J., David M. M. (Eds.), Geographic Information Science, Springer, Berlin, pp. 243-259.
[34] Robbins D.C., Cutrell E., Sarin R., Horvitz E. ZoneZoom: Map Navigation for Smartphones with Recursive View Segmentation, Proceedings of AVI 2004: 6th International Conference on Advanced Visual Interfaces, ACM Press, New York, 2004, pp. 231-234.
[35] Schmidt-Belz B., Hermann F. User validation of a nomadic exhibition guide, Proceedings of MOBILE HCI 2004: 6th International Conference on Human-Computer Interaction with Mobile Devices, Springer-Verlag, Berlin, 2004.
[36] Tarasewich P., Campbell C., Xia T., Dideles M. Evaluation of Visual Notification Cues for Ubiquitous Computing. Proceedings UbiComp 2003, Springer-Verlag, Berlin, pp. 349-366.
[37] Ware C. Information Visualization: Perception for Design, 2nd Edition, Morgan Kaufmann, San Mateo, CA, 2004.
Mobility Conference 2004
4

Mobility Conference 2004
QOS IN NETWORKED ENTERTAINMENT
YUTAKA ISHIBASHI Department of Computer Science and Engineering,
Graduate School of Engineering, Nagoya Institute of Technology
Nagoya 466-8555, Japan
To achieve high quality of networked entertainment (e.g., networked games, networked haptic museums, collaborative work using haptic media, and networked virtual environments with avatars), we have to solve a number of technical problems. For example, network delay jitter and packet loss may bring serious deterioration in media output quality. Therefore, we need to carry out various types of QoS (Quality of Service) control.
QoS over the Internet is grouped into six levels: physical, node, network, end-to-end, application, and user levels. Yutaka Ishibashi will focus on the application-level QoS and the user-level QoS in his presentation. To keep QoS as high as possible in networked entertainment, we carry out QoS control such as traffic control, error control, media synchronization control, causality control, consistency control, and CPU load control.
He will explain these types of QoS control and then propose an adaptive QoS control scheme, which adaptively carries out the types of QoS control together according to the network load and CPU load. By carrying out an experiment of a distributed virtual environment with video avatars, he will demonstrate the effectiveness of the adaptive QoS control scheme in QoS non-guaranteed networks and OS.
He will also emphasize that QoS mapping, which is mapping of QoS parameters between different levels, is needed so as to satisfy QoS requirements by using adequate amounts of network and CPU resources. In a lip-sync experiment, he will clarify the relation between the user-level QoS parameter (i.e., Mean Opinion Score: MOS) and the application-level QoS parameters (e.g., the average frame rate and the mean square error of inter-stream synchronization) by regression analysis. Furthermore, he will address handover problems in wireless networks in terms of media synchronization.
EFFICIENT EXECUTION OF LARGE APPLICATIONS ON PORTABLE AND WIRELESS CLIENTS
PRAMOTE KUACHAROEN*
School of Applied Statistics, National Institute of Development Administration Bangkapi District, Bangkok, 10240, Thailand
VINCENT J. MOONEY III
Associate Professor, School of Electrical and Computer Engineering Adjunct Associate Professor, College of Computing
Georgia Institute of Technology Atlanta, GA 30332, USA
VIJAY K. MADISETTI
Professor, School of Electrical and Computer Engineering Georgia Institute of Technology
Atlanta, GA 30332, USA
Wireless and embedded portable devices, such as cell phones and PDAs, place a premium on storage and communications bandwidth. The communications channel itself is prone to outages as well. However, users are expecting much more capability from these devices, including the ability to run business applications (e.g., Oracle), play video games, and also to perform a variety of business functions. We propose, design, and show results of new technology, called block-streaming, that allows large (in code size) applications to run effectively on wireless and portable devices in memory and bandwidth constrained modes. This technology allows software applications to execute correctly but in a smaller footprint, and interestingly enough with a higher degree of user satisfaction, due to minimization of delays and retransmissions. INTRODUCTION As the availability and use of computing resources become more and more ubiquitous, a scenario where a user utilizes a portable device to download applications from remote servers and executes the downloaded applications is likely to become quite common. Today, such a user would typically have to wait a long time to execute a cutting-edge application which he/she had selected for the first time. This is a problem as users also demand small embedded devices — such as cellular phones and personal digital assistants which have limited resources — to run many applications concurrently. With
* This work was performed when the author was in the Ph.D. program at the Georgia Institute of Technology.
Mobility Conference 2004
1

limited storage resources on the device, keeping all features of all applications loaded in memory may not be possible. A long wait time may be overcome by using a software streaming method [1], [2], [3], [4] which allows the execution of stream-enabled software on a device even while the transmission of software may still be in progress. In other words, the software can be executed while it is being streamed instead of requiring the user to wait for the completion of the entire software’s download. We introduced a software streaming method called “block streaming” in [2]. Block streaming reduces application load time (the amount of time from when the application is selected to download to when the application can be executed). Block streaming can also reduce bandwidth utilization and memory usage since unneeded software code may not be sent to the client devices. However, our initial work does not address the situation where client memory is not sufficient to store all needed code. Furthermore, a large potion of the application code may be executed only once. This application code can be removed from memory to allow needed code and/or data to be streamed to the client device. Therefore, we present a novel method to manage client memory. We apply two techniques, namely, code transformation and stream unit removal to allow an application which is larger than the available memory to be executed as described in the following two sections. CODE TRANSFORMATION In [2], we present a stream-enabled code generation method which divides the program binary image into blocks before generating stream-enabled code. The program binary image is used as it is, without considering other issues such as performance and resources (e.g., memory) available to the program. However, in this section, we introduce techniques which may improve performance and may reduce resource usage by statically transforming the program binary image. Determine Function Boundaries One drawback to dividing a binary image into equally-sized blocks is that some of the code in a particular block may not be used. For instance, consider the case where the first instruction of a function is the last instruction in block. For this case, perhaps only one instruction of the entire block (the last instruction) may be needed if the other function(s) in the block are never called. As a result, memory and bandwidth are not efficiently used. Moreover, when the function is called and the function is not in memory, we have to stream two blocks for the function to work. However, by obtaining the size of each function, the block boundaries can be enforced to more closely match with function boundaries.
Mobility Conference 2004
2
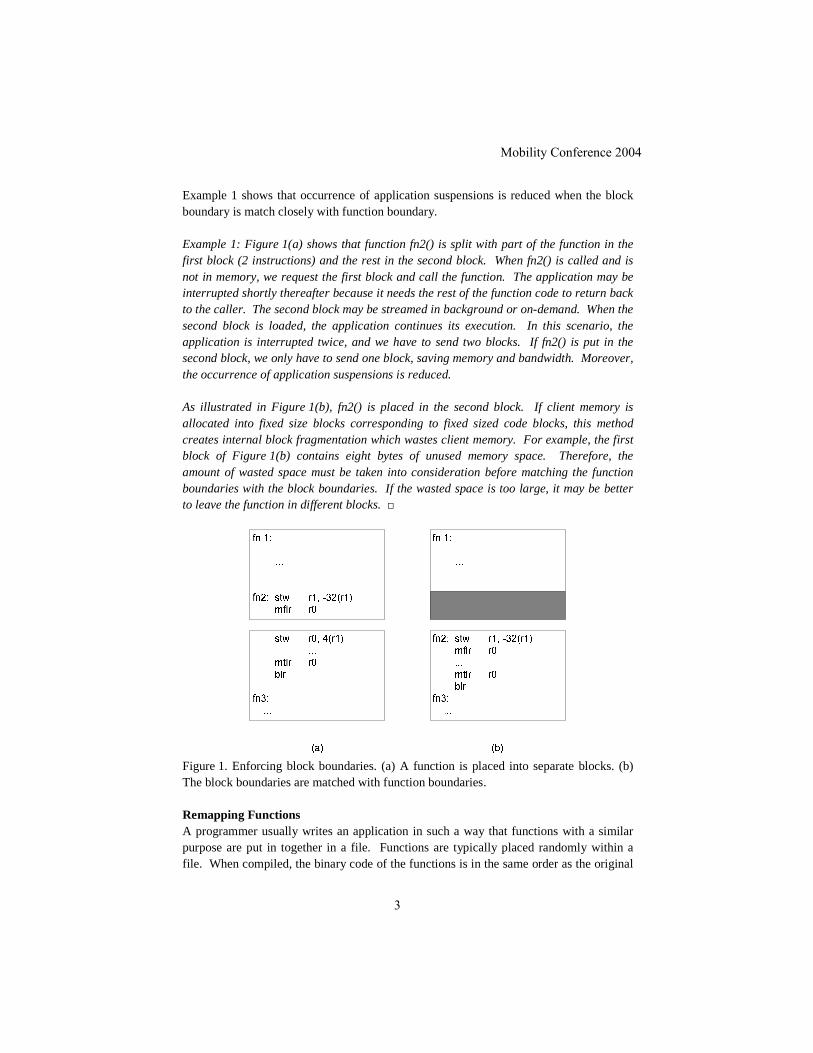
Example 1 shows that occurrence of application suspensions is reduced when the block boundary is match closely with function boundary. Example 1: Figure 1(a) shows that function fn2() is split with part of the function in the first block (2 instructions) and the rest in the second block. When fn2() is called and is not in memory, we request the first block and call the function. The application may be interrupted shortly thereafter because it needs the rest of the function code to return back to the caller. The second block may be streamed in background or on-demand. When the second block is loaded, the application continues its execution. In this scenario, the application is interrupted twice, and we have to send two blocks. If fn2() is put in the second block, we only have to send one block, saving memory and bandwidth. Moreover, the occurrence of application suspensions is reduced. As illustrated in Figure 1(b), fn2() is placed in the second block. If client memory is allocated into fixed size blocks corresponding to fixed sized code blocks, this method creates internal block fragmentation which wastes client memory. For example, the first block of Figure 1(b) contains eight bytes of unused memory space. Therefore, the amount of wasted space must be taken into consideration before matching the function boundaries with the block boundaries. If the wasted space is too large, it may be better to leave the function in different blocks.
Figure 1. Enforcing block boundaries. (a) A function is placed into separate blocks. (b) The block boundaries are matched with function boundaries. Remapping Functions A programmer usually writes an application in such a way that functions with a similar purpose are put in together in a file. Functions are typically placed randomly within a file. When compiled, the binary code of the functions is in the same order as the original
Mobility Conference 2004
3
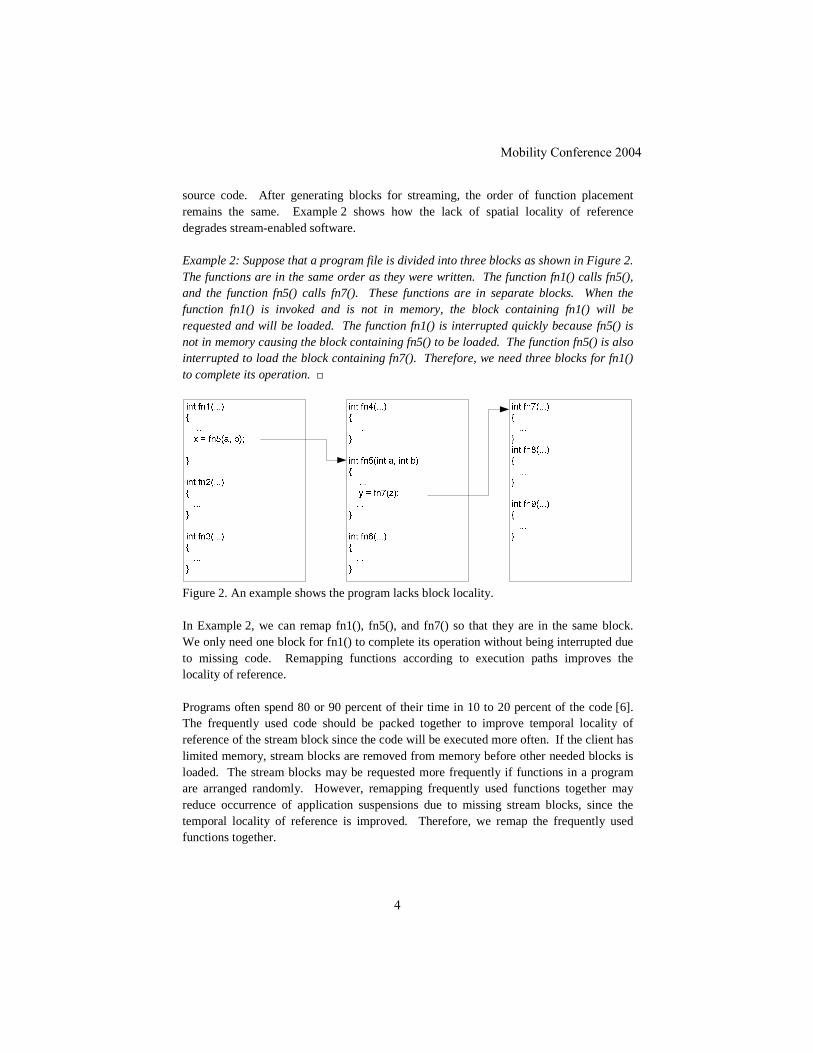
source code. After generating blocks for streaming, the order of function placement remains the same. Example 2 shows how the lack of spatial locality of reference degrades stream-enabled software. Example 2: Suppose that a program file is divided into three blocks as shown in Figure 2. The functions are in the same order as they were written. The function fn1() calls fn5(), and the function fn5() calls fn7(). These functions are in separate blocks. When the function fn1() is invoked and is not in memory, the block containing fn1() will be requested and will be loaded. The function fn1() is interrupted quickly because fn5() is not in memory causing the block containing fn5() to be loaded. The function fn5() is also interrupted to load the block containing fn7(). Therefore, we need three blocks for fn1() to complete its operation.
Figure 2. An example shows the program lacks block locality. In Example 2, we can remap fn1(), fn5(), and fn7() so that they are in the same block. We only need one block for fn1() to complete its operation without being interrupted due to missing code. Remapping functions according to execution paths improves the locality of reference. Programs often spend 80 or 90 percent of their time in 10 to 20 percent of the code [6]. The frequently used code should be packed together to improve temporal locality of reference of the stream block since the code will be executed more often. If the client has limited memory, stream blocks are removed from memory before other needed blocks is loaded. The stream blocks may be requested more frequently if functions in a program are arranged randomly. However, remapping frequently used functions together may reduce occurrence of application suspensions due to missing stream blocks, since the temporal locality of reference is improved. Therefore, we remap the frequently used functions together.
Mobility Conference 2004
4

In order to remap functions, we analyze the application at the function level since the source code may not be available. Then, we create a program call graph which represents the program flow. The binary image is rearranged based on its program call graph to improve spatial locality. Functions which are potentially executed in a proximate time frame will be placed in a proximate memory location. Common functions are also placed in a proximate memory location. After rearranging functions, the stream-enabled application can be generated by dividing the binary image into blocks and generating stream units. A transmission profile of the stream-enabled application is also generated using a profiling approach. STREAM UNIT REMOVAL For a client which has limited memory, removing stream blocks from memory is essential in order to support an application larger than the available memory. When a stream block is received, it is linked to the application. Therefore, when the stream block is removed, it must be unlinked. If the stream block is needed later, it will be requested. Unlinking Mechanism Unlinking is a reverse process of linking. All the branches which jump to the stream block to be removed must be unlinked. Example 3 shows unlinking a block using binary rewriting. Note that we can avoid run-time binary rewriting altogether by not performing run-time code modification. However, the code would not perform efficiently if the branch is taken frequently since stream-enabling code performs code checking and redirects to the proper location. Example 3: Suppose that the client has to deallocate Block 2 in Figure 3(a) to make room for a new stream block. Since the second instruction of Block 1 bne .L3 jumps to Block 2 if the condition is satisfied, we have to modify this instruction to jump to the branch table. When the modified instruction is later executed, Block 2 will be requested if it is not in memory. Figure 3(b) shows Block 1 after Block 2 is removed. The second instruction of Block 1 bne load2_1 is change to load Block 2.
Mobility Conference 2004
5

Figure 3. Unlinking. (a) Block 1 and Block 2 are linked together. (b) Block 2 is unlinked from Block 1. To unlink a stream block, one needs to know all incoming off-block branches (branch instructions that may cause the CPU to execute instructions in different code blocks) to the block to be removed. Therefore, the additional off-branch information includes the number of incoming off-block branches and the branch numbers. Using the branch numbers, we locate the instructions which may jump to the removed block. Then, we modify (unlink) the branches to jump to the corresponding locations in the branch table. Stream Unit Replacement At the server, we create a program flow graph for the application. The client allocates memory to store stream blocks. When the client requests the application, the client sends the maximum number of stream blocks that the client can allocate. The last 16 bits of the service type field is set the maximum number of stream blocks (on-demand stream flow control). The server creates a transmission profile for the application based on the maximum number of stream blocks. The objective is to minimize the number of retransmissions. Therefore, we can create a transmission profile based on an optimal replacement algorithm described in [5]. As a result, a stream block that will not be used for the longest period of time will be replaced first. First, we can apply an optimal replacement algorithm along the predicted program execution path. Then, we can apply the optimal replacement algorithm along other paths. When the program execution is as according to the predicted execution path, the number of retransmission will be minimal if we apply the optimal replacement algorithm. Example 4 illustrates the replacement of stream units. Example 4: Figure 4 shows an example of a transmission profile according to the optimal replacement algorithm for a client with a maximum number of blocks of three. A
Mobility Conference 2004
6

superscript number indicates which stream block to be replaced. If the superscript number is the same as the stream block number, that stream block can be placed in an available memory block. When the client requests the application, the first three stream blocks are sent. Then, the client requests stream block 3, the server sends stream block 3 and advises the client to replace stream block 6, because stream block 6 will not be used until reference 18, whereas stream block 1 will be used at 5, and stream block 2 at 14. Stream block 4 can be sent to replace stream block 2 without waiting for the client request since stream block 2 will not be used until reference 14. When stream block 4 is needed, it will potentially be in memory, reducing occurrence of stream block misses. In the example, if we only requested a single stream block at a time based the optimal replacement algorithm, we would have nine occurrences of stream block misses. However, with block streaming, we can potentially reduce occurrences of stream block misses to six since stream block 1, stream block 2 and stream block 4 are sent without waiting for the request from the client.
Figure 4. A transmission profile is created according to the minimum retransmission policy. EXPERIMENTS AND RESULTS We simulated a scenario where the user utilizes a portable device to download and play a game from a server. We assumed that the program size of 4 MB and the client has only 1 MB available memory. We divided the game into 256 16 KB blocks and the client memory into 64 16 KB blocks. We compared results from block streaming and demand loading. In demand loading, a block is sent when it is needed. Table 1 shows the number of blocks transmitted and occurrences of application suspension for demanding loading and block streaming in a typical execution path of the game application. In this scenario, block streaming can potentially reduce the occurrence of application suspensions by 67.85%.
Mobility Conference 2004
7
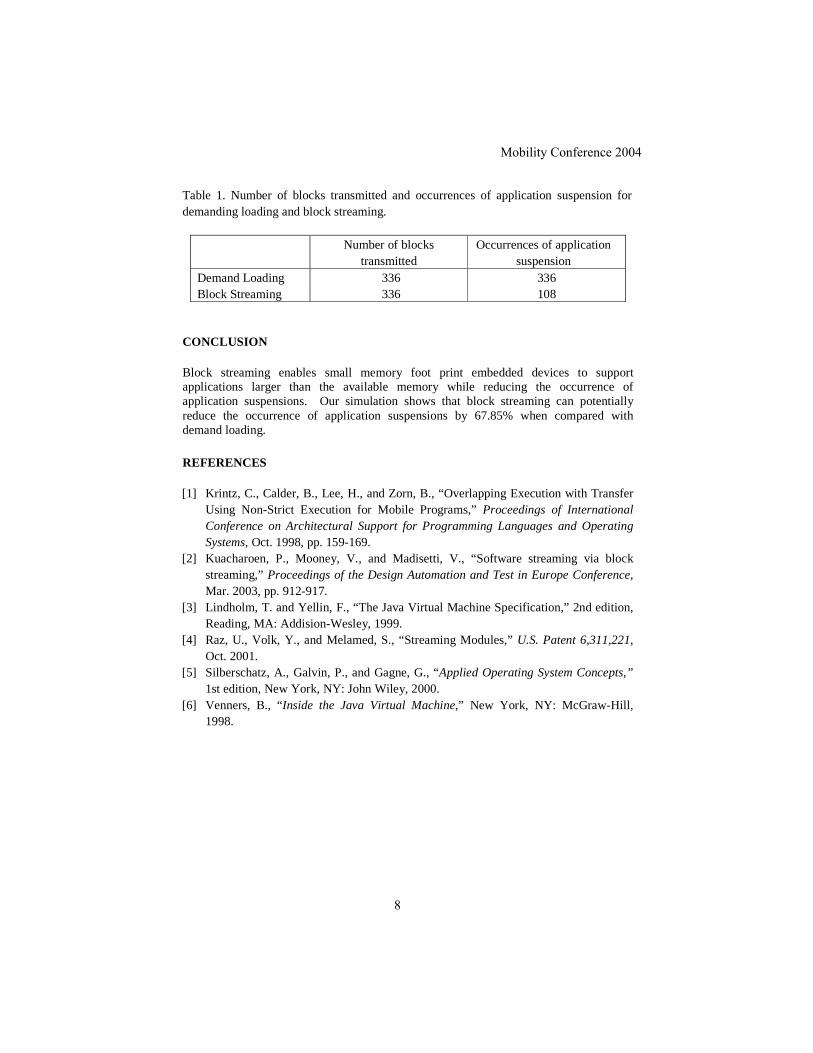
Table 1. Number of blocks transmitted and occurrences of application suspension for demanding loading and block streaming.
Number of blocks transmitted
Occurrences of application suspension
Demand Loading 336 336 Block Streaming 336 108
CONCLUSION Block streaming enables small memory foot print embedded devices to support applications larger than the available memory while reducing the occurrence of application suspensions. Our simulation shows that block streaming can potentially reduce the occurrence of application suspensions by 67.85% when compared with demand loading. REFERENCES [1] Krintz, C., Calder, B., Lee, H., and Zorn, B., “Overlapping Execution with Transfer
Using Non-Strict Execution for Mobile Programs,” Proceedings of International Conference on Architectural Support for Programming Languages and Operating Systems, Oct. 1998, pp. 159-169.
[2] Kuacharoen, P., Mooney, V., and Madisetti, V., “Software streaming via block streaming,” Proceedings of the Design Automation and Test in Europe Conference, Mar. 2003, pp. 912-917.
[3] Lindholm, T. and Yellin, F., “The Java Virtual Machine Specification,” 2nd edition, Reading, MA: Addision-Wesley, 1999.
[4] Raz, U., Volk, Y., and Melamed, S., “Streaming Modules,” U.S. Patent 6,311,221, Oct. 2001.
[5] Silberschatz, A., Galvin, P., and Gagne, G., “Applied Operating System Concepts,” 1st edition, New York, NY: John Wiley, 2000.
[6] Venners, B., “ Inside the Java Virtual Machine,” New York, NY: McGraw-Hill, 1998.
Mobility Conference 2004
8

ACCESS FROM J2ME-ENABLED MOBILE DEVICES TO GRID SERVICES
PIOTR GRABOWSKI, BARTOSZ LEWANDOWSKI
Poznan Supercomputing and Networking Center, [email protected],
[email protected], Noskowskiego 12/14 Poznan, 61-704 Poland
MICHAEL RUSSELL
Max-Planck-Institut für Gravitationsphysik, [email protected], Golm, Germany
The article examines the problem of giving the Grid users a possibility to access
their applications and resources from any place using mobile devices. According
to our approach the devices are incorporated as the clients of Grid services.
Moreover, because of limitations of mobile devices this approach assumes
adopting a gateway between the client and the Grid. These limitations forced us
to pay special attention to building flexible user interfaces as well.
The paper also contains a description of several specialized mobile-oriented
Grid services and the roles of a mobile client and gateway played in this
services.
Finally, the document deals with issues related to obstacles and limitations that
we have faced according to the chosen J2ME technology, and the ways we
solved them.
ACCESS FOR MOBILE USERS IN GRID ENVIRONMENT
Grids and GridLab project introduction
The GridLab project is funded by the European Commission under the Fifth Framework
Programme of the Information Society Technology, contract number IST-2001-32133
(see http://www.gridlab.org/).[1]. The GridLab project is developing an easy-to-use,
flexible, generic and modular Grid Application Toolkit (GAT), enabling today’s
applications to make innovative use of global computing resources. The project is
grounded by two principles, the co-development of infrastructure with real applications
and user communities, leading to working scenarios, and dynamic use of grids, with self-
aware simulations adapting to their changing environment. Grid Computing is an exciting
buzzword in the computing world today. The GridLab project defines it to mean the
exploitation of a varied set of networked computing resources, including large or small
computers, PDAs, file servers and graphics devices. The networks could be anything
from high speed ATM to wireless or modem connections. Exploiting these connected
resources could, for example, enable large scale simulations not possible on a single
supercomputer, aid computational work of geographically distributed collaborations,
Mobility Conference 2004
1
simplify remote use of machines, and enable the new dynamic application scenarios the
GridLab project proposes.
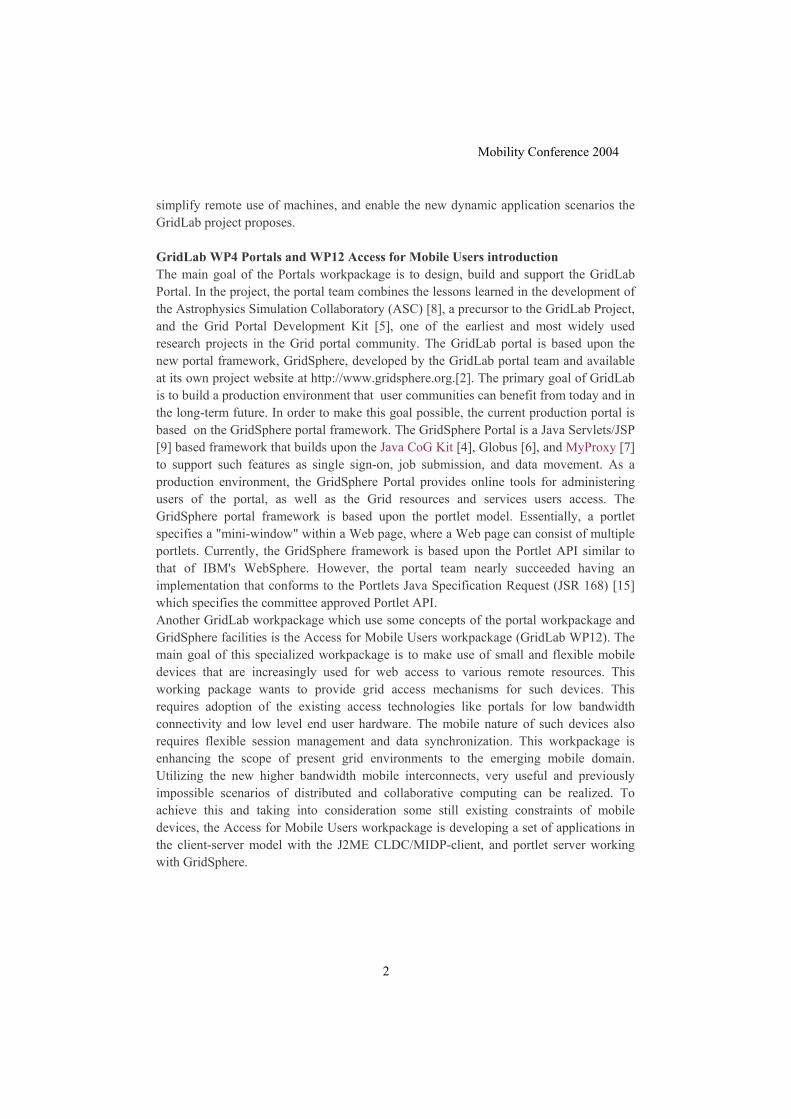
GridLab WP4 Portals and WP12 Access for Mobile Users introduction
The main goal of the Portals workpackage is to design, build and support the GridLab
Portal. In the project, the portal team combines the lessons learned in the development of
the Astrophysics Simulation Collaboratory (ASC) [8], a precursor to the GridLab Project,
and the Grid Portal Development Kit [5], one of the earliest and most widely used
research projects in the Grid portal community. The GridLab portal is based upon the
new portal framework, GridSphere, developed by the GridLab portal team and available
at its own project website at http://www.gridsphere.org.[2]. The primary goal of GridLab
is to build a production environment that user communities can benefit from today and in
the long-term future. In order to make this goal possible, the current production portal is
based on the GridSphere portal framework. The GridSphere Portal is a Java Servlets/JSP
[9] based framework that builds upon the Java CoG Kit [4], Globus [6], and MyProxy [7]
to support such features as single sign-on, job submission, and data movement. As a
production environment, the GridSphere Portal provides online tools for administering
users of the portal, as well as the Grid resources and services users access. The
GridSphere portal framework is based upon the portlet model. Essentially, a portlet
specifies a "mini-window" within a Web page, where a Web page can consist of multiple
portlets. Currently, the GridSphere framework is based upon the Portlet API similar to
that of IBM's WebSphere. However, the portal team nearly succeeded having an
implementation that conforms to the Portlets Java Specification Request (JSR 168) [15]
which specifies the committee approved Portlet API.
Another GridLab workpackage which use some concepts of the portal workpackage and
GridSphere facilities is the Access for Mobile Users workpackage (GridLab WP12). The
main goal of this specialized workpackage is to make use of small and flexible mobile
devices that are increasingly used for web access to various remote resources. This
working package wants to provide grid access mechanisms for such devices. This
requires adoption of the existing access technologies like portals for low bandwidth
connectivity and low level end user hardware. The mobile nature of such devices also
requires flexible session management and data synchronization. This workpackage is
enhancing the scope of present grid environments to the emerging mobile domain.
Utilizing the new higher bandwidth mobile interconnects, very useful and previously
impossible scenarios of distributed and collaborative computing can be realized. To
achieve this and taking into consideration some still existing constraints of mobile
devices, the Access for Mobile Users workpackage is developing a set of applications in
the client-server model with the J2ME CLDC/MIDP-client, and portlet server working
with GridSphere.
Mobility Conference 2004
2

PROJECT DEVELOPMENT
Grid services introduction
During the first months of the project duration, the WP12 team collected end-user
requirements regarding access to the grid and grid environment itself. In case of typical
grid application the mobile developer is faced with a large amount of data and heavy
weight protocols that are used in connection between entities in the grid. In fact the data
amount with some kind of scientific applications is a number in petabytes – this is true
that only a fraction of it (numbers in megabytes) has to be presented to the user in a form
of visualization for example. However, even in this case it is not possible to use the
service by the mobile side as it is. There is no need to send the data that simply can not be
utilized on the opposite side through the network. Additionally, the services in the
GridLab project are developed in a form of web-service using OGSA Grid Security
Infrastructure [11], Transport Layer Security (HTTPG) [12] which is secure and
straightforward. However, it requires much processor power.
Grid requirements and Mobile weaknesses
An additional requirement that was issued (besides using Web Services and secure client
on the mobile side to talk with grid-services), is the need to enable some offline practice
on the mobile side – in fact the mobile client should allow the end-user to work with
limited functionality, even when explicitly off-line. Taking into consideration the above
wishes, together with well-known mobile devices restrictions like limited memory, low
screen resolution and colors, insufficient processor power, low network bandwidth and its
intermittence, together with limited input possibilities, we decided to make use of those
days newly emerged technology: Java 2 Platform, Micro Edition (J2ME) [10]. Although
it suits our needs best, it still has/had some limitations. Java CLDC/MIDP 1.0 offers as
standard only HTTP, the MIDP 2.0 version which provides HTTPS is not widely used
(too few compliant devices yet). The 3-rd parties solution for webservices and SSL that
we tested, even those light weight, were too heavy for simpler devices (the problems are
connected mainly with memory shortages, suit size limitations and WAP [13]
gateways/GSM providers policies).
Mobile Command Center – the gateway to the Grid
The aforementioned problems have convinced us to develop a gateway on the server side,
which is working with other grid services. It is serving only the needed data in a form and
size suitable for weaker devices, securing only the most important data. In our approach it
is the Mobile Command Center - a web application working under GridSphere and acting
for mobile devices as a gateway into the grid. Although the main problem seem to be
solved, we still have some problems to overcome. One of the examples could be finding
the most suitable keyboard mapping for a maximally wide range of devices. The main
aspect of the problem is the need for custom keyboard mapping for each device group,
without versioning of the Midlet application for each device. One of the possible
Mobility Conference 2004
3
solutions for a sophisticated user could be the possibility for remapping the keyboard to
suit his/her needs best. However, this solution can not be applied to programs used by a
broad community; it still can help the most experienced users (who in fact our users are).
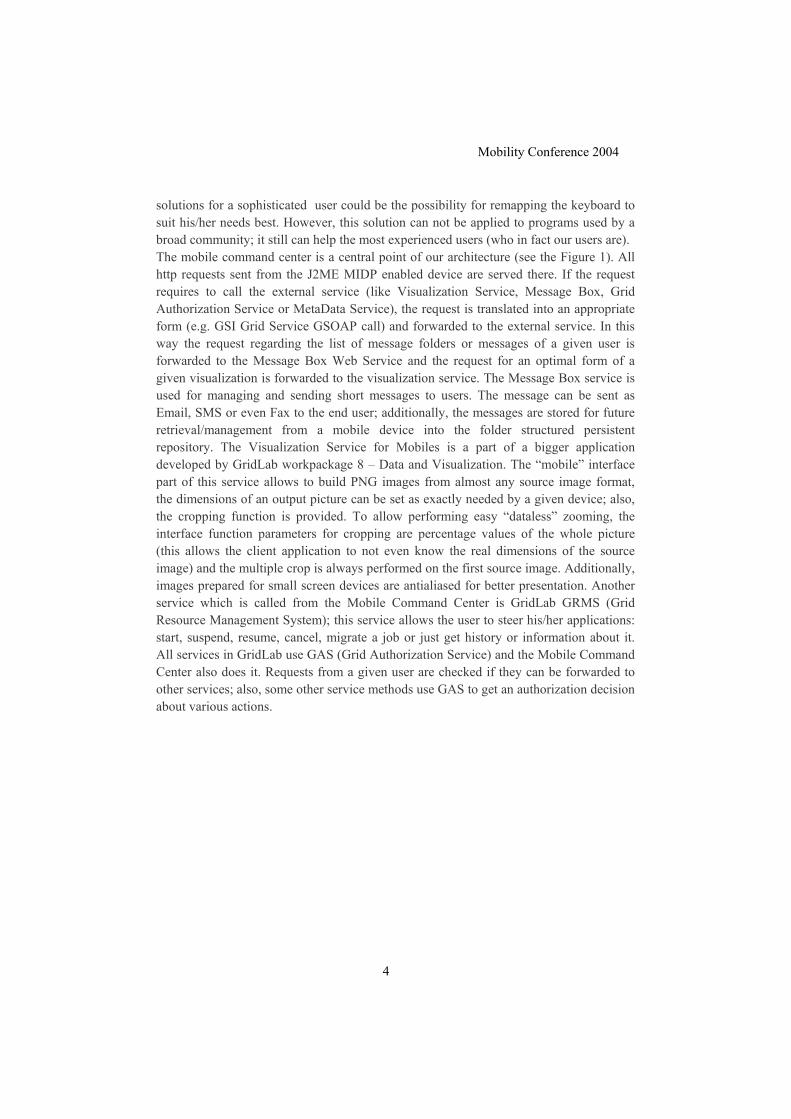
The mobile command center is a central point of our architecture (see the Figure 1). All
http requests sent from the J2ME MIDP enabled device are served there. If the request
requires to call the external service (like Visualization Service, Message Box, Grid
Authorization Service or MetaData Service), the request is translated into an appropriate
form (e.g. GSI Grid Service GSOAP call) and forwarded to the external service. In this
way the request regarding the list of message folders or messages of a given user is
forwarded to the Message Box Web Service and the request for an optimal form of a
given visualization is forwarded to the visualization service. The Message Box service is
used for managing and sending short messages to users. The message can be sent as
Email, SMS or even Fax to the end user; additionally, the messages are stored for future
retrieval/management from a mobile device into the folder structured persistent
repository. The Visualization Service for Mobiles is a part of a bigger application
developed by GridLab workpackage 8 – Data and Visualization. The “mobile” interface
part of this service allows to build PNG images from almost any source image format,
the dimensions of an output picture can be set as exactly needed by a given device; also,
the cropping function is provided. To allow performing easy “dataless” zooming, the
interface function parameters for cropping are percentage values of the whole picture
(this allows the client application to not even know the real dimensions of the source
image) and the multiple crop is always performed on the first source image. Additionally,
images prepared for small screen devices are antialiased for better presentation. Another
service which is called from the Mobile Command Center is GridLab GRMS (Grid
Resource Management System); this service allows the user to steer his/her applications:
start, suspend, resume, cancel, migrate a job or just get history or information about it.
All services in GridLab use GAS (Grid Authorization Service) and the Mobile Command
Center also does it. Requests from a given user are checked if they can be forwarded to
other services; also, some other service methods use GAS to get an authorization decision
about various actions.
Mobility Conference 2004
4

Figure 1. Information exchange between entities in GridLab – part affected by WP12
Access for Mobile Users workpackage activities.
All of the aforementioned services can be accessed from a mobile device via the Mobile
Command Center. On the mobile side there is the J2ME MIDP 1.0 enabled device which
is running our GridLab Mobile Client Midlet application. You can see what it looks like
in the following figures (see Figure 2-5).
Figure 2. Example screen shots with GridLab Mobile Clients – Nokia 7210 MIDP SDK
v1.0 emulator.
Mobility Conference 2004
5

The client is a multithreaded Java application which sends HTTP requests to the server
and displays responses in an appropriate way. To avoid authenticating the user with each
request, there is a session maintaining (with cookies) implemented in our midlet. All
typed data is stored in RMS record stores to avoid frequent retyping. After login to the
server the user can choose which service he/she is going to use, choosing entries from the
menu (e.g. displaying folders from the Message Box, Showing Visualization Service
visualizations or displaying the list of user jobs managed by GRMS). There is a
possibility to automatically parse messages for URLs with visualizations – the user does
not have to type anything in this case. An application after finishing some tasks can send
the information about it via the Message Box – the user gets this information as an SMS
and using our client can browse his/her messages, choose the message he/she is interested
in, and display the message. If the message contains information about visualizations, the
user is notified about it and can display one of them with the client. If the visualization
consists of more than one image, the navigation slider is displayed and the user can
choose which ‘frame’ of visualization he/she wants to display. Each visualization frame
can be cropped and zoomed. The zoom operation can be repeated numerous times, in this
case the crop operation is always performed on the source image not currently displayed
on the device – this allows us to prevent data loss (the source images are high resolution
– even 1000% zoom on 100 by 100 pixel screen are clear and can be easily read by the
user). The cropping procedure is also user-friendly – a resizable image sub-frame is
displayed, the user can move it over the picture, resize the frame if needed and request
the needed part of the picture with one key press, and the sub-picture is automatically
enlarged to the device screen resolution.
Another part of the GridLab Mobile Client is connected with the GRMS service. The user
can display a list of currently running jobs, start the job or cancel, suspend, migrate or
resume the existing jobs. There is also a possibility to display job information or history.
Mobility Conference 2004
6
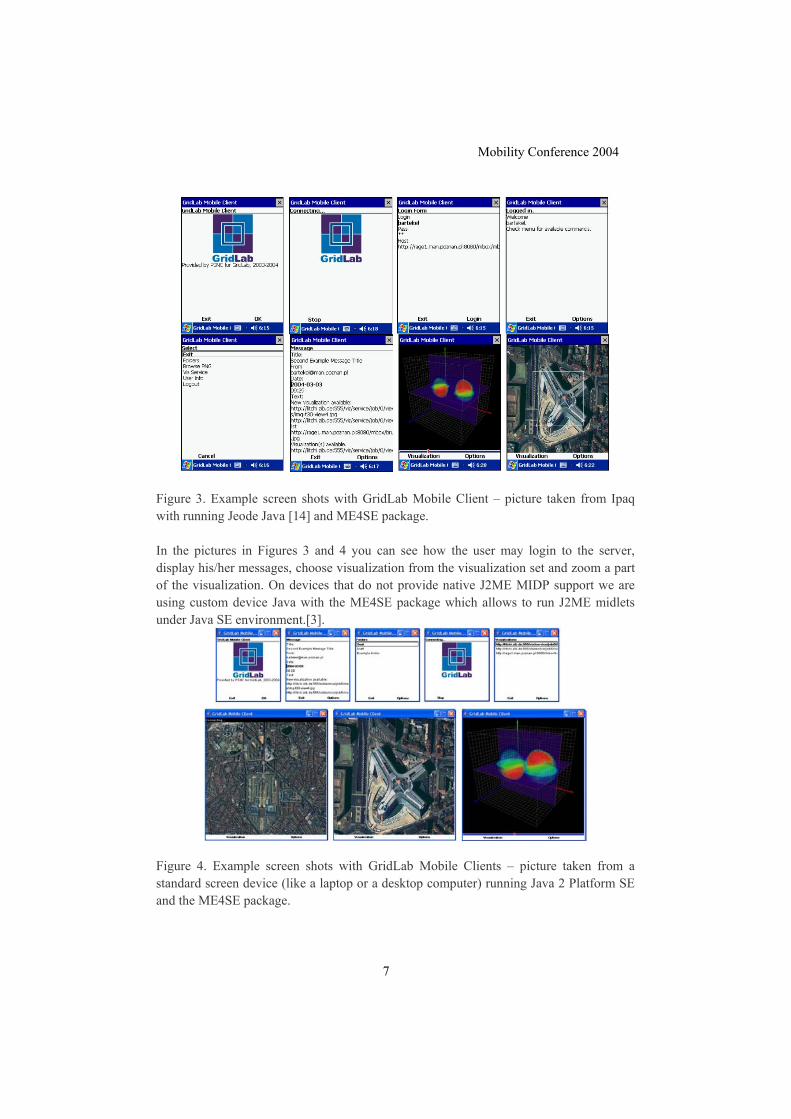
Figure 3. Example screen shots with GridLab Mobile Client – picture taken from Ipaq
with running Jeode Java [14] and ME4SE package.
In the pictures in Figures 3 and 4 you can see how the user may login to the server,
display his/her messages, choose visualization from the visualization set and zoom a part
of the visualization. On devices that do not provide native J2ME MIDP support we are
using custom device Java with the ME4SE package which allows to run J2ME midlets
under Java SE environment.[3].
Figure 4. Example screen shots with GridLab Mobile Clients – picture taken from a
standard screen device (like a laptop or a desktop computer) running Java 2 Platform SE
and the ME4SE package.
Mobility Conference 2004
7

As one can see, our work for PSNC and GridLab on Mobile Appliances is highly
dependant on collaboration with other institutions (like HP/Compaq or SUN) and we
make an extensive use of solutions provided by our consortium partners (GridSphere,
GRMS, Visualization Service) and external community/companies (ME4SE). However,
such strong dependence can cause many problems during development, we are strongly
encouraged to do it as it is the only way not to ‘reinvent the wheel’ and give our users the
best tool we can provide to access the Grid from a mobile device.
REFERENCES
[1] GridLab project participants, http://www.gridlab.org.
[2] Russell M., Novotny J., Wehrens O., "GridSpher", http:// www.gridsphere.org.
[3] Michael Kroll and Stefan Haustein, "ME4SE", http:// www.me4se.org, (2003).
[4] Java CoG Kit, http://www-unix.globus.org/cog/
[5] Grid Portal Development Kit, http://doesciencegrid.org//projects/GPDK/
[6] Globus, http://www.globus.org/
[7] MyProxy, http://grid.ncsa.uiuc.edu/myproxy/
[8] Astrophysics Simulation Collaboratory, https://www.ascportal.org/
[9] Java Servlets/JSP, http://java.sun.com/products/servlet/index.jsp
[10] Java 2 Platform, Micro Edition (J2ME), http://java.sun.com/j2me/
[11] OGSA Grid Security Infrastructure, http://www.cs.virginia.edu/~humphrey/ogsa-
sec-wg/
[12] Transport Layer Security (HTTPG), http://www-
unix.globus.org/toolkit/3.0/ogsa/docs/transport_security.html
[13] WAP, http://www.wapforum.com/
[14] Jeode, JVM Implementation of PersonalJava and EmbeddedJava Specifications,
http://www.insignia.com/
[15] Portlets Java Specification Request (JSR168),
http://www.jcp.org/en/jsr/detail?id=168, http://www.jcp.org/en/jsr/detail?id=168
Mobility Conference 2004
8

MOBILE COMPUTING WITH PERSONAL AREA NETWORK AND HUMAN POWER GENERATION
LEE SHANG PING, ADRIAN DAVID CHEOK
Department of Electrical & Computer Engineering, National University of Singapore, 10 Kent Ridge Crescent
Singapore, 119260
For mobile computing system such as wearable computer, one of the most critical hardware issues is the provision of electric power. Various different sources of power for wearable computer have been investigated; however we are interested only in power that can be generated “in-situ”, such as human power. This paper describes a novel mean of multiple source human power generation for small wearable electronic devices, and then demonstrates the digital information transfer between wearable computing devices by using human skin as “antenna”.
There are a wide range of peripheral devices in a mobile computing system, such as sensors and identification memory tags. As the amount of such devices increases in a mobile computing design, there is a need for these devices to communicate efficiently with the central processing unit. Also, it is highly desirable that these devices could be conveniently connected to the wearable computer without many dangling wires. We developed a personal area network (PAN) system which attempts to interconnect such devices, and at the same time uses human body as communication channel. This system is in a way novel because it is totally powered by human motion.
INTRODUCTION We are living in an era where mobile and portable electronic devices are essential to our daily lives. Also, with the advance in wearable computing, wearable electronic devices are rapidly advancing and decreasing in size. Recent advances in semiconductor and material technology has caused the power consumption of electronic devices to be greatly reduced. With the aid of better power management technology, it is not impossible to provide alternative yet efficient “in-situ” power source other than battery for these wearable devices. It is our objective to present here alternative and multiple power sources for wearable mobile computing devices. There are several works on alternative power source for low power devices. Harvesting power from human movement is a more prominent one. Starner discussed in [1] the energy storing and expending ability of the human body to demonstrate the potential of the human body as an energy supply. It was revealed that while a 68 kg human walks at
Mobility Conference 2004
1

the speed of two steps per second, the limb motion generates about 67 W of power [2]. It is highly desirable that some useful energy could be harvested from human walking motion. We now discuss some related works on such human power harvesting methods. In [3], piezoelectric ceramic material is used in the sole of the shoe to produce electrical energy when the shoe is worn by a human who perform the walking motion. A single lead zirconate titanate (PZT) piezoelectric ceramic “unimorph” is inserted into the sole of the shoe. When under continual compression and decompression, the PZT produces electrical potential across the unimorph’s terminals. It was shown that with a brisk walk, the piezoelectric shoe was able to generate 1.8 mW of power when a load of 250 kΩ. In the same paper, a simple shoe-mounted rotary magnetic generator was also built to demonstrate again how human walking motion can be turned into useful energy. Another novel method of harvesting human power is the use of vibration when the body moves. A self-powered digital signal processing system had been developed using a moving coil electromagnetic transducer as a power generator [4]. As the transducer is vibrated, the coil vibrates and cuts through a magnetic field projected by a stationary permanent magnet. Calculations show that power on the order of 400 µW could be generated. The test DSP chip integrates an ultra-low power controller to regulate the generator voltage. The entire system consumes 18 µW of power, which the vibration power generator is more than capable of supplying. There are several advantages and disadvantages associated with each of the alternative power source mentioned above. Table 1 lists some of them. Table 1. Comparison of various alternative power sources for mobile computing devices
Advantages Disadvantages Piezoelectric shoe Unobtrusive User has to continuously walk
to generate or store energy Vibration-based generator
Simple, can be attached to most parts of human body
User has to continuously move the body to generate or store energy
It can be seen that each of these devices on their own has various advantages and disadvantages. However a single device on its own will not be efficient for use all the time. For example the piezoelectric shoe may generate energy when the person is walking, but not when she is sitting down. Whereas the vibration devices may generate energy even when the person is just standing up or sitting down, as these can be placed on the arms.
Mobility Conference 2004
2

Hence to overcome individual advantages and disadvantages of these power sources for wearable computer, this research is about providing the first compact yet multiple source power modules for wearable mobile computing and the peripheral devices. Figure 1 depicts a human with a wearable computer system, and the various power-producing devices attaching to his body. The piezoelectric materials are embedded into his shoes, and the vibration power generators are attached to the limbs, chest and back of the body. Since the energy is coming from different sources and are of different magnitude, a central power storage and conversion module has to be built. A large capacitor is used to store the energy generated by all the sources. Figure 2 shows the block diagram of such central power converter. The voltage of each source is first rectified, and then the current is used to charge a large common storage capacitor. As the charge across the capacitor builds up and the voltage across it reaches a threshold, the regulator regulates it to different level of dc voltage. Figure 1. Power-producing devices attached to various parts of the human body. PAN device is used as a communication device.
Mobility Conference 2004
3

Figure 2. Block diagram of central power converter. We also develop an application of the multiple power sources. A Personal Area Network (PAN) system is presented to demonstrate how two unconnected wearable electronic devices could exchange digital information when the users who wear them come close or are in physical skin contact with each other. The transmitter is capacitively coupled to the receiver through human body and “earth ground”, which includes all conductors and dielectrics in the environment [5]. PIEZOELECTRIC SHOE Piezoelectric materials produce electrical charges when mechanical pressure is applied to them. Piezoelectric ceramics made of polycrystalline ferroelectric materials such as lead zirconate titanate (PZT) is one such material with better charge-producing property. In this section we describe how natural human walking movement could unleash this feature to power a wearable device embedded in a shoe, and provide detailed experimental evaluation. Material and construction The piezoelectric sheet we used consists of a piece of stainless steel and multilayer aluminum and PZT. The individual material layers are held together in a “sandwich like” package using high temperature polyimide adhesive [6]. Shown in Figure 3, the composite is bonded to a curve-shape spring stainless steel sheet. We constructed a PZT “bimorph” by riveting two piezoelectric ceramic sheets to a beryllium copper plate. In this way, the two piezoelectric ceramic sheets are electrically connected in parallel, since their spring stainless steel sheets are electrically connected via the copper plate. The assembly is then cut into the shape of shoe insole, as shown in Figure 4, and finally inserted into the shoe. When the “piezoelectric shoe” is worn and compressed by the foot hitting the ground, the top and bottom piezoelectric ceramic sheets are forced to lay flat against the copper plate, and springs back when the foot pressure is relieved. It is this compression-decompression that causes the piezoelectric ceramic sheets to generate electrical energy.
Mobility Conference 2004
4

Harvesting power from piezoelectric shoe We studied the power output of the piezoelectric shoe (worn on the foot, walking motion) by connecting a load resistor across its two lead terminals, and measuring the voltage drop across the load resistor. Figure 5 show the voltage and power waveforms across a resistor of 660 kΩ, with a walking frequency of around one step every second. From the graphs, it can be seen that the negative voltage waveform is greater in magnitude than that of a positive voltage waveform. This is due to the fact that the piezoelectric sheets have been pre-stressed in a curved shape. When the shoe lands on the ground, the piezoelectric sheet is forced flat against the insole cushioning and when the shoe is lifted off the ground, the spring stainless steel spring back to the original curved shape (because it is a pre-stress spring metal) at a speed much faster than when it is forced flat. Hence the higher speed of decompression caused the voltage produced to be larger. Also the voltage and power waveforms across a resistor of 660 kΩ with different walking speed are also measured, and the results are tabulated in Table 2. It can be seen that as the walking speed increases, the RMS power delivered to the load resistor also increases. This should be the case because a human consumes more power when his walking speed is faster. At one step per second, the average and RMS power delivered to the resistor is 6.99 mW and 11.1 mW, respectively. Figure 3. Piezoelectric ceramic sheet Figure 4. The shoe insole with PZT bimorph inserted.
Wire leads
Spring stainless
steel
PZT ceramic
shoe sole
Piezoelectric bimorph
Mobility Conference 2004
5

Figure 5. Power and voltage waveform across a 660 kΩ resistor. Table 2. Power and voltage across 660 kΩ resistor at different walking speed. Comparing previous studies in [3], in which only a single piezoelectric ceramic is used (unimorph, smaller in size too), at a brisk walking speed of one step per second, the average power delivered to a 250 kΩ is only 1.8 mW. VIBRATION-BASED GENERATOR The idea of vibration-based energy generator is based on the principle of electromagnetic induction. Faraday’s law states that the potential difference induced across the ends of a coil of wire is equal to the time rate of change of the magnetic flux through that coil of wire. We constructed a wearable device which, when vibrated, generates electrical energy. This vibration device can be conveniently worn on body and could power small wearable electronic device. Material and construction We have constructed a cylindrical hollow tube made from plastic, measuring 77 mm in length. The inner diameter of the tube is 11 mm while the outer diameter is 15 mm. The tube is wound with high-density wire (diameter 0.08 mm) at the center, around its circumference. The longitudinal length of the wire coil is about 1/5 of the total length of
Walking Speed (Hz)
Peak Voltage
(V)
Peak Power (mW)
Average Power (mW)
RMS Power (mW)
0.5 91.6 21.4 4.31 6.81 1 97.9 33.3 6.99 11.1
2.5 133.3 31.1 12.3 14.6
0 0.5 1.0 1.5 2.0 2.5 3.0 3.5 4.0 4.5 5.0Time (s)
Vol
tage
acr
oss
load
resi
stor
(V)
0
-50
-100
-150
-200
100
50
200
150
Pow
er d
issi
pate
d by
load
resi
stor
(mW
)
0
45.0
22.5
90.0
67.5voltagepower
Mobility Conference 2004
6

the plastic barrel. A neodymium disc magnet (diameter 10 mm, thickness 5 mm) is inserted into the barrel and it is free to move longitudinally within. At each end of the tube is a plastic cap fitted with smaller neodymium disc magnet (diameter 3 mm, thickness 1 mm), which is arranged in such a way to repel the disc magnet inside the tube. Figure 6 shows the cross-section of the tube. The disc magnet is suspended within the barrel by the smaller magnets, which make it easy to vibrate in the longitudinal direction of the barrel when worn on the body. Notice the two wire leads from the coil that has a potential difference when the coil cuts through changing magnetic field. Figure 6. Cross section of vibration barrel. PERSONAL AREA NETWORD (PAN) DEVICE FOR MOBILE COMPUTING A mobile computing application is developed to demonstrate the use of human power. A Personal Area Network (PAN) is presented to demonstrate how two unconnected wearable electronic devices could exchange digital information when the users who wear them come close or are in physical skin contact with each other. The transmitter is capacitively coupled to the receiver through human body and “earth ground”, as shown in Figure 7, which includes all conductors and dielectrics in the environment [5]. The PAN device is completely power by human power as mentioned before. The PAN circuit is shown in Figure 8. Figure 7.Personal Area Network system
Mobility Conference 2004
7

Figure 8. The PAN transmitter (left) and receiver (right). CONCLUSION We have successfully examined and built a multiple source power module for wearable computer system application – the Personal Area Network. This central power converter consists of novel power generating methods, namely piezoelectric ceramic sheets which are made into shoe, and vibration-based generator which can be attached to the limbs of the body. Each has its own advantages and disadvantages. For example piezoelectric shoe works only while the user is walking; the vibration devices generate energy when she is sitting or standing. We combined them in a system so that they compliment each other to produce total power. A low power mobile computing application, called Personal Area Network, was then built and powered by this power source. This paper has successfully demonstrated that low power mobile computing device can be powered “in-situ” by human body movement. In the future as computing devices get smaller in terms of size and power consumption, such power generation method can be widely used. REFERENCES [1] Starner, T., “Human-power wearable computing”, in IBM Systems Journal, vol. 35,
pp. 618-629, 1996. [2] Braune, W., and Fisher, O., “The Human Gait”, Springer-Verlag, Berlin, 1987. [3] Kymissis, J., Kendall, C., Paradiso, J., and Geershenfeld, N., “Parasitic power
harvesting in shoes”, in 2nd ISWC, IEEE, pp. 132-139, 1998. [4] Amirtharajah, R., and Chandrakasan, A.P., “Self-powered signal processing using
vibration-based power generation”, in IEEE Journal of solid state circuits, 1998. [5] Zimmerman, T.G., Personal Area Networks (PAN): Near-Field Intra-Body
Communication, M.S. thesis, MIT Media Laboratory, Cambridge, MA, September 1995.
[6] Product Information, THUNDER Actuators and Sensors, FACE International Corp., Norfolk, VA.
Mobility Conference 2004
8

Mobility Conference 2004
BANGKOK TRAIN SYSTEM NETWORK (BTSNET): MODEL AND USAGE OF REGULAR TRAFFIC PATTERNS IN BANGKOK FOR
MOBILE AD HOC NETWORKS AND INTER-VEHICULAR COMMUNICATIONS
SURASEE PRAHMKAEW AND CHANINTORN JITTAWIRIYANUKOON
Department of Telecommunications Science
Faculty of Science & Technology Assumption University, Bangkok 10240, Thailand
[email protected] , [email protected] This paper explores an alternative approach to implement regular traffic patterns provided by the public transportation to improve the performance of Mobile Ad Hoc Networks (MANET) for Inter-vehicular communication systems (IVCS) in Bangkok. Since Ad Hoc networks consist of mobile nodes that are random and unpredictable, IVCS can provide drivers and passengers with a range of services. The implementation of IVCS could be possible using MANET. BTSnet is introduced to overcome the drawbacks of using BUSNet, FleetNet, IVCS and CarNet in Bangkok, which results in irregular traffic, speed, and performance degradation. The results are obtained from NS-2 simulations in a suggested BTS-Train scenario that attempts to simulate the traffic situation in the geographical area of BTS system in Bangkok. BTSnet is an approach which utilizes the deterministic nature of train routes to incorporate a mobile backbone infrastructure that improves the performance of IVCS using MANET. INTRODUCTION Inter-vehicular communication systems are gaining much interest in the automotive industry as they could potentially provide the drivers with many services including location based applications, providing information concerning localized real-time traffic conditions, parking information, vehicle to vehicle chats, etc. Examples of applications and implementations of IVCS had been shown in BUSnet[1], CarNet[2], etc. In order to implement IVCS, low power radio transceivers are placed on board the vehicles. These transceivers interact with each other in an Ad Hoc fashion forming a MANET using routing algorithm like DSR[3], AODV[4], etc to provide the route discovery, route maintenance and the transfer of data packets. While these routing protocols seem to work well in scenario where nodes are basically random and mobile, the same could not be applied to IVCS as vehicular travel is often restricted by the road and the traffic patterns. In such a city as Bangkok[5] where the traffic jams present critical problems, BUSNet, CARnet, and FleetNet provided the performance degradation and irregular traffic because of unpredictable times the vehicular traffic moves on the road. However, some traffic patterns have been observed to be regular and deterministic. These patterns are
1

Mobility Conference 2004
created by public transportation services that travel, in most cases on fixed routes at regular known intervals. BTSnet would be an alternative model to explore the effects of these regular patterns in our simulation and its significant improvement to the performance of MANET used in IVCS. Criteria for Measuring Performance There exists a few matrices that can be used to gauge the performance of MANET based on simulations of the network on the NS-2 Network simulator.
• Data Delivery Percentage This represents the total number of packets delivered over the total number of
packets sent. In this paper, the performance of the network would be based on data delivery percentage that is the main point of interest which shows the reliability and robustness of the work used in IVCS. The general assumption used is that as long as data can be successfully transmitted from the source vehicle to destination vehicle, the delays and overheads would not affect the vehicular application. SCOPE OF NS-2 SIMULATOR For the NS-2 simulation, nodes was set to 100 as maximum. Some of them would be traveling at an arbitrary speed of 5m/s to 20 m/s until they reach the destination and the nodes would pause for 0 to 20 seconds before they select another random destination and speed. The other nodes would be fixed in positions such as the BTS station or repeater, depending on each scenario. This process is then repeated until the end of the simulation. In order to simulate the effect of vehicular nodes and its environment on MANET, all scenarios are set up for carrying out the simulations. The basic model for a Bangkok metropolitan environment consists of road and junction in form of 9 x 12 (=108) square kilometers area. In our studies, the following 4 scenario will present our improvement of data delivery percentage of MANET used in IVCS.
• Random-waypoint as shown in Fig 1. • BTS-Train as shown in Fig 2. • BTS-Train + BTS station as shown in Fig 3.
2

Mobility Conference 2004
Figure 1. Random-waypoint scenario.
Figure 2. BTS-Train scenario.
3

Mobility Conference 2004
Figure 3. BTS-Train and BTS-station scenario. SIMULATION RESULTS Random Waypoint scenario From the connectivity diagrams of the nodes in the Random-waypoint scenario shown in Fig 5 through Fig 7, it is easy to see that the connectivity is low due to large area and limitation of IEEE 802.11b (only 350 meters for communication length). It presents in a snap shot
Figure 5. Random-waypoint at time 10 sec.
4

Mobility Conference 2004
Figure 6. Random-waypoint at time 100 sec.
Fig 7. Random-waypoint at time 350 sec. BTS-Train scenario The connectivity diagrams of the nodes in the BTS-Train scenario are shown in Fig 8 through Fig 10. Node 1 to 13 were representing all trains and node 14 to 100 were representing vehicles which are moving around randomly in the area 108 (9x12) square kilometers.
It is shown that the connectivity increased due to the predicted route of the BTS-Train. It is shown in snap shots.
5

Mobility Conference 2004
Figure 8. BTS-Train at time 10 sec.
Figure 9. BTS-Train at time 100 sec.
6

Mobility Conference 2004
Figure 10. BTS-Train at time 350 sec. BTS-Train + BTS-Station scenario The connectivity diagrams of the nodes in the BTS-Train + BTS-Station scenario shown in Fig 11 through Fig 13. Node 1 to 13 were representing all trains and node 27 to 31, 51, 56, 57 to 59, 62, 64, 67, 68, 71, 72, 81, 83 to 89 were representing BTS stations. All BTS stations are fixed by construction based upon BTS route map. The rest nodes were representing the vehicles which are moving around in the area 108 (9 x 12) square kilometers.
The results in snap shots indicate that the connectivity increased due to greater number of nodes in predicted route of the BTS-Train.
Figure 11. BTS-Train+BTS-Station at time 10 sec.
7

Mobility Conference 2004
Figure 12. BTS-Train and B S-Station at time 100 sec. T
Figure 13. BTS-Train+BT -Station at time 35 ec.
CONCLUSION AND DISCUSSION
uch work has to be done on this study. We discover that the data delivery percentage is
which allows a connection in range of 350 meters.
S 0 s
Mstill low at only 13.3% because the BTSNET does not cover all geographical areas (it covers only 1/3 of the total area). So the vehicle that is far from the BTSNET service area could not establish the connection to the destination. However without BTSNET the data delivery percentage is only 3.6 %, because of the mobility and limitation on IEEE 802.11b
8

Mobility Conference 2004
Also at the center of the geographical area, a lot of traffic is generated because this is business area so it will be full with vehicles. For this reason BTSNET can provide a servi
Model Random-waypoint BTSnet (at train)
BTSnet (train + station)
ce like backbone network for MANET in order to increase the chance of establishing the connection for vehicular traffic. All results are shown in table 1. Table 1: Data delivery percentage on each model.
Data delivery percentage
3.6% 11.6% 13.3%
F ORK
oked into and made use of the regularity of the BTS train services to rovide for a mobile backbone in future. However, the deterministic and predictable
n, Lee Bu Sung, Seet Boon Chong, Liu Genping, abnd Zhu Lijuan., “BUSNet: Model and Usage of Regular Traffic Patterns in Mobile Ad Hoc Networks
[2] e 9th ACM
[3] elinski and H. Korth, Eds., Kluwer, pp. 153-81,
[4] nd IEEE Wksp. Mobiel Comp. Sys. And Apps., pp. 90-100, 1999.
Mobile Ad
UTURE W
So far, this paper lopproperties of the BTSNET are not utilized in this paper as DSR routing protocol was used in our study. DSR routing protocol per se has low performance when compared to AODV routing protocol. So a novel routing protocol is used to improve the performance of the BTSnet. From BTSnet we discovered the data delivery percentage is low because of the type of routing protocol, BTSnet service area, congestion at BTSnet and limitation of distance on IEEE 802.11b. Number of repeaters located distributedly on BTSnet will be taken into account in order to produce a complete routing backbone BTSnet. Then data delivery percentage will be investigated for the case as such. REFERENCES [1] Wong Kai Ju
for Inter-vehicular Communications,” Conference Procedding on 1st ICT, Information and Communication Technologies. Bangkok, Thailand, pp102-108, 2003. Robert Morris, John Jannotti, Frans Kaashoek, Jinyang Li, Douglas Decouto, “CarNet: A scalable Ad Hoc Wireless Network System”. proceedings of thSIGOPS European Workshop, 2000. D.B. Johnson and D. A. Maltz “Dynamic Source Routing Protocol for Mobile Ad Hoc Networks”, Mobile computing T. Imi1996. C.E. Perkins and E. M. Royer , “ Ad Hoc On-Demand Distance Vectored Routing”, Proc. 2
[5] Jittraporn Chinthammrit and Waleerat Kovitanupong, “BTSNET: Implementation of Inter-vehicular communications in the Regular Traffic Patterns by Using Hoc Networks”, Bachelor’s thesis, Department of Telecommunications Science, Faculty of Science and Technology, Assumption University, Thailand, 2003.
9
Mobility Conference 2004
THE AWARE MESSENGER – A CASE STUDY IN HUMAN AWARE COMPUTING
ZARY SEGALL
University of Maryland Baltimore County, Baltimore, MD 21250, U.S.A
MARKUS BYLUND Swedish Institute of Computer Science, Box 1263, SE-164 29 Kista, SWEDEN
NIKOLAUS FRANK AND CECILIA FRANK Frank etc. Inc., Rothuggsvagen 4, SE-122 41, Enskede, SWEDEN
The aWare Messenger is a family of human aware mobile communication devices targeted toward increasing the comfort of people by mediating rich information about the situation and emotion of other people. It is based on sensing of body physiology, environment, and situation, and it proactively initiates new types of mobile communication and services. We describe our experience in designing and prototyping the first generation of such devices. We are observing that the criteria for engaging in mobile awareness is based on emotional interpretation of context data such as presence, activity, social company, mood, level of busyness, ambient sound, light, and location. These combined metrics decide the topic, tone, and duration of a human interaction. To allow the same rules for engaging in conversations in the mobile world, the aWare Messenger needs to provide similar type of data. We will present the aWare Messenger project – a case study in Human Aware Mobile Computing. We will discuss the social practices and community [14] issues that led to the development of the concept along with the software and hardware architecture of the aWare Messenger; prototype. Further we will present the physical artifacts design and the considerations for the form, function, user interface modalities, and their practical implications. We will conclude with open research challenges and our future plans. INTRODUCTION Human aware mobile computing is promoting the use of active sensing of the human physiology, and human emotions and situations as the input for new types of mobile systems [1, 2]. Such systems have many applications including new mobile services, smart communication, and health care. Our research agenda aspires to create a model where the computer is human aware and is able to proactively serve the user. We are targeting our research toward mobile and wearable systems that are capable to increase people’s comfort and quality of life. We are interested in using our approach as part of the solution for societal challenges such as health care cost reduction and supporting an increasingly aging population.
1
Mobility Conference 2004
Our human aware computing methodology combines considerations emanating from business, design, social practices, and technology criteria. Our departure point is the user emotional experience in the context of a wearable computing environment. Our prime target is to find how the users' model of person-to-person communication might expand in the future. We are interested to explore the mediation of the model of person-to-person communication that also includes multi-party communication with status and emotional indications and multiple modalities. A related question is finding what functions are needed in a wearable audiovisual terminal, for controlling the coupling between the user, the communication session, and the physical space? How would such a terminal look, maximizing usability factors? This paper is in part the result of a graduate class taught by Professor Segall at the Royal Institute of Technology in Stockholm, Sweden. The course and the resulting research and development projects have integrated synergistic concepts from business, design, social practices, and emerging technologies. We will be presenting one of the projects – the aWare Messenger – that resulted from this work. THE AWARE MESSENGER – CONCEPT AND ARTIFACTS The aWare Messenger has been developed as a set of wearable artifacts communicating at short range using Bluetooth (BT). The same BT connectivity permits communication through a 2.5/3G wearable communicator. The development of the aWare Messenger follows a number of visions and research efforts, including Weiser’s vision about Ubiquitous Computing [3], Dearle’s concept of Ubiquitous Environments [4], the concept of Personal Service Environments [5, 6], and finally Personal and Wearable Servers [7-10]. To understand the concept and implementation of the aWare Messenger we will introduce the following objects: the Wearable Communicator (see Figure 1), the MobiFlex smart display (see Figure 2 and 3), and the vitaFlex sensor band (see Figure 4).
Figure 1. Wearable Communicator. The concept of the wearable communicator includes a 2.5/ 3G phone electronics repackaged in the size of a lipstick. The device features BT and GSM/GPRS. The device could be further integrated into garment or wearable accessories.
2
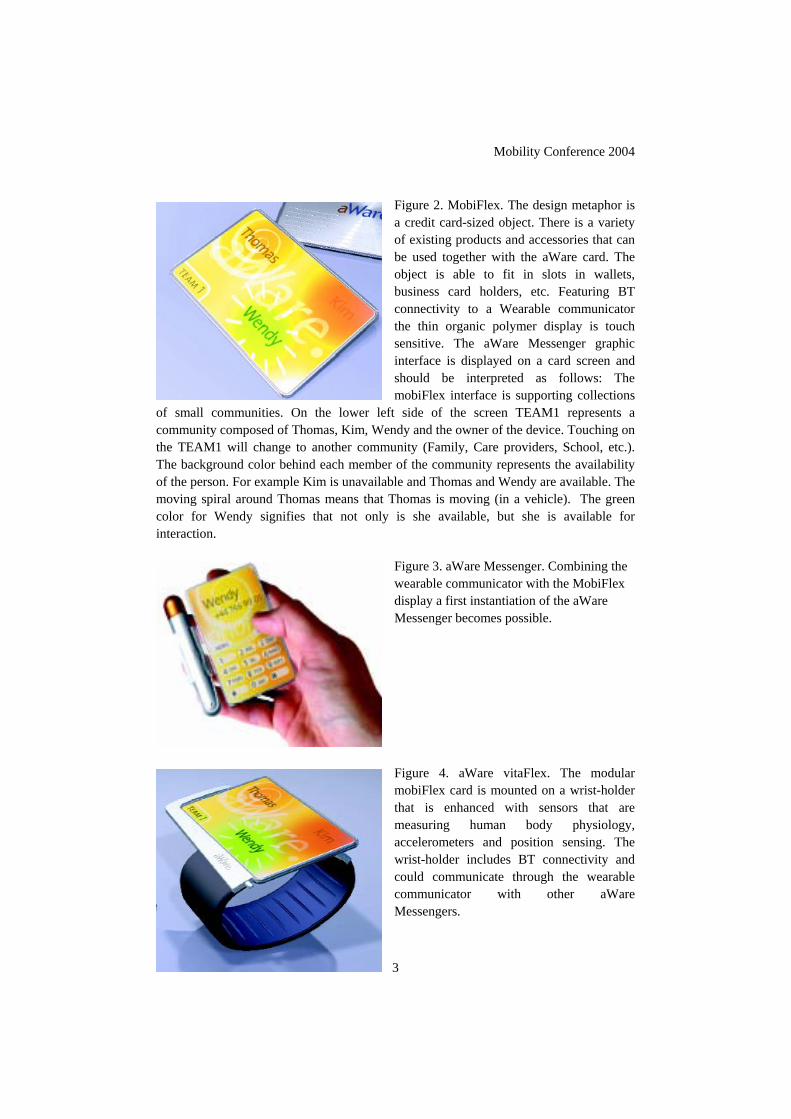
Mobility Conference 2004
Figure 2. MobiFlex. The design metaphor is a credit card-sized object. There is a variety of existing products and accessories that can be used together with the aWare card. The object is able to fit in slots in wallets, business card holders, etc. Featuring BT connectivity to a Wearable communicator the thin organic polymer display is touch sensitive. The aWare Messenger graphic interface is displayed on a card screen and should be interpreted as follows: The mobiFlex interface is supporting collections
of small communities. On the lower left side of the screen TEAM1 represents a community composed of Thomas, Kim, Wendy and the owner of the device. Touching on the TEAM1 will change to another community (Family, Care providers, School, etc.). The background color behind each member of the community represents the availability of the person. For example Kim is unavailable and Thomas and Wendy are available. The moving spiral around Thomas means that Thomas is moving (in a vehicle). The green color for Wendy signifies that not only is she available, but she is available for interaction.
Figure 3. aWare Messenger. Combining the wearable communicator with the MobiFlex display a first instantiation of the aWare Messenger becomes possible.
Figure 4. aWare vitaFlex. The modular mobiFlex card is mounted on a wrist-holder that is enhanced with sensors that are measuring human body physiology, accelerometers and position sensing. The wrist-holder includes BT connectivity and could communicate through the wearable communicator with other aWare Messengers.
3

Mobility Conference 2004
THE AWARE MESSENGER USER INTERFACE In visualizing the complex nature of multi-person communication, social interaction in several dimensions comes into play. Similar to an analogue watch, it would be preferable if one could grasp the current situation-awareness with just a glance. Following are some of the user interface principles of aWare objects. Radiation/area. Color and color intensity radiates from a displayed person’s name, each color and transition between colors representing levels of sensor-based information. Graphic element/animation. A set of graphic elements and patterns are used to describe situation-based activities. This could be graphics that symbolize openness to communication, high level of work-related activity, different situations of accessibility, ongoing communication, etc. Value perspective. Persons that are in focus for the user’s interest and activity, or who play a specific and important role in the “teamwork” become larger (or closer) on the screen. Less central objects of interest become more peripheral. Layers and depth. The use of depth indicates level of importance since several different groups tend to interact in a person’s life.
Figure 5. Examples of aWare user interfaces. THE AWARE MESSENGER FUNCTIONALITY Achieving situation awareness in a mobile communication system is a challenging task that requires new functionality: Mood/emotional status: Captures signs of emotional status such as stress level, pulse, posture, and translates it into a virtual mood indication. Potentially, this data could be acquired by a set of wearable and non-intrusive sensors placed in close proximity to the human body in order to define a matrix of the users’ emotional status [11, 12].
4

Mobility Conference 2004
Proximity/location. Provides location coordinates and proximity to other users and services. This could be achieved by a combined set of sensors and services, such as the vitaFlex. Activity: Shares computerized calendar based information to inform other users of present and future activities. In combination with sensors for direction, body position and location, the system needs to translate the calendar data into an activity description such as “in a meeting”, or “on the way to the bus.” (see for example the work by Begole et al. about rhythm modeling [13]). Venue of communication. Determines the most appropriate channel of communication. The choice can give important clues as to the most appropriate modality of communication. Ambiance. Provides environmental information using wearable sensors for lighting conditions, sound level, and motion. AWARE SCENARIOS To illustrate a range of user experience with the aWare Messenger three scenarios are outlined (see Figure 6). While the functionality of the aWare Messenger is aiming to applications in the health care and the support of the aging population, for the illustration purposes we are presenting simple applications that are showing the power of the concept applied to every day life.
Question Mike is in his car on his way to a client. Having worked with a large construction project for almost two years, he is about to take on a new project. However, he cannot fully let go of all the details of the old project. Seeing that his colleague John is on the construction site, he remembers that they have to check the cabling on the south wall again. The aWare Messenger’s situation-awareness evaluator indicates that John is following up on some changes that they have previously agreed upon. The situation-awareness evaluator indicated that John is driving but available to communicate with Mike only. (The moving spiral, the color of the background and the name Mike
on the display indicates this situation). He gently touches John’s name on the aWare Messenger and dictates a question, asking John to check the cabling. A few minutes later, John’s name flashes and Mike gets the message: “The cabling is OK Mike; see you tomorrow!”
5

Mobility Conference 2004
Reminder On her way home from the University, Cathy is wondering how much time she has before the next bus leaves. Sitting down to look for the timetable on her aWare Messenger, she sees that her friend Wendy changed from busy and not feeling well indication to available, feeling well and asking to be contacted indication. She remembers that she agreed to go with Wendy to the movies if Wendy’s cold got better. The next bus leaves in 18 minutes; she has just enough time to buy the tickets before the bus leaves.
Cue Lisa has a dilemma. Having started to produce an ad it has become clear that she needs Tom’s expertise. Tom, one of the best copywriters in the company, is already experiencing a heavy workload. Lisa solution is to convince him to let go of some of the more interesting, but easier, assignments to take on the tedious work that needs to be done. A few hours ago Lisa’s aWare Messenger indicated that he was both very busy and in a terrible mood – the reddish background and the pointy and aggressive animation that surrounded his name made that very clear. However, a few hours later, he seems to have had a great lunch, because since then the aWare Messenger has indicated that he may be available to anyone who needs him. This mi
e Lisa’s opportunity to convince him to take on the task. ght
b
6
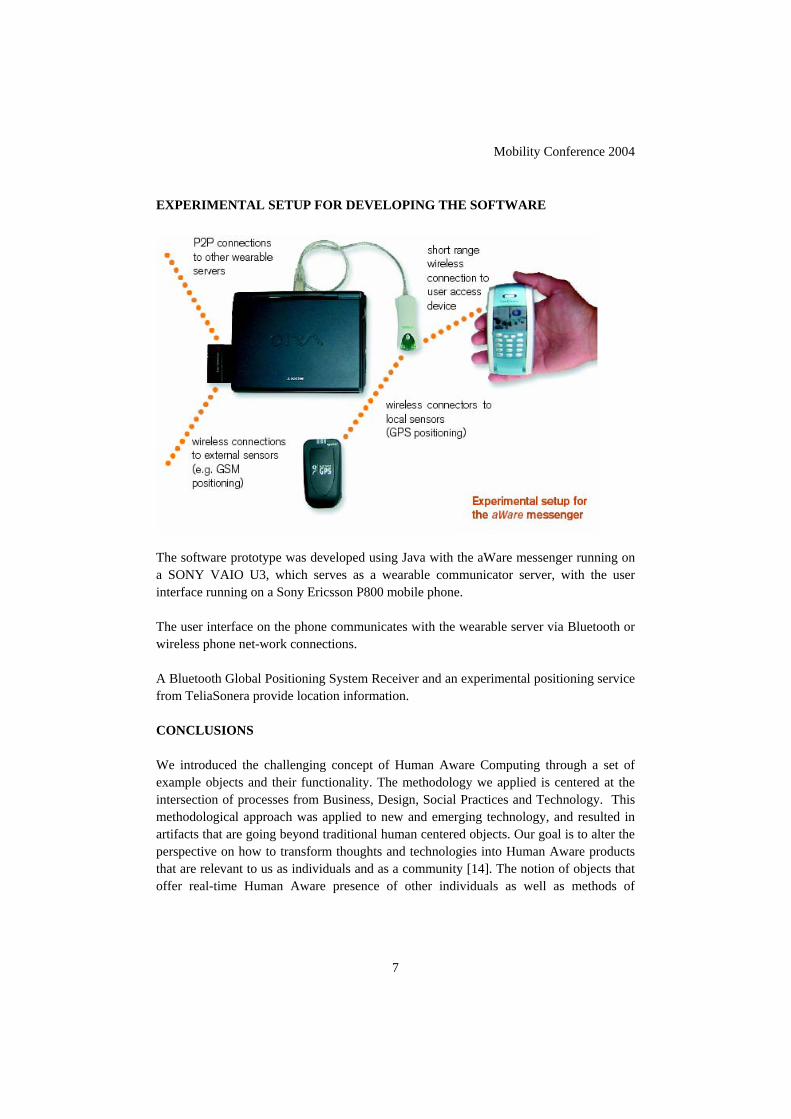
Mobility Conference 2004
EXPERIMENTAL SETUP FOR DEVELOPING THE SOFTWARE
unicator server, with the user terface running on a Sony Ericsson P800 mobile phone.
unicates with the wearable server via Bluetooth or ireless phone net-work connections.
and an experimental positioning service om TeliaSonera provide location information.
ONCLUSIONS
The software prototype was developed using Java with the aWare messenger running on a SONY VAIO U3, which serves as a wearable commin The user interface on the phone commw A Bluetooth Global Positioning System Receiverfr C We introduced the challenging concept of Human Aware Computing through a set of example objects and their functionality. The methodology we applied is centered at the intersection of processes from Business, Design, Social Practices and Technology. This methodological approach was applied to new and emerging technology, and resulted in artifacts that are going beyond traditional human centered objects. Our goal is to alter the perspective on how to transform thoughts and technologies into Human Aware products that are relevant to us as individuals and as a community [14]. The notion of objects that offer real-time Human Aware presence of other individuals as well as methods of
7

Mobility Conference 2004
directing and capturing our personal emotions and reality, calls for a particular attention
y that have the ability to be part of us nd part of what we wear. This challenges us to rethink our world and accept the notion
Human Aware computing objects.
va, Intel Corp., Swedish stitute of Computer Science, Frank etc, University of Oregon, University of Maryland
niska Museet and Telemuseum in Stockholm.
REF[1] bowd, "A Conceptual Framework and a Toolkit for Supporting the
omputer Interaction (IJHCI),
[2] rd, Affective Computing. Cambridge: MIT Press, 1997.
[5] Service Interaction," presented at 5th
[6] ice Environments – Openness and User Control in User-Service
ommunications, vol. 6, 2004.
to the understanding of multidimensional user experience. Through the use of our combined approach in design and technology, we have tried to find a way to transform the accepted objects of today to a range of artifacts of tomorrow. At the same time these artifacts present radical questions to us. They point towards a fragmentation of the traditional metaphor of an object, a deconstruction of the conventional, exploring the aspects of a technologaof Wearable CREDITS The research group grew out of the thinkWearable; [15] graduate course taught by Professor Zary Segall at the Royal Institute of Technology: Faculty: Magnus Boman, Carl-Gustaf Jansson, Bertil Thorngren and Zary Segall (lead). Design and Concept Development: Nikolaus Frank, Cecilia Frank; Graduate students and researchers: Johan Mattsson, Catharina Melian, Ola Hamfors, Li Wei, Markus Bylund, Alex Jonsson, Ester Appelgren, Tobias Törnqvist and Fredrik Espinoza; Collaborators and sponsors: Telia, Ericsson, IBM Svenska AB, Brainheart Capital, Royal Institute of Technology, Stockholm School of Economics, Fulbright Commission, VinnoIn(UMBC), and Tek
ERENCES A. Dey, D. Salber, and G. ARapid Prototyping of Context-Aware Applications," Human-Cvol. 16, pp. 97-166, 2001. R. Pica
[3] M. Weiser, "The Computer for the 21st Century," Scientific American, vol. 265, pp. 94-104, 1991.
[4] A. Dearle, "Toward Ubiquitous Environments for Mobile Users," IEEE Internet Computing, vol. 2, pp. 22-32, 1998. M. Bylund and F. Espinoza, "sView - PersonalInternational Conference on The Practical Applications of Intelligent Agents and Multi-Agent Technology (PAAM'2000), Manchester, UK, 2000. M. Bylund, "Personal ServInteraction," in Computing Science Department, Information Technology. Uppsala, Sweden: Uppsala University, 2001.
[7] M. Bylund and Z. Segall, "Towards Seamless Mobility with Personal Servers," INFO - The Journal of policy, regulation and strategy for telec
8

Mobility Conference 2004
[8] M. Bylund and Z. Segall, "Seamless Mobility with Personal Servers," presented at Stockholm Mobility Roundtable, Stockholm, Sweden, 2003. R. Want, T. Pering, G. Danneels, M. Kumar, M. Sundar, and J. Light, "The Perso[9] nal Server:
g (UbiComp'2002), Göteborg, Sweden, 2002.
[12] ssessing and Adapting to User Attitude
[14] uem, Zary Segall "Wearable Communities: Augmenting Social Networks
5] Fulbright Foundation, Zary Segall, Future Mobility; thinkWearable”, published by the Fulbright Foundation, Stockholm, May 2003
Changing the Way We Think About Ubiquitous Computing," presented at 4th International Conference on Ubiquitous Computin
[10] R. Want, G. Borriello, T. Pering, and K. I. Farkas, "Disappearing Hardware," IEEE Pervasive Computing, vol. 1, pp. 36-47, 2002.
[11] H. Wang, H. Prendinger, and T. Igarashi, "Communicating Emotions in Online Chat Using Physiological Sensors and Animated Text," presented at CHI 2004, Vienna, Austria, 2004. C. Conati, R. Chabbal, and H. Maclaren, "A Study on Using Biometric Sensors for Monitoring User Emotions in Educational Games," presented at "Aand Affects: Why, When and How? “. In conjunction with UM ’03, 9th International Conference on User Modeling, Pittsburgh, PA, 2003.
[13] J. B. Begole, J. C. Tang , and R. Hill, "Rhythm Modeling, Visualizations and Applications," presented at UIST'2003, Vancouver, BC, Canada, 2003.
G. Kortwith Wearable Computers", IEEE Pervasive Computing Journal, vol. 2, pp. 71-78, 2003.
[1
9

Mobility Conference 2004
GRID LOCATION SERVICE BASED MULTICAST ROUTING IN AD HOC NETWORKS
T.JAISINGH
II M.E Applied Electronics, Govt. College of Technology, Coimbatore, India Email: [email protected]
V.SUMATHY
Lecturer in ECE, Govt. College of Technology, Coimbatore, India
The Grid Location Service (GLS) is a new location service which provides location information for a node in a mobile ad hoc network. This method combines with geographic forwarding and allows the const-ruction of ad hoc net-works to scale a large number of nodes. GLS is a decentralized and runs in mobile nodes them-selves, requiring no fixed infrastructure. Each mobile node updates a small set of other nodes with its current location. Each node sends its position update information to the other nodes (its location servers) with knowing their actual identities, assisted by a predefined ordering of node identifiers and a predefined geographic hierarchy. Queries for a mobile location also use the predefined identifier ordering and special hierarchy to find a location server for that node. In this method, multicast Routing is provided with the help of the location information avail-able and in this method we expect the storage and the band width requirements grow slowly with the size of the network. Furthermore, GLS multicast routing tolerates the node failures well. Each node failure has only a limited effect. The node chooses the alternative part available in the network. The query performance is also sensitive with the node speeds. Simple geographic forwarding combines GLS with ODMRP in finding the route and forwarding the packets. In this paper approach, more packets can be delivered with the consumption of fewer network resources. The simulation has been performed in Glomosim and the results have been analyzed. 1. INTRODUCTION An Ad hoc network is a set of wireless mobile nodes that cooperatively from a network without specific user administration or configuration. Each node in an Ad hoc network is in charge of routing information between its neighbors, thus contributing to and maintaining connectivity of the network. There are numerous scenarios that do not have an available network infrastructure and could benefit form the creation of an ad hoc network: • Rescue/emergency operations: rapid installation of a communication infrastructure
during a natural/ environmental disaster (or a disaster due to terrorism) that demolished the previous communication infrastructure;
• Law enforcement activities: rapid installation of a communication infra-structure during special operations;
• Tactial missions: rapid installation of a communication infrastructure in a hostile and/or
1

Mobility Conference 2004
unknown territory; • Commercial projects: simple installation of a communication infra -structure for
commercial gatherings such as conferences, exhibitions, workshops and meetings; • Educational classrooms: simple installation of a communication infra-structure to
create an interactive classroom on demand. In this paper we consider the problem in routing in large ad hoc network of mobile hosts. Such networks are of interest because they do not require any prior investment in fixed infrastructure. Instead, the nodes agree to relay each others packets toward their ultimate destinations and the nodes automatically from their own cooperative infrastructure. The grid is the one that combines a cooperative infrastructure with location information to implement reading in a large ad hoc network. We analyze to show that grid location service show that it is correct and efficient by simulation. Construction of large networks with fixed nodes is possible today. The examples include the telephone system and the internet. The cellular network shows how these wired networks can be extended to mobile one. Though these networks require a large upfront investment in fixed infrastructure before they are useful in central offices, trunks and local loops in telephone systems, radio towers for the cellular network. Upgrading these networks do meet increasing bandwidth requirements have proven expensive and slow. As large fixed communication infrastructure network already exist, it is desirable to use ad hoc networks in number of situations. Much research has been done attempting to design a routing protocol that will perform well in a large mobile ad hoc network. Research shows that GLS, combined with geographic forwarding, provides a routing protocol that is highly scalable to such a network. In other words, a performance analysis using a network simulator indicates that GLS responds well in dense networks. These results pro-vide evidence that GLS can be used as a location service in a geographic-based routing protocol to significantly improve its scaling properties. This paper analyzes the performance of GLS with a variety of network densities. The average success rate of a query is used as an indicator to compare the performance among different network densities. The authors of GLS investigated the performance of GLS for networks with 100-600 mobile nodes in a large area. The results show that GLS resource consumption grows slowly with the size of the network, tolerates node failures well, is relatively insensitive to node mobility, and performs well in terms of query success rate and throughput per resource consumption. The auth-ors of GLS do not compare GLS with other location services, nor combine GLS with an efficient geographic-based routing protocol. Our ultimate goal is to provide this missing work. The authors of GLS also do not show the performance of GLS in sparser networks (fewer than 100 nodes). GLS may not perform well in a sparse network, because it uses geographic forwarding as its routing protocol. Our immediate goal is to understand GLS and to analyze its performance (i.e., query success rate) and overhead (i.e., the number of packets and bytes transmitted per location request answered) in a range of
2

Mobility Conference 2004
network densities. This paper concerns GLS results from simulations of networks with a small to medium number of nodes in a large area. Section 2 provides details of the geographic forwarding protocol (in Section 2.1), the GLS protocol (in Section 2.2) and multicasting protocol (in Section 2.3). Sections 3 and 4 describe the simulation environment and result analysis from our simulations. Section 5 describes existing work on location services. Lastly, Section 6 states our conclusions and our future plans. 2. IMPLEMENTATION 2.1 Geographic Forwarding In geographic forwarding, each node maintains its own position using GPS and announces its presence, position, and velocity to its neighbors by broadcasting periodic HELLO packets. See Table 1 for contents of a HELLO packet. (Forwarding pointers are discussed in Section 2.2.4.) Geographic forwarding uses a two hop distance vector protocol. Thus, each HELLO packet includes a list of a node’s neighbors and locations. In addition, each node maintains a routing table for all nodes within two hops of itself, which is up-dated via the HELLO packets the node receives. Each entry in the routing table contains neighbor ID, location, speed, and time the location information was stored. Each entry in the routing table expires after a fixed period and is removed from the table.
Table 1: HELLO packet fields HELLO
Source ID Source location Source speed Neighbor list: IDs and location
Forwarding pointers When a node needs to forward a packet to a destination, it consults its routing table and chooses to for-ward the packet to the neighbor closest to the packet’s destination, which itself applies the same algorithm. There is, however, a potential problem if a node does not know about any nodes closer than itself to the destination. This dead-end situation can be overcome by using Greedy Perimeter Stateless Routing (GPSR) [9], a geographic-based routing protocol that uses a planar sub graph to route around holes. Based on the results of simulations by the authors of GLS, we conclude that geographic forwarding performs well when nodes are dense enough that dead ends are not common. 2.2 Grid Location Service GLS is a location service that is built upon the number of location servers distributed throughout the network. There are three main activities in GLS: location server selection, location query request and location server update. Initially, the area covered by the ad hoc network is arranged into a hierarchy of grids with the squares of increasing size. The smallest square is called an order-1 square. Four order-1 square make up an order-2 square,
3
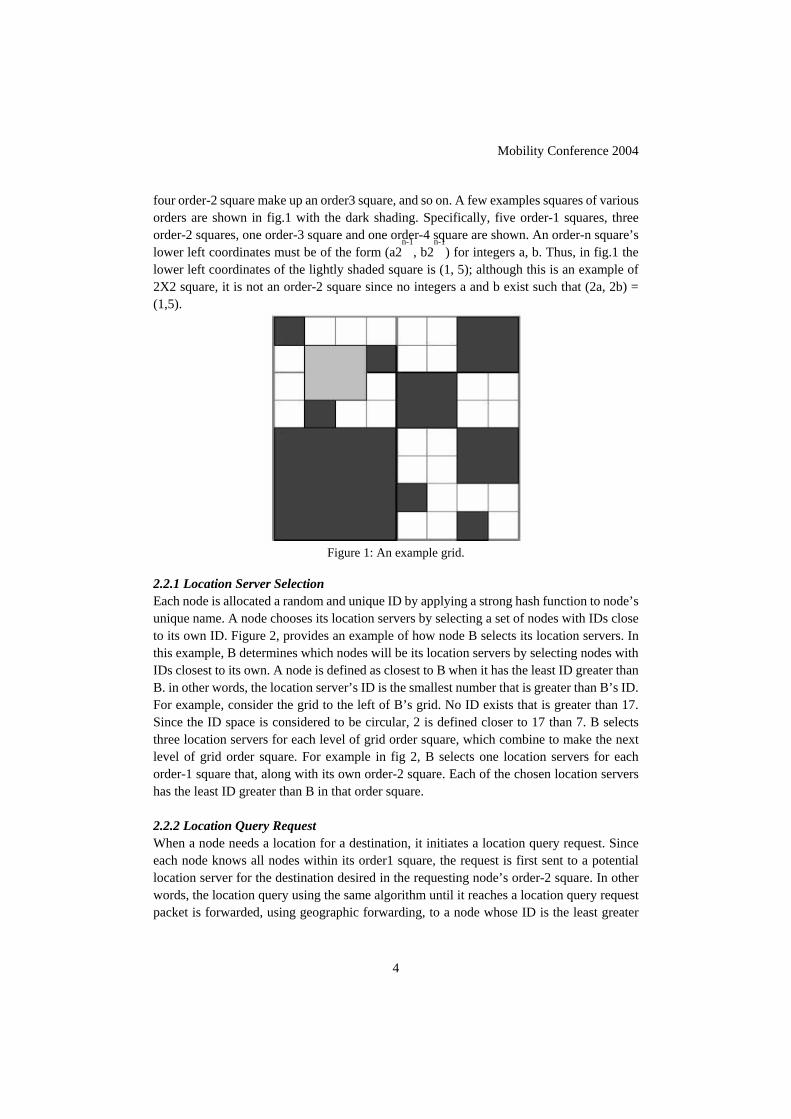
Mobility Conference 2004
four order-2 square make up an order3 square, and so on. A few examples squares of various orders are shown in fig.1 with the dark shading. Specifically, five order-1 squares, three order-2 squares, one order-3 square and one order-4 square are shown. An order-n square’s lower left coordinates must be of the form (a2
n-1, b2
n-1) for integers a, b. Thus, in fig.1 the
lower left coordinates of the lightly shaded square is (1, 5); although this is an example of 2X2 square, it is not an order-2 square since no integers a and b exist such that (2a, 2b) = (1,5).
Figure 1: An example grid.
2.2.1 Location Server Selection Each node is allocated a random and unique ID by applying a strong hash function to node’s unique name. A node chooses its location servers by selecting a set of nodes with IDs close to its own ID. Figure 2, provides an example of how node B selects its location servers. In this example, B determines which nodes will be its location servers by selecting nodes with IDs closest to its own. A node is defined as closest to B when it has the least ID greater than B. in other words, the location server’s ID is the smallest number that is greater than B’s ID. For example, consider the grid to the left of B’s grid. No ID exists that is greater than 17. Since the ID space is considered to be circular, 2 is defined closer to 17 than 7. B selects three location servers for each level of grid order square, which combine to make the next level of grid order square. For example in fig 2, B selects one location servers for each order-1 square that, along with its own order-2 square. Each of the chosen location servers has the least ID greater than B in that order square. 2.2.2 Location Query Request When a node needs a location for a destination, it initiates a location query request. Since each node knows all nodes within its order1 square, the request is first sent to a potential location server for the destination desired in the requesting node’s order-2 square. In other words, the location query using the same algorithm until it reaches a location query request packet is forwarded, using geographic forwarding, to a node whose ID is the least greater
4

Mobility Conference 2004
than or equal to the ID of the destination within the order-2 square. The node then forwards the query using the same algorithm until it reaches a location server for the destination. This location server then forwards the query directly to the destination, which responds to the location query with its most recent location.
Figure 2: A GLS example.
2.2.3 Location Server Update A location server update occurs when a node moves. Each node, acting as a location server for the nodes it serves, maintains two tables. The location table holds the location of nodes that have selected this node as its location server; each entry contains a node’s ID and geographic location. A location cache, which is used when a node originates a data packet, holds information from the update packets a node has forwarded. Because a node uses the routing table maintained by geographic forwarding for its order-1 square neigh-bors, it does not need to send GLS updates within its order-1 square. When a node moves, it must send an update packet to all of its location servers and add the update information to its location cache. To avoid excessive update traffic, the update frequency is calculated using a threshold distance and the location servers’ square order. The threshold distance is the distance the node has traveled since the last update. For example, suppose a node updates its location servers in order-2 squares when it moves a distance d; the node then updates its location servers in order-3 squares when it moves a distance 2d. In other words, a node updates its location servers at a rate proportional to its speed, and the distant location servers are updated less frequently than the nearby location servers. Before a node sends a data packet, it checks its location cache and location table to find the location of the destination. If it finds an entry for the destination, it forwards the data packet to that location. Otherwise, it initiates a location query using GLS, and stores the data packet
5
Mobility Conference 2004
in a buffer waiting for the query result. If no result is returned, the node periodically transmits queries according to a timeout interval. Once it gets the query result, it will use geographic forward-ding to send the data packet. 2.2.4 Location Query Failures There are two types of failure caused by node mobility: a location server may have out-of-date information or a node may move out of its current grid. The solution for the first type of failure is to use the old location information. To overcome the second type of failure, which is more common, the moving node places a forwarding pointer in the departed grid. This forwarding pointer points to the grid the node has just entered. In other words, before a node moves out of a grid, it broadcasts its forwarding pointer to all nodes in the grid. Any node in this grid stores the for-warding pointer associated with the node that just left the grid; a node discards forwarding pointers when it departs a grid. To share forwarding pointers with other nodes that has entered the order-1 square, a randomly chosen subset of forwarding pointers are transmitted with each HELLO packet. (Figure 1 shows the HE-LLO packet fields.) A node receiving a HELLO packet adds forwarding pointers to its own collection of forwarding pointers only if the broadcaster of the HELLO packet is in the same grid as the node’s grid. A forwarding pointer allows a data packet to be forwarded to a grid that may contain the node. We note that a dense network is needed for the forwarding pointers to be effective. 2.3 Multicast Forwarding ODMRP creates a mesh of nodes which forward multi-cast packets via flooding, thus providing path redundancy. ODMRP is an On-demand protocol, thus it does not maintain route information permanently. It uses a soft state approach in group maintenance. Member nodes are refreshed as needed and do not send explicit leave messages. In ODMRP, group membership and multicast routes are established and updated by the source on demand. Similar to on-demand unicast routing protocols, a request phase and a reply phase comprise the protocol. When multicast sources have data to send, but do not have routing or membership information, they flood a JOIN DATA packet. When a node receives a non-duplicate JOIN DATA, it stores the upstream node ID and rebroadcasts the packet. When the JOIN DATA packet reaches a multicast receiver, the receiver creates a JOIN TABLE and broadcasts to the neighbors. When a node receives a JOIN TABLE, it checks if the next node ID of one of the entries matches its own ID. If it does, the node realizes that it is on the path to the source and thus is part of the forwarding group. It then broadcasts its own JOIN TABLE built upon matched entries. The JOIN TABLE is thus propagated by each forwarding group member until it reaches the multicast source via the shortest path. This process constructs the routes from the sources to the receivers and builds a mesh of nodes, the forwarding group. Multicast senders
6

Mobility Conference 2004
refresh the membership information and update the routes by sending JOIN DATA periodically. 2.4 Gls With Multicasting In GLS with multicasting the protocol used is ODMRP. As mentioned in the earlier chapter the multicasting is performed by formation for group in each grid locations and the packet are forwarded as group based forwarding. Since the ODMRP is mesh based and loop free, the traffic overhead is reduced and packet delivery ratio is high. An example for performing routing in this method is shown in fig.3. 3. SIMULATION ENVIRONMENT Our GLS with multicasting simulations use CMU’s wireless extensions for the network simulator Glomosim. Table 2 details simulation input parameters as well as parameters derived based on the input values. The calculation of derived parameters allows us to evaluate the various environments that have been simulated. Node density is the number of nodes divided by the total simulation area. Coverage area is the area of the circle whose radius is the transmission distance. The transmission footprint of a node is the percentage of the simulation area covered by a node’s transmission; it is derived from the transmission range of the node and the size of the simulation area. The maximum path length is the distance from the lower left corner to the upper right corner in the simulation area. The network diameter is the maximum path length divided by the transmission range. Finally, the network connectivity indicates the number of one hop neighbors that a node will have. The value labeled “no edge effect” is calculated by dividing the coverage area by the node density. The value labeled “edge effect” takes into account the fact that nodes near the edges do not have neighbors on all sides of the node. As mentioned, the simulation parameters chosen by the authors of GLS produce dense networks (e.g., 12-17 one hop neighbors), while our simulation parameters produce a range of network densities.
Figure3 GLS with Multicasting
7

Mobility Conference 2004
The size of a GLS order-1 square, 250mx250m, is derived from the transmission range. In other words, all nodes are within one hop from each other in a GLS order-1 square. The random waypoint mobility model is used; in this model, each node chooses a random destination and moves toward the destination with constant speed up to 10 m/s. The simulations do not have any pause time. The communication model follows: each node initiates an average of 15 location queries per second over the 300-second simulation, starting at 30 seconds. In a 100m, 150m, and 200m location update threshold is evaluated; all three cases provide query success rates above 90%. In this paper, we only consider a 100m location update threshold. We use ns2.1b1 as our simulator and IEEE 802.11 as our medium access protocol. The simulations use 2Mbps bandwidth and do not involve any data traffic. Each point in each figure is the average of five simulation runs. We include error bars which indicate 95% confidence that the actual mean is within the range of said interval. 4. GLS RESULTS The results in this section involve only GLS (and geographic forwarding), without any data traffic. The default simulation parameters for this section are an 802.11 radio bandwidth of 1 Megabit per second, and a communication model in which each node initiates An average of 15 location queries to random destinations over the course of the 300 second simulation, starting at 30 seconds. The location update threshold distance is an important parameter that may need to be tuned. For this reason we present results for three values of the threshold: 100, 150, and 200 meters. Figure 4 shows the success rate for GLS location queries, as a function of the total number of nodes. Queries are not retransmitted, so a success means a success on the first try. As mentioned earlier, most failures are due to either location information invalidated by node motion or nodes not being correctly updated because of delayed or lost location updates. The success rate for data sent after a successful query would be much higher than indicated here because the endpoints of a connection directly inform each other of their movements.
Figure 4 GLS query success rate as a function of the total number of nodes. The nodes move at speeds up to 10 m/s (about 22 miles per hour). Each line corresponds to a different movement update threshold.
8

Mobility Conference 2004
Figure 5 Average number of Grid protocol packets forwarded and originated per second by each node as a function of the total number of nodes. Nodes moves at a speed up to 10m/s.
Figure 6 Average query length (in hops) as a function of the query reply length, for 300 nodes moving up to 10m/s.
Figure 7 The effect of turning off nodes on the query success rate. The X axis indicates the fraction of nodes that are always on; the remaining nodes cycle on and off for random periods up to 120 and 60 seconds, respectively. The simulations all involve 100 nodes moving at speeds up to 10m/s.
9
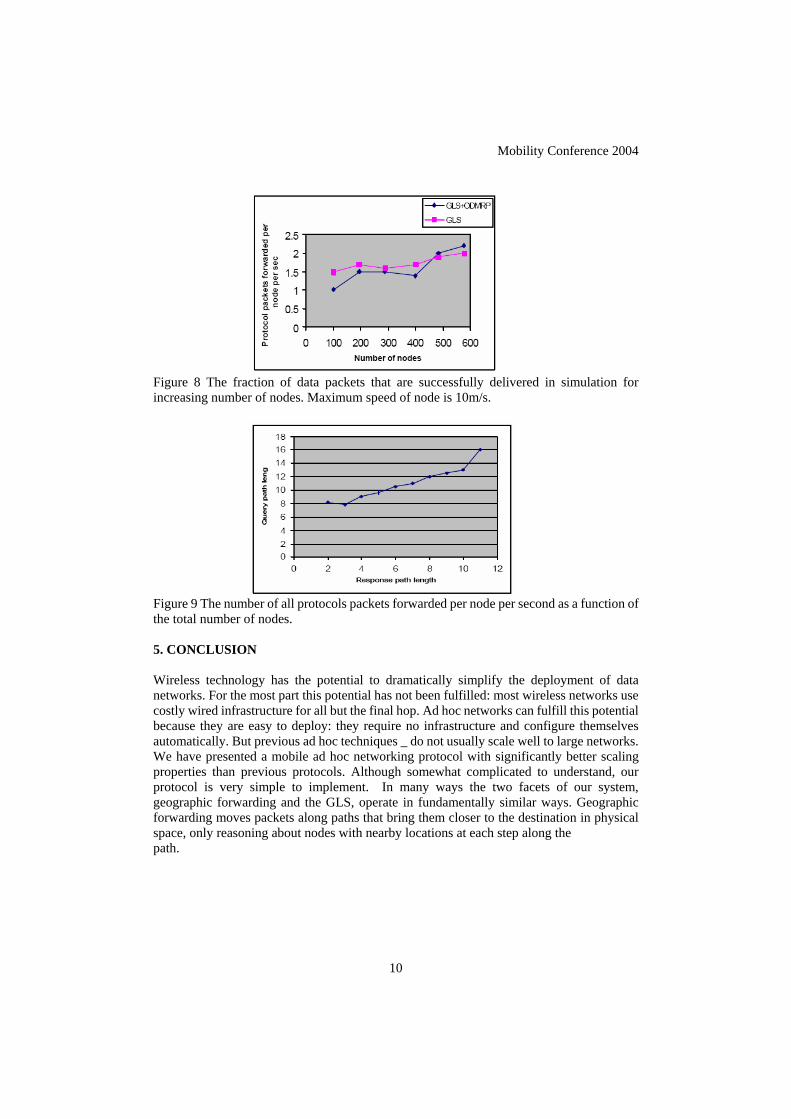
Mobility Conference 2004
Figure 8 The fraction of data packets that are successfully delivered in simulation for increasing number of nodes. Maximum speed of node is 10m/s.
Figure 9 The number of all protocols packets forwarded per node per second as a function of the total number of nodes. 5. CONCLUSION Wireless technology has the potential to dramatically simplify the deployment of data networks. For the most part this potential has not been fulfilled: most wireless networks use costly wired infrastructure for all but the final hop. Ad hoc networks can fulfill this potential because they are easy to deploy: they require no infrastructure and configure themselves automatically. But previous ad hoc techniques _ do not usually scale well to large networks. We have presented a mobile ad hoc networking protocol with significantly better scaling properties than previous protocols. Although somewhat complicated to understand, our protocol is very simple to implement. In many ways the two facets of our system, geographic forwarding and the GLS, operate in fundamentally similar ways. Geographic forwarding moves packets along paths that bring them closer to the destination in physical space, only reasoning about nodes with nearby locations at each step along the path.
10
Mobility Conference 2004
REFERENCES [1] S. Basagni, I. Chlamtac, V.R. Syrotiuk, and B.A. Woodward. “A distance routing effect
algorithm for mobility (DREAM).”In Proceedings of the ACM/IEEE International Conference on Mobile Computing and Networking (Mobicom), pages 76–84, 1998.
[2] J. Boleng. “Normalizing mobility characteristics and enabling adaptive protocols for ad hoc networks”. In Proceedings of the 11th Local and Metropolitan Area Networks Workshop, March 2001.
[3] J. Broch, D. Maltz, D. Johnson, Y. Hu, and J. Jetcheva. Multi-hop wireless ad hoc network routing protocols. In Proceedings of the ACM/IEEE International Conference on Mobile Computing andNetworking (Mobicom), pages 85–97, 1998.
[4] T. Camp, J. Boleng, B. Williams, L. Wilcox, and W. Navidi. “Performance comparison of two location based routing protocols for ad hoc networks”. In Proceedings of Infocom 2002, June 2002.
[5] T. Camp, L. Wilcox, and J. Boleng. Location information services in mobile ad hoc networks. In Proceedings of IEEE International Conference on Communications (ICC), April 2002.
[6] K. Fall and K. Varadhan (Editors). Ucb/lbnl/vint network simulator - ns (version 2). http://www.mash.cs.berkeley.edu/ns/, 1997.
[7] R. Jain, A. Puri, and R. Sengupta. Geographical routing using partial information for wireless ad hoc networks. IEEE Personal Communications, pages 48–57, February 2001.
11
Mobility Conference 2004
INTEGRATION OF WIRELESS LOCAL AREA NETWORKS (WLANS) AND WIRELESS WIDE AREA NETWORKS (WWANS)
VIJAY K. GARG Electrical and Computer Engineering Department, University of Illinois at Chicago, IL. USA
R. K. GHOSH, Computer Science and Engineering Department, Indian Institute of Technology, Kanpur, India
S. LAXPATI Electrical and Computer Engineering Department, University of Illinois at Chicago, IL. USA
We describe an architectural framework for dynamic QoS guarantees in the integrated WLAN and WWAN networks. The WLAN is an IEEE 802.11 compliant operating in 2.4 GHz band at 11 Mbps. WWAN is the CDMA 2000 cellular network operating at 2 Mbps. We investigate peer-to-peer (horizontal) dynamic QoS mapping between the two networks. Dynamic QoS control implies that during call duration the QoS parameters are adjusted depending on the available resources. Also, a quantitative analysis of the QoS parameters such as delay, jitter, bit error rate (BER) and throughput for the integrated network is made.
INTRODUCTION Most of the studies focus on QoS analysis either of cellular networks [1,2] or WLANs [3]. They provide generalized techniques [4] for QoS mapping within the network protocol stack. Reference [5] describes an architectural framework for horizontal and vertical handoff between two heterogeneous integrated multimedia networks. This framework deals with an integrated operation of WLAN and WWAN for guaranteed QoS. The salient features of this framework are as follow: (a) Mobile service providers should integrate administration, billing and mobility functions with current 3G technologies. They should provide both WLAN and WWAN services. Service providers should have the option to invest in both WLAN and WWAN networks, or to share the cost of WLAN networks with the interested parties (such as airports, hotels, conference center etc.) (b) Customers should receive only one bill, and be able to set up individual service for continuous data and global data access. Corporate customers should receive Virtual Private Network (VPN) functionalities. (c) An important issue is to optimize spectrum efficiency of the operator’s resources based on QoS requirements and services. The networks should be managed as an integrated unit. Individual network management is expensive and infeasible.
1
Mobility Conference 2004
(d) Resource management techniques should direct mobile device to the optimum resource bearer. The objective is to increase user bit rates, lower blocking, reduce unnecessary air interface signaling and intersystem measurements. The resource management should use load sharing, congestion control and interference distribution. (e) Wireless links suffer from high BER and fading. This results in packet loss on wireless medium, which translates into packet delay and jitter. Also, fading in the wireless channel depends on spatial and temporal factors. Together with interference, these factors affect the permissible bandwidth available over the link. (f) For interworking of WLAN and WWAN both homogeneity and heterogeneity of the environment should be maintained. Also, the integrated network should be able to provide a graceful QoS degradation depending upon the packet routing protocol and signaling overhead. In summary the framework should be based on a coordinated adaptation technique across different heterogeneous layers as well as vertical layers. Such coordination enables the framework to adapt gracefully to dynamics of resources, application requirements and topology of the heterogeneous networks. SCENARIOS IN FRAMEWORK Four scenarios can occur in our framework as indicated by Fig. 1. The first three scenarios represent vertical handoff situations and involve heterogeneous mobility and heterogeneous QoS mapping issues. Scenario 4 is a horizontal handoff situation that considers mobility and QoS mapping within the same environment. Scenario 1 A communicates with B via a core (IP or ATM) through the gateways. IPv6 supports Differentiated Services (DiffServ). The effective QoS of the integrated network is the minimum of the QoS of the IP core and QoS for transmission between WWAN. In case of an IPv4 core, tunneling is used to successfully route the packets via minimum QoS path to the gateway. The gateway maps the core QoS to the destination WWAN/WLAN. Scenario 2 A communicates with B via a Diffserv IPv6 core and a multicast server C. In this case, the traffic from C is divided into sub streams by IP tunneling and sent to WLAN and WWAN through the gateways. Henceforth, A and B may communicate directly (scenario 3) or via the core (scenario 2). A and/or B could also initiate asymmetric (different bandwidth requirements) transmission to C. Scenario 3 In the absence of an IP core, A communicates directly with B. The effective QoS values will be the minimum of the QoS values for WWAN and WLAN. The mobile devices A
2

Mobility Conference 2004
and B should be multimode to accept both the technologies. The antennas on the devices should be capable of handling both the radios efficiently. This scenario can occur only if the physical layer (PHY) of WWAN and WLAN is identical. Scenario 4 A move from one base station to another base station in the same WWAN area or the neighboring one. Also, B communicates with another mobile device in the same WWAN environment or another environment. Similarly, B can move from one access point to another access point in the same WLAN environment or a neighboring WLAN area. B can also make multiple connections with other mobile devices in the same WLAN area or adjacent WLAN areas. The QoS mapping issue in this scenario involves providing sufficient network resources for the handoff. Thus, the mapping focuses on the translation of network resources and parameters without any adaptation. This kind of mapping was discussed in [4, 6, 7].
IP/ATM core
WWAN WWAN
A
with GatewayMedia access layer
WLAN WLAN
C
B
Figure 1: Architecture of WWAN-WLAN Network PROTOCOL STACKS FOR SCENARIOS The protocol stacks for the scenarios are shown in Figure 2. It is assumed that scenarios 1 and 2 involve wired communication with the backbone network and wireless communication between the gateway and the WLAN/WWAN. Scenarios 3 and 4 involve completely wireless communication.
3
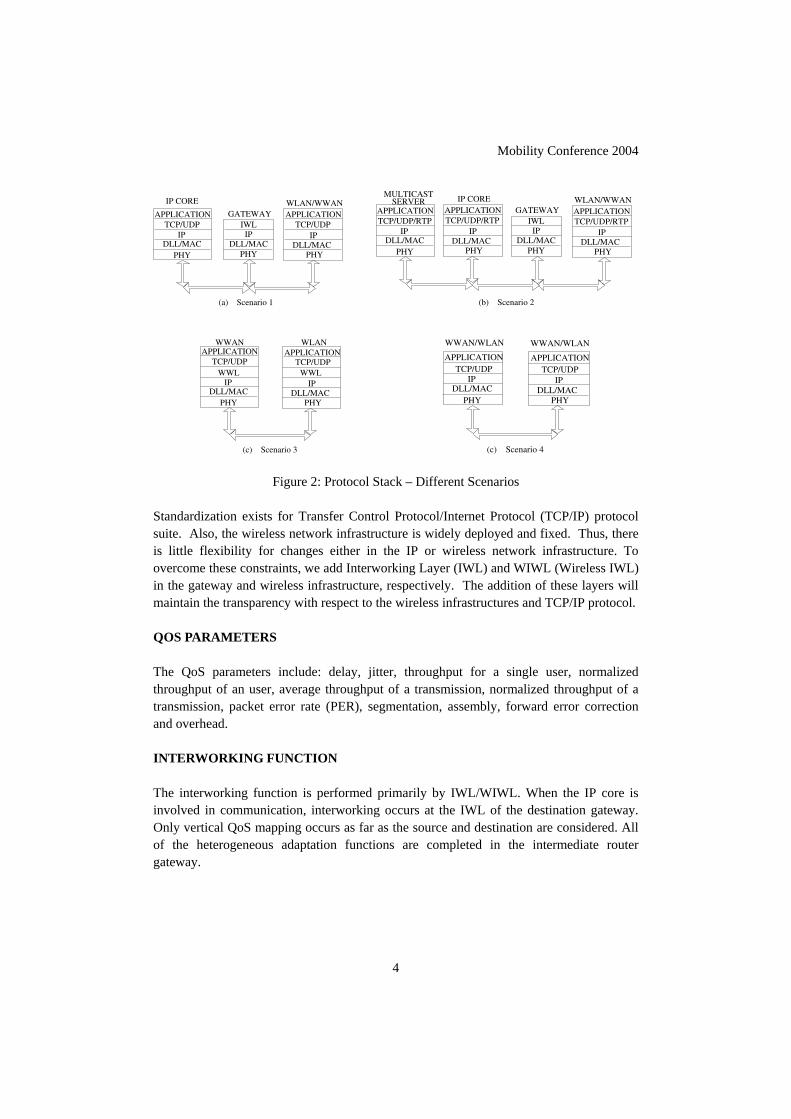
Mobility Conference 2004
(a) Scenario 1
PHYDLL/MAC
IWLGATEWAY
IP CORE
APPLICATION
DLL/MAC DLL/MAC
APPLICATION
PHY
WLAN/WWAN
PHY
TCP/UDP TCP/UDPIP IP IP
APPLICATION
DLL/MACPHY
SERVERMULTICAST
DLL/MAC
APPLICATION
PHY
TCP/UDP/RTP TCP/UDP/RTP
DLL/MAC
APPLICATION
PHY
WLAN/WWAN
PHYDLL/MAC
IWLGATEWAY
TCP/UDP/RTP
(b) Scenario 2
IP IP IP IP
IP CORE
DLL/MACPHY
DLL/MACPHY
WWAN WLANAPPLICATION APPLICATION
TCP/UDPTCP/UDPWWL WWL
(c) Scenario 3
IP IP
DLL/MACPHY
DLL/MACPHY
TCP/UDPAPPLICATION
TCP/UDPAPPLICATION
WWAN/WLANWWAN/WLAN
(c) Scenario 4
IP IP
Figure 2: Protocol Stack – Different Scenarios Standardization exists for Transfer Control Protocol/Internet Protocol (TCP/IP) protocol suite. Also, the wireless network infrastructure is widely deployed and fixed. Thus, there is little flexibility for changes either in the IP or wireless network infrastructure. To overcome these constraints, we add Interworking Layer (IWL) and WIWL (Wireless IWL) in the gateway and wireless infrastructure, respectively. The addition of these layers will maintain the transparency with respect to the wireless infrastructures and TCP/IP protocol. QOS PARAMETERS The QoS parameters include: delay, jitter, throughput for a single user, normalized throughput of an user, average throughput of a transmission, normalized throughput of a transmission, packet error rate (PER), segmentation, assembly, forward error correction and overhead. INTERWORKING FUNCTION The interworking function is performed primarily by IWL/WIWL. When the IP core is involved in communication, interworking occurs at the IWL of the destination gateway. Only vertical QoS mapping occurs as far as the source and destination are considered. All of the heterogeneous adaptation functions are completed in the intermediate router gateway.
4

Mobility Conference 2004
Table 1: Various stages of interworking functions
Functions Description Packet classification Grouping for WWAN to WLAN transmission is according to
power levels assigned to traffic type and Eb/N0. That for WLAN to WWAN transmission is according to traffic type and time stamp.
Rate adaptation Uses dynamic rate adapter according to instantaneous rates demanded. To support extended range and noisy ennvironment WLAN uses dynamic rate shifting to automatically adjust to radio channel.
Segmentation and assembly
Voice and data packets of different users in aWWAN assembled into bigger WLAN packets. For WLAN to WWAN voice and data packets are segmented into smaller WWAN packets based on instantaneous WWAN packet length.
Error detection and correction
Segmentation and assembly results in wrong order of delivery or corruption of packets. IEEE 802.11b WLAN employs only error detection, whereas HIPPERLAN provides both detection and correction. Error correcting codes frequently used in WWAN.
Packet clustering Subdivides packets into sub streams. Typically, a queuing mechanism is used to determine high and low priority queues and buffer sizes for a given transmission rate.
Estimation of dynamic Qos parameters
Estimates instantaneous QoS parameters: delay, BER, jitter and throughput. Packets scheduled according to priority and passed to comparator which compares these parameters with QoS bounds specified at the beginning of transmission. N/W adjusts QoS dynamically to guarantee the preferred bounds.
In the case of a completely wireless scenario (scenario 3), the interworking function occurs at the WIWL. Both horizontal and vertical QoS mapping occur. Packet classification and error detection and correction are handled at the source. The vertically mapped QoS parameters from the source are mapped horizontally at the destination. The destination protocol stack handles rate adaptation and queuing. The interworking function is identical in all scenarios. The various stages in the interworking are summarized in Table 1. SIMULATION: EXPERIMENTAL TEST-BED The simulation is performed only for data packets. The simulation test bed for experimental purposes is set up as follows: 10 packet frames are generated randomly with a constant sample time of 4 ms, each frame consists of one packet with a frame delay of 20 ms. Each frame corresponds to the transmission of a single user. Thus, the system at any time has a maximum of 10 users. A BER of is assumed. FEC is performed using a 7-bit Hamming code when the BER exceeds for WWAN packets. This is to ensure minimal computational overhead and to decrease delay. A CCIIT CRC-16 frame check sequence error detection polynomial is applied for the WLAN packets.
610−
310−
5

Mobility Conference 2004
A maximum permissible buffer size of 1024 bytes is used. The packets with earliest deadline (determined from the time stamp in the packet) are placed in the high priority queue. When the buffer of the high priority queue is full, the remaining packets are transferred to the low priority queues. A minimum QoS guarantee of 90% relative to the ideal QoS parameter values is assumed. The ideal QoS parameters for data rate, jitter and delay on WWAN are 16-64 Kbps, less than 0.5msec and 10-20msec respectively. In case of WLAN the date rate is between 10-12 Mbps while other parameters are unchanged. The comparator compares the calculated QoS parameter values with the guarantee value. If the calculated values disagree with the guarantee value, the transmission rate and the queue parameters are adjusted dynamically until close agreement is reached. If there is more than 50% disagreement, the packet is discarded by the network manager.
DISCUSSION OF SIMULATION RESULTS
Average Delay versus Average Packet Length (Fig. 3)
The delay increases nonlinearly as the packet length increases. For WWAN to WLAN transmission the packet length affects the assembly and FEC overhead. Longer packets may decrease the assembly overhead but the FEC overhead increases considerably as the packet size increases. Thus, a sudden increase in delay occurs when the packet size exceeds 700 bits. For WLAN to WWAN transmission, segmentation of longer packets introduces an additional delay but the delay for error detection does not increase significantly. Thus, we may expect a gradual increase compared to WWAN-WLAN transmission.
6
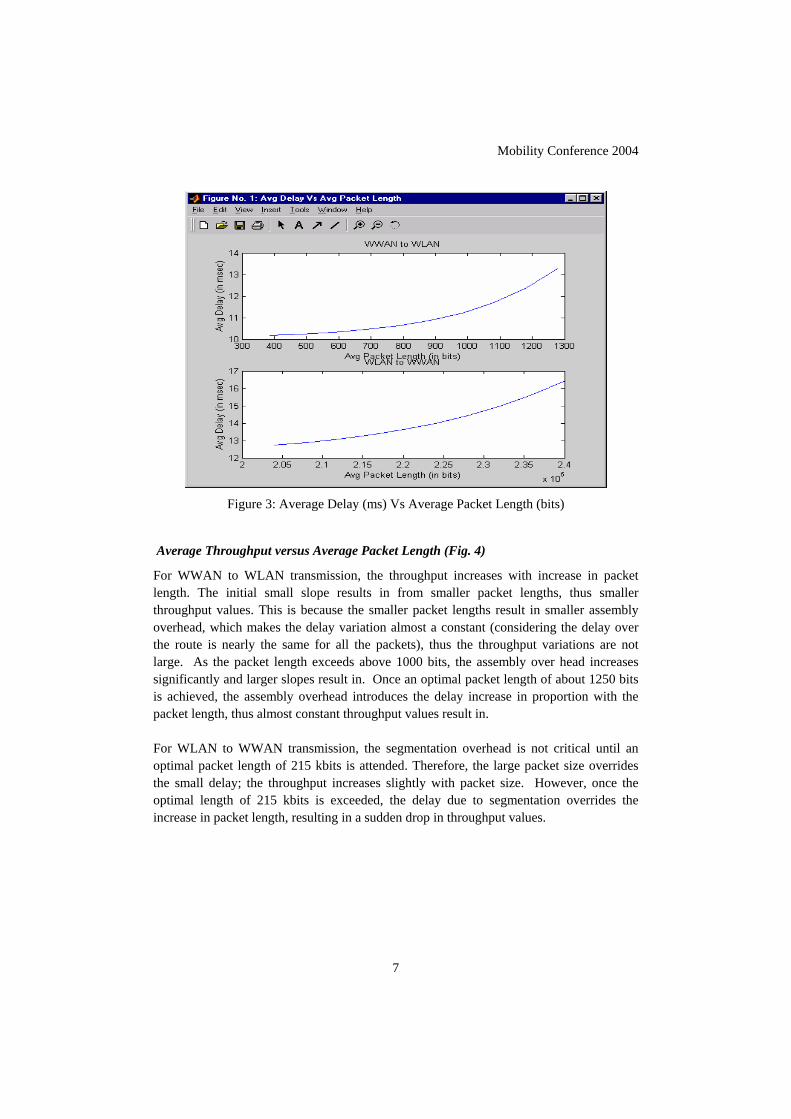
Mobility Conference 2004
Figure 3: Average Delay (ms) Vs Average Packet Length (bits)
Average Throughput versus Average Packet Length (Fig. 4)
For WWAN to WLAN transmission, the throughput increases with increase in packet length. The initial small slope results in from smaller packet lengths, thus smaller throughput values. This is because the smaller packet lengths result in smaller assembly overhead, which makes the delay variation almost a constant (considering the delay over the route is nearly the same for all the packets), thus the throughput variations are not large. As the packet length exceeds above 1000 bits, the assembly over head increases significantly and larger slopes result in. Once an optimal packet length of about 1250 bits is achieved, the assembly overhead introduces the delay increase in proportion with the packet length, thus almost constant throughput values result in. For WLAN to WWAN transmission, the segmentation overhead is not critical until an optimal packet length of 215 kbits is attended. Therefore, the large packet size overrides the small delay; the throughput increases slightly with packet size. However, once the optimal length of 215 kbits is exceeded, the delay due to segmentation overrides the increase in packet length, resulting in a sudden drop in throughput values.
7

Mobility Conference 2004
Figure 4: Average Throughput (kbps) Vs Average Packet Length (bits) Average Throughput versus Average Delay (Fig.5) For WWAN to WLAN transmission, the increase in delay is not very critical as the throughput increases. Once an optimal delay of 11ms is exceeded, it significantly affects the throughput for a constant average packet length. Thus, a gradual decrease in throughput results in. For WLAN to WWAN transmission, the delay is not a critical factor in determining throughput until the optimal delay of 13ms is reached. Once this delay is exceeded, a sharp decrease in the throughput results in, as the increase in delay overrides any changes due to rate or packet length. This is because the segmentation induces a considerable delay for larger packets although average packet length remains constant. CONCLUSIONS The study focuses on the QoS for data and voice in the interoperable WLANs and WWANs. Architecture was introduced so that there is seamless integration between WLAN and WWAN. The protocol stacks and their functionality for the new architecture were discussed. The protocol stack includes the Interworking Layer functionality. This provides the interworking between different technologies. The architecture will meet the rapidly changing trends and demands of the wireless market and make anywhere, anytime communication a reality. The various factors involving in deciding the QoS parameters for the system were studied quantitatively. A simulation test bed was set-up for experimental and verification purposes. The results of the simulation for data packets have been plotted. The simulation
8

Mobility Conference 2004
shows that delay due to segmentation and assembly is an important deciding factor for the throughput of the system. Also, the effect of packet length on the system throughput has been studied. This study can be extended to the quality of service of video transmission.
Figure 5: Average Throughput (kbps) Vs Average Delay (ms)
REFERENCES
[1] Lim, “A Medium Access Control Protocol for Voice/Data Integrated Wireless CDMA Systems,” ETRI Journal, Vol. 23, No.2, June 2001
[2] V. Marbukh, N. Moayeri, “A Framework for Throughput and Stability Analysis of DS-CDMA Network,” IEEE Trans. On Vehicular Tech., May 1999.
[3] J. L. Sobrinho, A.S. Krishnakumar, “Distributed Multiple Access Procedures to Provide Voice Communications over IEEE 802.11 Wireless Networks,” IEEE Globecom’96.
[4] T. Yamazaki, J. Matsuda, “On QoS mapping in Adaptive QoS management for Distributed Multimedia Applications,” Proc. ITC-CSS’99, Vol. 2, July 1999, pp 1342-1345
[5] R. Becher, M. Dillinger, M. Haardt, W. Mohr, “Broad-band Wireless Access and Future Communication Networks,” IEEE Proc., Vol. 89, Jan. 2001
[6] L.A. DaSilva, “QoS Mapping along the Protocol Stack: Discussion and Preliminary Results,” Proceedings of IEEE International Conference on Communications (ICC'00), June 18-22, 2000, New Orleans, LA, vol. 2, pp. 713-717
9

Mobility Conference 2004
[7] Lataoui, T. Rachidi, L.G. Samuel, S. Gruhl, R.H. Yan, “A QoS Management Architecture for Packet Switched 3rd Generation Mobile Systems,” Networld+Inerop2000 – Engineers Conference on Broadband Internet Access Technologies Systems and Services, May 10, 2000
10
Mobility Conference 2004
A RELIABLE AND RECONFIGURABLE TRANSPORT LAYER PROTOCOL FOR MOBILE NETWORKS
TAN WANG, AJIT SINGH AND AFZAL MAWJI Department of Electrical and Computer Engineering
University of Waterloo Waterloo, Ontario, Canada N2L 3G1
The paper presents a transport layer protocol called RRTP, which is more suitable for today’s mobile (cellular or satellite) network environments. Previous research has established that TCP is not ideal for mobile networks. The present research attempts to address this problem by designing a user-level, reconfigurable, TCP-friendly transport layer protocol that runs atop UDP and utilizes state-of-the-art LDAs (Loss Differentiation Algorithms) to adapt to various network configurations. The paper describes the design and implementation of the RRTP protocol. Several representative network configurations are used to benchmark the performance of RRTP against various improved versions of TCP in terms of network throughput and congestion loss rate. It is observed that under normal operating conditions, RRTP has a performance advantage of 30% to 700% over TCP in lossy, wireless environments as well as high bandwidth, high latency networks. In addition, while various reputable and improved variants of TCP provide better performance under specific network environments, RRTP is able to provide superior performance over a wide range of network environments. INTRODUCTION During the past few years, wireless networking has really taken off the ground as an increasing number of corporate as well as individual users embrace the convenience and freedom of mobile computing. One fundamental issue with wireless computing is that the data loss rate due to transmitting medium characteristics is significantly higher in wireless environments than in conventional wired networks. As a result, it is critical for the underlying network technologies to correctly handle these loss situations in order to maximize network throughput. TCP has been the dominant transport layer protocol for reliable network computing for many years, but there are some important situations where the performance of TCP can be dramatically improved. For instance, as Balakrishnan et al. [1] have pointed out, TCP treats all losses as signs of network congestion. Consequently, deploying TCP over a wireless network, where wireless losses instead of congestion losses are commonplace, will result in poor performance. In addition, TCP is also ill suited for high bandwidth high latency networks [2]. In this paper, we propose a novel solution that targets these two categories of network environments while still providing competitive performance in other environments. Instead
1
Mobility Conference 2004
of taking a generalist approach as TCP did, RRTP takes a specialist approach by incorporating reconfigurable capabilities that allow the application developers to tailor the protocol to the network platform of interest. This is done by having a set of parameters that can be configured by the application developers either at application compile time or just prior to the execution time. The work is based on the observation that, in many cases, the application’s developers or users know the network environment in which it will be used. In such cases, it is possible to achieve fast adaptive convergence rather than taking TCP’s approach of “one size fits all” in adapting to different networks. RELATED WORK AND MOTIVATIONS Our research concentrates on end-to-end solutions since they closely match the design principle of TCP. In the past, a few researchers have proposed end-to-end solutions to improve the performance of TCP in certain cases. Casetti et al. [4] proposed an end-to-end modification of the TCP congestion window algorithm, called TCP Westwood. Sinha et al. [6] proposed a rate-based reliable transport protocol called WTCP, which is able to differentiate between wireless and congestion losses. An important distinction between previous approaches and RRTP is that none of the previous solutions consider the network programmer as part of the system. But in many cases, the application programmers may have very accurate knowledge of the characteristics of the network and this knowledge can be very beneficial in improving the performance of the protocol. Consequently, it is our intention to put the system developers into the picture and properly utilize their knowledge to enhance the performance of RRTP. This is done through the parameterized reconfiguration of RRTP, which is further discussed in the next section of this paper. ALGORITHMS AND IMPLEMENTATION Congestion Control Mechanism According to Chiu and Jain [9], the LIMD (Linear Increase Multiplicative Decrease) approach to congestion control is the only paradigm that will settle down to a state of fairness with an arbitrary starting send rate. RRTP uses a rate-based, LIMD algorithm that reacts to incipient congestion and consequently limits the rate of traffic flow below the maximum available bandwidth most of the time. We believe that this is a better approach than TCP’s slow-start, congestion window adjustment because RRTP is able to avoid serious network congestions by reacting to early signs of channel saturation. RRTP implements a 4-way handshake connection establishment similar to SCTP’s [8] connection establishment mechanism in order to avoid the DoS (Denial of Service) phenomenon suffered by TCP. During the handshaking process, the nominal value of network RTT (Round Trip Time) is determined, which is refined over the course of the connection. Once the connection is established, the sender can automatically carry out network capacity probing and bandwidth estimation for the purpose of determining the
2
Mobility Conference 2004
ideal send rate by sending out two successive packets. Here, we make the assumption that the two communicating machines are free of other CPU intensive tasks so that the RRTP processes are able to get the required CPU cycles for the purpose of initial capacity probing. Several other variants of TCP also depend on similar assumptions. Let us suppose the send interval of the two successive packets is X milliseconds. Once the receiver gets both packets, it will advertise to the sender the observed receive interval (Y milliseconds) for the two packets. The sender will calculate the initial send rate based on max(X, Y). Alternatively, the reconfigurable nature of RRTP allows the application that uses RRTP to specify the initial send rate and thus allows for a much faster convergence of the send rate to the known network throughput capacity. Proper utilization of the application developer’s knowledge of the network characteristics usually translates into large performance gains at the beginning of the network connection and the effects last for the lifetime of the connection. Packet interval time is a key parameter used in RRTP’s rate-based congestion control mechanism. Both a long-term running average and a short-term running average are kept for this parameter in order to carry out accurate heuristics for dynamic send rate adjustment. Packet interval times, along with loss differentiation algorithms, are used extensively in the determination of the network path congestion status. The send rate adjustment is carried out using the following algorithm: first, we define an additive increase factor α with different initial values based on the type of network RRTP is operating on as well as a multiplicative decrease factor β with an initial value of 0.05. If the send/receive rate ratio is greater than 1.05, then RRTP is operating at a level above the maximum network throughput capacity. Our protocol treats such situations as signs of incipient congestion and will carry out the following adjustment: SendRatenew = SendRateprev * max((1-β), 0.5). The value of β will be doubled for every consecutive multiplicative decrease phase with the upper bound of 1-β > 0. Here we take max((1-β), 0.5) to be the adjustment factor to make sure that the rate reduction factor will never drop below 0.5. In other words, when RRTP first detects signs of incipient congestion, it gently reduces the send rate with a small value of β. If the incipient congestion persists over several epochs, the value of β will be doubled every epoch to more effectively suppress the incipient congestion. On the other hand, if the send/receive rate ratio is less than 0.95, we are operating well below the maximum network capacity. This translates into a linear increase phase in which SendRatenew = SendRateprev + α. In addition, β is reset to its initial value of 0.05. When severe congestions is detected, RRTP aggressively throttles the send rate by 50% for each of the consecutive congested epochs to avoid network collapse. For the case in which the user misconfigures the initial send rate, our algorithm is smart enough to detect that. Send rate convergence is still guaranteed in this scenario due to the nature of our rate control mechanism.
3
Mobility Conference 2004
Reliability To ensure reliable transport, the receiver sends two kinds of acknowledgements to the sender: cumulative acknowledgements, and negative acknowledgements. Negative acknowledgements are coupled with timeout mechanisms, which utilize the measured RTT values. Cumulative acknowledgements serve as confirmation of received packets during normal network operations. Loss Differentiation Algorithm Several papers published on TCP performance enhancements over wireless networks have considered sender-based loss differentiation. RRTP, on the other hand, is based on the intuition that the receiver usually has more accurate and timely knowledge of packet losses. Consequently, the receiver is responsible for figuring out the cause of a particular packet loss and informing the sender to take the appropriate action. Wireless last hop networks differ from wireless LAN networks in terms of congestion and packet loss characteristics. As a result, RRTP uses different loss differentiation algorithms for these two wireless platforms. For wireless last hop networks, RRTP uses a variant of the LDA proposed by Biaz and Vaidya [5]. There are several assumptions that are made here. First, the wireless link has the lowest bandwidth and thus is the bottleneck of the network. Second, the wireless base station serves strictly as a routing agent between the wired and the wireless network. As one can see quite easily, with the big difference in bandwidth between wired LAN (100 Mbps) and wireless WAN or satellite (around 19.2 Kbps), packets traveling on the wired network would get congested at the base station while adapting to the lower send rate imposed by the wireless network. As a result, the packets transmitted on the wireless connection tend to be clustered together. If a packet loss occurs due to random wireless transmission errors, the receiver will observe a certain time interval in which the packet is expected but not received. Such an event can be interpreted as a sign of wireless loss due to transmission errors. Using this reasoning, we can distinguish between wireless losses from congestion losses using the following heuristic: Let Tmin be the minimum observed packet interval for the receiver and Tseparation be the interval between the time when the last correct packet is received and the time when the lost packet is detected by the receiver. Suppose the nth packet is lost. The loss is characterized as a wireless loss if the following relation holds: (n + 1) Tmin < Tseparation < (n + 1.75) Tmin. The numbers we choose are experimentally determined to cause the lowest misclassification rate between congestion and wireless losses. For a wireless LAN topology, the assumptions made in the previous situation are usually not true. The conventional wired LAN is not much faster than a high-speed wireless LAN. As a result, packets don’t necessarily travel in close succession on the wireless LAN connection. Consequently, the Biaz [5] LDA will not perform as well as in wireless last hop topology. An alternative approach needs to be used here to distinguish between
4

Mobility Conference 2004
wireless and congestion losses. The Spike scheme proposed by Tobe et al. [7] can be useful in this situation. The Spike scheme is just as effective as the Biaz scheme in wireless last hop network configurations. When used in wireless backbone/LAN topology, the Spike scheme performs significantly better than the Biaz scheme in terms of loss differentiation accuracy. The reason for this performance advantage is mainly due to the fact that the Spike scheme uses ROTT (Relative One-way Trip Time) measurements as congestion indicators. ROTT is the time between the moment when the packet is sent and the moment when the packet is received and it is measured at the receiver. During periods of smooth traffic flow, ROTT measurements will remain relatively stable. When the network starts to become congested, the receiver will detect rising ROTT values. The default behavior of RRTP in this situation is for the receiver to issue an explicit incipient congestion notification to the sender to throttle the send rate. In the event that the rise in ROTT values is coupled with packet losses, the receiver can be confident that the packet losses are caused by congestion. However, if the packet losses are not accompanied by a rise in ROTT value, the receiver will categorize these losses as due to wireless errors. As discussed above, Biaz and Spike schemes work well on different wireless network platforms. Depending on the actual wireless network in use, RRTP selects the appropriate LDA to achieve optimum performance. Reconfigurability The ability to reconfigure in order to adapt to different network platforms is the key feature that sets RRTP apart from other protocols of its kind. Since RRTP is designed to treat application developers as part of the system, it is more visible to the application than other protocols. Reconfigurability is built into RRTP by means of the parameterization of a set of key network parameters listed in Table 1.
Table 1: User-configurable Parameters
Parameters Meanings SendRatenominal Normal channel capacity
RoundTripTimenominal Normal end to end latency LossRatenominal Characteristic data loss rate
The system also provides the programmer with typical sets of parameter values that are representative of various network environments such as CDMA, GPRS, or 802.11 networks. It is also possible to read the network parameters from a file just prior to application execution. Finally, even when a user specifies incorrect or imprecise initial values for the parameters, the protocol is able to refine these values over the course of actual RRTP usage on the network.
5

Mobility Conference 2004
EXPERIMENTAL SETUP AND RESULTS For the purpose of evaluating RRTP, we study its behavior under several representative network environments using the network simulation tool ns2 [3]. The simulation environments (shown in Figure 1(a) to 1(d)) include: wireless last-hop topology, which is representative of CDMA and satellite network scenarios; wireless backbone topology, which corresponds well to wireless LAN such as 802.11 networks; as well as long fat pipe topology, which is often found in intercontinental, high bandwidth high latency networks. From these studies, the throughput of RRTP is compared to the throughput of TCP Reno, New Reno, and Vegas in each case. CDMA at 1% Loss
0
50
100
150
200
250
300
1 10 20 30 40 50 60 70 80 90 100
Tim e (sec)
Tota
l Pac
kets
Sen
t
Reno
New Reno
Vegas
RRTP
High Speed High Latency Network at 1% Loss
0
500
1000
1500
2000
2500
3000
3500
4000
1 2 3 4 5 6 7 8 9 10
Tim e (sec)
Tota
l Pac
kets
Sen
t
Reno
New Reno
Vegas
RRTP
Satellite at 1% Loss
0
500
1000
1500
2000
2500
3000
3500
1 10 20 30 40 50 60 70 80 90 100
Time (sec)
Tota
l Pac
kets
Sen
t
RenoNewRenoVegasRRTP
Figure 1(a): Protocol Performance for High Speed High Latency Environment with 1% Loss Rate
Our simulation results demonstrate that signithe user’s experience with wireless netwcongestion avoidance and loss differereconfigurability is found to be of key imporThis is especially evident in the case of long
Figure 1(b): Protocol Performance for CDMA Environment with 1% Loss Rate
Wireless LAN at 1% Loss
0
200000
400000
600000
800000
1000000
1200000
1400000
1 2 3 4 5 6 7 8 9 10 11
Tim e (sec)
Tota
l Pac
kets
Sen
t
Reno
New Reno
Vegas
RRTP
Figure 1(c): Protocol Performance for Satellite Environment with 1% Loss RateFigure 1(d): Protocol Performance for Wireless LAN Environment with 1% Loss Rate
ficant improvements can be made to enhance orking through the appropriate usage of
ntiation algorithms. In addition, user tance for the superior performance of RRTP. fat pipe networks. By allowing the user to
6

Mobility Conference 2004
reconfigure RRTP to adapt to high bandwidth high latency networks, the network utilization can be increased tremendously. COMPARISON WITH RELATED WORK AND CONCLUSIONS First, it should be noted from the above experimental results that the different versions of TCP perform better under different network environments. However, RRTP matches or outperforms all the versions of TCP in most cases. Second, since RRTP is a UDP based user-level protocol, it can be deployed immediately while newer variants of TCP may take years before they are implemented inside the kernels of even the most popular operating systems. Unlike previous related works, RRTP is reconfigurable in nature. Thus, its superior performance is not restricted to any particular network environment. In a way, RRTP tries to be a generic protocol like TCP. The main deviation from TCP’s design philosophy is that RRTP takes advantage of the application developer’s knowledge of the network. By doing so, RRTP can perform just as well as the various network specific solutions discussed under related works in section 3 while still remaining a generic protocol. REFERENCES [1] H. Balakrishnan, V. Padmanabhan, S. Seshan, and R. Katz, “A comparison of
mechanisms for improving TCP performance over wireless links,” IEEE/ACM Transactions on Networking, Vol.5, no. 6, (1997), pp 756-769.
[2] V. Jacobson, R. Braden, and D. Borman. TCP Extensions for high performance. RFC 1323, May 1992.
[3] ns-2 network simulator (ver 2). LBL, URL: http://www.isi.edu/nsnam/ns. [4] C. Casetti, M. Gerla, S. Mascolo, M.Y. Sanadidi, and R. Wang “TCPWestwood:
Bandwidth Estimation for Enhanced Transport over Wireless Links,” Proc. ACM Mobicom 2001 Conference, Rome, Italy, (2001), pp 287-297.
[5] S. Biaz and N. Vaidya, “Distinguishing congestion losses from wireless transmission losses: A negative result,” Proc. 7th Intl. Conf. on Computer Communications and Networks, Lafayette, LA, (1998).
[6] P. Sinha, T. Nandagopal, N. Venkitaraman, R. Sivakumar, and V. Bharghavan. “WTCP: A Reliable Transport Protocol for Wireless Wide-Area Networks”, Wireless Networks 8, (2002), pp 301-316.
[7] Y. Tobe, Y. Tamura, A. Molano, S. Ghosh, and H. Tokuda, “Achieving moderate fairness for UDP flows by path-status classification,” in Proc. 25th Annual IEEE Conf. on Local Computer Networks (LCN 2000), Tampa, FL, (2000), pp. 252–261.
[8] Stream Control Transport Protocol. URL: http://www.sctp.de/sctp.html.
7

Mobility Conference 2004
[9] D. Chiu, and R. Jain, “Analysis of the Increase/Decrease Algorithms for Congestion Avoidance in Computer Networks”, Journal of Computer Networks and ISDN Systems, vol. 17, no. 1, (1989).
8

AR POST-IT: A LOCATION DEPENDENT MESSAGING SYSTEM
SIDDHARTH SINGH, ADRIAN DAVID CHEOK, GUO LOONG NG, FARZAM FARBIZ
Department of Electrical & Computer Engineering, National University of Singapore, 10 Kent Ridge Crescent
Singapore, 119260
In this paper we describe a low cost, electronic, location based messaging system that can be deployed easily without the need for specialized location tracking mechanisms. Our system complements traditional messaging systems such as paper Post-It notes, emails and Short Messaging Service (SMS). We make use of Augmented Reality (AR) for two purposes - location detection, and enhancing the range of messages that can be sent. Our system comprises mobile phones, fiducial paper markers and a messaging server. Mobile phones are used to view the received messages and can be used to send messages as well. The messages can also be sent over the internet through a web application. The sender can specify the location to which the message should be posted. Once the message has been posted, it is stored on the messaging server until the receiver arrives at the specified location. Paper markers set up at different locations are used for providing location cues. The receiver can use his mobile phone’s digital camera to view the marker and receive an AR message. INTRODUCTION Paper has long been used by humans to communicate with one another. Using postal mail, people in far away places communicated with each other. Paper was also used within offices for communication among colleagues - typically by scribbling short messages and leaving it on the desk of colleagues. The use of paper for posting quick messages came into vogue through the use of Post-It notes which were introduced by 3M [1] in 1980. Over the last few years, the dominant mode of communication has changed from paper-based to electronic based. Electronic mails are much faster and therefore preferred over the slow paper based postal mails. Time magazine has estimated that 776 billion email messages were sent in 1994, 2.6 trillion sent in 1997, and 6.6 trillion sent in 2001 [2]. Another popular electronic messaging system is the mobile phone based SMS. These SMS messages can be at most 160 characters long, and allow rapid exchange of messages between mobile phone users. In spite of these advantages, electronic messages have not entirely replaced paper based messages. In a typical office, one can find Post-it notes on walls, printouts of articles,
Mobility Conference 2004
1

emails on desks. In the book, The Myth of the Paperless Office, Harper et al. [3] mention that although different digital tools are available, paper is still being used in the following ways:
• As a tool for managing and coordinating action among co-workers in a shared environment.
• As a medium for information gathering and exchange. • As an artifact for information gathering and exchange. • As a means of archiving information for groups of co-workers.
A vital, but often overlooked, advantage of paper is that it is easy to stick at different locations and thus enable spatial messaging. The paper note is also less intrusive upon a person’s privacy, since it is delivered only where it is meaningful and can be acted upon. Messages can be posted in the relevant spatial context and thus are easy to remember. For example, reminders to buy something on the way to the office can be posted onto the car’s dashboard; reminders to reheat a refrigerated dish can be posted onto the refrigerator. When sending digital reminders, this important spatial context is lost. But paper has the following drawbacks [3]:
• Paper must be used locally and cannot be remotely accessed. • Paper occupies physical space and thus requires space for its use and storage. • Paper requires physical delivery. • A single paper document can be used only by one person at a time. If more than
one person tries to read the same document, it is inconvenient. • Paper documents can only be used for the display of static visual markings.
They cannot display moving images or play sounds. Moreover, paper messages do not support privacy. A message left on someone’s desk can be read by all, unless it has been sealed in an envelope. Even then it is possible for anyone to simply tear off the envelope to read the message. Clearly, electronic messages which are tied to some location would be a welcome addition to our repertoire of electronic communication methods. This has motivated us to come up with a messaging system that combines the advantages of paper-based Post-It notes and the electronic messages. In other words, not only should the messages be digital, to allow remote posting and fast delivery, but also postable just as Post-It notes. In this paper we describe an augmented reality-based electronic messaging system that allows the sender to also specify the location where the message should be received. Augmented Reality refers to a system in which the real physical environment of a person is augmented with virtual computer-generated information, creating an enhanced
Mobility Conference 2004
2
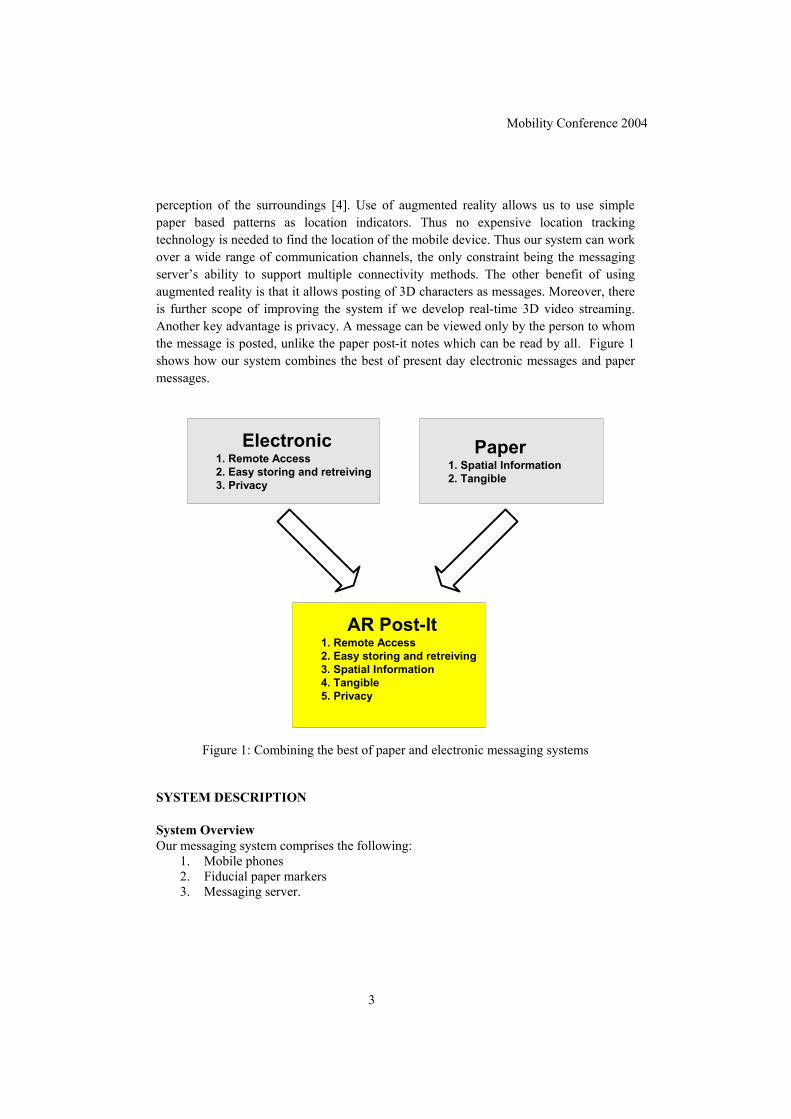
perception of the surroundings [4]. Use of augmented reality allows us to use simple paper based patterns as location indicators. Thus no expensive location tracking technology is needed to find the location of the mobile device. Thus our system can work over a wide range of communication channels, the only constraint being the messaging server’s ability to support multiple connectivity methods. The other benefit of using augmented reality is that it allows posting of 3D characters as messages. Moreover, there is further scope of improving the system if we develop real-time 3D video streaming. Another key advantage is privacy. A message can be viewed only by the person to whom the message is posted, unlike the paper post-it notes which can be read by all. Figure 1 shows how our system combines the best of present day electronic messages and paper messages.
Electronic1. Remote Access2. Easy storing and retreiving3. Privacy
Paper1. Spatial Information2. Tangible
AR Post-It1. Remote Access2. Easy storing and retreiving3. Spatial Information4. Tangible5. Privacy
Figure 1: Combining the best of paper and electronic messaging systems SYSTEM DESCRIPTION System Overview Our messaging system comprises the following:
1. Mobile phones 2. Fiducial paper markers 3. Messaging server.
Mobility Conference 2004
3

Figure 2 outlines how messages are posted and retrieved. In step 1, messages are posted to a remote user using either the phone, or a web application. The sender also specifies the target location of the message. This message is then stored on the messaging server (step 2). When the intended receiver is within the target location he can use his mobile phone’s camera to look at the fiducial marker. The location information is thus captured (step 3) and the appropriate message is downloaded to the receiver’s phone (step 4). This message is then displayed on the receiver’s phone (step 5).
Internet Wireless
Wireless
Step 1: Messagesposted using thephone, or a web
application
Step 2: Messagesstored on the
server until deletedby the recepient or
sender
Step 3: Locationinformation captured
using image of thefiducial marker
Step 5: Messagedisplayed on the
user's phone
Step 4: Locationinformation sent toserver and message
retrieved
PC
Mobile phone
Mobile phone
Messaging Server
Figure 2: Posting and receiving messages.
Implementation Details We have only used off-the-shelf devices in our system. The mobile phone was a Sony-Ericsson P800 running version 7.0 of the Symbian OS. The standard model of the P800 has a built-in camera and support for Bluetooth communication. We implemented our server on a Windows XP machine equipped with LAN and Bluetooth connectivity. We chose to use Bluetooth as the wireless communication channel, since it is short range and
Mobility Conference 2004
4
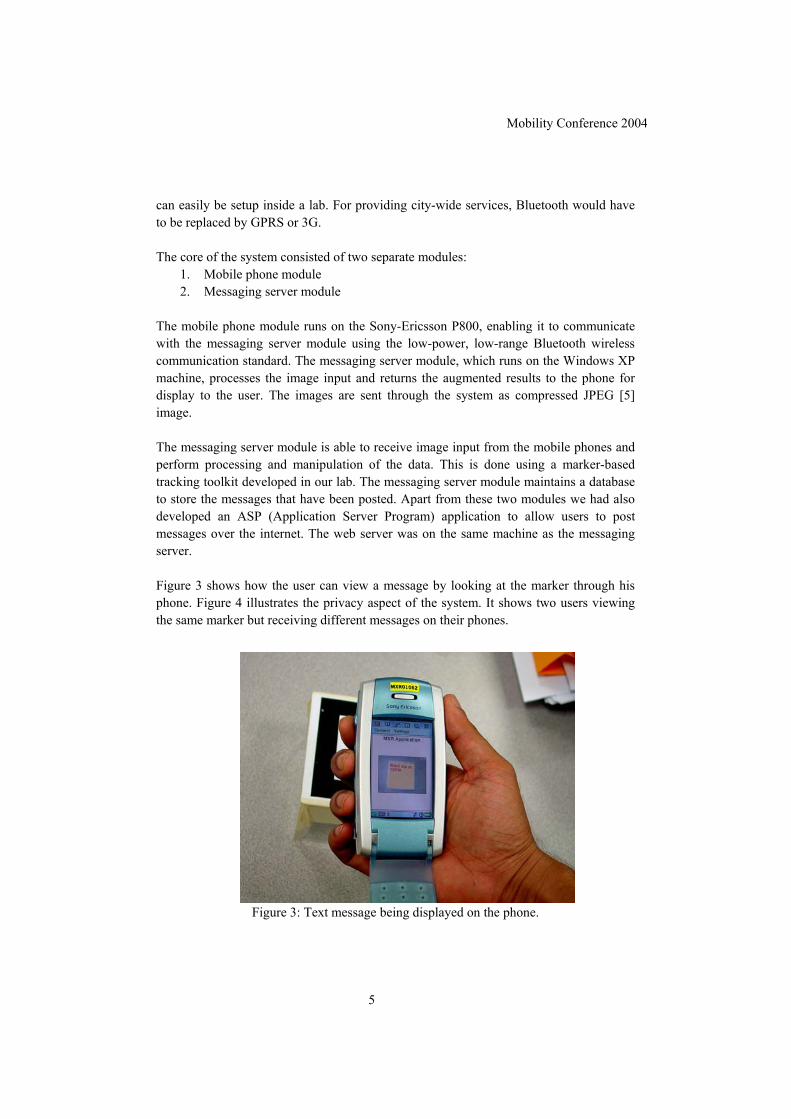
can easily be setup inside a lab. For providing city-wide services, Bluetooth would have to be replaced by GPRS or 3G. The core of the system consisted of two separate modules:
1. Mobile phone module 2. Messaging server module
The mobile phone module runs on the Sony-Ericsson P800, enabling it to communicate with the messaging server module using the low-power, low-range Bluetooth wireless communication standard. The messaging server module, which runs on the Windows XP machine, processes the image input and returns the augmented results to the phone for display to the user. The images are sent through the system as compressed JPEG [5] image. The messaging server module is able to receive image input from the mobile phones and perform processing and manipulation of the data. This is done using a marker-based tracking toolkit developed in our lab. The messaging server module maintains a database to store the messages that have been posted. Apart from these two modules we had also developed an ASP (Application Server Program) application to allow users to post messages over the internet. The web server was on the same machine as the messaging server. Figure 3 shows how the user can view a message by looking at the marker through his phone. Figure 4 illustrates the privacy aspect of the system. It shows two users viewing the same marker but receiving different messages on their phones.
Figure 3: Text message being displayed on the phone.
Mobility Conference 2004
5

Figure 4: Different messages displayed on different phones. Conclusion In this paper we described a messaging system that combines the benefits of electronic and paper messaging. Users will be able to post electronic messages to different locations just like everyday paper notes. The simple message posting and retrieval mechanism makes it intuitive for a casual user to use our system. The distinguishing features of our system are:
• Location based messaging. • Use of AR for message enhancement which allows posting of 3D characters
in addition to normal text messages. • User’s privacy is protected even though messages are “posted” to locations since
the message will be displayed only to the intended recipient. This is an improvement over paper Post-it notes.
• Low setup cost, since no sophisticated tracking technique is used. REFERENCES [1] http://www.3m.com. [2] Gwynne S., Dickerson J., “Lost In the E-Mail”, Time Magazine, (April 21, 1997). [3] Sellen A. J., Harper R. H., “The Myth of the Paperless Office”, The MIT Press,
Cambridge, Massachusetts, (2002). [4] Azuma R., Baillot Y., Behringer R., Feiner S., Julier S., MacIntyre B., “Recent
Advances in Augmented Reality”, IEEE Computer Graphics and Applications, Vol. 21, No. 1, (2001), pp 34-47.
[5] http://www.jpeg.org.
Mobility Conference 2004
6

Mobility Conference 2004
PERFORMANCE EVALUATION OF WLAN-BASED POSITIONING SOFTWARE
DR. LEE YEE JIN ANDREW
BARRY RINDRAJI SETIAWAN PUTRA ASSOC. PROF. LAW CHOI LOOK
Positioning and Wireless Technology Centre, Nanyang Technological University Singapore
JOSHUA LEE
Technology Group, Infocomm Development Authority of Singapore The use of WLAN-based positioning software allows one to easily offer location-aware value-added services in areas where WLAN infrastructures are already available. This paper evaluated one such positioning software which uses Bayesian probabilistic model and RSSI metrics gathered from fixed reference access points (APs). Hidden Markov Model algorithm is further utilized to increase accuracy through the use of the manufacturer’s proprietary Rail Tracking™ algorithm. In realistic environments, the dynamics of human activity will add to the complexity of the radio channel signal strengths. This paper investigated functions in the positioning software that determine the accuracy of tracking, and the application’s impact as a tracking tool in realistic environments. 1.0 INTRODUCTION Locating objects and people outdoors is becoming common using technologies such as Global Positioning System (GPS). However, accurately estimating location in indoor environment remains a complex problem due to indoor channel characteristics. The use of existing wireless LAN (WLAN) infrastructure would enable a low cost implementation of indoor positioning as described in [1,2]. The increasing trend to deploy WLANs in commercial and public areas motivates our research. Gartner Dataquest [3] forecasted the wireless hotspot industry to generate over US$9 billion by 2007 with 31 million frequent users and 35 million infrequent users worldwide (0.7 probability). The number of WLAN hotspots in Singapore, which are deployed in cafes, restaurants, shopping centres and many other public and commercial areas, totaled about 600, at the time of writing. We foresee the application of WLAN for indoor positioning to be a strong driver for further adoption of WLAN infrastructure by retail or office building developers and managers. This is due to the fact that location-aware context would provide tailored value-added services including:
• Guided tours with wireless PDAs in museums and exhibitions. • Location specific advertisement by sending location based information to users. • Locating the nearest restaurant/bookstore or a friend on campus.
1

Mobility Conference 2004
• Finding personnel or equipment on demand. • Locating and guiding wireless LAN users out of buildings under fire incidents. • Billing based on location.
We evaluated one such WLAN-based positioning software [4]. It uses a Markovian algorithm to provide calculation and error correction to reduce errors. As a commercial product, high accuracy in positioning, ease of implementation and real time tracking capability are important factors. We investigated the performance of the positioning engine, categorised according to the accuracy of calibration and tracking. A fundamental problem of Wi-Fi positioning is implementing the right inferring location algorithm to accurately position a user in a dynamic wireless environment [5], which changes due to movement of people in the background. As described by the manufacturer, the positioning engine is typically ran as a standalone server, managed by a software manager, and accessed by client applications using a Software Development Kit (SDK) to read the clients’ device coordinates. The positioning engine can be fully integrated with third party software or hardware applications. The positioning engine features up to 2-3m average accuracy with 1-3 AP signals, is able to locate over 100 devices per second on a typical desktop PC, with up to 1m average accuracy using 4-6 access point signals. The positioning engine requires several procedures to be fulfilled before it can operate in a given area. A map image of the area being tracked is needed and requires a minimum accuracy of 30 dots per meter in normal viewing scale 1:1. Supported formats are PNG, JPG and BMP. Site calibration is done using a stand-alone manager application in the software. It is used for drawing the Tracking rails, recording site calibration data, tracking wireless devices on map, and statistically analyzing the positioning accuracy, all on the map provided. In this study, we will provide an in depth investigation on the installation and calibration of the positioning software in a static and dynamic environment. We will look at the effectiveness of multiple APs, accuracy due to calibration step sizes, accuracy of different update intervals, and accuracy analysis of position sampling intervals. All these analysis utilise the software manager’s accuracy analysis function. 2.0 EXPERIMENTAL SETUP In order to evaluate the accuracy and practicality of the positioning engine under different scenarios, two different locations were chosen as test locations with different WLAN infrastructure setup. We chose the 4th floor at Nanyang Technological University’s (NTU’s) Positioning and Wireless Technology Centre (PWTC) as the first test area, which is a controlled closed room environment with 1-5 APs configured to transmit at different channels. All APs use omni directional antennas. In this setup, the environment is a static environment. The APs are placed in a 20x10m area at a height of 1.5 meters as
2

Mobility Conference 2004
depicted in figure 1. The accuracy analysis is performed in the assembly room measuring 10x10m with sample points spaced ranging from 1 meter to 5 meters.
Figure 1. Map layout of RF and Assembly room at level 4 of PWTC, NTU To evaluate the performance of the positioning engine in a dynamic environment, canteen B located at the south academic spine of Nanyang Technological University (NTU) was chosen. It was calibrated during an off peak period and accuracy analysis was made during peak lunch hour with people queuing and moving pass food stalls or tables. The measured data was then compared with the baseline accuracy measurement taken after calibration. The peak lunch hour period represents an actual scenario where such positioning software is likely to be used, such as in museums or department stores. Four APs were accessible at the eating hall transmitting at channel 1, 6 and 11. The canteen area is seen in figure 2 measuring within a radius sector of 10 to 15 meters. All accuracy analysis were done on a notebook running on Pentium 3 mobile processor under Windows XP environment with Lucent WaveLAN Gold WLAN network interface card (NIC) controlled by an Agere systems driver version 7.82.0.550.
Figure 2. Map layout of Canteen B at NTU, Singapore
3

Mobility Conference 2004
The hidden Markov model determines the most probable user’s location to be the previous location plus the velocity. While it is fair to expect a good performance when detecting users’ movement in a two-dimensional map, the engine’s ability to track user movement when traversing across different map that describe different floors was also examined. We tested the software detecting a user moving from different levels of the research techno plaza building. In this scenario, 5x4m test sites were created at level three and four. Both areas were vertically aligned and connected by means of a staircase. Up to 12 APs in total were visible to the test device at the test areas which are depicted in figure 3 (a) and (b).
(a) (b) Figure 3. Calibrated area (a) level 3 and (b) level 4 of foyer at PWTC, NTU
3.0 RESULTS 3.1 Static Environment For the static environment experiment, we calibrated the test area using 5m, 2m, and 1m step sizes. The accuracy analysis model in the software requires you to indicate your actual travelled path during accuracy testing. This was done by clicking locations on the map that correspond to the user’s actual position. The software then calculates errors based on the position it has estimated from the RSSI values to actual positions along the rail point the user is currently on.
Accuracy Vs No of APs
00.5
11.5
22.5
33.5
1 2 3 4 5No of APs
Error (meters)Average
Figure 4. Accuracy Vs No of APs
4
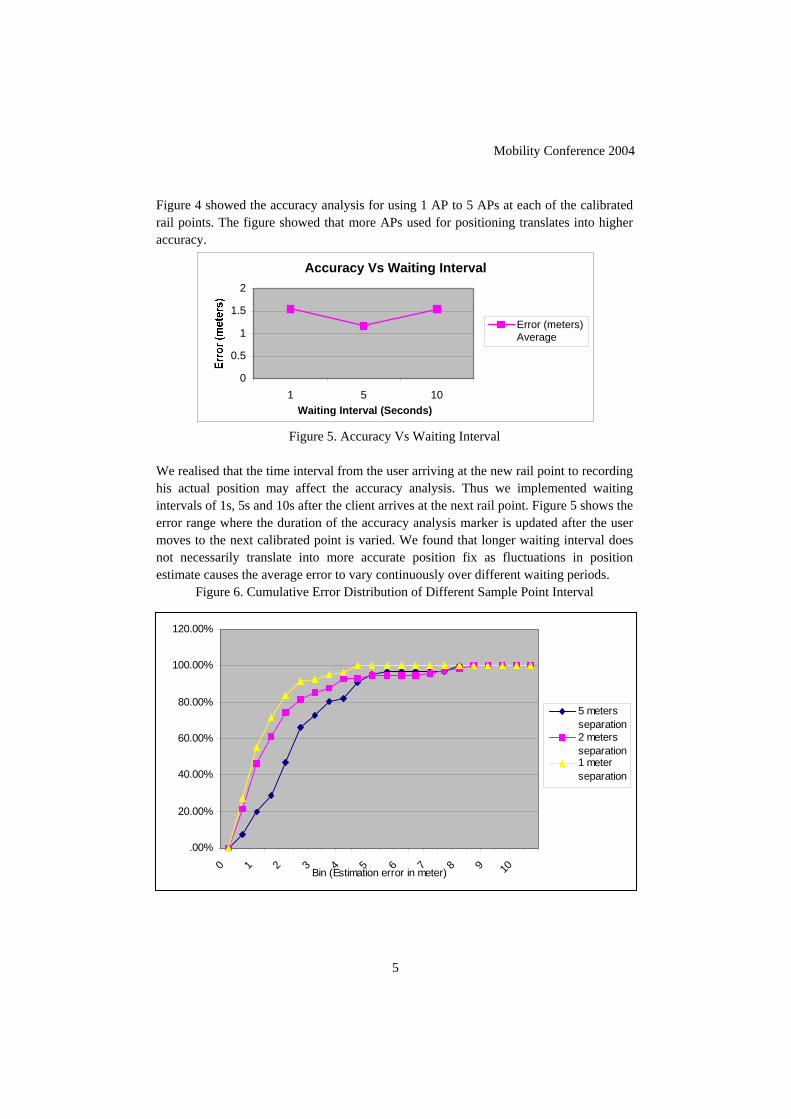
Mobility Conference 2004
Figure 4 showed the accuracy analysis for using 1 AP to 5 APs at each of the calibrated rail points. The figure showed that more APs used for positioning translates into higher accuracy.
Figure 5. Accuracy Vs Waiting Interval
e realised that the time interval from the user arriving at the new rail point to recording
Accuracy Vs Waiting Interval
0
0.5
1
1.5
2
1 5 10Waiting Interval (Seconds)
Error (meters)Average
Whis actual position may affect the accuracy analysis. Thus we implemented waiting intervals of 1s, 5s and 10s after the client arrives at the next rail point. Figure 5 shows the error range where the duration of the accuracy analysis marker is updated after the user moves to the next calibrated point is varied. We found that longer waiting interval does not necessarily translate into more accurate position fix as fluctuations in position estimate causes the average error to vary continuously over different waiting periods.
Figure 6. Cumulative Error Distribution of Different Sample Point Interval
.00%
20.00%
40.00%
60.00%
80.00%
100.00%
120.00%
0 1 2 3 4 5 6 7 8 9 10Bin (Estimation error in meter)
5 metersseparation2 metersseparation1 meterseparation
5

Mobility Conference 2004
Figure 6 shows the effect of varying calibration step sizes between 1m, 2m and 5m step
igure 7 shows accuracy analysis chart as a function of the update interval that represents
executing the experiment over different floors, two separate maps were ‘linked’ by
.2 Dynamic Environment essentially static. We have found that positioning
sizes with 5s waiting interval during accuracy analysis. Results show that smaller calibration step size presented lower average errors.
Accuracy Vs. Update Interval
0
0.5
1
1.5
2
2 5 10Interval (Seconds)
Error (meters)Average
Figure 7. Accuracy Vs Update Interval
Fthe sampling of positioning errors. This translates to how accurately users are being tracked and results show that the longer the update interval, the higher the average error becomes. During testing the same test path traversed and the same waiting interval was used. Intaking a calibration measurement at one floor and doing the same measurement at the “entry point” to the next map as seen in Figure 3. It was found that the software was able to track a user moving from one map to the other with the same tracking update interval, as when a user was moving in just one map. Nonetheless, one foreseeable issue when calibrating the positioning software for a large building with many floors is to determine a common point between floors at which to link maps of different floors. It would be more tedious to perform calibration when there are many transfer points from one map to another such as elevators, stairs and lifts. On the other hand, a multi-storey building with elevators as the only means to travel between floors would be easier to calibrate. 3In the lab setup, the environment is estimate degrades heavily even when the receiving antenna is simply covered by hand. Furthermore, the indoor WLAN laboratory setup is smaller in size, <10m radii, whereby practical AP coverage exceeds that. In order to gauge the practical application, we calibrated the canteen area and tested it using NTU’s WLAN services.
6
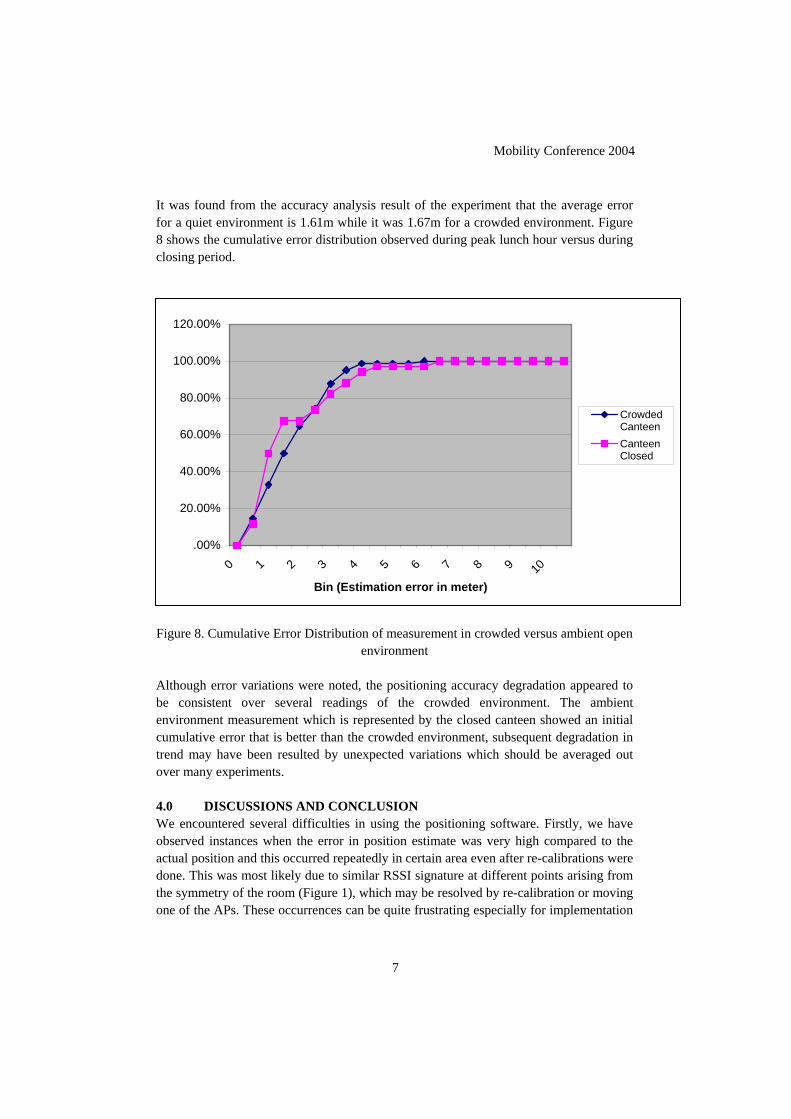
Mobility Conference 2004
It was found from the accuracy analysis result of the experiment that the average error for a quiet environment is 1.61m while it was 1.67m for a crowded environment. Figure 8 shows the cumulative error distribution observed during peak lunch hour versus during closing period.
.00%
20.00%
40.00%
60.00%
80.00%
100.00%
120.00%
0 1 2 3 4 5 6 7 8 9 10
Bin (Estimation error in meter)
CrowdedCanteenCanteenClosed
Figure 8. Cumulative Error Distribution of measurement in crowded versus ambient open
environment
Although error variations were noted, the positioning accuracy degradation appeared to be consistent over several readings of the crowded environment. The ambient environment measurement which is represented by the closed canteen showed an initial cumulative error that is better than the crowded environment, subsequent degradation in trend may have been resulted by unexpected variations which should be averaged out over many experiments. 4.0 DISCUSSIONS AND CONCLUSION We encountered several difficulties in using the positioning software. Firstly, we have observed instances when the error in position estimate was very high compared to the actual position and this occurred repeatedly in certain area even after re-calibrations were done. This was most likely due to similar RSSI signature at different points arising from the symmetry of the room (Figure 1), which may be resolved by re-calibration or moving one of the APs. These occurrences can be quite frustrating especially for implementation
7
Mobility Conference 2004
in an established WLAN infrastructure due to the nature of its radio environment. The other possibility could be other sources of interferences using the same frequency spectrum. Secondly, by observing position estimates when the client device is stationary, we found that certain direction and height of the client’s antenna would produce better position estimate than others, which realistically will not happen as calibration and clients’ handheld heights will differ. In a dynamic environment, our tests showed minimal differences in positioning error as compared to the experimental setup. This may be due to the APs place high above the users (5-6 meters) as compared to the 1.5-meter height of our APs in the laboratories. Our overall test results show that the average error is between 1.5 to 2 meters with a 95% confidence interval of 0.332 meters. One main concern is the maximum error. In the dynamic environment, it can be seen from the longest error vector in Figure 8 that very large maximum error is possible (5.6 meters), which would degrade the average error performance. The algorithm used in the positioning engine can be improved as defined in paper [5] to increase positional accuracy and prevent erroneous location on the wrong side of walls, partitions etc. Improvements can be made to calibration procedures but some inherent issues due to the nature of WiFi equipment and the radio environment can prevent a smooth installation and operation of such systems. On the whole, we conclude that this positioning engine is a promising technology that is able to deliver location information over WLAN at reasonable ease of implementation and good performance. The use of probabilistic models and machine learning algorithms sets the software engine apart from other RSSI-based positioning solutions. 5.0 BIBLIOGRAPHY PWTC at NTU is actively involved in research on positioning outdoors (GPS), indoors (A-GPS, RFID, WiFi) and Intelligent Transportation Systems (ITS). They have ongoing projects in Mobile Ad-Hoc Network (MANET) video, 802.11 MAC design and smart antenna design. Dr Andrew Lee is actively involved in the smart antenna and ITS related projects that involve the design and development of smart antennas and sensor networks for traffic management. Barry is an MSc student at NTU who is completing his thesis in the investigation of the use of time-based metrics for indoor positioning in WLAN environment. He is also doing research work on WiFi positioning using RSSI. The Infocomm Development Authority of Singapore (IDA) develops, promotes and regulates info-communications in Singapore, with the aim of establishing Singapore as one of the world's premier infocomm capitals. One of the roles of IDA is to identify and facilitate the adoption of specific strategic infocomm technologies to enhance Singapore's competitiveness. Joshua Lee tracks LBS, Telematics, mobile messaging and PTT over Cellular (PoC). He is currently involved in a location-based educational project in
8

Mobility Conference 2004
Singapore Science Centre to improve the visitor’s learning experience and reduce operating cost. REFERENCES [1] P. Bahl, V.N. Padmanabhan, “RADAR: An In Building RF-based User Location and
Tracking System”, Communications Societies. Proceedings, IEEE, Vol. 2, Pp: 775 -784, March 2000
[2] P. Castro, P. Chiu, T. Kremenek, R. Muntz, “A probabilistic room location service for wireless networked environments”, Ubicomp 2001, September 30 - October 2, 2001, Sheraton Colony Square Hotel, Atlanta, Georgia.
[3] I. Keene, J. Calvert, “Public Wireless LAN Hot Spots: Worldwide Trends and Forecasts”, Gartner Dataquest Market Trends, August 9, 2002.
[4] Ekahau Positioning Engine. http://www.ekahau.com. [5] I. Guvenc, C. T. Abdallah, R. Jordan and O. Dedeoglu, "Enhancements to RSS
BasedIndoor Tracking Systems Using Kalman Filters", Accepted, GSPx & International Signal Processing Conference, March 31-April 3, 2003, Dallas, TX.
9

Mobility Conference 2004
MOBILE CHEQUE PAYMENT USING EVEN ELLIPTIC CURVE CRYPTOGRAPHY ON JAVA-ENABLED LIGHTWEIGHT
DEVICES
YIP WAI KUAN Center for Mobile Technology and Communications, HELP Institute,
BZ-2, Pusat Bandar Damansara, 50490 Kuala Lumpur, Malaysia
ARNAUD THIMEL Center for Mobile Technology and Communications, HELP Institute,
BZ-2, Pusat Bandar Damansara, 50490 Kuala Lumpur, Malaysia
Mobile payment mechanism is the key enabler in any successful implementation of mobile commerce. The current payment methods include SMS and WAP-based implementations which could not provide the needed security as they rely on server-side processing. These systems also require connectivity to financial institution gateways, via the telecommunication provider which is undesirable as users need to trust the intermediary servers. The objective of our work is to propose an off-line and cryptographically secured electronic cheque scheme, which would allow the mobile phone users to digitally sign and send the cheque tokens to merchants without intervention of the financial gateway during payment. The system would feature a computational efficient implementation using Even-field Elliptic Curve Digital Signature Algorithm library in contrast to traditional factorisation or discrete logarithm-based security which would not be possible for lightweight devices. In particular, the system will be developed on the Java 2 MicroEdition (J2ME) platform to take advantage of its multi-platform capability and compatibility among different phone vendors with Java servlet as the server-side platform. Finally, we will investigate future use of such a system and present an analysis of the performance on various Java-phone and PDA models. INTRODUCTION According to [1], the UMTS Forum estimates that by 2010, half of the mobile subscribers will also be Internet mobile subscribers. In 2004, an estimated 350 million people will be using mobile ticket purchasing and mobile retail ordering and almost 350 million will use mobile banking and more than 50 million are expected to use mobile financial trading. A substantial number of payment systems, usually record-based, have emerged within the decade that allow mobile devices eg. hand-phone and Personal Digital Assistant (PDA) users to perform on-line banking using Simple Messaging Services (SMS) and Wireless Application Protocol (WAP). However, these technologies typically require connectivity to the telecommunication gateway and then the financial provider gateway to enable
1

Mobility Conference 2004
funds to be transferred resulting in higher cost for dedicated line and slower payment process. Moreover, due to the technology used, it is not possible to securely authenticate the user and ensure data integrity resulting in rampant fraudulent payment. Our motivation for this paper is to formularize a payment protocol that would not require online connection to the financial provider gateway but still allow for efficient verification. The payment should be post-paid in view of the likelihood of possible failure in transaction. With the leaping progress of mobile devices such as mobile phones and PDAs, we should expect higher storage and computational capacity in future devices that would enable client-side processing. This would be desirable as these devices can now store private keys and perform various cryptographic operations. Hence, we proposed an electronic cheque protocol to be implemented on mobile devices. PROPOSED SOLUTION AND ARCHITECTURE The proposed mobile payment consist of four actors, closely representing the physical model:- • Financial Service Providers (FSP) who provides the back end payment settlement • Merchants (M) who provides the content and/or services to the users in the electronic
or physical forms • Users (U) who make purchases • Network Service Providers (NSP) who provides telecommunications facilities and
support infrastructure
ECDSA Key GenerationECDSA Signature
Generation
UserRMS
J2ME MIDlet
WirelessNetwork
TokenWithdrawal
Deposit
UserDB
DepositCheque DB
ECDSAVerify
ChequeDB
FSP Servlet
Payment Merchant Servlet
Internet
NSP Gateway
Figure 1: Mobile Electronic Cheque Application Architecture The system architecture includes the client-side implementation with J2ME on MIDP-compliant devices [2][3] and server-side implementation using servlet technology as
2

Mobility Conference 2004
depicted in Figure 1. Operations like key generation and signature generation that demand the use of private key of the user and cheque information are executed on the device to ensure privacy. On the other hand, the FSP server contains the token download and deposit modules while the merchant server only required the verification operation. ELECTRONIC CHEQUE PROTOCOL The overall flow of the system is be divided into the following processes: (i) U Setup, (ii) M Setup, (iii) Download token process, (iv) Payment process and (v) Deposit process. We assume the data exchanges will be made under secure channel. Prior to any transactions, U registers himself with a FSP (Table 1). U then generates a public-private key pair and obtains a certificate based on the public key from a Certification Authority (CA). Note that this process should involve physical verification, hence U will generate the key pair and send the public key PUBu to the CA via a close proximity protocol eg. Bluetooth or Infrared.
Table1: User Setup U Register an account in FSP
Generate key pair (PUBu, PRIu) ↓ PUBu CA Registers PUBu and generate certificate CERTu ↓ CERTu U Store CERTu
In the M Setup process, a key pair will be generated and the public key registered with a CA. The private key will be stored in the smart card.
Table2: Merchant Setup FSP Generate key pair (PUBf, PRIb) ↓ PUBf CA Registers PUBf ↓ CERTf FSP Store CERTf
During token download process, U requests for cheque token TKN in the form of [Serial Number, User name, User Account] from the FSP. Upon receipt of tokens, U stores TKN into his mobile database.
Table 3: Download Token U Request for a new cheque token (TKN) ↓ request TKN, CERTu FSP Verify CERTu, Generate TKN ↓ TKN U Store TKN to device database
3

Mobility Conference 2004
At payment, U forms the cheque CHQ = [TKN, ShopID, AMT, date/time]. The cheque is then signed with PRIu to obtain SCHQ and presented to M for verification. The ShopID may be beamed via Bluetooth or Infra-red to the mobile device.
Table 4: Payment U Enter payment details
Create cheque (CHQ) Sign CHK (SCHQ)
↓ SCHQ M Verify SCHQ
Generate payment confirmation PCONF Store SCHQ
↓ PCONF U Display PCONF
During deposit, M sends the SCHQ to the FSP. As with the payment step, the FSP verifies that SCHQ is valid before sending a confirmation.
Table 5: Deposit M Deposit cheque ↓ SCHQ FSP Verify cheque
Generate deposit confirmation DCONF ↓ DCONF M Display DCONF
THE SIGNATURE AND VERIFICATION LIBRARY Digital Signature (DS) can be viewed as an electronic form of the written signature. Essentially a long string of bits, the DS is produced by a function of a private key and target document and it could only be verified using the public key of the signer. While DS schemes can be implemented based on the intractability of the Discrete Logarithm (DL) or Integer Factorisation (IF) problems such as El-Gamal and Rivest-Shamir-Adleman (RSA) algorithms, DS protocol using Elliptic Curve Discrete Logarithm (ECDL) -first proposed in [11] offers faster and smaller keys with the equivalent level of security. In particular, consider that the current security of 1024-bit DL or IF implementations can be achieved with only 163-bit using the ECDL. The three main processes in ECDSA outlined in [4][5][6][7] are: (1) Key Pair Generation, (2) Signature Generation and (3) Signature Verification. The ECDSA can be implemented over the odd (prime) field or even (binary) field with the latter having superior performance optimized for device implementation. An Elliptic Curve E over the binary field of length m, F
2m is defined by the following equation:-
4
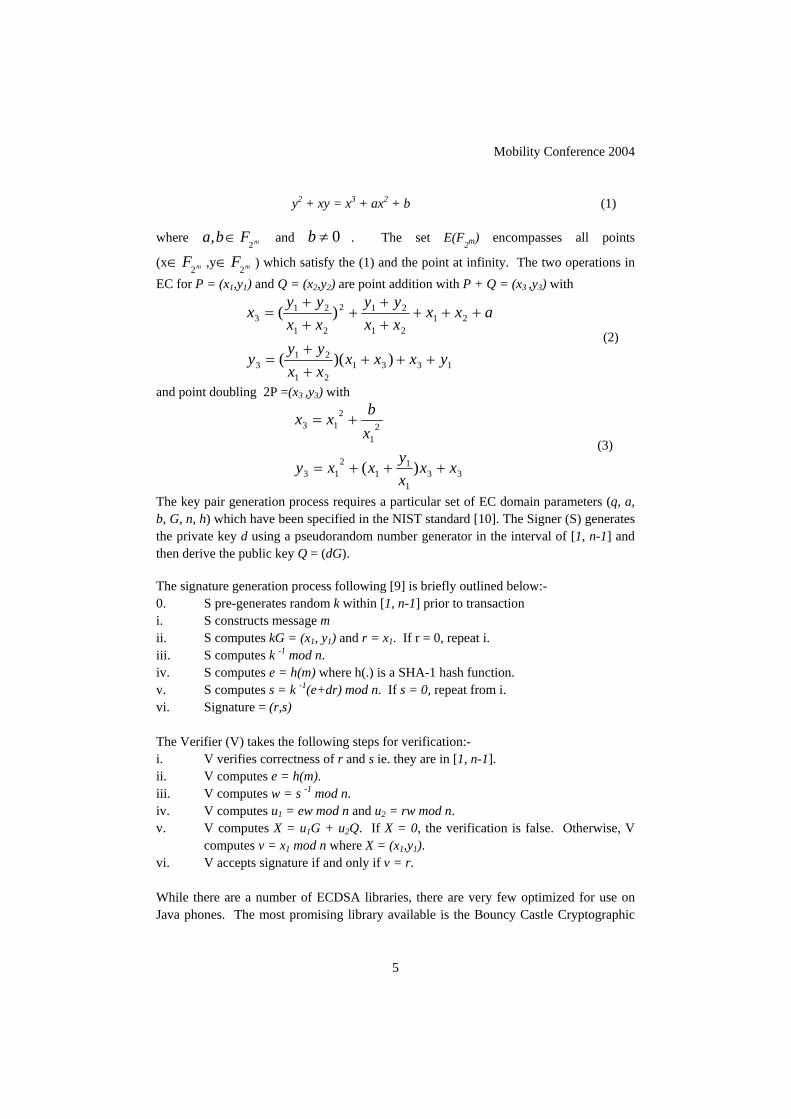
Mobility Conference 2004
y2 + xy = x3 + ax2 + b (1) where and . The set E(F
2m) encompasses all points
(x ,y ) which satisfy the (1) and the point at infinity. The two operations in EC for P = (x1,y1) and Q = (x2,y2) are point addition with P + Q = (x3 ,y3) with
mFba2
, ∈ 0≠b
mF2∈ mF2∈
133121
213
2121
212
21
213
))((
)(
yxxxxxyy
y
axxxxyy
xxyy
x
+++++
=
+++++
+++
= (2)
and point doubling 2P =(x3 ,y3) with
331
11
213
21
213
)( xxxy
xxy
xbxx
+++=
+=
(3)
The key pair generation process requires a particular set of EC domain parameters (q, a, b, G, n, h) which have been specified in the NIST standard [10]. The Signer (S) generates the private key d using a pseudorandom number generator in the interval of [1, n-1] and then derive the public key Q = (dG). The signature generation process following [9] is briefly outlined below:- 0. S pre-generates random k within [1, n-1] prior to transaction i. S constructs message m ii. S computes kG = (x1, y1) and r = x1. If r = 0, repeat i. iii. S computes k -1 mod n. iv. S computes e = h(m) where h(.) is a SHA-1 hash function. v. S computes s = k -1(e+dr) mod n. If s = 0, repeat from i. vi. Signature = (r,s) The Verifier (V) takes the following steps for verification:- i. V verifies correctness of r and s ie. they are in [1, n-1]. ii. V computes e = h(m). iii. V computes w = s -1 mod n. iv. V computes u1 = ew mod n and u2 = rw mod n. v. V computes X = u1G + u2Q. If X = 0, the verification is false. Otherwise, V
computes v = x1 mod n where X = (x1,y1). vi. V accepts signature if and only if v = r. While there are a number of ECDSA libraries, there are very few optimized for use on Java phones. The most promising library available is the Bouncy Castle Cryptographic
5

Mobility Conference 2004
library but the library was for odd field EC and the size was too large to be fitted into the device. Hence, we have developed a lighter library (Figure 2) with focus on 163-bit even-field ECDSA and in accordance to the NIST standard outlined [10]. The selection of 163-bit key length is to accommodate the current security standard and to protect against ciphertext attack by eavesdroppers with larger machines.
Figure 2: Class Diagram of the ECDSA Library
ECDSAVerifier ECKeyPair ECDSASigner
ECPublicKeyParam
ECDomainParams
ECPrivateKeyParam
ECPoint ECCurve BigIntegerLight
F2mField
EVALUATION AND PERFORMANCE ANALYSIS A prototype of the framework was built to test the usability and speed of the payment transactions. The menu of the client terminal application is depicted in Figure 3. On the FSP and merchant server, servlets were used to serve incoming requests for withdrawal of tokens, deposit and verification of signatures. The operational performance of the signature and verification of the client application on various mobile phones such as the SonyEricsson (SE) P800 and P900, Nokia (NK) 6600 and Palm OS devices are shown in Table 6. The results using Generic J2ME Wireless Toolkit (WTK) 2.0 Emulator are also presented. Note that the higher computation for verification is actually performed on the merchant server-- the duration of the process should be negligible-although it is tested on the client device in Table 6 for benchmark purposes.
6

Mobility Conference 2004
Figure 3: Electronic Cheque Wallet Interface
Table 6: Timing of Operations in Seconds J2ME
WTK SE
P800 SE P900 NK
6600 Palm m505
Key Generation 15.8 16.1 6.0 8.5 6.5 Signature Generation 15.9 16.2 6.0 8.6 5.9 Verification of Signature 28.3 32.9 12.0 17.3 14.0
We conclude that proposed system is viable for Java-enabled lightweight devices as it gives a reasonable average of 6-8 seconds for the payment process considering that signing operation involving sensitive data ie the private key can be safely executed without any online connectivity. Although faster operations can be achieved using Code Warrior C programming [13], the client application, which is executable on any platform supporting Java, would enable uniform and easier download lending to wider range of users. CONCLUSION AND FUTURE WORK We consider the proposed implementation to be an important extension to the existing suite of mobile payment methods available. The use of a lightweight cryptographic library contributed substantially to the feasibility and security of use not realisable before with WAP-based or SMS-based payment methods. Furthermore, the non-connectivity to a financial gateway in the protocol had greatly reduced the cost of transaction and made micro-payment more attainable for smaller online businesses as opposed to the high set-up fee in credit card based implementation. We anticipate that this kind of token-based payment scheme should receive wider acceptance when more affordable models are available in the near future. Key management remains the prevailing issue with client-based cryptographic operations like this as the private key stored in the smart card can be compromised. The solution to this problem is to incorporate private key derived from dynamic biometric written signature and /or thumb-print, thus eliminating the need to physically secure the private key. The former provides an attractive solution as it is not easy to forge behavioural
7

Mobility Conference 2004
characteristics, had already been socially acceptable and is less costly to be implemented for stylus-enabled smart devices. While there are many formulations for recognition and verification of handwritten signature, the challenge here however, is to ensure that the derivation function results in an irreversible unique and discrete vector given the continuous signature signal. ACKNOWLEDGMENTS The authors would like to thank Na Chong Guan for testing the application. REFERENCES [1] UMTS Forum, “Enabling UMTS Third Generation Services and Applications”, No.
11, available at http://www.umtsforum.org, Oct 2000 [2] Sun Microsystems (2001), “Developing Mobile Applications on J2ME” [3] White J.P. & Hemphill D.A. (2002), “Java 2 Micro Edition” [4] Joye M. (1995), “Introduction elementaire a la theories des courbes elliptiques”,
available at http://www.dice.ucl.ac.be/crypto/introductory/courbes_alliptiques.html [5] Certicom, “Online Elliptic Curve Cryptography Tutorial”, available at
http://www.certicom.com/resources/ecc_tutorial/ecc_tutorial.html [6] Jurisic A. & menezes A. (1999), “Elliptic Curves and Cryptography”, available at
http://www.qrst.de/html/dsds/ec/eccrypto.pdf [7] Torii N. & Yokoyama K. (2000), “Elliptic Curve Cryptosystems”, available at
http://magazine.fujitsu.com/us/vol36-2/paper05.pdf [8] Lopez J. & Dahab R. (2000), “An Overview of Elliptic Curve Cryptography”,
available at http://cnscenter.future.co.kr/resource/crypto/algorithm/ecc/lopez00overview.ps
[9] Johnson D., Menezes A. & Vanstone S. (2001), “The Elliptic Curve Digital Signature Algorithm (ECDSA)”, available at http://www.certicom.com/pdfs/whitepapers/ecdsa.pdf
[10] Certicom (2000), “Standard for Efficient Cryptography 1: Elliptic Curve
Cryptography”, available at http://www.secg.org/collateral/sec1_final.pdf[11] Vanstone, S. (1992). “Responses to NIST’s Proposal”, Communications of the
ACM, Vol 35, pp. 50-52, July 1992 [12] Henneberg Consult, “Performance tests of VMs on mobiles”, available at
http://www.hhenne.dk/j2meperf[13] Weimerskirch, A., Paar, C. & Shantz, S.C. (2001). “Elliptic Curve Cryptography on
a Palm OS Device”, 6th Australasian Conference on Information Security and Privacy (ACISP 2001), July 2001, Aus
8
Mobility Conference 2004
GENETIC ALGORITHM BASED BLOCK DATA DETECTION FOR FADING TIME DISPERSIVE CHANNEL
FARID GHANI
School of Electrical and Electronic EngineeringEngineering Campus Universiti Sains Malaysia
14300 Nibong Tebal, P.Penang, Malaysia
Block Data Transmission system is suitable for communication over fading time dispersive channel. Conventional block data detection technique based on linear, non-linear decision directed and maximum likelihood estimation principles are computationally intensive. In this paper, a genetic algorithm based block data detection technique is proposed. Experimental results on the effect of selection schemes (Roulette Wheel, Stochastic Universal Sampling and Tournament Selection scheme), mutation rate and population size are presented. It has been found that genetic algorithm considerably reduces the computational complexity of the optimum detection process and makes it suitable for online computation.This is where the abstract should be placed. It should consist of one paragraph giving a concise summary of the material in the article below. Replace the title, authors, and addresses with your own title, authors, and addresses. INTRODUCTION In block data transmission system, blocks of information symbols and training symbols are transmitted alternately. The system is suitable for transmission of digital data over fading time-dispersive channels such as high signaling rate HF channel, mobile radio channel, indoor wireless etc. Size of each signal block depends on channel parameter and typically it is 5 to 30 symbols. Block of training symbols is used in channel tracking and data block detection[1-4]. Several block data detection techniques have been previously proposed [1-4]. Linear block data detection techniques are investigated that use least sum of square errors (LSSE) criterion [1,2,4]. Non-linear decision directed techniques make decision only on estimated source data vector. In maximum likelihood block estimation (MLBE) technique, estimated source data vector are selected only from the set of valid discrete transmit data vectors [2, 4]. These techniques i.e. linear, non-linear decision directed and maximum likelihood estimation principle have the limitation that they are computationally intensive [4].In this paper, a genetic algorithm (GA) based block data detection technique is proposed which offers computational savings. Comparison between proposed and conventional technique is presented for amount of computations.
1

Mobility Conference 2004
Genetic algorithms are randomized search and optimization technique guided by the principle of natural evolution and genetics [5,6]. They are efficient, adaptive and robust search processes producing near optimal solution. Experimental results on the effect of selection schemes (Roulette Wheel, Stochastic Universal Sampling and Tournament Selection scheme), mutation rate and population size are presented in this paper. BLOCK DATA TRANSMISSION SYSTEM Fig 1 shows the model of a block data transmission system. Input to the system is a series of blocks of information symbols and training symbols transmitted alternately [2,4]. Transmission buffer contains block of information sysmbol S=s0, s1, …sm-1 taken from the finite alphabet. Receiver buffer holds the received vector R=r0, r1, …rm, … rm+g-1 where g is the length of the block containing training symbols. Length of the training block is adjusted to prevent interference across the block. This information is received on block-by-block basis i.e. detector uses n=m+g samples in the detection of m elements.
Buffer BasebandChannel Buffer Dtector+
a b c
(a) Uninterrupted Streamof Data Symbols
(b)Blocks of Informationand Training Symbols S
(c)Received SignalBlock R
(d)Detected SignalBlock S’
d
White Gaussian Noisen(t)
Figure 1. Model of the block data transmission system Let K=k0, k1, … kg-1 be the sampled impulse response of the baseband channel and W be the n-component row vector with zero mean and variance σ2. W represents an n component row vector whose components are sample values of Additive White Guassian Noise (AWGN) introduced by the channel. Following equation holds [2,4] R= SY+W (1) Where Y is a mxn matrix of rank m and each element of this matrix is given below – Yij = 0 if j<i or j>i =Ki-j if j>=i and j<=i+g-1 (2) For binary data transmission systems having anti-podal information symbol i.e. si=±1, there are 2m possible values of the transmitted block S. And hence for a given sample impulse response Y of a baseband channel, there are also 2m possible values of the n component row-vector SY in Equation (1). Given a received vector R and the sample
2

Mobility Conference 2004
impulse response of the channel, the job of the detector is to determine the corresponding block S of transmitted information symbol. Various detection schemes using linear, non-linear and maximum likelihood methods have been proposed in the literature [1-4]. The maximum likelihood detector, which is optimum as it gives maximum signal to noise ratio, detects that value of S for which |R-SY| is minimum [2,4] In the case of the optimum detection process and for a given block of size m, a total of 2m computations are required for detecting the transmitted block S from the received vector R. It can be performed quickly in an online manner for small values of m. As the value of m is increased, number of computations increases exponentially. Thus, for practical values of m, detection process becomes too time consuming for online implementation. Genetic algorithms which are efficient search technique, can be used effectively in order to reduce the complexity and computation involved in the optimum detection process. BLOCK DATA DETECTION USING GENETIC ALGORITHM Figure 2 lists the steps for block data detection using genetic algorithm. Objective function, selection scheme, cross over and mutation rate are some of the important characteristics of a genetic algorithm [5,6]. In this work, distance between R and each selected combination of SY is taken to be the objective function. Selection of individuals from current population to form the mating pool is carried out using Roulette Wheel, Stochastic Universal Sampling or Tournament selection scheme. Single point crossover is applied to generate new offspring and simple mutation operator is applied to increase diversity in the population.
1. Initialise the random population of binary sequences
2. Calculate the Objective Function
3. Compute the Fitness Values according to the Objective Values
4. If the Performance is satisfactory, Stop else continue to next step.
5. Reproduce/Select sequences using the desired Selection Scheme
6. Generate new population using Crossover and Mutation. Go to Step 2.
Figure 2. Genetic Algorithm for block data detection
3
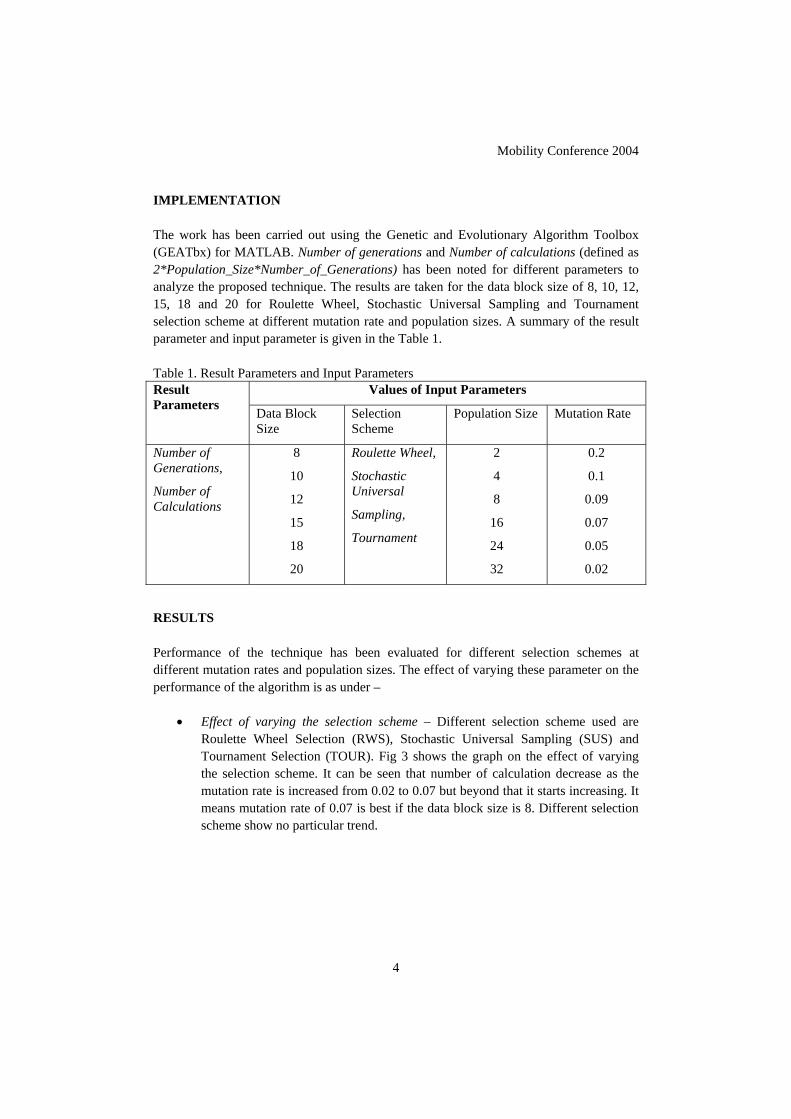
Mobility Conference 2004
IMPLEMENTATION The work has been carried out using the Genetic and Evolutionary Algorithm Toolbox (GEATbx) for MATLAB. Number of generations and Number of calculations (defined as 2*Population_Size*Number_of_Generations) has been noted for different parameters to analyze the proposed technique. The results are taken for the data block size of 8, 10, 12, 15, 18 and 20 for Roulette Wheel, Stochastic Universal Sampling and Tournament selection scheme at different mutation rate and population sizes. A summary of the result parameter and input parameter is given in the Table 1. Table 1. Result Parameters and Input Parameters
Values of Input Parameters Result Parameters Data Block
Size Selection Scheme
Population Size Mutation Rate
Number of Generations,
Number of Calculations
8
10
12
15
18
20
Roulette Wheel,
Stochastic Universal
Sampling,
Tournament
2
4
8
16
24
32
0.2
0.1
0.09
0.07
0.05
0.02
RESULTS Performance of the technique has been evaluated for different selection schemes at different mutation rates and population sizes. The effect of varying these parameter on the performance of the algorithm is as under –
• Effect of varying the selection scheme – Different selection scheme used are Roulette Wheel Selection (RWS), Stochastic Universal Sampling (SUS) and Tournament Selection (TOUR). Fig 3 shows the graph on the effect of varying the selection scheme. It can be seen that number of calculation decrease as the mutation rate is increased from 0.02 to 0.07 but beyond that it starts increasing. It means mutation rate of 0.07 is best if the data block size is 8. Different selection scheme show no particular trend.
4

Mobility Conference 2004
0500
100015002000
0.02 0.05 0.07 0.09 0.1 0.2Mutation Rate
Num
ber o
f Cal
cula
tions
RWS SUS TOUR
0
500
1000
1500
0.02 0.05 0.07 0.09 0.1 0.2Mutation Rate
Num
ber o
f Cal
cula
tions
RWS SUS TOUR
a) Population Size=32 and m=8 a) Population Size=16 and m=8
Figure 3. Effect of Selection Scheme
• Effect of varying the mutation rates – The mutation rates have been varied for
different values of size of data blocks m and the results are given in Fig 4. It can be seen that the mutation rate has a profound effect on the performance of the algorithm. We also observe that, for larger length m of data block, lower mutation rates give better results.
0100020003000
0.02
0.05
0.07
0.09 0.1 0.2
Mutation Rate
Num
ber o
f Cal
cula
tions
m=8 m=10 m=12
0500
10001500
0.02
0.05
0.07
0.09 0.1 0.2
Mutation Rate
Num
ber o
f Cal
cula
tions
m=8 m=10 m=12
a) Population Size=32 and Selection Scheme=RWS
b) Population Size=16 and Selection Scheme=RWS
Figure 4. Effect of Mutation Rate
• Effect of varying the Population Size – The effect of population size is shown in
Fig 5. From the graph, it can be seen that although population size has very little effect on the number of calculations required to reach the optimum, it should be taken to be small in order to preserve the genetic diversity.
5

Mobility Conference 2004
0200400600
8 16 32
Population Size
m=8 m=10 m=12
0100020003000
8 16 32
Population Size
m=8 m=10 m=12
a) Mutation Rate=0.07 and Selection Scheme=RWS
b) Mutation Rate=0.2 and Selection Scheme=RWS
Figure 5. Effect of Population Size
• Effect of using Genetic Algorithm as compared to Traditional Method – By using genetic algorithm, the number of calculations required to reach to the global optima decreases drastically specially for higher values of m (Fig 6). The graph shows that genetic algorithm based technique offers substantial computational savings.
1.00E+001.00E+021.00E+041.00E+061.00E+08
8 10 12 15 18 20
Data Block Size
Num
ber o
f C
alcu
latio
ns
Genetic Algo Conventional Tech
Number of Calculations Data
Block Size (m)
Using
GA
Using
Conventional Method
8 171.46 256
10 341.25 1024
12 501.60 4096
15 708.90 32768
18 1107.7 262144
20 1367.4 1048576
a) Graphical Representation b) Numerical Data
Figure 6. Genetic Algorithm vs Conventional Methods
6

Mobility Conference 2004
CONCLUSIONS In this paper, a genetic algorithm based block data detection technique is proposed. This technique offers substantial computational savings over previous techniques i.e. Linear, Non-linear and maximum likelihood estimation principle based techniques. The proposed technique has been evaluated for different selection schemes at different mutation rates and population sizes. The results indicate that different selection schemes show no particular trend. But mutation rate has profound effect on the performance of the algorithm. It is found that lower mutation rate gives better results. Population size has little effect on the number of calculations but it is taken to be small to preserve the genetic diversity. REFERENCES [1] Crozier et al, “Reduced Complexity Short Block Data Detection Techniques for
Fading Time-Dispersive Channels”, IEEE Transactions on Vehicular Technology, Aug 1992.
[2] Crozier et al, “Short Block Equalization Techniques Employing Channel Estimation for Fading Time-Dispersive Channels”, Proc. IEEE Vehicular Technology Conference, May, 1989.
[3] Kaleh, “Channel Equalization for Block Transmission Systems”, IEEE Journal on Selected Areas in Communication, Jan 1995.
[4] F. Ghani,” Block Data Communication System for Fading Time Dispersive Channels”, Proceedings 4th National Conference on Telecommunication Technology, Held at Shah Alam, Malaysia 14,15 January 2003, pp.93-97.
[5] Bandyopadhyay and Maulik, “An Improved Evolutionary Algorithm as Function Optimizer”, IETE Journal of Research, Jan-Apr 2000.
[6] Goldberg, “Genetic Algorithms”, Addison Wesley, 1999.
7

Mobility Conference 2004
INTETRWORKING OF HIPERLAN TYPE TWO (HIPERLAN/2) AND UMTS
VIJAY K. GARG
Electrical and Computer Engineering Department, University of Illinois at Chicago Chicago, IL USA
R. K. GHOSH
Computer Science and Engineering Department, IIT-Kanpur Kanpur 208016, UP India
The objective of the paper is to evaluate means to offer mobile Internet services with wireless technologies. HIPERLAN/2, a European standard, provides more than 20 Mbps data rate and operates in the unlicensed frequency band at 5 GHz. The connection-oriented nature of HIPERLAN/2 allows implementation of Quality of Service (QoS). Mapping of the QoS parameters in HIPERLAN/2 makes it suitable as a radio access technology for different fixed networks, e.g. Ethernet, ATM, UMTS and so on. UMTS, an evolution of GSM/GPRS, offers a large coverage area and provides global roaming. UMTS has matured mobility management, whereas WLAN offers relatively high data rate. By combining these two systems we can offer to the user both mobility/connectivity and high data rates in an unlicensed band.
INTRODUCTION HIPERLAN/2 has many characteristics in common with IEEE 802.11 WLAN [1]. HIPERLAN/2 has three basic layers ⎯ Physical layer (PHY), Data Link Control layer (DLC), and Convergence layer (CL). A key feature of the physical layer is to provide several modulation and coding schemes to adapt for current radio link quality and meet the requirements for different physical layer modes as defined for the transport channels within DLC. The DLC layer constitutes the logical link between an access point (AP) and mobile terminal (MT). The DLC includes functions for medium access and transmission as well as handling terminal/user connection. The DLC layer consists of a set of sub layers: Medium Access Control (MAC), Error Control (EC), and Radio Link Control (RLC). Compare to IEEE 802.11 WLAN, medium access in HIPERLAN/2 is based on the Time Division Duplex/Time Division Multiple Access (TDD/TDMA) and uses a MAC frame of 2 ms duration. An AP provides the centralized control and informs the MT at which point in time in the MAC frame, it is allowed to transmit its data. Time slots are allocated dynamically depending on the need for transmission resources. HIPERLAN/2 operates as a connection-oriented wireless link. It supports the differentiated QoS levels required for transmission of various traffics. Convergence Layer (CL) between data link layer and network layer provides QoS. The role of CL is two fold
1
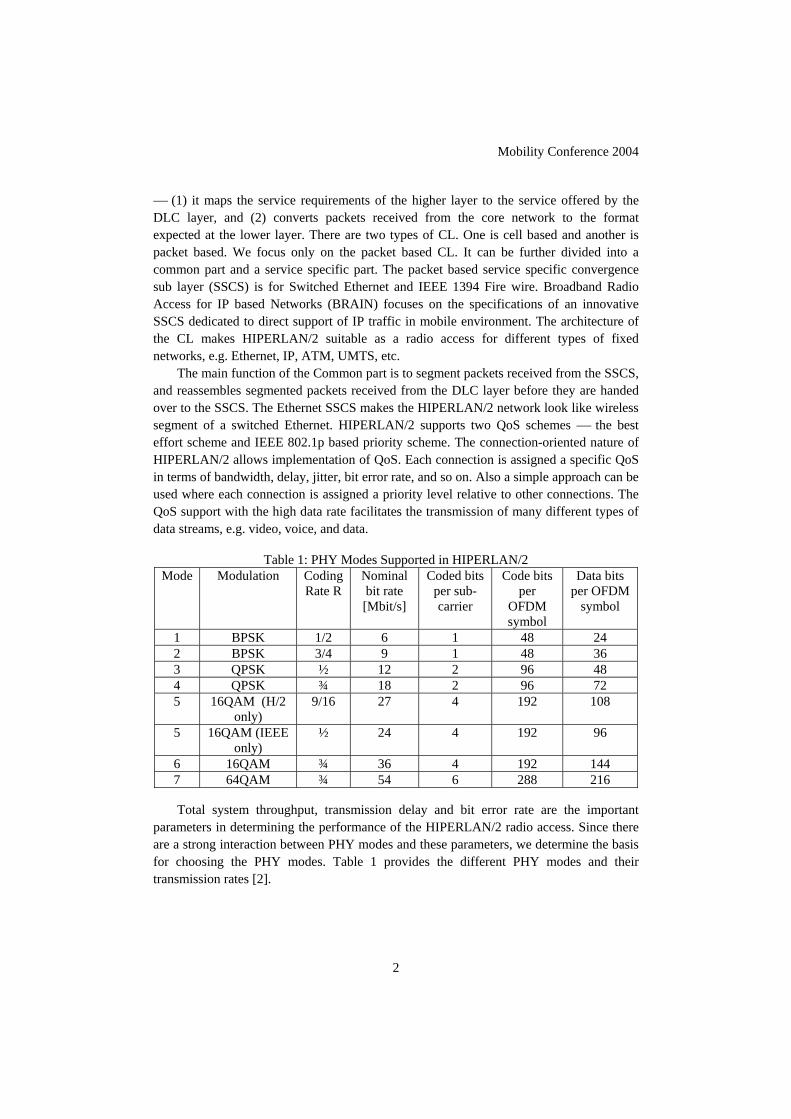
Mobility Conference 2004
⎯ (1) it maps the service requirements of the higher layer to the service offered by the DLC layer, and (2) converts packets received from the core network to the format expected at the lower layer. There are two types of CL. One is cell based and another is packet based. We focus only on the packet based CL. It can be further divided into a common part and a service specific part. The packet based service specific convergence sub layer (SSCS) is for Switched Ethernet and IEEE 1394 Fire wire. Broadband Radio Access for IP based Networks (BRAIN) focuses on the specifications of an innovative SSCS dedicated to direct support of IP traffic in mobile environment. The architecture of the CL makes HIPERLAN/2 suitable as a radio access for different types of fixed networks, e.g. Ethernet, IP, ATM, UMTS, etc.
The main function of the Common part is to segment packets received from the SSCS, and reassembles segmented packets received from the DLC layer before they are handed over to the SSCS. The Ethernet SSCS makes the HIPERLAN/2 network look like wireless segment of a switched Ethernet. HIPERLAN/2 supports two QoS schemes ⎯ the best effort scheme and IEEE 802.1p based priority scheme. The connection-oriented nature of HIPERLAN/2 allows implementation of QoS. Each connection is assigned a specific QoS in terms of bandwidth, delay, jitter, bit error rate, and so on. Also a simple approach can be used where each connection is assigned a priority level relative to other connections. The QoS support with the high data rate facilitates the transmission of many different types of data streams, e.g. video, voice, and data.
Table 1: PHY Modes Supported in HIPERLAN/2 Mode Modulation Coding
Rate R Nominal bit rate [Mbit/s]
Coded bits per sub-carrier
Code bits per
OFDM symbol
Data bits per OFDM
symbol
1 BPSK 1/2 6 1 48 24 2 BPSK 3/4 9 1 48 36 3 QPSK ½ 12 2 96 48 4 QPSK ¾ 18 2 96 72 5 16QAM (H/2
only) 9/16 27 4 192 108
5 16QAM (IEEE only)
½ 24 4 192 96
6 16QAM ¾ 36 4 192 144 7 64QAM ¾ 54 6 288 216
Total system throughput, transmission delay and bit error rate are the important
parameters in determining the performance of the HIPERLAN/2 radio access. Since there are a strong interaction between PHY modes and these parameters, we determine the basis for choosing the PHY modes. Table 1 provides the different PHY modes and their transmission rates [2].
2
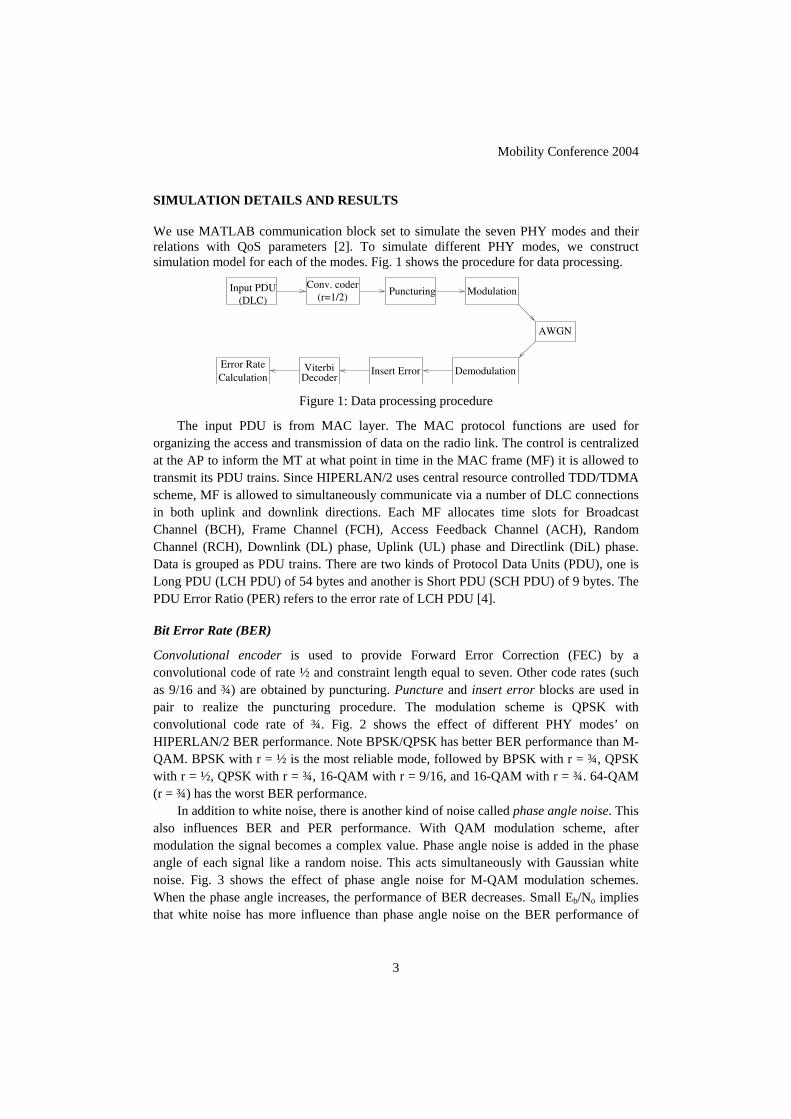
Mobility Conference 2004
SIMULATION DETAILS AND RESULTS We use MATLAB communication block set to simulate the seven PHY modes and their relations with QoS parameters [2]. To simulate different PHY modes, we construct simulation model for each of the modes. Fig. 1 shows the procedure for data processing.
DecoderViterbi
AWGN
Input PDU(DLC)
Conv. coder(r=1/2)
Puncturing Modulation
DemodulationInsert ErrorError RateCalculation
Figure 1: Data processing procedure
The input PDU is from MAC layer. The MAC protocol functions are used for organizing the access and transmission of data on the radio link. The control is centralized at the AP to inform the MT at what point in time in the MAC frame (MF) it is allowed to transmit its PDU trains. Since HIPERLAN/2 uses central resource controlled TDD/TDMA scheme, MF is allowed to simultaneously communicate via a number of DLC connections in both uplink and downlink directions. Each MF allocates time slots for Broadcast Channel (BCH), Frame Channel (FCH), Access Feedback Channel (ACH), Random Channel (RCH), Downlink (DL) phase, Uplink (UL) phase and Directlink (DiL) phase. Data is grouped as PDU trains. There are two kinds of Protocol Data Units (PDU), one is Long PDU (LCH PDU) of 54 bytes and another is Short PDU (SCH PDU) of 9 bytes. The PDU Error Ratio (PER) refers to the error rate of LCH PDU [4].
Bit Error Rate (BER)
Convolutional encoder is used to provide Forward Error Correction (FEC) by a convolutional code of rate ½ and constraint length equal to seven. Other code rates (such as 9/16 and ¾) are obtained by puncturing. Puncture and insert error blocks are used in pair to realize the puncturing procedure. The modulation scheme is QPSK with convolutional code rate of ¾. Fig. 2 shows the effect of different PHY modes’ on HIPERLAN/2 BER performance. Note BPSK/QPSK has better BER performance than M-QAM. BPSK with r = ½ is the most reliable mode, followed by BPSK with r = ¾, QPSK with r = ½, QPSK with r = ¾, 16-QAM with r = 9/16, and 16-QAM with r = ¾. 64-QAM (r = ¾) has the worst BER performance.
In addition to white noise, there is another kind of noise called phase angle noise. This also influences BER and PER performance. With QAM modulation scheme, after modulation the signal becomes a complex value. Phase angle noise is added in the phase angle of each signal like a random noise. This acts simultaneously with Gaussian white noise. Fig. 3 shows the effect of phase angle noise for M-QAM modulation schemes. When the phase angle increases, the performance of BER decreases. Small Eb/No implies that white noise has more influence than phase angle noise on the BER performance of
3

Mobility Conference 2004
HIPERLAN/2. With increased Eb/No, phase angle noise begins to show its effect on BER values.
Figure 2: BER performances for different PHY modes
Figure 3: Influence of phase angle noise on BER performances
Transmission Delay
The PHY mode with best BER performance has the least transmission delay. Transmission delay occurs due to retransmission of error PDUs. A LCH PDU contains 54 bytes and carries both control information and user data. The payload is 49.5 bytes and the remaining 4.5 bytes are used for PDU type (2 bits), a sequence number (10 bits) and cyclic redundancy check (CRC-24). In the simulation models we made two assumptions. If one or more error occurs in the first 51 bytes of a PDU, CRC detects and sends a retransmission request. Using Selective Repeat (SR) ARQ, error PDUs are reordered by sequence number during retransmission, but the delay caused by reordering is neglected. The error PDUs are successfully retransmitted. Knowing the total number of the error
4

Mobility Conference 2004
PDUs we calculate the transmission delay by multiplying this with the time spent in one PDU transmission. Fig. 4 shows the transmission delay for different PHY modes.
System Throughputs
System throughput is calculated by considering the protocol overhead introduced by MAC and ARQ re-transmissions.
Figure 4: Transmission delay for different PHY modes
MAC layer throughput is expressed as:
[ ] msBLMACThruputLCHpSLCH 2/848)54(_ ××= (1)
LLCH is the number of OFDM symbols available in the MF for data PDUs (LCH-PDUs) and BpSLCH is the number of bytes to be transmitted per OFDM symbol [5]. Equation (1) shows that the MAC throughput is determined by the selected PHY mode. However, the DLC throughput is influenced by ARQ. The DLC throughput is expressed as [6]:
η×= MACThruputDLCThruput __ (2)
where )1( mod ePHYPER−=η
Fig. 5 shows the system throughput for different PHY modes. Since BPSK (r = ½) has almost no transmission delay due to lower BER, a large amount of system resources is required by this PHY mode; this results in the lowest total system throughput. With 16-QAM (r = ¾), we can optimize system throughput, but the connection experiences a high transmission delay. The high delay may be tolerable for best effort traffic, but not for real-time traffic. BPSK (r = ½) provides the best quality of service in terms of low BER. User
5

Mobility Conference 2004
should pay higher rate for this service. 64-QAM (r = ¾) that tolerates more errors should be cheaper. A user should be able to pick up whatever service he or she wants to satisfy the quality requirements with a least cost.
Figure 5: System throughput for different PHY Modes
APPLICATION OF SIMULATION RESULTS There are three traffic types ranging from low to high QoS requirements ⎯ Best Effort LAN traffic, video traffic, and voice traffic. Change of arrival time for the Best Effort traffic generates different traffic load conditions. Video traffic based on MPEG-1 standard, has variable bit rate and generates IP packets of different lengths in constant intervals. Voice traffic can be a N-ISDN voice source.
N-ISDN traffic has a constant bit rate and has the highest priority. Best Effort traffic has the lowest priority. They are real-time traffic with tight delay requirements. If we use BPSK (r = ½) PHY mode, there is almost no error when Eb/No is more than some threshold value. If we change the PHY mode to QPSK (r = ¾), both N-ISDN and MPEG traffic require retransmission due to errors. The MPEG packets have higher delay than N-ISDN packets due to their length. N-ISDN traffic can be transmitted within one MAC frame because of short packet length. The MPEG packets need to be segmented and require transmission over several MAC frames. The re-sequencing of DLC PDUs in the receiver causes high transmission delay in MPEG. The DLC strategy should be different for the Best Effort traffic, since this type of traffic can tolerate more errors and can be delivered by the transmitter as best as it can without any assurance of delay bounds and reliability. The PHY mode with highest throughput should be used to increase system capacity. If we choose PHY mode as 16-QAM (r = ¾), the total system throughput will be 16 Mbps when Eb/No is 10 dB. At this point, there is almost no error and retransmission is not required. As Eb/No decreases, the PER increases, the ARQ re-transmission also
6
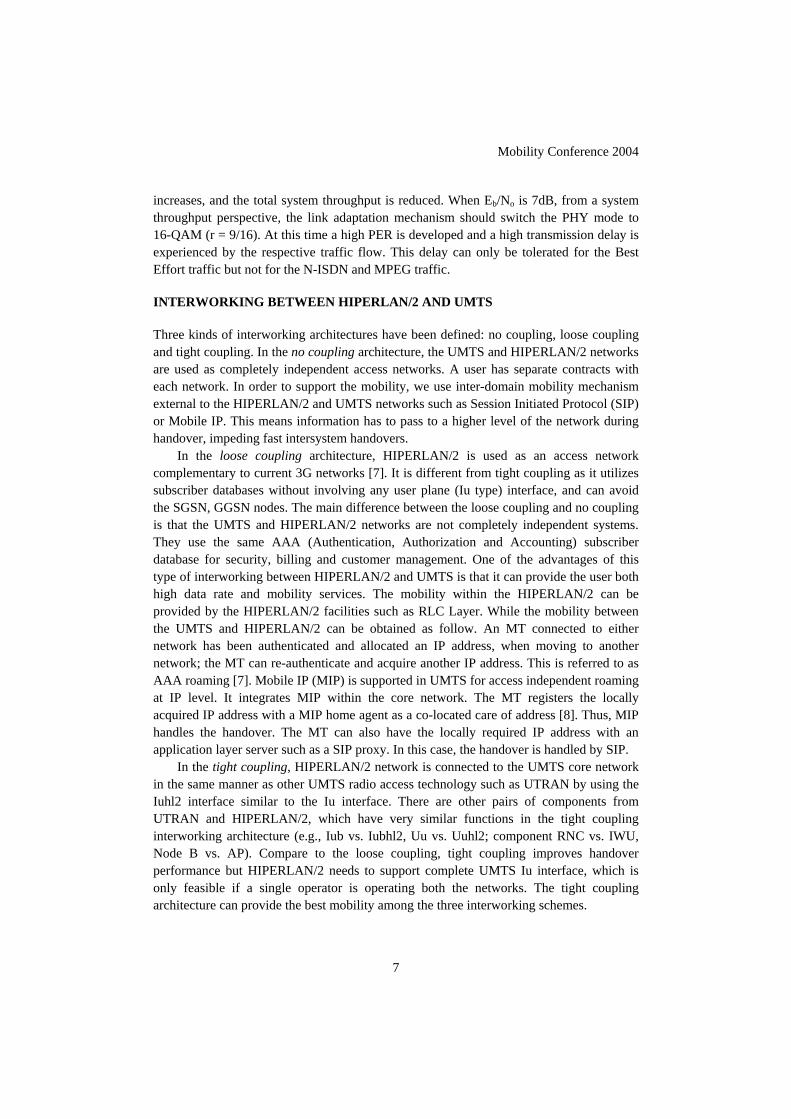
Mobility Conference 2004
increases, and the total system throughput is reduced. When Eb/No is 7dB, from a system throughput perspective, the link adaptation mechanism should switch the PHY mode to 16-QAM (r = 9/16). At this time a high PER is developed and a high transmission delay is experienced by the respective traffic flow. This delay can only be tolerated for the Best Effort traffic but not for the N-ISDN and MPEG traffic. INTERWORKING BETWEEN HIPERLAN/2 AND UMTS Three kinds of interworking architectures have been defined: no coupling, loose coupling and tight coupling. In the no coupling architecture, the UMTS and HIPERLAN/2 networks are used as completely independent access networks. A user has separate contracts with each network. In order to support the mobility, we use inter-domain mobility mechanism external to the HIPERLAN/2 and UMTS networks such as Session Initiated Protocol (SIP) or Mobile IP. This means information has to pass to a higher level of the network during handover, impeding fast intersystem handovers.
In the loose coupling architecture, HIPERLAN/2 is used as an access network complementary to current 3G networks [7]. It is different from tight coupling as it utilizes subscriber databases without involving any user plane (Iu type) interface, and can avoid the SGSN, GGSN nodes. The main difference between the loose coupling and no coupling is that the UMTS and HIPERLAN/2 networks are not completely independent systems. They use the same AAA (Authentication, Authorization and Accounting) subscriber database for security, billing and customer management. One of the advantages of this type of interworking between HIPERLAN/2 and UMTS is that it can provide the user both high data rate and mobility services. The mobility within the HIPERLAN/2 can be provided by the HIPERLAN/2 facilities such as RLC Layer. While the mobility between the UMTS and HIPERLAN/2 can be obtained as follow. An MT connected to either network has been authenticated and allocated an IP address, when moving to another network; the MT can re-authenticate and acquire another IP address. This is referred to as AAA roaming [7]. Mobile IP (MIP) is supported in UMTS for access independent roaming at IP level. It integrates MIP within the core network. The MT registers the locally acquired IP address with a MIP home agent as a co-located care of address [8]. Thus, MIP handles the handover. The MT can also have the locally required IP address with an application layer server such as a SIP proxy. In this case, the handover is handled by SIP.
In the tight coupling, HIPERLAN/2 network is connected to the UMTS core network in the same manner as other UMTS radio access technology such as UTRAN by using the Iuhl2 interface similar to the Iu interface. There are other pairs of components from UTRAN and HIPERLAN/2, which have very similar functions in the tight coupling interworking architecture (e.g., Iub vs. Iubhl2, Uu vs. Uuhl2; component RNC vs. IWU, Node B vs. AP). Compare to the loose coupling, tight coupling improves handover performance but HIPERLAN/2 needs to support complete UMTS Iu interface, which is only feasible if a single operator is operating both the networks. The tight coupling architecture can provide the best mobility among the three interworking schemes.
7

Mobility Conference 2004
CONCLUSION HIPERLAN/2 is a high-speed broadband WLAN standard. 3G networks and beyond will incorporate a wide range of radio access technologies to provide seamless service to users with high mobility and support broadband local radio access. Combining 3G networks with HIPERLAN/2 has potential to offer users both mobility/connectivity and high data rates in the unlicensed spectrum band. There are three kinds of interworking architecture ⎯ no coupling, loose coupling and tight coupling. Loose coupling interworking approach is obviously the optimum solution to realize all IP based network. To achieve QoS interworking between HIPERLAN/2 and UMTS, the focus should be from the end to user part through HIPERLAN/2 network connected to an IP network. This suggests the importance of QoS mapping between IP layer and HIPERLAN/2 link layer.
The connection-oriented nature of HIPERLAN/2 is helpful in defining enhancements to serve IP connections according their QoS requirements. Seven PHY modes with different modulation schemes and coding rate are available in HIPERLAN/2. Selection of a suitable PHY mode to satisfy the requirements of a DLC connection is a trade-off between delay and throughput. For the given radio conditions, DLC functions such as link adaptation and ARQ allow to adapt the HIPERLAN/2 transmission as per connection’s delay requirements. Several DLC scheduling mechanisms can be used to play an important role in prioritizing and guaranteeing specific DLC services for various IP connections or groups of connections. REFERENCES
[1] Martin, Jognsson: HIPERLAN/2 – The Broadband Radio Transmission Technology Operating in the 5Ghz Frequency Band. Hiperlan/2 Global Forum, version 1.0, 1999.
[2]Khun-Jush, P. Schramm, U. Washsmann, G. Wenger: Structure and Performance of HIPERLAN/2 Physical Layer. IEEE VTC’99 Fall (Amsterdam), pp. 2667-2671
[3]The Math works home supported documentation: Learning About the Communication Block set. http://www.mathworks.com/access/helpdesk/help/toolbox/commblks/commblks.shtml
[4] Angela Doufexi, Simon Armour, Andrew Nix, and David Bull: A Comparison of HIPERLAN/2 and IEEE 802.11a Physical and MAC layers. Centre for Communication Research, University of Bristol, UK.
[5]A. Kadelka, A. Hettich, and S. Dick: Performance Evaluation of the MAC Protocol of ETSI BRAN HiperLAN/2 Standard. Proc. of the European Wireless’99, ISBN 3-8007-2490-1, (Munich, Germany), pp. 157-162, Oct. 1999
[6] B. Walke: Mobile Radio Networks. New York, USA: Wiley & Sons Ltd., 1, ed., 1999. [7] ETSI TR 101 957 V1.1.1 Technical Report: Requirements and Architectures for Interworking
between HIPERLAN/2 and 3rd Generation Cellular systems. [8] Markus Peuhkuri: IP Quality of Service. Helsinki University of Technology, Laboratory of
Telecommunications Technology. http://keskus.hut.fi/u/puhuri/htyo/Tik-110.551/iwork/iwork.html
8

UBIQUITOUS-TO-UBIQUITOUS ENVIRONMENT (U2E): SECURITY ARCHITECTURES, CHALLENGES AND MODELS
CHAN YEOB YEUN1, ENG KEONG LUA2, JON CROWCROFT2
1Toshiba Telecommunication Research Laboratory 32 Queen Square, Bristol, BS1 4ND, United Kingdom
Email: [email protected] 2University of Cambridge, Computer Laboratory
15 J J Thomson Avenue, Cambridge, CB3 0FD, United Kingdom Email: eng.keong-lua,[email protected]
Abstract. Emerging ubiquitous telecommunications systems will enable interactions between various types of device, in both wired and wireless networks, and among Peer-to-Peer (P2P) application overlay networks, thus, evolving into a Ubiquitous-to-Ubiquitous Environment (U2E) infrastructure. This will permit users to build their own ubiquitous communication services using a combination of different P2P communication technologies. Dynamic, heterogeneous and distributed P2P overlay networks will help to create new ubiquitous services, through the convergence of communications and highly adaptive reconfigurable terminals. They will also bring new challenges. In this paper, we will discuss the evolution of U2E computing, its security architectures, challenges, and proposed solution models. We will discuss the U2E infrastructure, and problems involved in securing ubiquitous environments. Our goal is to discuss U2E evolution, to survey its security issues, establish key requirements for its security architectures, and propose feasible security models.
I. INTRODUCTION Ubiquitous computing [18],[19],[10] means the availability of computing and communication resources whenever and wherever we are. Ubiquitous communication is also the method of enhancing mobile devices and computers usage by making them available throughout the physical environment, but making them effectively invisible to the user. Due to the dynamic nature of ubiquitous communications, there exist numerous threats, for example, a hacker can gain control of user terminals or devices, eavesdropping of communications channels, modification of sensitive m-commerce transactions, Denial of Services (DoS), transaction of services or goods in other party’s identities, etc. Therefore, one must not only provide the safeguards and countermeasures from these threats but also to develop ubiquitous security applications in an increasingly interconnected ubiquitous society, where there is continuous, seamless use of wireless

2
networking and broadband technologies, which can ensure secure communications with anyone, any organizations, anytime, anywhere, using any networks and any devices (A6). With the current usage of 3G communications systems [1], [15] and WiFi, it is obvious that future mobile terminals will require access to an increasing number of services. The immense potential exists to provide these services to a variety of ubiquitous computing devices using a range of communications technologies. Some of these terminals could be linked to form Wireless Personal Area Networks (WPANs) [14], allowing the users to have access to home, car, and office networks. Considering wireless personal networking concept, we could envision an infrastructure to allow interaction between personal devices using a range of ubiquitous communications technologies. The availability of Peer-to-Peer (P2P) environment will enable wider access to on-demand services, creating overlays of Ubiquitous-to-Ubiquitous Environment (U2E). This has obvious benefits to the consumer, the network operator, and the service provider. Thus, U2E becomes a “hot issue” for industry and academia, who are currently working towards the development of secure ubiquitous applications and provisioning of a secure environment to operate on. Firstly, this paper illustrates the secure heterogeneous environments for U2E. In order to understand the security issues, we could begin with an overview of the concept of the U2E itself. This is introduced in Section II; follow by an illustration and discussion in Section III which discusses the characteristics of U2E that identify security challenges. Having pointed out these challenges, Section IV will describe what is required to secure the U2E and Section V describe our propose security model of U2E. Section VI concludes by highlighting the potential areas of future research and ongoing work on security model to develop security mechanisms for the ubiquitous society. II. BACKGROUND The basic concept of the U2E is founded on the belief that future ubiquitous telecommunications systems will allow wired, and wireless, terminals access to a vast range of services over a heterogeneous of wireless internetworking, creating many collaboration networks. The terminal available to the user will form Mobile Ad hoc P2P (MAP2P) network, which form self-organizing P2P infrastructures [8] with anyone, any organizations, anytime, anywhere, using any networks and any devices (A6). According to [18], [19], the U2E associates with multiple terminals accessing multiple services through different networks. This situation resembles the IST WSI Project concept of a MultiSphere [20] where the user has access to many different terminals interlinked by a number of gateway terminals. An overview of the ubiquitous society is illustrated in Figure 1.

3
Figure 1: Ubiquitous Society Environment
In the ubiquitous society, we envisage a continuous, secure and seamless use of wireless networking and broadband technologies in mobile communication, office networking, vehicular networking and home networking. Looking at the scenarios for ubiquitous society:
• Doors are opened only to the authorized persons. • Rooms are intelligent to greet people by names and identities.
• Telephone calls can be automatically forwarded to any locations and with a
smart “follow me” feature.
• People are able to be located, and ubiquitous terminals can retrieve the information of users nearby. Virtual intelligent agents could interact with other virtual agents. This is analogous to the active badge system developed by the Laboratory of Communication Engineering, University of Cambridge [23].
• Well-connected equipments at home allowing automation for smart home
environment.
• Location and information systems and services for people on the move in vehicles, allowing timely delivery of updated information.
The challenges of securing ubiquitous society environment are illustrated in Figure 2.

4
Figure 2: Security for Ubiquitous Society U2E’s coverage is not inevitably widespread but could take place in islands. This may or may not be interlinked by clusters of cooperating networks. Thus, a specific session may not be seamless but it is established or continued whenever the user is within the coverage of the service delivery mechanisms. These delivery mechanisms could comprise of Digital Multimedia Broadcast (DMB), wireless networks, or personal MAP2Ps. The devices grouping in MAP2Ps are diverse and originated from different ubiquitous computing environments that users have associated with, namely the office environment (e.g. remote access control, company Intranet), the home environment (e.g. home PC, consumer electronics, Set-top Box (STB), home gateway), the vehicle environment (e.g. DMB, mobile terminals, navigation system), and the personal (WPAN) environment (e.g. mobile terminals, Pocket PC, WiFi laptop). For illustrations, a user of U2E could configure easily a home server or STB in the home network to monitor schedules for selecting the movie of choice. When the user is traveling, he is able to receive a message forwarded by the STB to inform that a selected movie is going to start. The user may receive this message through MMS provided by 3G or IEEE 802.11/802.15 systems. The user could send an instruction to home server/STB to transmit the movie to him via the U2E infrastructures. Such delivery of services is delivered by differing network infrastructures that are interconnected, so that the user would continue to enjoy the service seamlessly, without any interruptions.
Bill Payment Credentials
ISSUERBANK
ACQUIRERBANK Authorization &
Clearing Network
Securing Home Area
Securing Office Area
Securing M-Commerce
Securing Car Area
WPAN P2P
MAP2P
MAP2P
GPS enabled car
5
To capitalize on this trend described, we could build Structured P2P overlays, such as, Content Addressable Network (CAN) [24], Chord [13], Pastry [2], Tapestry [3], etc. [8] on these networks, to provide and create a self-organizing MAP2P substrate. Structured MAP2P overlays allow ubiquitous applications to locate any object or service in some form of a probabilistically bounded manner, with small number of network hops, by having per-node routing table containing only a small number of entries. These overlay networks form part of U2E infrastructure that are scalable, self-organizing, and fault-tolerant and provide effective load-balancing. III. SECURITY ARCHITECTURE OF U2E There exist numerous threats, for example, a hacker gaining control of users’ terminals or devices, eavesdropping of communication channels, modification of sensitive m-commerce transactions, denial of services, transaction of services or goods in other identities, etc. Thus, U2E infrastructure will require the provision of certain degree of security between participating devices and terminals. There are a number of security challenges which have to be addressed to make a secure U2E environment. These challenges are described in the following subsections.
A. Heterogeneous Characteristics of the U2E
One of the important objectives of U2E infrastructure is to allow interconnection of wired and wireless networks, so that services and applications are accessible in any networks. Attack by malicious nodes in any networks can happen. An example of such attacks is the Denial of Service (DoS) attack, which corrupt application-level communications by giving erroneous response to request and misroute of traffic. Therefore, the challenge is to prevent DoS attacks by incorporating appropriate security protocols and managing credentials in a manner that end-to-end security is achieved from the user’s perspective, as unobtrusively as possible.
B. Dynamic Characteristics of U2E Self-Organizing Environment
A major motivation of the U2E is to allow U2E users to obtain a vast variety of services from a wide choice of service providers. Thus, there exist many services that could be supplied on demand, with security enforced. These services could be utilized by a variety of different U2E users’ terminals or devices. Thus, certain levels of Quality of Service (QoS) that are available to U2E users will depend on locations and the processing resources available at the moment of time.
6
As U2E users travel from one network to other networks, security must be reconfigured dynamically because U2E users’ network environment may change when they join, leave and rejoin the networks. Moreover, the security threats imposed by one network differ from another network. Thus, due to this dynamism, U2E users’ terminals and devices will require authentication and authorization as they join, leave and rejoin the U2E infrastructure. Furthermore, security could be provisioned through the authentication of a user-centric dynamic Virtual Private Network (VPN). Although U2E applications would be built on MAP2P overlay substrate, that are explicitly designed to spread load across nodes, “hot-spots” can still occur, particularly if one node is responsible for a particular popular content. Thus, certain users may have gained more access from the network than they wanted to give back.
C. Privacy and Trust Characteristics
Different degrees of trust may be required for different users and their devices; this will be reflected in the U2E record and resources to determine the users and their terminals or devices are authorized to access. On the MAP2P application level overlay substrate, applications implemented must be trusted to operate correctly. MAP2P nodes typically have full privileges to access the network and hard disk. Thus, security architecture should be designed to safely execute distrusted applications and access shared data that might not be trustworthy in the control environment. IV. SECURITY CHALLENGES IN THE U2E The security requirements consist of two categories: general and U2E-specific.
A. General Security Objectives
Confidentiality and Integrity – This is a service used to ensure authorized access of the content of information. U2E management information needs to be protected in storage and during transmission. One such protection is through password. Other protection could be done through the use of a cryptographic hash of a file’s contents as the key during the storing and retrieval of the file. When the user receives a copy of the file, it checks its integrity. If the user failed to receive a copy of the file, or if the integrity checks failed, then the user can use secure routing to retrieve a correct copy or to verify that the file is simply unavailable in the U2E infrastructure. It is important to use secure routing to prevent malicious nodes to corrupt or misroute traffic and to ensure that all replicas are not stored on faulty nodes. Authentication – This is the most important of all security services, as it allows one entity to verify the identity of another entity. Mutual authentication is required in the

7
U2E. Thus, we require mutual authentication protocols to prevent “man-in-the-middle” for User-to-Device (U2D), Device-to-Device (D2D), Device-to-Network (D2N), and User-to-Service-Provider (U2S) authentications. In addition, we require U2E-specific User-to-U2E and Device-to-U2E authentication protocols. Authorization – This is the process of giving a U2E device the permission to execute tasks and assign user’s access rights on that device. For home devices, U2E environment authorization corresponds to the user’s access rights on particular terminals and devices. For foreign devices, the owner of the device delegates certain access rights to foreign users who will need to pay for the use of these foreign devices in most cases. Non-repudiation – This is a service that prevents an entity from denying previous commitments or actions.
B. U2E-specific Security Requirements
Interoperability with local security solutions – U2E comprises of devices in different security domains. Each domain has the local security solutions but it is doubtful that they will be well matched with security solutions in other domains and at the U2E level. Since these local security solutions are very difficult to be altered, the security for U2E architecture needs to be compatible with existing local security solutions. Any security architecture proposed for the U2E must not be dependent on specific security protocols. Availability of U2E management functions – U2E is a very dynamic self-adapting environment with devices joining and leaving the networks. If a device behaved as a gateway to a subnetwork, it will affect the entire subnetwork when it leaves. As the U2E environment requires to be in proper operation despite these dynamic changes, U3 Device Management (UDM) function need to be globally available. Best effort operation of U2E – it is vital that the U2E works as smoothly as possible with any other resources. The issue of incentives emerges as the predominant problem for multiple users accessing shared resources with one another in a MAP2P manner. Why should one user allow his/her resources, such as machine resources and network bandwidth, to be used by another user? If possible, a user might prefer to contribute nothing for the common good, and consume others’ resources without paying them. To prevent such a ‘tragedy of the commons’ [12], several proposals to implement incentives modeling [16] and game theoretical approach [4], [9] to implement cooperation could be proposed. U2E resources can be considered as a commodity in a MAP2P overlay network as a barter economy, such as the bartering of wireless network resource access during roaming [7]. Nodes trade the use of their local resources for the use of other nodes’ remote resource. Protection, revocation, and renewal of credentials – U2E user’s credentials exist at different layers. For example, these credentials can exist at the link layer for wired and wireless communications, and IP (and IPSec) at the network layer. At the transport layer,

8
SSL/TLS security protocols could be embedded. The U2E user credentials also exist at the U2E overlays, above the transport layer, but below the application layer (middleware layer where the user services run). Of course, all these credentials need to be adequately protected, and protocols put in place for their revocation and renewal. In addition, we have to bear in mind that, depending on the technology, the end points of the security associations may differ. Different security protocols exist in the different subnetworks of the U2E infrastructure; uniform protocols are required at the U2E level. These protocols unify the existing solutions of a heterogeneous and dynamic environment. Delegation – U2E has environments that engage numerous devices and services running on these devices on behalf of the U2E users. Because of the self-adapting characteristics of the U2E, a service could change the device or the entire subnetwork where it is running, for example, by moving from a car environment into the home environment. It is very much complicated for the U2E users to authorize all these changes and therefore it is necessary that the users delegates their rights to a management function acting on their behalf by using mobile agents [5]. Platform protection – A major motivation behind the development of the U2E is the ability to download applications securely to the U2E devices [5], [6] and allowing the U2E devices to be reconfigured. Since the goal of the U2E devices is to give access to a vast variety of services, if restrictions are not placed on the source of downloaded applications, then there is a risk that malicious applications may reconfigure a device in an unauthorized manner. Therefore, it is important to provide some form of Secure Mobile Execution Environment (SMExE) to protect the platform from such attacks. Single sign-on – the U2E interoperates with other existing environments, each of which has a specific authentication infrastructure in place. A single sign-on method is proposed and described in Section V. Since the users need to authenticate different devices, networks, and services, all acting in different roles, it is necessary to implement a single sign-on solution. This will allow users to authenticate only once to initiate U2E seamless operations in all environments. This is important so that the U2E users can leave and join the differing networks without any interruptions. Content protection – significant driving force behind the development of the U2E is the capability to deliver new services to the U2E users. It is envisaged that a considerable number of these services will engage the provision of DMB content. As the digital nature of such content allows perfect copies to be made, content providers are naturally concerned that their copyright is protected. For U2E environments to fully exploit the potential access to DMB content, some forms of Digital Rights Management (DRM) system will be required and implemented in U2E devices.

9
V. SECURITY MODEL OF U2E
We assume that all the devices that belong to one particular domain have been securely bootstrapped with the U2E server within that particular domain [11]. Our security model for U2E User (termed as U3 user) and application environments is based on the enhanced version of Kerberos [17], i.e. a U3 user who wish to use one or more U2E services that are provided by different U2E servers such as S1 (Home Server), S2 (Car Server), S3 (Shopping Server), S4 (Office Server),…,SN (N server), are connected over insecure networks. Strictly speaking, we have successful adopted a hybrid technique by combining a well-known network authentication technique and a single logon mechanism for our proposed U2E security models. There are three stages of securing U3 users and application environments in our model which are described as follows: Authentication stage: U3 users first authenticate themselves to an Authentication Server (AS) (by using single sign-on techniques) that will issue U3 users with a temporary permit to request access to services. This permit is called a Ticket-Granting Ticket (TGT) and is comparable to a passport with a limited duration of validity period (lifetime). Access control stage: Each U3 user uses the TGT in a second stage to receive a service-specific access authorization, for example, it can be used for access to server S1, S2,…,SN that offer printing and file services. The TGT verifies that each U3 user is authorized to have access to the service requested and it responds with a Service Granting Ticket (SGT) for server S1, S2, …, SN. Key negotiation stage: The AS generates a session key for communication between U3 users and Ticket Granting Server (TGS). The TGS generates a corresponding session key for communication between U3 users and the service specific servers. Figure 3 illustrates an overview of our model and the algorithmic descriptions. Step 1: U3 users then log into their mobile terminals or devices and requests access to a particular service. The mobile terminals or devices send the first message M1 with U3’s time stamp 3UT and nonce 3UN :
3 31: 3 : ( 3, , , )U UM U AS U TGS T N→ Step 2: AS verifies in its users database that it knows U3 users. From U3 users’ biometrics data (scanned fingerprints, voice and face recognitions implemented together with password protection.), where they are also stored in the user database, a symmetric

10
key 3UK is then generated. It then extracts the identities such as IP address and MAC address of U3 users’ terminals ( 3UID ) from the U3’s protocol data unit received. AS then creates a ticket TGSTicket and a session key 3,U TGSK , and sends the second message M2 to U3:
3 3, 32 : 3 : ( , , , , ),UK U TGS U AS TGS TGSM AS U E K TGS N T L Ticket→
where KE is encryption by using a symmetric key K, xK means x’s secret key, ,x yK means a session key for x and y, and L is Lifetime (validity period) of TGSTicket which is defined as follows:
, 3, 3( , , , , , )TGS AS TGS U TGS U AS TGSTicket E K U ID TGS T L=
Figure 3: Overview of proposed U2E model and the algorithmic description
Step 3: Upon receipt of M2, the mobile terminals or devices request U3 users to enter biometric data together with their passwords. These are used to compute symmetric key
3UK so that the mobile terminals or devices can decrypt the message. If any of the U3 users did not enter the correct passwords, the key 3UK will not be computed correctly and consequently it will fail. Finally, U3 users generate an Authenticator and sends it together with their TGT and the name of desired server S1, S2, …, SN to TGS:
3 3,3 : 3 : ( , , )TGS U TGSM U TGS S Ticket Authenticator→ where,
3 ,
'3, 3 3( 3, , )
U TGSU TGS K U UAuthenticator E U ID T=
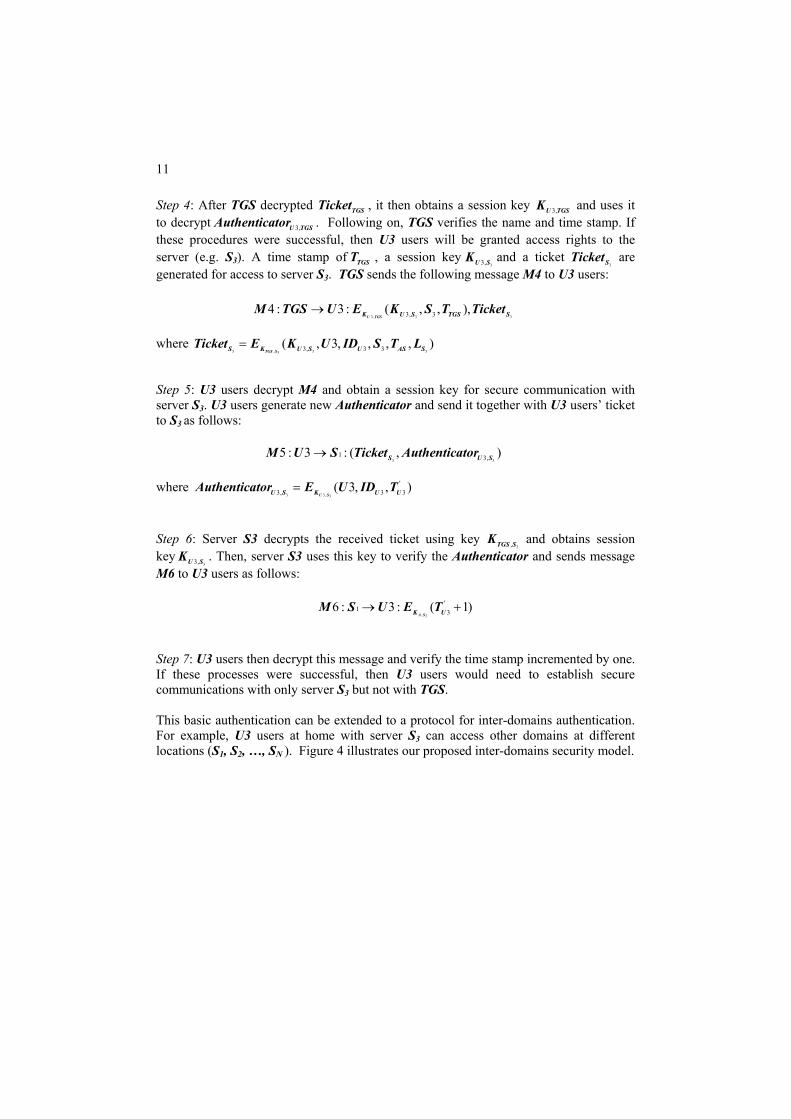
11
Step 4: After TGS decrypted TGSTicket , it then obtains a session key 3,U TGSK and uses it to decrypt 3,U TGSAuthenticator . Following on, TGS verifies the name and time stamp. If these procedures were successful, then U3 users will be granted access rights to the server (e.g. S3). A time stamp of TGST , a session key
33,U SK and a ticket 3STicket are
generated for access to server S3. TGS sends the following message M4 to U3 users:
3, 3 33, 34 : 3 : ( , , ),U TGSK U S TGS SM TGS U E K S T Ticket→
where
3 , 3 333, 3 3( , 3, , , , )
TGS SS K U S U AS STicket E K U ID S T L= Step 5: U3 users decrypt M4 and obtain a session key for secure communication with server S3. U3 users generate new Authenticator and send it together with U3 users’ ticket to S3 as follows:
3 31 3,5 : 3 : ( , )S U SM U S Ticket Authenticator→
where
3 3 , 3
'3, 3 3( 3, , )
U SU S K U UAuthenticator E U ID T= Step 6: Server S3 decrypts the received ticket using key
3,TGS SK and obtains session key
33,U SK . Then, server S3 uses this key to verify the Authenticator and sends message M6 to U3 users as follows:
, 3
'1 36 : 3 : ( 1)
A SK UM S U E T→ + Step 7: U3 users then decrypt this message and verify the time stamp incremented by one. If these processes were successful, then U3 users would need to establish secure communications with only server S3 but not with TGS. This basic authentication can be extended to a protocol for inter-domains authentication. For example, U3 users at home with server S3 can access other domains at different locations (S1, S2, …, SN ). Figure 4 illustrates our proposed inter-domains security model.

12
Figure 4: Proposed inter-domains security model
Inter-domains authentication requires two TGS belonging to both domains, and they must have an agreed secret key
3 1,TGS TGSK . For example, local TGS3 for server S3 will view the remote TGS1 for server S1 as a normal server and thus, it can issue a ticket for it. After U3 users obtained
1TGSTicket for server S1 in the remote domain, U3 users can send a request to the remote TGS1 to issue U3 users with
1STicket for the requested server S1. It is vital to note that remote domains trust the AS of the local domain as they do not carry out their own authentication check of the visiting U3 users. Thus, we could achieve uniform credentials with our proposed security model. Our security model uses symmetric algorithm such as AES [21] to secure communications. Our authentication mechanism could prevent password guessing techniques by implementing biometrics data (what you are) with password (what you know) protections (note also that the biometric should be done in “live test condition”, otherwise there exist possible attacks due to the problem of human failures that was discussed by Ross Anderson in his book [22]). This will allow single sign on. We also introduce a nonce for the freshness of message together with a time stamp. This will prevent a reply attack. Note that the time stamp may require synchronized clock for both ends, so we have to introduce an additional counter measure, i.e., a nonce. Nevertheless, this security model requires further improvements and enhancements, such as the issues that involve the addressing of delegation issues and the need to develop asymmetric key techniques. These are still ongoing work in research.

13
CONCLUSIONS
In this paper, we have discussed security challenges for ubiquitous society. Future ubiquitous communications systems will enable interaction between increasingly diverse ranges of devices that are Internet-enabled, both mobile and stationary. This will allow the U2E Users (U3) to construct their own ubiquitous services using a combination of different communication technologies. Dynamic, heterogeneous and distributed networks will create new opportunities, through the convergence of communications technologies and creation of highly adaptive reconfigurable terminals. New challenges will emerge. The objective of the U2E security work is to define a global U2E security architecture which addresses these complex issues that meets the security requirements, as described in Section IV. Our security model of U2E proposed in Section V has the objectives to develop novel solutions for ubiquitous security that will ensure secure ubiquitous communications with any devices, at anytime and anywhere. U2E Device Management (UDM) with asymmetric techniques such as ID-based cryptosystems is an ongoing research and these techniques could provide intelligent facilities for securing applications in inter-domains environments, as well as in securing military applications. These will create a number of U2E-business applications and products and gradually lead to the development U2E infrastructure in the near future. We also envisage that the ID-based techniques are suitable for the global U2E security architecture. However, delegation and asymmetric key techniques for U2E are open for further research. In conclusion, our ultimate goal is to develop a series of protocols for future ubiquitous security architectures with UDM capability that could lead towards the ubiquitous-to-ubiquitous environment. REFERENCES [1] 3rd Generation Partnership Project (3GPP), http://www.3gpp.org/ [2] A. Rowstron, and P. Druschel, “Pastry: Scalable, distributed object location and
routing for large-scale peer-to-peer systems,” Proceedings of Middleware, 2001 [3] Ben Y. Zhao, Ling Huang, Jeremy Stribling, Sean C. Rhea, Anthony D. Joseph, and
John Kubiatowicz, “Tapestry: A Resilient Global-scale Overlay for Service Deployment,” IEEE Journal on Selected Areas in Communications, Vol. 22, No. 1, January 2004.
[4] C. Buragohain, D. Agrawal, S. Suri, “A Game-Theoretic Framework for Incentives in P2P Systems,” Proceedings of 3rd IEEE P2P Computing, Linkoping, Sweden, September 1-3, 2003.
[5] C.Y. Yeun, G. Kalogridis, G. Clemo “Secure Mobile Delegation for Future Reconfigurable Terminals and Applications,” Proceedings of Software Defined Radio Technical Conference (SDR’02), San Diego, USA, November 2002.
[6] C.Y. Yeun and T. Farnham. “Secure Software Download for Programmable Mobile User Equipment,” Proceedings of 3G Mobile Communication Technologies, at the 3rd IEE International Conference, IEE, London, UK, May 2002, pp 505-510.

14
[7] E. K. Lua, A. Lin, J. Crowcroft, and V. Tan, “BarterRoam: A Novel Mobile and Wireless Settlement Model,” Proceedings of 4th Int. Workshop on Advanced Internet Charging and Quality of Service Technologies (ICQT’04), Barcelona, Catalunya, Spain, September 29-Octobter 1, 2004.
[8] E. K. Lua, J. Crowcroft, M. Pias, R. Sharma, and S. Lim. “A Survey and Comparison of Peer-to-Peer Network Schemes,” Submitted to IEEE Communications Survey and Tutorial, March 2004.
[9] E. K. Lua and J. Crowcroft, “A Game Theoretical Incentives Model for Cooperation in Peer-to-Peer Networked Systems,” Unpublished paper, April 2004.
[10] F. Stajano, “Security for ubiquitous computing,” John Wiley & Sons Inc, February 2002.
[11] F. Stajano and R. Anderson, “The Resurrecting Duckling: Security issues in Ad-hoc wireless networks,” Proceedings of 3rd AT&T Software Symposium, Middletown, NJ, October 1999.
[12] G. Hardin, “The Tragedy of the Commons,” Science 162, 1968, pp. 1243-1248. [13] I. Stoica, R. Morris, D. Karger, M.F. Kaashoek, and H. Balakrishnan, “Chord: A
scalable peer-to-peer lookup service for internet applications,” Proceedings of ACM SIGCOMM, 2001, pp. 149-160.
[14] IEEE 802.15 Working Group for WPAN: http://grouper.ieee.org/groups/802/15/ [15] Introduction to 3G, http://www.3g.co.uk/AllAbout3G.htm [16] J. Crowcroft, R. Gibbens, F. Kelly, S. Ostring, “Modelling incentives for
collaboration in Mobile Ad Hoc Networks,” Proceedings of WiOpt'03: Modeling and Optimization in Mobile, Ad Hoc and Wireless Networks, 2003.
[17] J. Kohl and C. Neuman, “The Keboros Network Authentication Service,” Network Working Group Request for Comments: 1510, September 1993.
[18] M. Satyanarayanan, “Pervasive Computing: Vision and Challenges,” Proceedings of IEEE Personal Communicaitons, August 2001.
[19] M. Weiser, “The Computer for the Twenty-First Century,” Scientific American, September 1991, pp. 94-104.
[20] N. Niebert, “Results of the Think Tank Work 2000 – the Issues,” http://www.ist-wsi.org/N_Niebert.pdf
[21] NIST (National Institute of Standards and Technology), FIPS (Federal Information Processing Standard) Publication 197: Specification for the Advanced Encryption Standard (AES), 2001.
[22] R. Anderson, “Security Engineering: A guide to building dependable distributed systems,” John Willey & Sons Inc, April 2001.
[23] R. Want, A Hopper, V. Falcao and J. Gibbons, “The Active Badge Location System,” Proceedings of ACM Transaction on Information Systems, Vol. 10, No. 1, January 1992, pp. 91-102.
[24] S. Ratnasamy, P. Francis, M. Handley, R. Karp, and S. Shenker, “A scalable content addressable network,” Proceedings of ACM SIGCOMM, 2001, pp. 161-172.

Mobility Conference 2004
FLEXIBLE LAYER ONE FOR THE GSM/EDGE RADIO ACCESS NETWORK (GERAN)
TOMMI JOKELA
Nokia Technology Platforms, Itämerenkatu 11-13 Helsinki, FIN-00180, Finland
SHKUMBIN HAMITI
Nokia Technology Platforms, Itämerenkatu 11-13 Helsinki, FIN-00180, Finland
BENOIST SÉBIRE
Nokia Research Center, Hepingli Dongjie 11 Beijing, 100013, China
GUILLAUME SÉBIRE
Nokia Technology Platforms, Itämerenkatu 11-13 Helsinki, FIN-00180, Finland
In the Release 6 of 3GPP, a new type of physical layer has been standardised for the GSM/EDGE Radio Access Network (GERAN): the Flexible Layer One (FLO). Rather than having fixed coding schemes in specifications and corresponding implementations, FLO provides a framework that allows the layer one to be configured and optimised at call set-up. As a result, the introduction of new services can be handled smoothly without having to specify new coding schemes in each release. Together with Iu alignment, FLO enables seamless provision of the same services over GERAN as over UTRAN. This paper describes why FLO is needed, its architecture, and presents its performance for a Voice Over IP (VoIP) service. INTRODUCTION For an optimised support of new real-time services, new coding schemes have been specified in GSM/EDGE for more than a decade. While this approach yields an optimised link level performance, it is both slow (specification) and costly (implementation). For instance, the introduction of AMR-WB in Release 5 required the introduction of 38 new pages of coding schemes in 3GPP TS 45.003 alone! Hence, for a quick, optimised and cost-effective introduction of new real-time services in GERAN, it was decided to follow the same approach as in UTRAN: a flexible layer one [1] [2] [3] [4]. Through several enhancements, the radio bearers offered by FLO fulfil the IP Multimedia Subsystem (IMS) requirements in terms of flexibility and performance, but also significantly improve the link level performance of real-time IMS services compared to
1

Mobility Conference 2004
GERAN Release 5. In addition to the IMS services, FLO improves the flexibility and performance of the current and future circuit-switched services. This paper describes the architecture of FLO and shows its performance for a typical real-time packet-switched service – Voice Over IP (VoIP). The main motivations for having FLO are given in Section II, while the architecture of FLO is explained in Section III. In Section IV, the real-time performance of FLO is compared with the real-time performance of EGPRS by using an AMR-based VoIP service as an example. Finally, conclusions are drawn in Section V. MOTIVATION Mobile voice traffic continues to grow and already today many networks are stressed with capacity and quality challenges. Although growth in revenue will mainly come from data services, it is foreseen that voice will still generate 60% of the global operator revenue in 2006. Improvements to optimise the capacity and quality of speech services are therefore very important not only for the speech but also for the data services and that is the reason why they have been continuously introduced over the GSM/EDGE system for more than a decade: EFR, AMR-NB, AMR-WB, and AMR-NB on 8-PSK channels. Today it is difficult/questionable to claim that no new services will be introduced on the GSM/EDGE system. With constantly increasing processing power and battery life, high quality codecs (e.g. AMR-WB+) and good quality low bit rate codecs are very likely to be introduced in the near future. In addition, IP based real-time services, especially VoIP is appearing as an attractive service in the fixed internet. Current EGPRS coding schemes provide sub-optimal performance for real-time IP services in terms of spectral efficiency. Although the spectral efficiency may not be important in the early phase of deployment of VoIP services, it becomes very important issue when customer base expands, therefore solution to improve the efficiency are needed. The traditional way of solving these problems has been to introduce a specific channel coding for a particular service or set of services. This has been done for all speech codecs in GSM (FR, HR, EFR, AMR-NB, etc.). The whole process (standardisation, implementation, testing) is time consuming and lead to delays in the deployment of new services. So the key question is: how can we provide a generic solution that would improve the spectral efficiency and quality, allow for fast introduction of new services and at the same time keep the complexity manageable?
2

Mobility Conference 2004
One answer to this question is FLO. With the Flexible Layer One concept we can guarantee a fast, economical and efficient introduction of new services in the long term, while keeping the complexity on a reasonable level. ARCHITECTURE General Principles Instead of having in specifications a fixed set of coding schemes that are tailored and optimised for a limited number of services, FLO provides a framework that allows the coding scheme to be configured and optimised at call set up according to the QoS requirements of the service to be supported. Protocol Architecture In order to accommodate FLO concepts and principles, changes are required to GERAN radio protocol architecture. In GERAN Iu mode, the protocol architecture when relating only to FLO is depicted in Figure 1 below, where most impacts are located at and between the MAC sublayer of layer 2 and the physical layer. It should be noted that FLO is only available on dedicated basic physical subchannels (DBPSCH), and allows for data transfer in transparent, or non-transparent (unacknowledged or acknowledged) RLC modes. On shared basic physical subchannels (SBPSCH, or PDCH), CS-1 to CS-4 as defined in R97 and MCS-1 to MCS-9 as defined in R99 normally apply.
RLC
MAC
PHY
TBFs
Transport Channels
RRC PDCPPDCP PDCP
RLCRLCRLC RLC RLCRLC
FLOFLOFLO
User-planeControl-plane
Figure 1. Protocol architecture for FLO in Iu mode
3

Mobility Conference 2004
Temporary Block Flows (TBFs) A TBF is a layer 2 logical connection used by two MAC entities to support the unidirectional transfer of RLC PDUs on basic physical sub-channels [5] [6]. Transport Channels (TrCH) A transport channel is a channel offered by the physical layer to Layer 2 for data transport between peer layer one entities. A transport channel is defined by how and with which characteristics data is transferred on the physical layer. Given in GERAN FLO is available on DBPSCH only, only one type of transport channel is defined:
• Dedicated Channel (DCH): carries user or control data using GMSK or 8-PSK on a DBPSCH. A mobile station may have one or more transport channels of type DCH active at the same time in each direction.
Three different DCHs are defined in GERAN:
• UDCH: refers to a transport channel of type DCH used exclusively for carrying RLC/MAC blocks for data transfer belonging to user-plane;
• CDCH: refers to a transport channel of type DCH used exclusively for carrying RLC/MAC blocks for data transfer belonging to control-plane. The signalling TFC(s) (see [7]) shall be used when CDCH is active;
• ADCH: refers to a transport channel of type DCH used exclusively for carrying RLC/MAC blocks for RLC/MAC control message transfer. The signalling TFC(s) (see [7]) shall be used when ADCH is active.
On a transport channel, a transport block is the basic unit of traffic exchanged between the MAC sublayer and the physical layer. A transport block consists of a MAC PDU and contains exactly one RLC/MAC block. Physical Layer The physical layer of FLO is a simplified version of the layer one of UTRAN. Simplifications were possible because of the inherent characteristics of the physical layer of GSM/EDGE (for instance no spreading factor to take care of) and also because of the focus laid on the support of real-time services (no turbo codes selected). The architecture for FLO in GERAN, as depicted on Figure 2 below, includes CRC Attachment, Channel Coding, Rate Matching, Transport Channel Multiplexing, TFCI Mapping and Interleaving [8].
4
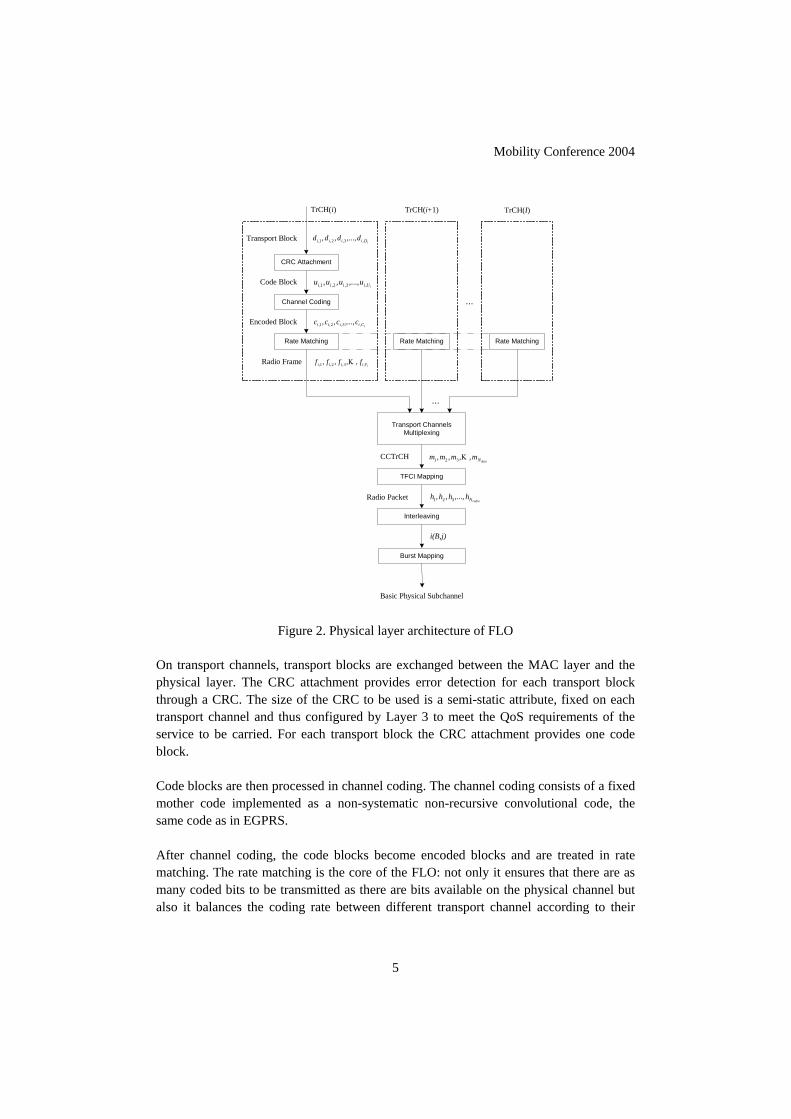
Mobility Conference 2004
TrCH(i)
CRC Attachment
Channel Coding
Rate Matching
Basic Physical Subchannel
Transport ChannelsMultiplexing
Interleaving
TrCH(i+1) TrCH(I)
Transport Block
Code Block
Encoded Block
Radio Frame
CCTrCH
iDiiii dddd ,3,2,1, ,...,,,
iUiiii uuuu ,3,2,1, ,...,,,
iCiiii cccc ,3,2,1, ,...,,,
iViiii ffff ,3,2,1, ,,,, Κ
dataNmmmm ,,,, 321 Κ
radioNhhhh ,...,,, 321
TFCI Mapping
Radio Packet
Rate Matching Rate Matching
...
...
Burst Mapping
i(B,j)
Figure 2. Physical layer architecture of FLO On transport channels, transport blocks are exchanged between the MAC layer and the physical layer. The CRC attachment provides error detection for each transport block through a CRC. The size of the CRC to be used is a semi-static attribute, fixed on each transport channel and thus configured by Layer 3 to meet the QoS requirements of the service to be carried. For each transport block the CRC attachment provides one code block. Code blocks are then processed in channel coding. The channel coding consists of a fixed mother code implemented as a non-systematic non-recursive convolutional code, the same code as in EGPRS. After channel coding, the code blocks become encoded blocks and are treated in rate matching. The rate matching is the core of the FLO: not only it ensures that there are as many coded bits to be transmitted as there are bits available on the physical channel but also it balances the coding rate between different transport channel according to their
5

Mobility Conference 2004
relative importance. In rate matching, the bits of the encoded blocks are repeated or punctured according to the available bandwidth and according to the rate matching attributes (RMA). The RMAs define priorities between the coded bits of different transport channels, and are set by Layer 3 (semi-static attribute). For instance, by setting the RMA of a first transport channel to twice the value of the RMA of a second one, the coded bits of the first transport channel are made twice more important than the coded bits of the second one. This mechanism allows for balancing the coding rate between transport channels and therefore providing unequal error protection (UEP). Outputs from the rate matching are called radio frames. For every radio packet the rate matching produces one radio frame per encoded block, i.e. per transport channel. Radio frames are then serially multiplexed into a Coded Composite Transport Channel (CCTrCH) by the transport channel multiplexing block. After multiplexing the transport format combination indicator (TFCI) is inserted in order to specify the coding used for the current radio packet. The coded TFCI and the CCTrCH are finally interleaved together on basic physical subchannel. The interleaving can be either diagonal or block rectangular and is configured at call set-up by layer 3. VOIP OVER FLO As previously described, the need for FLO is primarily driven by the introduction of real-time packet switched services. By taking VoIP as an example, this section shows how FLO improves the link level performance in contrast to EGPRS. FLO Configuration The speech frames (narrowband AMR codec) are transported by the RTP protocol. In order to conserve radio spectrum, the RTP/UDP/IP header is compressed at PDCP layer. The RLC protocol is running in unacknowledged mode and the MAC protocol in dedicated mode. The error protection and detection is carried out in equal manner (EEP/EED). Hence, only one transport channel is needed. Each transport block contains a compressed RTP/UDP/IP header (28 bits), PDCP header (8 bits), RLC/MAC header (20 bits), and RTP payload. The RTP payload consists of CMR/TOC header (10 bits), RTP padding bits (0-7 bits), and speech bits (95-244 bits). The size of the transport format combination indicator (TFCI) is set to four bits. The channel mode is limited to full-rate channels, but both modulation methods (GMSK and
6
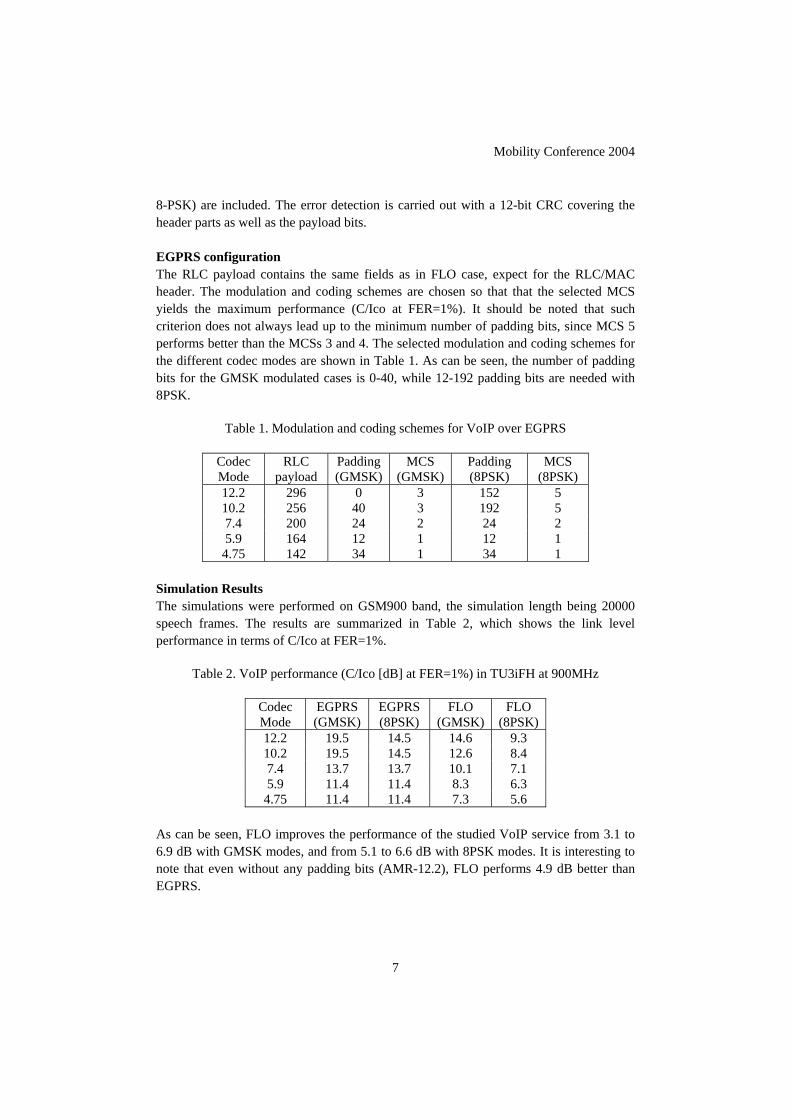
Mobility Conference 2004
8-PSK) are included. The error detection is carried out with a 12-bit CRC covering the header parts as well as the payload bits. EGPRS configuration The RLC payload contains the same fields as in FLO case, expect for the RLC/MAC header. The modulation and coding schemes are chosen so that that the selected MCS yields the maximum performance (C/Ico at FER=1%). It should be noted that such criterion does not always lead up to the minimum number of padding bits, since MCS 5 performs better than the MCSs 3 and 4. The selected modulation and coding schemes for the different codec modes are shown in Table 1. As can be seen, the number of padding bits for the GMSK modulated cases is 0-40, while 12-192 padding bits are needed with 8PSK.
Table 1. Modulation and coding schemes for VoIP over EGPRS
Codec Mode
RLC payload
Padding (GMSK)
MCS (GMSK)
Padding (8PSK)
MCS (8PSK)
12.2 296 0 3 152 5 10.2 256 40 3 192 5 7.4 200 24 2 24 2 5.9 164 12 1 12 1
4.75 142 34 1 34 1 Simulation Results The simulations were performed on GSM900 band, the simulation length being 20000 speech frames. The results are summarized in Table 2, which shows the link level performance in terms of C/Ico at FER=1%.
Table 2. VoIP performance (C/Ico [dB] at FER=1%) in TU3iFH at 900MHz
Codec Mode
EGPRS (GMSK)
EGPRS (8PSK)
FLO (GMSK)
FLO (8PSK)
12.2 19.5 14.5 14.6 9.3 10.2 19.5 14.5 12.6 8.4 7.4 13.7 13.7 10.1 7.1 5.9 11.4 11.4 8.3 6.3
4.75 11.4 11.4 7.3 5.6 As can be seen, FLO improves the performance of the studied VoIP service from 3.1 to 6.9 dB with GMSK modes, and from 5.1 to 6.6 dB with 8PSK modes. It is interesting to note that even without any padding bits (AMR-12.2), FLO performs 4.9 dB better than EGPRS.
7

Mobility Conference 2004
The main reasons for the bad performance of EGPRS are the granularity of RLC payload, short (20 ms) interleaving, and non-optimal RLC/MAC header. With FLO, the granularity of RLC/MAC payload is reduced to one bit and the interleaving depth is increased to 40 ms. In addition, the size of the RLC/MAC header is reduced to 20 bits, which is approximately half the size of the EGPRS header. While (E)GPRS coding schemes were designed for non real-time services on shared channels and provide optimal performance in such configurations, they were not originally designed for real-time services on dedicated channels. CONCLUSION This paper has shown the architecture and benefits of Flexible Layer One. In a nutshell, FLO allows the configuration of physical layer parameters at call setup, thus speeding up the introduction of new services and improving the link level performance in both circuit-switched and packet-switched domains. The introduction of FLO is particularly important for the performance of real-time IMS services. As shown, FLO improves the link level performance of an AMR-based VoIP service from 3.1 to 6.9 dB compared to EGPRS. The main reasons for the improved performance are reduced granularity, longer interleaving, and smaller protocol overhead. REFERENCES [1] B. Sébire, T. Bysted, K. Pedersen, “IP Multimedia Services Improvements in the
GSM/EDGE Radio Access Network”, VTC2003, Apr. 2003. [2] G. Platt, K. Pedersen, B. Sébire, “Introducing the GERAN Flexible Layer One
Concept”, IEEE Wireless Communications – QoS in Next-Generation Wireless Multimedia Communications Systems, Vol.10 No.3, Jun. 2003.
[3] B. Sébire, T. Bysted, K. Pedersen, “Flexible Layer One for the GSM/DGE Radio Access Network”, ICT2003, Feb. 2003.
[4] K. Pedersen, B. Sébire, G. Sébire, “ARQ Considerations For The New GSM/EDGE Flexible Layer One”, ICON2003, Sep. 2003.
[5] 3GPP TS 44.060, “General Packet Radio Service (GPRS); Mobile Station (MS) – Base Station System (BSS) interface; Radio Link Control/Medium Access Control (RLC/MAC) protocol”.
[6] 3GPP TS 44.160, “General Packet Radio Service (GPRS); Mobile Station (MS) – Base Station System (BSS) interface; Radio Link Control/Medium Access Control (RLC/MAC) protocol for Iu mode”.
[7] 3GPP TS 44.118, “Mobile radio interface layer 3 specification; Radio Resource Control (RRC) protocol; Iu Mode”.
[8] 3GPP TR 45.902, “Radio Access Network; Flexible Layer One”.
8

$*(1(5,&&21&(37)2535272&2/'(7(&7,21$1',76,03/(0(17$7,21)258076021,725,1*
INA SCHIEFERDECKER, MARION SCHÜNEMANN, AIHONG YIN
7HFKQLFDO8QLYHUVLW\%HUOLQ7HOHFRPPXQLFDWLRQ1HWZRUNV*URXS 6WUGHV-XQL%HUOLQ*HUPDQ\
PETER H. DEUSSEN, AXEL RENNOCH
)UDXQKRIHU,QVWLWXWH)2.86&&7,3 .DLVHULQ$XJXVWD$OOHH%HUOLQ*HUPDQ\
This contribution presents a generic approach and implementation for protocol detection and traffic analysis (TA). Self-detection and auto-configuration facilities minimize the effort to manually configure a monitor or test device and should be an integral part for test automation. We elaborate our concept on the intelligent self-detecting features for a UMTS monitor focussing on interfaces, protocols and signaling scenarios in the context of the UMTS Terrestrial Radio Access Network (UTRAN).
,1752'8&7,21The acceptance and success of new telecommunication systems depends not only on the innovation and availability of new services for the end-customers, but also on the reliability of the underlying (network) infrastructure. Since today’s market pressure tends to give less time for sufficient testing of products and networks, a fast and easy access to in-operation monitoring, fault detection, and traffic or call analysis is needed to analyse networks and network elements in experimental, field trial and production environments.
The operation of the UMTS infrastructure [1] demands the development of appropriate equipment to observe and analyse the functional behaviour of involved network elements. Passive monitoring of the inter-communication between UMTS nodes can be used for the identification and evaluation of network behaviour and protocols at selected interfaces, only if a sufficient level of information details is considered and an adequate part of the network infrastructure is included in the monitoring process. The number and complexity of UMTS procedures is big and requires a profound consideration of protocol data and dependencies. The development of an intelligent UMTS monitor must consider these circumstances for the provision of facilities for protocol and topology recognition.
Generic concepts for protocol detection will be discussed and used for the implementation of intelligent self-detecting and auto-configuring features and an efficient TA as part of a commercial UMTS monitor that is able to identify UTRAN interfaces [2]. A flexible software structure will allow ad-hoc changes and maintenance according to e.g. modified protocol standards, vendor-specifics or network operation requirements. We have investigated the details of UTRAN interfaces and protocols and architectural
Mobility Conference 2004
1

requirements for self-detection and auto-configuration. The objective of protocol self-detection is that the monitor can automatically find out, which protocols are running on the interface or link to which it is connected. It is the basis for the monitor auto-configuration that frees the user from time-consuming complex configuration tasks allowing him to concentrate on the equipment and network analysis. For this purpose, traffic must be analysed for certain protocol patterns, which the monitor can use to unambiguously identify the corresponding protocols. For the protocol detection, the protocol stacks appearing at the UMTS interfaces Iu, Iur, and Iub have been considered.
For the realisation of the protocol and topology self-detection, some requirements have been identified. Self-detection bases on analysing existing network traffic, i.e. PDUs. It is also possible that channels change dynamically during the monitoring process (e.g. setup and release of transport channels), which requires a reconfiguration of the monitor. For these reasons, the self-detection process should be repeated in certain time intervals during an ongoing monitoring process.
Figure 1. UTRAN Protocol tree.
In course of the self-detection process, captured protocol information has to be analysed and validated against protocol identification patterns. In particular, we made use of: Protocol Discriminator, Subsystem Number, Port Number, Length Information, Checksum (CRC), Message Types, Padding bytes/bits, and dedicated parameter value ranges. Considering the different protocol stacks existing within UTRAN, a combined tree representation of these protocol stacks as illustrated in Figure 1 has been developed
ATM
IP (Iu-BC, Iu-PS, Iur)
SSCOP (Iu-CS, Iu-PS, Iub, Iur)
AAL 5 (Iu-BC, Iu-CS, Iu-PS, Iub, Iur)
AAL 2 (Iu-CS, Iub, Iur)
NBAP (Iub)
SSCF-UNI (Iub)
SSCF-NNI (Iu-CS, Iu-PS,
Iur)
MTP3b (Iu-CS, Iu-PS,Iur)
STC(MTP)/ ALCAP
(Iu-CS, Iur)
SCCP (Iu-CS, Iu-PS, Iur)
RANAP (Iu-CS, Iu-PS)
RNSAP (Iur)
SCTP/ M3UA
(Iu-PS, Iur)
UDP/ GTP-U (Iu-PS)
TCP/SABP (Iu-BC)
SCCP/RANAP (Iu-PS)
STC (SSCOP)/ ALCAP
(Iub)
STC (MTP)/ ALCAP
(Iur)
Iur/Iub-FP
MAC
RLC
RRC
SS SMS GMM CC GSMS MM SM
SS SMS GMM CC GSMS MM SM
! " # $ #
%
'&)( %
* * + * ,',
* * + * ,-,
.
/
* * + * ,-, SCCP/RNSAP
(Iur)
* * + * ,',
* ,',
0 +* 1 2 3 0 1+'1
2 2
'&)( %
Iu-UP 3
SSCF-NNI (Iu-CS, Iu-PS,
Iur)
2 4 $
Iu-UP
'& 1
Mobility Conference 2004
2
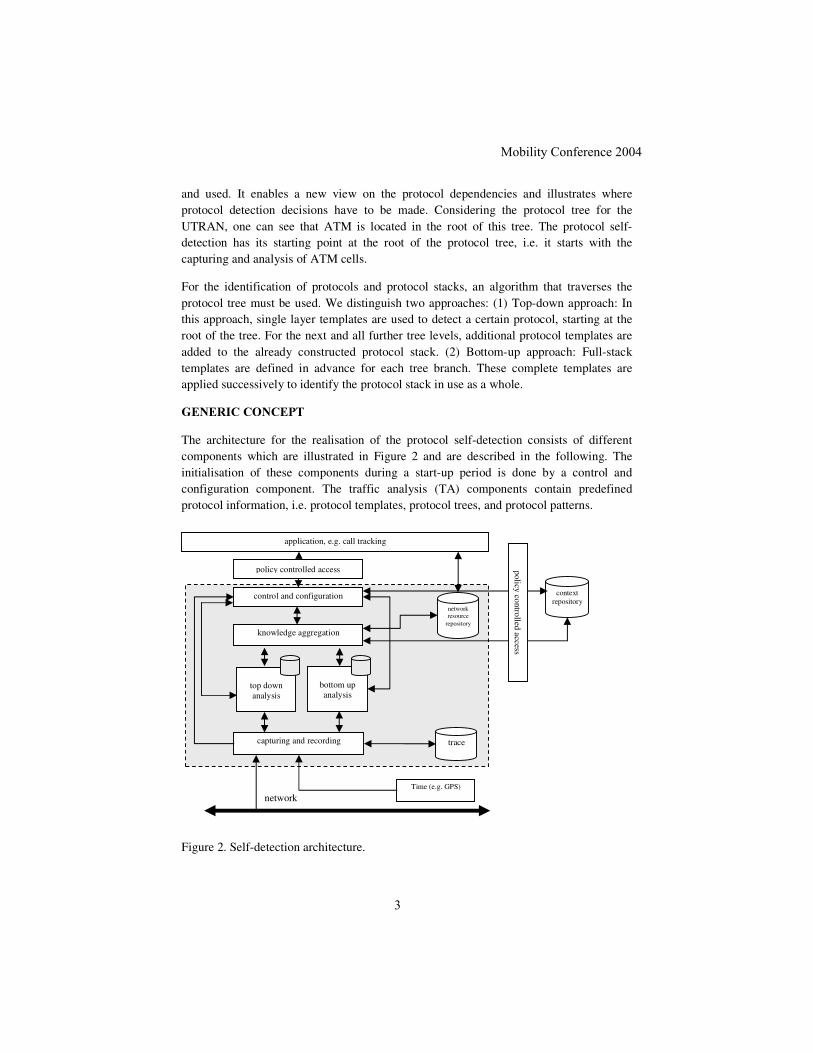
and used. It enables a new view on the protocol dependencies and illustrates where protocol detection decisions have to be made. Considering the protocol tree for the UTRAN, one can see that ATM is located in the root of this tree. The protocol self-detection has its starting point at the root of the protocol tree, i.e. it starts with the capturing and analysis of ATM cells.
For the identification of protocols and protocol stacks, an algorithm that traverses the protocol tree must be used. We distinguish two approaches: (1) Top-down approach: In this approach, single layer templates are used to detect a certain protocol, starting at the root of the tree. For the next and all further tree levels, additional protocol templates are added to the already constructed protocol stack. (2) Bottom-up approach: Full-stack templates are defined in advance for each tree branch. These complete templates are applied successively to identify the protocol stack in use as a whole.
*(1(5,&&21&(37The architecture for the realisation of the protocol self-detection consists of different components which are illustrated in Figure 2 and are described in the following. The initialisation of these components during a start-up period is done by a control and configuration component. The traffic analysis (TA) components contain predefined protocol information, i.e. protocol templates, protocol trees, and protocol patterns.
Figure 2. Self-detection architecture.
control and configuration
top down analysis
bottom up analysis
capturing and recording
network resource
repository
context repository
Time (e.g. GPS)
trace
network
policy controlled access
policy controlled access
application, e.g. call tracking
knowledge aggregation
Mobility Conference 2004
3

The capturing and recording component is connected to a network link to monitor the data traffic. An integral part of the self-detecting architecture is the knowledge aggregation component. It controls the analysis components and receives the results of their analyses. The interpretation and combination of the observations as well as the result evaluation is done by this component.
In the following we concentrate on the TA implementation concept, since it is the central part of the protocol self-detection. Concerning autoconfiguration, it is influenced by two premises: (1) Protocol detection code should be reusable in different context, e.g. the implementation of a specific protocol pattern identification should be realised only once, even it can appear in different protocol trees or at multiple tree positions (like ALCAP PDU identification at NNI or UNI). One or more hard coded decisions or decoder calls may be combined in one module that checks an input frame whether it fits with given templates, i.e. the assumptions to be tested. (2) Furthermore, modules as defined above may be separated into a sequence of modules, i.e. a hierarchy with multiple levels is introduced. Modules at a lower level Q may call a module at a higher level Q + 1 if its analysis assumption (i.e. an input frame belongs to protocol layer Q) has been validated.
(a) (b)
Figure 3. Flexible TA strategies.
Such hierarchical structures follow the protocol tree and detection algorithm, which needs to be decomposed in meaningful parts that may be reused. Engineers are free in their strategies and preferences on how to define the scope of a single module. They have to define an approach, which allows enough flexibility to change the module priorities/ordering. Figure 3 gives two different module structures that address the same target protocols (ALCAP, NBAP, RANAP). If you suppose that at one selected level a module on the right has a higher priority than its left neighbours then you can read the structures as follows: In variant (a) NBAP (over SSCOP) detection will be considered later than a RANAP (over MTP) check and after a SSCOP detection (shared with the ALCAP module). A test operator may wish e.g. to give the NBAP check a higher priority and split the RANAP and MTP check as illustrated in variant (b). A shift of the NBAP to
ALCAP RANAP
MTP
TAonAAL5
NBAP SSCOP RANAP
TAonAAL5
ALCAP NBAP
SSCOP
Mobility Conference 2004
4

the most right position of the lower level should give such effect, but the removal of the RANAP detection from level 1 to level 2 requires a module split that has to be considered earlier during the software implementation phase. Ad-hoc changes require a sufficient degree of decomposition. On the other hand a very large amount of modules with small scopes may increase overhead and reduce the efficiency.
The introduction of a flexible tree configuration requires a description of the module structures and some means to select and load the preferred strategy during an initialisation phase. Using e.g. XML descriptions may be comfortable to select (or exchange) some modules (and (re)define the relationships) of dedicated pre-defined (i.e. implemented) types. Such modules can be stored as part of a software library (e.g. object or .dll files). They may be subject to further specialisation with e.g. customer specific constraints (template parameter). A set of native types could also be implemented in modules to allow the use of basic behaviour like if-then-else constructs or logical operations.
Figure 4. Generic TA: class diagram.
In Figure 4 we illustrate basic software classes required to implement the TA: The TestAssumption objects get a request to analyse a frame either from a TreeRoot object or another instance of TestAssumption (illustrated with delegates associations), i.e. - as introduced before - TestAssumption objects can delegate a part of a result analysis to instances on further protocol tree levels. It is obvious that the TestAssumption instances must be initialised (init operation) according to their particular position in the tree in alignment with the expected type of input frame. In addition to the basic configuration parameter, specific templates defined for usage within a module are input to TestAssumption as part of the init operation. On the other hand the result types (values)
TreeRoot
+ loadStructure(s : struc) : Boolean + analyse(f : frame) : result
TestAssumption
+ init(t : templates, c : configuration) : int + analyse(f : frame) : result + finit() : void
delegates
1
1..n
delegates
1
0..1
Mobility Conference 2004
5

have to be defined: Each instance may return an unknown value if the input frame has not matched the pattern of the assumption. If input frame and template fit together, an identifier for the detected protocol will be returned. The result(s) from higher levels may be combined with the identifier of the calling (parent). A TestAssumption instance, e.g. a MTP_SCCP module that receives an indication for RANAP detection, may return MTP_SCCP.RANAP to its calling instance.
We do not put restrictions to the dedicated tasks of the TestAssumption modules in the generic concept. A TestAssumption instance may call further (or all) of its associated objects even if one instance has already returned a positive detection result. Thus a double (or multiple) match may happen, if the considered assumptions (or their implementations) do not exclude completely each other. Such cases may be due to e.g. a combination of different interfaces on the same line or customer specific modifications. Anyway, such detection results should be returned to the end-user with appropriate conflict information. Alternatively, the TestAssumption object may have implemented conflict resolution mechanisms (based e.g. on probabilities) that will resolve the conflict locally and return a unique result (probably accompanied by some comment).
,03/(0(17$7,21Starting from the selected protocol patterns and the protocol tree, an algorithm has been developed that follows the top-down approach. Considering the protocol tree, we can distinguish between protocols available in the protocol tree as a tree node and such available as a tree leaf. Figure 5 gives an overview on some implemented software classes. In the IP branch, there are two classes implemented for protocols tree nodes: TAIuxIP which addresses a combined detection of IP and the next higher protocols, and TAIuxM3UA. For each tree node protocol of the SSCOP branch, two further classes have been foreseen: TAIuxOnSSCOP and TAIuxMTP3b. A common class, called TAIuxSCCP, is used for the SCCP detection both over SSCOP and IP. The classes for the tree node protocols have been specified to realise the analysis of more detailed protocol information, e.g. SI of MTP3b, SI of M3UA or SSN of SCCP, and also to initiate and decide the analysis of protocols on the next tree level. For the tree leaf protocols, one common class has been specified, the TAProtDec class. Using this class, a protocol frame can be completely decoded.
An implementation of the TA needs to be developed carefully because of the following major product quality issues that are relevant: performance, maintainability, and reliability. According to the requirements for self-detection stated above, the question on how to define and implement required protocol identification patterns plays an important role and has to be answered early in the development process. Existing approaches may focus on an optimisation of either the TA performance or its maintainability: (A) A so-called hard coding variant means that any protocol pattern should be coded and used as simple as possible (to avoid any time overhead). (B) A decoder tool variant will use a
Mobility Conference 2004
6
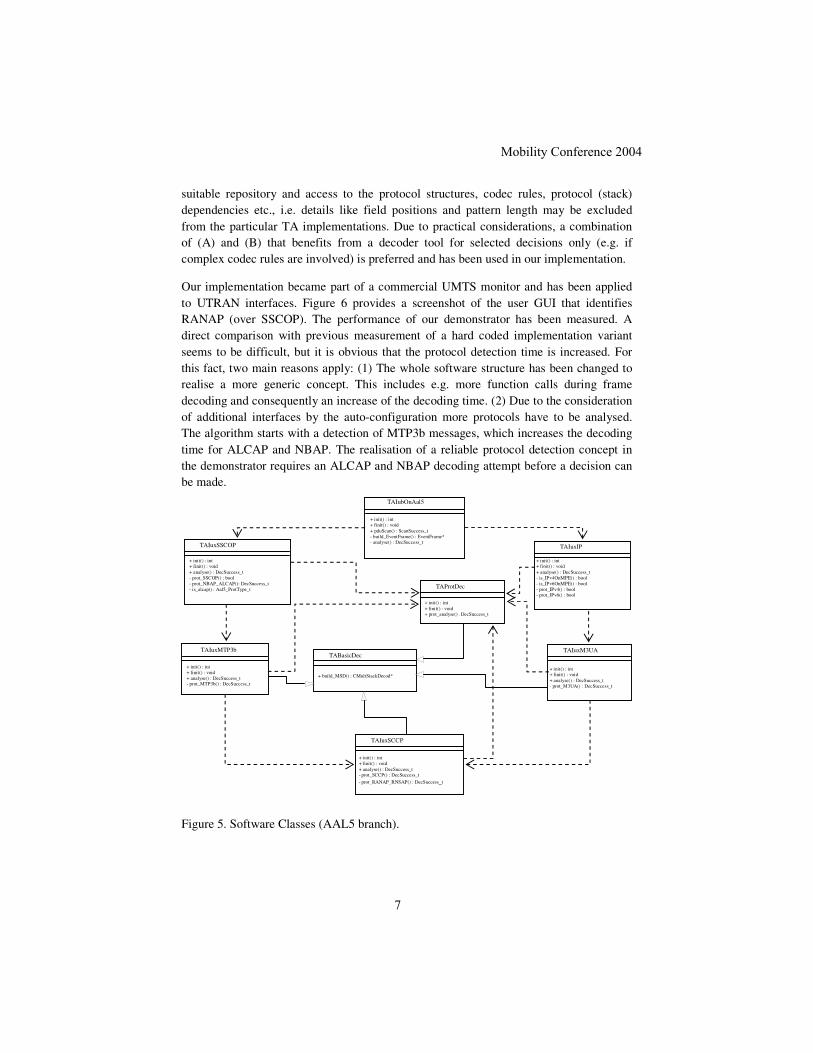
suitable repository and access to the protocol structures, codec rules, protocol (stack) dependencies etc., i.e. details like field positions and pattern length may be excluded from the particular TA implementations. Due to practical considerations, a combination of (A) and (B) that benefits from a decoder tool for selected decisions only (e.g. if complex codec rules are involved) is preferred and has been used in our implementation.
Our implementation became part of a commercial UMTS monitor and has been applied to UTRAN interfaces. Figure 6 provides a screenshot of the user GUI that identifies RANAP (over SSCOP). The performance of our demonstrator has been measured. A direct comparison with previous measurement of a hard coded implementation variant seems to be difficult, but it is obvious that the protocol detection time is increased. For this fact, two main reasons apply: (1) The whole software structure has been changed to realise a more generic concept. This includes e.g. more function calls during frame decoding and consequently an increase of the decoding time. (2) Due to the consideration of additional interfaces by the auto-configuration more protocols have to be analysed. The algorithm starts with a detection of MTP3b messages, which increases the decoding time for ALCAP and NBAP. The realisation of a reliable protocol detection concept in the demonstrator requires an ALCAP and NBAP decoding attempt before a decision can be made.
Figure 5. Software Classes (AAL5 branch).
TAIubOnAal5
TAIuxSSCOP + init() : int + finit() : void + analyse() : DecSuccess_t - prot_SSCOP() : bool - prot_NBAP_ALCAP(): DecSuccess_t - is_alcap() : Aal5_ProtType_t
TAIuxMTP3b + init() : int + finit() : void + analyse() : DecSuccess_t - prot_MTP3b() : DecSuccess_t
TAIuxSCCP + init() : int + finit() : void + analyse() : DecSuccess_t - prot_SCCP() : DecSuccess_t
- prot_RANAP_RNSAP() : DecSuccess_t
TAProtDec + init() : int + finit() : void + prot_analyse() : DecSuccess_t
TAIuxIP + init() : int + finit() : void + analyse() : DecSuccess_t - is_IPv4OnMPE() : bool - is_IPv6OnMPE() : bool - prot_IPv4() : bool - prot_IPv6() : bool
TABasicDec + build_MSD() : CMultStackDecod*
TAIuxM3UA
+ init() : int + finit() : void + pduScan() : ScanSuccess_t - build_EventFrame() : EventFrame* - analyse() : DecSuccess_t
+ init() : int + finit() : void + analyse() : DecSuccess_t - prot_M3UA() : DecSuccess_t
Mobility Conference 2004
7

Figure 6. RANAP detection (screenshot). 287/22.$1')857+(55(6($5&+The generic concept for self-detecting traffic analysis as a basis for monitor auto-configuration described in this document can be characterised and compared to the elements of a test program consisting of data types, values (templates), and some basic behaviour that could be found in test notations like TTCN-3 [3]. It should be possible to implement the detection algorithm at an abstract level and to use automatic tool support for compilation and execution of such test scenarios. Although readability of monitoring and testing data templates and protocol procedures based on TTCN-3 will increase, it is assumed that performance requirements might be failed. At this point a performance case study is needed to have an insight into the conditions and possibilities for the use of advanced test notations for monitoring purposes.
$FNQRZOHGJHPHQWVThis work has been done within the Trillian-T project that has been supported by the European Regional Development Fund. We like to thank our colleagues at Tektronix Berlin, in particular Hans-Werner Arweiler, Stephan Klug, Birgit Kähler, Hubertus Toenne and Andreas Vehse for detailed technical discussions and support.
5()(5(1&(6
[1] UMTS Networks Architecture, Mobility and Services, Heikki Kaaranen, Ari Ahtiainen, Lauri
Laitinen, Siamäk Naghian, and Valtteri Niemi, 2001,Wiley.
[2] Technical Specification 25.401 V3.10.0, UTRAN Overall Description (Release 1999), 3rd
Generation Partnership Project (3GPP), June, 2002.
[3] ES 201 873-1 V2.0.0: The Testing and Test Control Notation version 3; Part 1: TTCN-3 Core
Language, European Telecommunications Standards Institute (ETSI), October 2001.
Mobility Conference 2004
8

OPTIMAL ROLLOUT OF 3G NETWORKS – SCENARIO ANALYSIS BASED ON EUROPEAN UMTS MARKETS
MR. ILARI WELLING & MR. JARMO HARNO [email protected], [email protected]
Nokia Research Center, Itämerenkatu 11-13 00180 Helsinki, FINLAND
This paper examines the business feasibility of 3G roll out in European context. Using case study approach the paper looks into case of large European country and small European country under different set of assumption. Especially the pace of network roll out is addressed under different boundary conditions and it is found out that pace of network roll out is one of the significant parameters in successful 3G deployment. Background and approach Recent years in the telecom business sector have been a scene of rapid, even dramatic, fluctuations. In the beginning of this century the mobile telecom hype was at its highest. In Europe, the UMTS license auctions were running hot in UK and Germany during spring and summer of the year 2000. The result was almost astronomic license fees and the auctions were immediately followed by the downturn in the whole worldwide telecom sector. The misguided estimations about the future and about company’s own strategic position led to losses of huge amount of invested money; as most striking examples being the consortia of Telefonica and Sonera, and MobilCom (in partnership with France Telecom) in Germany, where the license fees were the highest - around 7.6B$/8.3B€ for each of the six licenses. Now we are more advised about the real pace and phase of the 3G revolution, or more properly, evolution. We have seen that required work amount in every dimension of the new realm is far more than foreseen: The infrastructure with all the interoperability aspects; the handsets with the numerous functionality, quality and form factors; the provision of advanced services with all the factors relating to usability, critical mass (network effects), real utility and affordability - composing together the parameters behind the market demand. But even as it is seen that the development requires much more time and investments than anticipated, the speed of progress is still hard to estimate due to the sophisticated value-chain needed in providing advanced mobilized services for different consumer and business sectors.
Mobility Conference 2004
1

Also the maximal level that the demand can achieve is controversial. Accordingly we have many different scenarios facing the 3G market players in this challenging situation. The viability of the business in different “possible worlds” varies between players, which have divergent profiles and strategies. In this study it is aimed to find the optimal strategies to pursue the 3G business in specified markets, given that the license has been obtained. This study utilizes the model developed within a European industry and academia co-operation project TONIC [1] (Techno-economics of IP Optimized Networks and Services), which was run under the European Union’s IST framework program. The project has created a comprehensive framework model for UMTS operator’s business case and the work is continued currently by the ECOSYS project. The model provides a holistic view of the operator business combining e.g. demand development estimation, technology rollout, dimensioning, cost modeling, service and traffic classification, market share, pricing and revenue forecasts. By utilizing benchmarks as boundary conditions for certain variables, like average revenue per user (ARPU), it is possible to have reality checks for coherence of inputs. Cash flow analysis is performed to generate the economical key figures to indicate the potential successfulness or unsuccessfulness of the analyzed business prospect. The model gives possibilities to “simulate” scenarios with different input values, and to make risk and sensitivity analyses with several interdependent variables. The business players start with the parameters of their individual position in the market, relating to their technology know how, existing infrastructure, market share, customer base, brand and financial conditions. The analyzed 3G operator cases have certain static boundary conditions, relating to the analyzed market i.e. the country type. These are e.g. specific country demographics and regulation format, especially how the licenses were granted and what conditions were included. Then there are market demand development related parameters, which may vary in different scenarios. Finally the operator itself makes certain choices depending on the market development, own strengths and deficiencies, and the existing boundary conditions. This study identifies, for selected operator cases, the optimal rollout policy of the 3G network and services, including related subsidies to the terminals. The factors examined include:
1) Effect of possible delay of UMTS take-up 2) Potential benefits by infrastructure sharing 3) WLAN effect on UMTS usage and revenue 4) Handset subsidization 5) Equipment price development
Mobility Conference 2004
2
6) Tariff elasticity and capturing of high-end customers 7) End-user tariff erosion 8) Opportunity window width before the next generation
Although all possible cases cannot be covered, by combinations of certain characteristic country types and operator profiles, processed through relevant scenarios of market development, it is possible to gain valuable information on challenges the operators will potentially face and the effects of different strategic choices. This is achieved by utilizing coherent and dynamic modeling of the versatile aspects within the business case, extending from network costs to end-user service pricing.
Scenario analysis As for TONIC basic cases we analyzed two generic country types: Large Western European country (like France, Germany, Italy, UK) and a Scandinavian type of country with smaller population, but relatively large area size (like Finland, Norway and Sweden). The latter case was until very late phase coverage driven, i.e. the network investments were done to build out the coverage for quite large and relatively sparsely populated area. On the contrary the “Large” country type came into capacity driven mode clearly earlier. This is the reason why the effect of different rollout policies is more distinguished in the “Small” country type. Also, e.g. in Sweden the regulator introduced very rigorous rollout requirements within the “beauty contest” type of auction and 3G license conditions. This relates to the very high expectations on third generation mobile prevailing in the first half of the year 2000. This is the reason we here concentrate on the “Small” country type and introduce the eight mentioned potential market scenarios and illustrate their effect within two rollout policies:
• Slow, where the network is built quite evenly during the study period • Fast, where the network coverage should be built during the first two years
For illustration of the effect we calculate the Net Present Value (NPV) for both rollout cases in each market scenario. We will notice quite different impacts in different cases and most interestingly the effect usually differ very much for the two rollout policies. Surely what come up in reality are the combinations of these market scenarios, with some positive and some negative effects, but the presented outputs give advice on the “impact components” of different trends for different rollout policies, whether the policy is based on business strategy of a company or regulatory demands. The outcome of the analyzed scenarios has been gathered into a graph in the end for convenient comparison.
Mobility Conference 2004
3
0) The base case
The base case shows already that forced fast rollout gives worse results against the basic assumptions in the TONIC project. This is evidently due to the front emphasized investments having negative discount effect and leading to higher equipment prices.
1) Effect of possible delay of UMTS take-up In this scenario the demand curve shifts one year ahead. This is for example the case, where the market is delayed for e.g. technological reasons, but the long term demand potential is according to the TONIC assumptions. It is also assumed that also the competitors are launching according to the delayed schedule. We can identify here the dilemma of strategic timing between the trade offs of too early investments and loosing high-end customers. If some of players start before the delayed launch, and get reasonable amount of customers, the presented outcome will show up too optimistic.
2) Potential benefits by infrastructure sharing In this case the infrastructure is shared (both capacity and costs) with some other operator by 50%/50%. This helps especially in the case with fast rollout demands.
3) WLAN effect on UMTS usage and revenue In this scenario some hotspot 3G usage is covered by WLAN deployment. Totally a little more than 500 hotspots, with 1750 access points are deployed into airports, hotels, cafes etc.
4) Handset subsidization The base case assumes 300€ subsidization for handsets in the beginning with gradual degradation. In this scenario the subsidization is diminished to 30% of that.
5) Equipment price development The network equipment price was shown to degrade substantially due to the down turn of telecom markets. The modeled basic case takes into account the general price erosion, but in this scenario the equipment prices are assumed to be 50% lower from the start and through the whole study period.
6) Tariff elasticity and capturing of high-end customers With the earlier mobile generations higher average revenue per user (ARPU) figures were observed in the early years of the new technology as the high-end customers with high elasticity to spend migrate first to the new service. This is partly due to higher tariffs and partly to more abundant usage patterns. In this scenario, it is anyhow assumed that the higher ARPU figures for the early users are no realizing in this 3G case.
Mobility Conference 2004
4

7) End-user tariff erosion In this scenario, the tariffs will go down 20% faster than suggested in the basic case and at the same time the usage development will be the same as in base case.
8) Opportunity window width before the next generation Especially in the fast rollout case, with the base assumptions for the penetration and demand, the return on investments (ROI) comes only in the last years of the study period (ending at 2011) making them important, as the user base is also at the highest then. It might anyhow happen that some new technologies will erode the UMTS business before the end of the study range. In this scenario, it is supposed that in the last year the usage and revenues from the 3G drops to half of the basis assumption. Here we have the graphical presentation of all the analyzed scenarios
NPV effect of the scenarios
-600
-400
-200
0
200
400
600
800
1 000
Base ca
se
Dealyed
penet
ration
With 50%
infra
shari
ng
With W
LAN deploy
ment
Subsidat
ion drop
to 30%
No early
adop
ters
Equipm
ent pric
e drop b
y 50%
Tariff e
rosion
20% hi
gher
Last ye
ar 50%
user drop
NPV
/ m
illio
n €
Slow rolloutFast rollout
Figure 1. Graphical presentation of the Net Present Value effect of studies scenarios
Although all possible cases cannot be covered, by combinations of certain characteristic
Mobility Conference 2004
5
country types and operator profiles, processed through relevant scenarios of market development, it is possible to gain valuable information on challenges the operators will potentially face and the effects of different strategic choices. This is achieved by utilizing coherent and dynamic modeling of the versatile aspects within the business case, extending from network costs to end-user service pricing. One aspect in this analysis it to optimize the rollout by maximizing the 3G network traffic and utilization, i.e. revenue over costs. In addition the relationship between rollout and demand has to be considered. It is clear that in the beginning there have to be the critical coverage to attract users to migrate to the 3G service. Also the growth plan should be reasonable, so that gradually the network effect of the growing user base makes the profitable dissemination possible. CONCLUSIONS The presented results demonstrate that the optimization, which relates the rollout schedule to demand, should not be governed by too rigid rules. Future cannot be foreseen accurately and the planning should take into account different potential scenarios. Overall it appears that the prospects for 3G roll out are average good, while neither the extreme optimism of late 90’s nor the deep depression that followed can be justified. REFERENCES [1] http://www-nrc.nokia.com/tonic/
Mobility Conference 2004
6
Mobility Conference 2004
ESSENTIAL FUNCTIONAL AREAS FOR A 4TH GENERATION MOBILE NETWORK ARCHITECTURE
ANDERSEN F.-U., FAN C., PITTMANN F., REIMER U.
Research & Concepts Department, Siemens Mobile Networks D-13623 Berlin, Germany
(Corresponding author: [email protected]) BACKGROUND AND MOTIVATION In view of the future evolution of cellular networks, the World Wireless Research Forum (WWRF) and the ITU have initiated discussions on usage scenarios, functions and architectures for mobile networks beyond 3G. There are many efforts world wide underway towards this end using names like ‘System beyond 3rd Generation’, ‘Systems beyond IMT-2000’ or even ‘4G’ (4th generation) (Within this document all these networks are referred to as 4G mobile networks). These activities are organized and driven by standardization bodies, research and technical fora as well as academic organizations and major industrial players. We have conducted a series of projects, trying to contribute to the ongoing 4G discussions from a technical perspective by elaborating functional and architectural aspects of future mobile networks. In [1], we have described the requirements for 4G mobile network with a particular emphasis on real time applications. These requirements and experiences from the viewpoint of a mobile network supplier are used to derive a functional architecture for these networks, which will cover both visionary aspects of future mobile communication as well as the challenge to evolve existing, legacy networks towards 4G mobile networks. We envisage a 4G mobile network as a multitude of cooperating systems building a dynamically changing communication and information environment. These systems are of different types ranging from sensor networks and body area networks via cellular and broadcast systems up to fixed access networks. They can be used in various combinations in an ad-hoc manner – e.g. a personal area network within a moving network like a train that in turn is attached to a public cellular system. The cooperation among them is implemented not only through the integrated deployment of diverse radio interfaces – including a fundamentally new broadband radio interface – but also through the suitably adapted interworking of different control and service mechanisms at higher layers. This dynamic network of networks provides a user-centric, global information and communication platform that is called ambient.
1

Mobility Conference 2004
FUNCTIONAL AREAS FOR VideA In communications design, certain functionality has traditionally been linked to distinct layers of the OSI model. Well-known examples are link layer encryption, network layer mobility, and reliable data delivery at transport layer. Nevertheless there are functions like quality of service, access control, charging that cannot be unambiguously attributed to one OSI layer only, and we would like to call these functions "cross"-functions. For our initial thoughts on future 4G mobile network architecture, it is quite useful to abstract from OSI towards a more function-oriented architecture view. What we do is to identify the required functions, group them according to their interrelationship into what we call functional areas. In our context these areas are seen as clusters of characteristic system features that – at least to a certain degree - belong together. Functional areas and their constitutive elements can be identified by combining both empirical and systematic approaches. On the one hand elements of functional areas can be deduced from a general vision of the future system. This at the beginning rather vague image leads to functional areas comprising elements with some flavour of requirements. On the other hand, there is a wealth of experience gained both in the development of equipment for 2G/3G mobile networks and from intense contacts to operators using this equipment to provide end user services. Obviously, these well-accepted features have to be inherited by a 4G system. The analysis of these features results in more technical elements of functional areas i.e. functions, which need not to be reinvented but have to be adapted to a higher level of technology. Our vision of VideA (Vision derived Architecture), a 4G mobile network architecture, consists of a set of essential functions which must be incorporated in the technical design of the network. Although it is rather common in research to investigate single functions of particular interest like mobility [3], QoS [6], security [5] etc. we believe that an overall approach - considering all aspects of the future system - is required to design a mobile network that can rightly claim to belong to a new generation. The functional architecture outlined in the following shall provide a framework to optimally coordinate different functional areas and to consistently integrate all functions needed. Translating this vision we conclude that a 4G mobile network has to provide functions to • support various types of mobility like user, terminal, network or even session
mobility, • integrate several radio access technologies providing their specific benefits each
while also extending the overall coverage, • facilitate an efficient allocation and utilization of network resources especially radio
resources,
2

Mobility Conference 2004
• assure a required level of security – both from the end user’s and the operator’s perspective,
• establish, maintain and preserve user- and network-related contexts to provide the base for innovative services,
• enable the network operator to conduct sophisticated charging and accounting procedures for subscribers and operators,
• allow efficient configuration and management of the network and its elements up to mechanisms for an automatic self-management of network and their elements,
• permit dynamic ‘plug & play’ composition of individual networks in order to temporarily share functionalities and resources, and last but not least
• introduce attractive user services and applications enabled by a comprehensive set of advanced network services.
In [8] nine essential functional areas have been identified and detailed (Figure 1). Three of these areas, namely ‘Mobility and Moving Networks’, ‘Multi-Radio Access’ and ‘Network Composition and Connectivity’, are described in the next part of the paper to exemplify the content of the functional areas.
User & Context Management
Network & User Services
Mobility & Moving Networks
Common Resource Mgnt.
Network Configuration & Mgnt.
SecurityAccounting & Charging
Multi-Radio Access
Network Composition & Connectivity
Figure 1: VideA Functional Areas
Mobility and Moving Networks
At least five types of mobility are commonly referred to in mobile network research and engineering. The ability of a terminal to move around within the same network as well as
3
Mobility Conference 2004
across different networks is called terminal mobility. User mobility usually refers to users who switch terminals but remain identifiable by the network (which then redirects data streams to the user's new location). It is tightly linked but not identical with Session/Flow mobility, enabling session/flow redirections to different terminals. Service mobility typically relates to layer 5-7 as well, but more generally it describes how services adapt to different characteristics of the entire path and layers all the way up to the terminal. Lastly, the term network mobility refers to entire networks in a state of movement.
Multi-Radio Access
In 4G mobile networks radio technologies are the fundamental enablers in cellular, vehicular, hot spot or indoor coverage scenarios. Scarcity in radio spectrum translates into spectral efficiency as a key 4G design target. Since all radio technologies have their specific characteristics (e.g. bandwidth, mobility, cost) the functional area ‘Multi-Radio Access’ comprises those functions dealing with a number of wireless access systems expected to be deployed in parallel. Following the “always best connected” vision the optimal use of available radio resources requires an access system selection function that decides on the radio link based on service requirements, user preferences, link characteristics and further criteria. In spite of the heterogeneity in access systems a high degree of seamless service experience for the user has to be assured requiring new ways of integration. Generic Link Layer and Common Radio Resource Management are approaches to abstract as far as possible from radio link specifics and to efficiently allocate radio resource. Software Defined Radio is seen as a technology to control the radio characteristics by modifying interface parameters. Due to an assumed large installed base of 3G infrastructure and licence fees the integration and evolution of existing access systems (e.g. UTRAN) is of particular commercial interest.
Network Composition and Connectivity
4G mobile networks will serve as global connectivity platform that is transparent to the applications at the edges. This platform with advanced functionalities will support all kind of user services and applications and therefore will have to deal with arbitrary traffic mixes. Based on end-to-end connectivity and well-standardized interfaces, the functional area ‘Network Composition and Connectivity’ allows flexibly composing entire networks by means of dynamically combining and even merging a few or all control functions of the networks involved. The composition process requires capability negotiation between individual networks and takes a set of rules and policies - formulated by the network operators involved - into
4
Mobility Conference 2004
account. The enforcement of the decision results in a so-called composed network. A composed network is not a hyper-network created from smaller ones; rather it is seen as an autonomously created structure that recursively, dynamically, and continuously composes and later on decomposes itself. If all parties agree on terms of cooperation a formal composition agreement will be settled that fixes the dynamic function split between the networks and the degree of composition. Any party can be incorporated in several composed networks simultaneously, whereby each one is logically separated from the others. FROM FUNCTIONAL AREAS TO A FUNCTIONAL ARCHITECTURE The idea of functional areas that have to be covered by a 4G mobile network is quite neutral with respect to its implementation. Arguing starts with the question of how to find the best design approach to realize a 4G network. Since there is no doubt that 4G will be developed based on the experiences with the 2G and 3G mobile networks as well as the Internet, it helps to take a brief look at the design of these networks.
The Integrated Approach
The standardization process of 2G/3G mobile networks followed a heuristic approach of firstly identifying the services or service capabilities to be provided, the functions required, mapping them to functional entities, and step-by-step elaborating details of each function and their mutual dependencies. Reference points that are defined between adjacent functional entities specify the co-operation between the various entities and detail interactions between those functions, which had to be distributed across several entities. Phrased procedures, symbolic data flows, information elements including their semantics etc. are proved means in order to refine this functional architecture. GPRS [7] provides an idea of this comprehensive design approach that is common in telecommunication industry. Radio resource management, mobility management, network access control are groups of crucial functions that were considered right from the beginning. At the end of the standardization process thoroughly designed protocols and fixed physical interfaces are available. Good examples for such interfaces are GPRS Tunnelling Protocol (GTP) comprising mobility management, radio resource management, QoS, and session management functions or Mobile Application Part (MAP) covering mobility, security, and service aspects. Resulting from this top-down design approach rather homogenous, firmly integrated, sometimes monolithic but on the other hand highly optimised systems are laid out. Since the effort for integrating the various system functions is spent in the course of the standardization phase the final specifications are almost ready for implementation. Although these systems evolve by implementing additional functions and features in succeeding releases they have to be characterised as rather closed and to a certain degree
5
Mobility Conference 2004
inflexible. Therefore the challenge in designing a 4G mobile network architecture is to increase the flexibility and openness whilst retaining the high level of integration and optimization.
The Internet Approach
The great success of the Internet just results from its flexibility and openness. Although the Internet provides basic connectivity service, there is no such thing as ‘the Internet system’ with a well-defined set of user services comparable to the 2G/3G mobile networks. Due to the fact that the intelligence and the applications are placed at the edge of the Internet, the possibilities of derived services are virtually unlimited. The Internet has been able to provide such a high degree of flexibility because it architecturally allowed constructing the network based on independent or loosely-coupled building blocks. As long as the building blocks are able to interface with each other via the Internet protocol stack they can be combined as needed. Main disadvantages of this approach are the effort for the case-by-case integration of the various building blocks and the inability to provide predictable user services as in 2G/3G mobile networks. Functions that stretch across different building blocks can hardly be optimized.
The Proposed Approach for 4G
In the course of the development of 3G, many good features and mechanisms of the Internet have been adopted. The extensive deployment of the IP-based protocols and the introduction of the IP Multimedia Subsystem in the UMTS Release 5 and 6 are examples of the efforts on the side of the traditional mobile networks to enhance their flexibility and openness. Labelled by the slogans “Cellular goes Internet” and “Internet goes Cellular”, the convergence of the two “worlds” is continuing. As one of the products of the convergence, 4G will inherit valuable features from both. To continue the commercial successes of the 2G/3G mobile networks, we believe, the 4G network will continue to provide a set of well-defined user services or service capabilities, to which the users can access in a predictable and guaranteed manner. At the same time, 4G should serve as an open platform for versatile new services. To reach this end, it is expected that functions from all the functional areas in Section 2 should be present, and namely be organized together by a 4G functional architecture. The question remains what the functional architecture should look like. The Internet has traditionally just provided best-effort connectivity for fixed networking environment. In our SeQoMo project [2], we have investigated how to build an all-IP mobile network. In order to achieve secure and predictable mobility, we found out that there is the need for a close functional coupling among security, QoS and mobility. Basically, it is inadequate to provide these functions in isolation. In does not make much sense, for example, to make a quick handover and then only to find out that the related QoS level is not maintained any more. Likewise, the demand for mobility and QoS
6
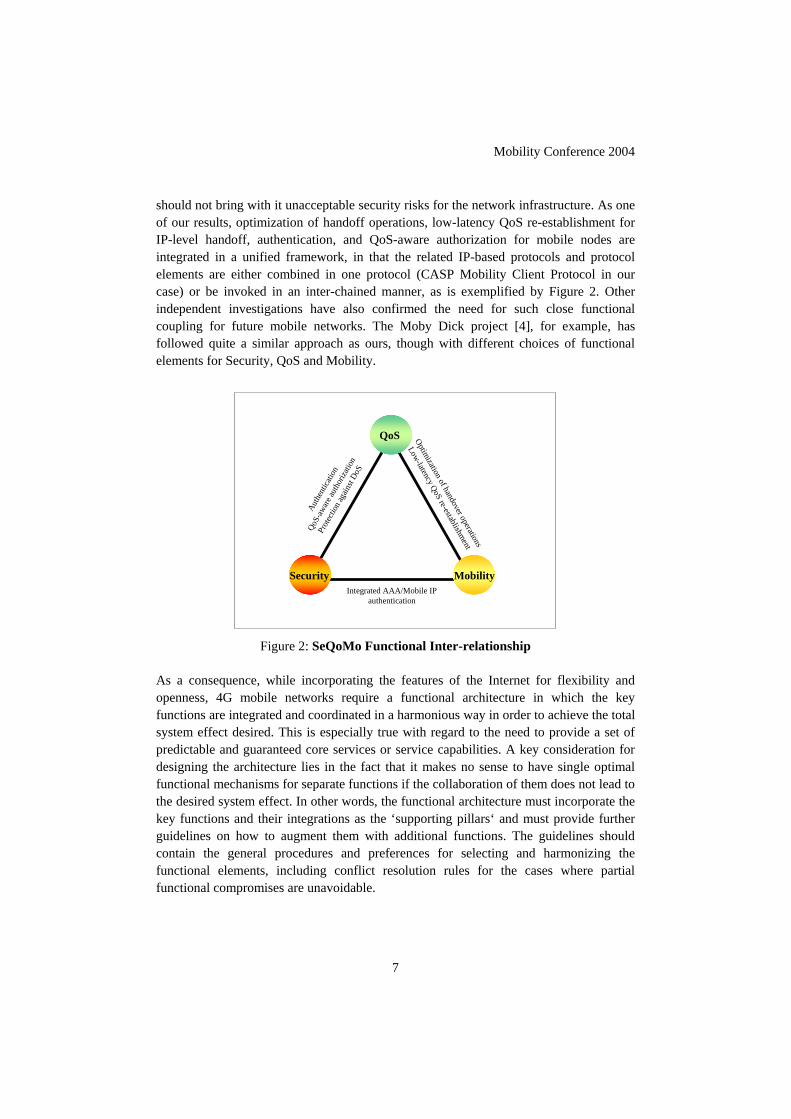
Mobility Conference 2004
should not bring with it unacceptable security risks for the network infrastructure. As one of our results, optimization of handoff operations, low-latency QoS re-establishment for IP-level handoff, authentication, and QoS-aware authorization for mobile nodes are integrated in a unified framework, in that the related IP-based protocols and protocol elements are either combined in one protocol (CASP Mobility Client Protocol in our case) or be invoked in an inter-chained manner, as is exemplified by Figure 2. Other independent investigations have also confirmed the need for such close functional coupling for future mobile networks. The Moby Dick project [4], for example, has followed quite a similar approach as ours, though with different choices of functional elements for Security, QoS and Mobility.
Optimization of handover operations
Low-latency QoSre-establishm
ent
MobilitySecurity
QoS
Auth
entic
ation
QoS-aw
are a
utho
rizati
on
Prot
ectio
n aga
inst
DoS
Integrated AAA/Mobile IP authentication
Figure 2: SeQoMo Functional Inter-relationship
As a consequence, while incorporating the features of the Internet for flexibility and openness, 4G mobile networks require a functional architecture in which the key functions are integrated and coordinated in a harmonious way in order to achieve the total system effect desired. This is especially true with regard to the need to provide a set of predictable and guaranteed core services or service capabilities. A key consideration for designing the architecture lies in the fact that it makes no sense to have single optimal functional mechanisms for separate functions if the collaboration of them does not lead to the desired system effect. In other words, the functional architecture must incorporate the key functions and their integrations as the ‘supporting pillars‘ and must provide further guidelines on how to augment them with additional functions. The guidelines should contain the general procedures and preferences for selecting and harmonizing the functional elements, including conflict resolution rules for the cases where partial functional compromises are unavoidable.
7
Mobility Conference 2004
In fact, considering several published 4G network concepts just a few functions turned out to be critical for architectural decisions. The VideA functional architecture is constructed based on functional entities which provide these essential functions. An additional aspect hereby is to take the inherent relationships among the key functions into account. We envisage key functions from the functional areas ‘Mobility and Moving Networks’, ‘Multi-Radio Access’, ‘Common Resource Management’ and ‘Security’ will be closely coupled or integrated to form the nucleus of the VideA functional architecture. Other functions are then selected and accommodated around this nucleus, as is schematically depicted in Figure 1. CONCLUSION Concluding from our investigations the functional areas elaborated for VideA turned out to be a valuable framework to derive architectural decisions. These decisions led us to a more tangible picture of future mobile networks justifying the claim for a 4th generation. This contribution has provided an overview of the functional aspects to be considered and their complex relations and dependencies in form of a functional architecture. A detailed description of the functional architecture will be reported under separate cover. We are sure that the proposed approach is the only feasible way to successfully design 4G mobile networks. By combining a function-oriented top-down approach with architectural openness the challenges ahead can be met. REFERENCES [1] Pampu C., Andersen F.-U. and Reimer U., “Requirements for VideA – A Functional
Architecture for Future Mobile Networks”, Proc. Int’l Symp. on Wireless Personal Multimedia Communications (WPMC), Yokosuka, Japan, Oct. 2003.
[2] Fu X., Festag A., Schäfer G. and Fan C., “Secure, QoS-Enabled Mobility Support for IP-based Networks”, Proc. Int’l Conf. on IP Based Cellular Networks (IPCN), Paris, France, Dec. 2003.
[3] Keszei C., Georganopoulos N., Turanyi Z., Valko A., “Evaluation of the BRAIN Candidate Mobility Management Protocol”, IST Global Summit 2001, Barcelona
[4] Marques V. et al, “An IP-based QoS architecture for 4G operator scenarios”, IEEE Wireless Communications, June 2003.
[5] Vollbrecht J. et al, “AAA authorization framework”, RFC 2904, August 2000. [6] Xiao X., and Ni L.M., “Internet QoS: A Big Picture”, IEEE Network, Mar. 1999. [7] 3GPP TS 23.060: “General Packet Radio Service, Service Description, Stage 2”. [8] Andersen F.-U., Fan C., Pittmann F. and Reimer U., “Functional Areas for a System
Beyond 3rd Generation” (submitted to WWRF11 Meeting).
8
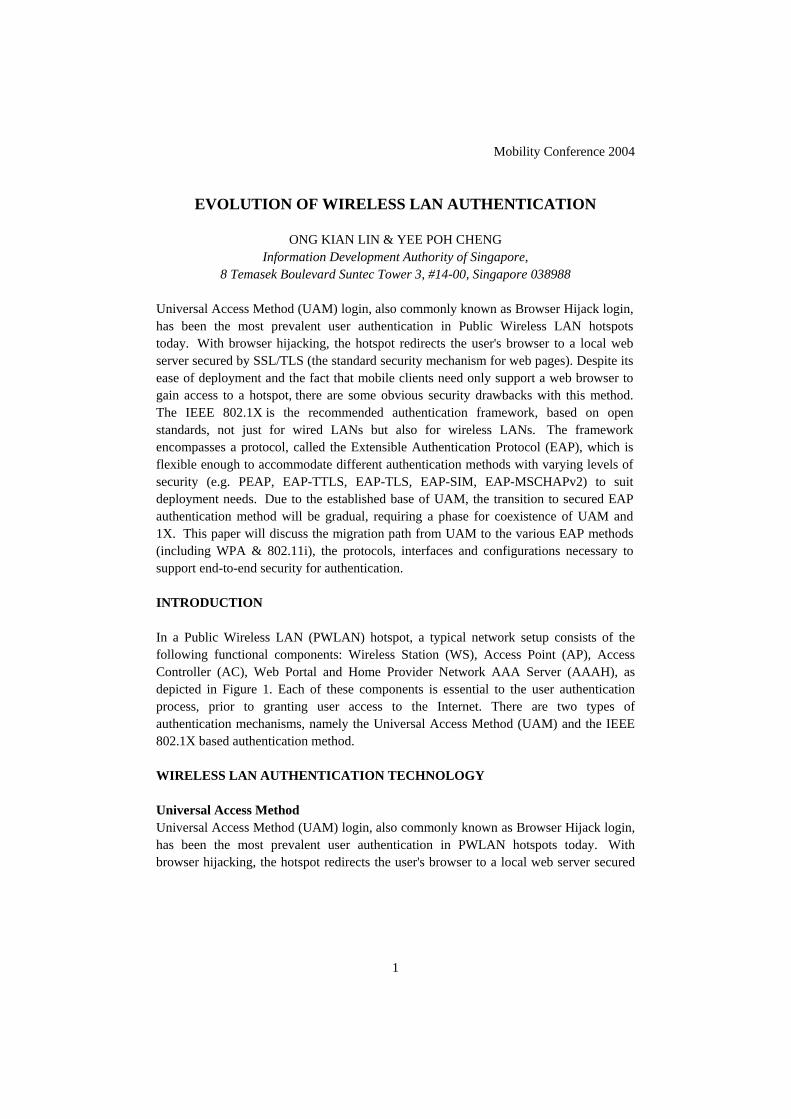
Mobility Conference 2004
EVOLUTION OF WIRELESS LAN AUTHENTICATION
ONG KIAN LIN & YEE POH CHENG Information Development Authority of Singapore,
8 Temasek Boulevard Suntec Tower 3, #14-00, Singapore 038988
Universal Access Method (UAM) login, also commonly known as Browser Hijack login, has been the most prevalent user authentication in Public Wireless LAN hotspots today. With browser hijacking, the hotspot redirects the user's browser to a local web server secured by SSL/TLS (the standard security mechanism for web pages). Despite its ease of deployment and the fact that mobile clients need only support a web browser to gain access to a hotspot, there are some obvious security drawbacks with this method. The IEEE 802.1X is the recommended authentication framework, based on open standards, not just for wired LANs but also for wireless LANs. The framework encompasses a protocol, called the Extensible Authentication Protocol (EAP), which is flexible enough to accommodate different authentication methods with varying levels of security (e.g. PEAP, EAP-TTLS, EAP-TLS, EAP-SIM, EAP-MSCHAPv2) to suit deployment needs. Due to the established base of UAM, the transition to secured EAP authentication method will be gradual, requiring a phase for coexistence of UAM and 1X. This paper will discuss the migration path from UAM to the various EAP methods (including WPA & 802.11i), the protocols, interfaces and configurations necessary to support end-to-end security for authentication. INTRODUCTION In a Public Wireless LAN (PWLAN) hotspot, a typical network setup consists of the following functional components: Wireless Station (WS), Access Point (AP), Access Controller (AC), Web Portal and Home Provider Network AAA Server (AAAH), as depicted in Figure 1. Each of these components is essential to the user authentication process, prior to granting user access to the Internet. There are two types of authentication mechanisms, namely the Universal Access Method (UAM) and the IEEE 802.1X based authentication method. WIRELESS LAN AUTHENTICATION TECHNOLOGY Universal Access Method Universal Access Method (UAM) login, also commonly known as Browser Hijack login, has been the most prevalent user authentication in PWLAN hotspots today. With browser hijacking, the hotspot redirects the user's browser to a local web server secured
1

Mobility Conference 2004
by SSL/TLS1 (the standard security mechanism for web pages). Despite its ease of deployment and the fact that mobile clients need only support a web browser to gain access to a hotspot, there are obvious security drawbacks associated with this method, which makes UAM insecure for its long term outreach namely: Hacker Interception - Without SSL/TLS, Browser Hijack is vulnerable2 to hackers intercepting the user’s HTTP request and redirecting the user to an illegitimate web page.
Certificate Validation - SSL/TLS requires user to validate the server certificate with a Root CA before connecting to the server. Most users, either, do not have the necessary Root CA certificates on their laptops (Server-side PKI) or find it too bothersome to check the certificates to ensure they are valid or have not expired. Accepting the certificate, without reading the content, poses security vulnerability in the face of a renegade access point.
No Privacy Support For Roaming - Credentials are divulged to the visited network during web-based authentication. In the roaming context, a user is rightfully able to use his/her own existing credentials with a Wireless Internet service provider (WISP, the home provider where the user has a paid subscription) to authenticate at any hotspot operated by a different provider (visited network). In the process of authentication, the visited network will forward the username and password to the home provider network to determine if the user is legitimate. With a browser hijack solution, however, this implies that the user must divulge his/her username and password to the visited network operator. This violates privacy requirements that user identities and particulars should only be known to his/her own home provider. In light of its security vulnerabilities and proprietary nature, it is desirable that wireless LAN (WLAN) implementers and users migrate to the more secured and standards based IEEE 802.1X authentication framework with WPA and eventually 802.11i, where credentials are not divulged to intermediaries and the trust model is more robust.
1 In its simplest form, browser hijack can operate without SSL/TLS. The user first sends a HTTP Request to the access point, which in turn forwards it to an access controller. Instead of sending the HTTP Request to the actual website in the Internet, the access controller redirects the HTTP Request to a web login page. 2 The web login process stage is where SSL/TLS can be applied to provide data privacy and data integrity for the transmission of user credentials such as username and password.
2
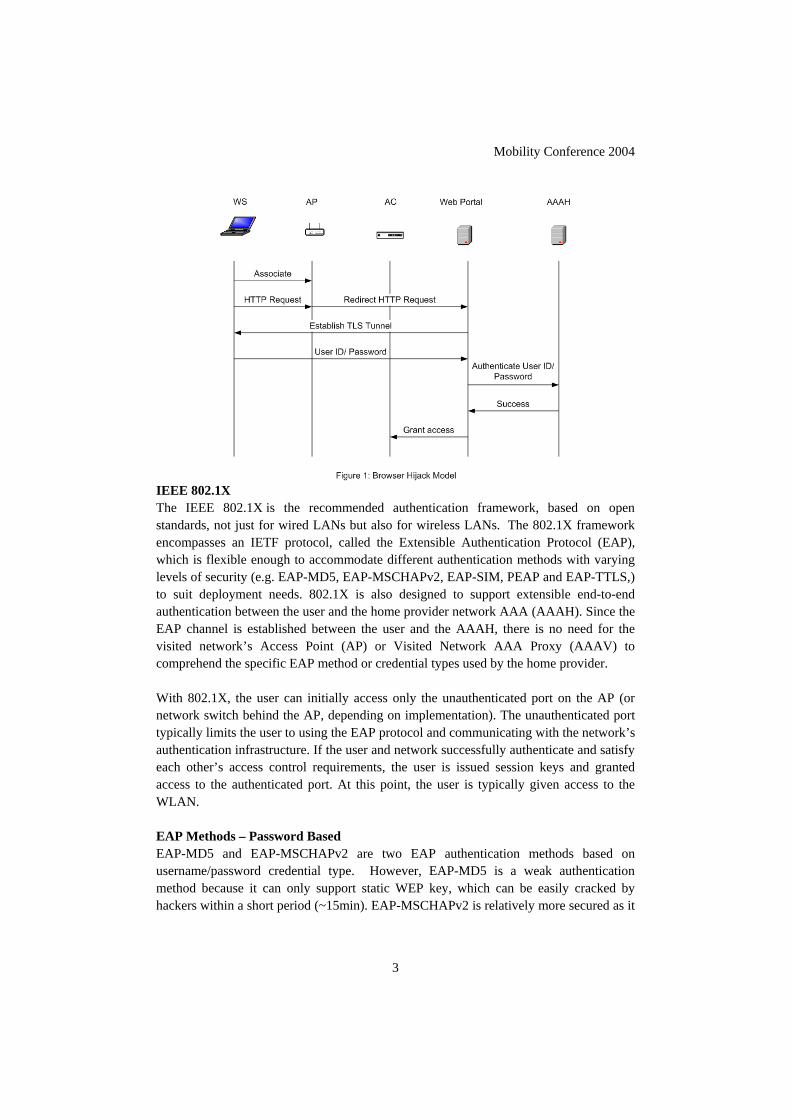
Mobility Conference 2004
IEEE 802.1X The IEEE 802.1X is the recommended authentication framework, based on open standards, not just for wired LANs but also for wireless LANs. The 802.1X framework encompasses an IETF protocol, called the Extensible Authentication Protocol (EAP), which is flexible enough to accommodate different authentication methods with varying levels of security (e.g. EAP-MD5, EAP-MSCHAPv2, EAP-SIM, PEAP and EAP-TTLS,) to suit deployment needs. 802.1X is also designed to support extensible end-to-end authentication between the user and the home provider network AAA (AAAH). Since the EAP channel is established between the user and the AAAH, there is no need for the visited network’s Access Point (AP) or Visited Network AAA Proxy (AAAV) to comprehend the specific EAP method or credential types used by the home provider. With 802.1X, the user can initially access only the unauthenticated port on the AP (or network switch behind the AP, depending on implementation). The unauthenticated port typically limits the user to using the EAP protocol and communicating with the network’s authentication infrastructure. If the user and network successfully authenticate and satisfy each other’s access control requirements, the user is issued session keys and granted access to the authenticated port. At this point, the user is typically given access to the WLAN. EAP Methods – Password Based EAP-MD5 and EAP-MSCHAPv2 are two EAP authentication methods based on username/password credential type. However, EAP-MD5 is a weak authentication method because it can only support static WEP key, which can be easily cracked by hackers within a short period (~15min). EAP-MSCHAPv2 is relatively more secured as it
3
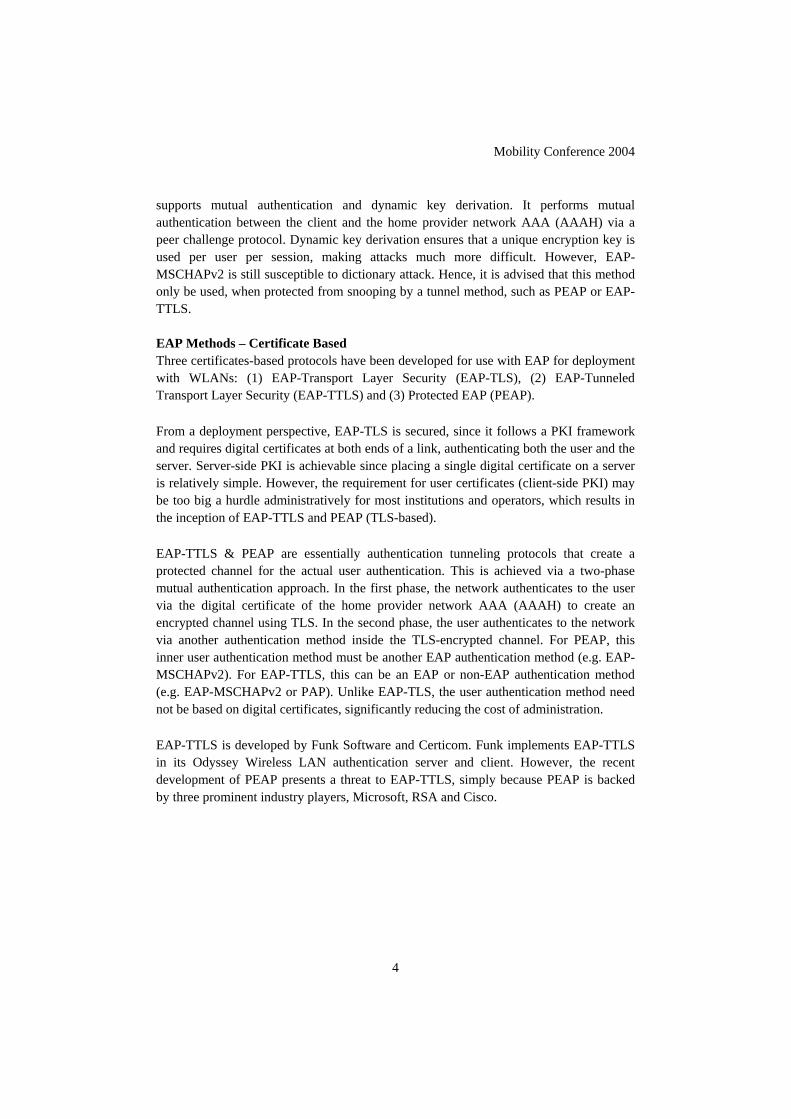
Mobility Conference 2004
supports mutual authentication and dynamic key derivation. It performs mutual authentication between the client and the home provider network AAA (AAAH) via a peer challenge protocol. Dynamic key derivation ensures that a unique encryption key is used per user per session, making attacks much more difficult. However, EAP-MSCHAPv2 is still susceptible to dictionary attack. Hence, it is advised that this method only be used, when protected from snooping by a tunnel method, such as PEAP or EAP-TTLS. EAP Methods – Certificate Based Three certificates-based protocols have been developed for use with EAP for deployment with WLANs: (1) EAP-Transport Layer Security (EAP-TLS), (2) EAP-Tunneled Transport Layer Security (EAP-TTLS) and (3) Protected EAP (PEAP).
From a deployment perspective, EAP-TLS is secured, since it follows a PKI framework and requires digital certificates at both ends of a link, authenticating both the user and the server. Server-side PKI is achievable since placing a single digital certificate on a server is relatively simple. However, the requirement for user certificates (client-side PKI) may be too big a hurdle administratively for most institutions and operators, which results in the inception of EAP-TTLS and PEAP (TLS-based).
EAP-TTLS & PEAP are essentially authentication tunneling protocols that create a protected channel for the actual user authentication. This is achieved via a two-phase mutual authentication approach. In the first phase, the network authenticates to the user via the digital certificate of the home provider network AAA (AAAH) to create an encrypted channel using TLS. In the second phase, the user authenticates to the network via another authentication method inside the TLS-encrypted channel. For PEAP, this inner user authentication method must be another EAP authentication method (e.g. EAP-MSCHAPv2). For EAP-TTLS, this can be an EAP or non-EAP authentication method (e.g. EAP-MSCHAPv2 or PAP). Unlike EAP-TLS, the user authentication method need not be based on digital certificates, significantly reducing the cost of administration.
EAP-TTLS is developed by Funk Software and Certicom. Funk implements EAP-TTLS in its Odyssey Wireless LAN authentication server and client. However, the recent development of PEAP presents a threat to EAP-TTLS, simply because PEAP is backed by three prominent industry players, Microsoft, RSA and Cisco.
4

Mobility Conference 2004
EAP Methods – SIM Based Apart from password and certificate based authentication, EAP solutions are also being defined for other credential types, most notably the Subscriber Identity Module (SIM). SIM based authentication is promising as it enables interworking between two disparate networks: the WLAN and GSM or 3G networks, using secured SIM cards (physical security). This allows GSM and 3G mobile operators to reuse their existing authentication infrastructure for providing access to WLAN networks in public hotspots. To facilitate SIM-based authentication, there must first be options to read the credentials from the SIM card onto the notebooks. There are generally four avenues to do so. The first is using USB SIM Access. This is the most common way for accessing a SIM card, using a USB SIM reader and SIM ready driver software. The second method is SIM Access from a PC Card. This will require a PCMCIA card with a slot for SIM for notebooks. This approach is similar to the first, except that the SIM card reader is PCMCIA-based. The third option is SIM Access from a Mobile Handset over Bluetooth. The notebook is able to connect to the handset over a Bluetooth connection. This approach reuses the SIM on the cell phone and the user does not need a SIM card reader
5
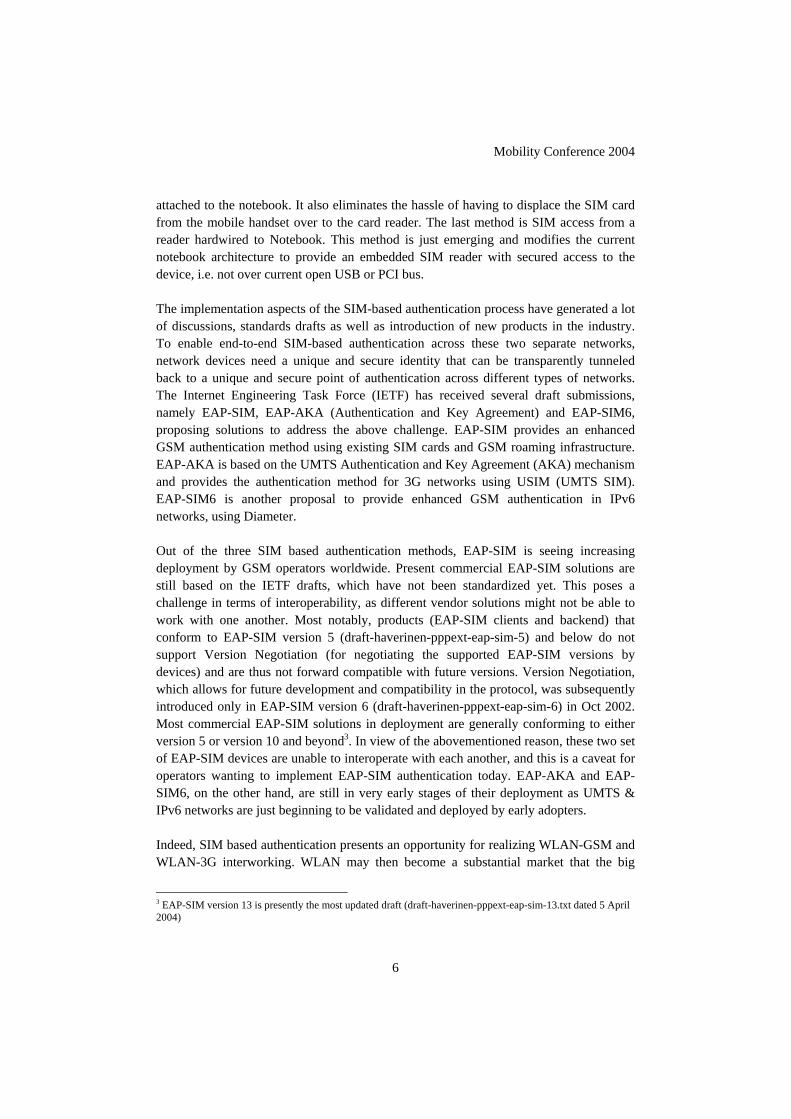
Mobility Conference 2004
attached to the notebook. It also eliminates the hassle of having to displace the SIM card from the mobile handset over to the card reader. The last method is SIM access from a reader hardwired to Notebook. This method is just emerging and modifies the current notebook architecture to provide an embedded SIM reader with secured access to the device, i.e. not over current open USB or PCI bus. The implementation aspects of the SIM-based authentication process have generated a lot of discussions, standards drafts as well as introduction of new products in the industry. To enable end-to-end SIM-based authentication across these two separate networks, network devices need a unique and secure identity that can be transparently tunneled back to a unique and secure point of authentication across different types of networks. The Internet Engineering Task Force (IETF) has received several draft submissions, namely EAP-SIM, EAP-AKA (Authentication and Key Agreement) and EAP-SIM6, proposing solutions to address the above challenge. EAP-SIM provides an enhanced GSM authentication method using existing SIM cards and GSM roaming infrastructure. EAP-AKA is based on the UMTS Authentication and Key Agreement (AKA) mechanism and provides the authentication method for 3G networks using USIM (UMTS SIM). EAP-SIM6 is another proposal to provide enhanced GSM authentication in IPv6 networks, using Diameter. Out of the three SIM based authentication methods, EAP-SIM is seeing increasing deployment by GSM operators worldwide. Present commercial EAP-SIM solutions are still based on the IETF drafts, which have not been standardized yet. This poses a challenge in terms of interoperability, as different vendor solutions might not be able to work with one another. Most notably, products (EAP-SIM clients and backend) that conform to EAP-SIM version 5 (draft-haverinen-pppext-eap-sim-5) and below do not support Version Negotiation (for negotiating the supported EAP-SIM versions by devices) and are thus not forward compatible with future versions. Version Negotiation, which allows for future development and compatibility in the protocol, was subsequently introduced only in EAP-SIM version 6 (draft-haverinen-pppext-eap-sim-6) in Oct 2002. Most commercial EAP-SIM solutions in deployment are generally conforming to either version 5 or version 10 and beyond3. In view of the abovementioned reason, these two set of EAP-SIM devices are unable to interoperate with each another, and this is a caveat for operators wanting to implement EAP-SIM authentication today. EAP-AKA and EAP-SIM6, on the other hand, are still in very early stages of their deployment as UMTS & IPv6 networks are just beginning to be validated and deployed by early adopters. Indeed, SIM based authentication presents an opportunity for realizing WLAN-GSM and WLAN-3G interworking. WLAN may then become a substantial market that the big
3 EAP-SIM version 13 is presently the most updated draft (draft-haverinen-pppext-eap-sim-13.txt dated 5 April 2004)
6

Mobility Conference 2004
telcos and wireless operators seek to incorporate into a bundle of services for their business subscribers.
EVOLUTION PATH Coexistence of UAM and 802.1X The adoption of 802.1X will be a global trend for public WLANs deployments given the support from major industry players, including Microsoft, Intel and Cisco. Due to the established base of UAM, the transition to secured EAP authentication method will be gradual, requiring a phase for coexistence of UAM and 802.1X. Some effort is required to ensure that the migration from browser-hijack to 802.1X is painless to customers. One possible strategy for WLAN operators is to offer both browser-hijack and 802.1X at the same time during the interim period before all users become 802.1X enabled. Single SSID solution - Coexistence of browser-hijack and 802.1X can be non-trivial in terms of network design and implementation. One issue encountered today is whether the access point (AP) can support both browser-hijack and 802.1X using a single broadcast SSID (Service Set ID), which is an ID for identifying the WLAN network that the user can connect to. Most APs in the market today, however, cannot support browser-hijack and 802.1X using a single SSID. Some vendors provide this support but entail some tight coupling between the access point (AP) and the access controller (AC), which is the server-end for the browser-hijack and the relay to the 802.1X authentication server.
7

Mobility Conference 2004
Multiple SSIDs solution - An alternative solution will be to support each policy (UAM/802.1X) using a different SSID, possibly mapped to respective VLANs (Virtual LAN). For example, all browser-hijack users will connect to SSID-1 with an open/guest VLAN while the 802.1X users will connect to SSID-2, with an encrypted/authenticated VLAN.
One drawback, commonly seen with most vendors using this approach, is that only one SSID can be broadcasted, either for browser-hijack or for 802.1X but not both. Most APs today can support only one broadcast SSID. If the operator chose to broadcast the SSID for the browser-hijack users, then the SSID for 802.1X users has to be hidden, which means that there is no automated discovery process for the hidden SSID. All the 802.1X users will thus need to be informed about the hidden SSID for 802.1X in advance, before they could connect to the WLAN. This involves having to bring to mind the exact name of the hidden SSID and manually entering it into the client, making the process administratively cumbersome. The workaround solution is to set up two APs, one for browser-hijack and one for 802.1X. Each can have its own broadcast SSID then. However, this means that the operator now has to invest in twice the number of APs than actually needed. This method is less attractive as it incurs increased infrastructure cost (sunk-in cost) to the operator. There are emerging new solutions, offered by selected vendors, to support simultaneous broadcast of more than one SSID (Some are supporting as many as 16 broadcast SSIDs). This eliminates the problem of having to remember specifically the hidden SSID to gain access to 802.1X WLAN networks. From most operators’ perspective, this is, however, still not a good enough solution as subscribers should ideally only login via a single broadcast SSID, which is associated with their designated hotspot provider. Wi-Fi Protected Access (WPA) & 802.11i It is very important to understand that the threat on WLAN networks for network impersonation is substantially higher than wired networks. With wired networks, the user’s direct connection to the network has at least some level of implied authenticity by virtue of physical wires. In a WLAN network, signals are transmitted freely over the air, and there is no such first line of defense in terms of physical security. Unless robust mechanisms to authenticate the network are employed, the user is highly vulnerable to man-in-the-middle or rogue AP attacks on the wireless link. With the undertaking of WPA & 802.11i that necessitates a secured authentication mechanism using 802.1X, WLAN security is affirmed to be further enhanced.
8

Mobility Conference 2004
Wi-Fi Protected Access (WPA) is a specification of standards-based, interoperable security enhancements that strongly increases the level of data protection and access control for Wireless LAN systems. It addresses the vulnerabilities of Wired Equivalent Privacy (WEP) and contains many of the components of the formal security standards nearing ratification by the IEEE 802.11 Task Group i. WPA is touted to be forward compatible with 802.11i (expected to be ratified in June 2004), as it is also a subset of the current 802.11i draft, taking certain pieces of 802.11i that are ready to bring to market, namely 802.1X and Temporal Key Integrity Protocol (TKIP). The main pieces that 802.11i has in addition are: secure IBSS (Independent Basic Service Set), secure fast handoff, secure de-authentication and disassociation, as well as replacing the 802.11’s RC4-based encryption with the more secured Advanced Encryption Standard (AES). At this moment, products supporting WPA are labeled "Wi-Fi WPA-certified”. Wi-Fi alliance has said that it will certify 802.11i under the name “WPA2”. Migration to WPA - Upgrading to the WPA suite requires only software changes to access points and clients. To migrate to WPA, It is foreseen that access points will most probably be upgraded before all the Wi-Fi clients. Many access points are thus now capable of operating in “mixed mode” to support both clients running WPA and WEP. Migration to 802.11i - The issue with 802.11i is that it is expected to require hardware upgrades, since AES support requires wireless chipsets with built in encryption engines. Migrating to 802.11i-AES encryption for older generation APs and WLAN clients, therefore, will require hardware changes, which explains why Wi-Fi Allaince has deferred from adopting AES for WPA. This is mitigated, to a certain extent, by Wi-Fi chips makers (Broadcom, Atheros, GlobeSpanVirata etc.) that are already shipping Wi-Fi chips, since the end of 2002, that contain the processing core and other elements necessary to handle AES. These chips will only require firmware upgrades to activate AES once 802.11i has been ratified. Nevertheless, because of the expense associated with 802.11i upgrades, it is expected to occur gradually over time. This should not be a problem since 802.11i will be backward compatible with WPA. Newer APs and network cards will support the new standard and will also support legacy compatibility modes. Enterprises that upgrade their networks may choose to disable the legacy modes to reap the full benefits of the new security features of 802.11i. Public hotspots are likely to keep the legacy modes enabled as long as they are deriving significant revenues from users with legacy WLAN cards. CONCLUSION The road to pervasive Wireless LAN usage starts with secured authentication. Selecting an authentication strategy is a crucial decision when designing a secured Wireless LAN for deployment. The present browser-hijack authentication has reached mass deployment
9

Mobility Conference 2004
status but is, unfortunately, not fully secured. Authentication should migrate to the more secured 802.1X based model with WPA and eventually 802.11i, which have superior properties and permit greater flexibility in credential types (SIM-based, Password-based etc.) than browser hijack. However, existing investments cannot be discarded overnight. It is envisioned that browser hijack and 802.1X will coexist for at least a few years. Coexistence of browser-hijack and 802.1X (including migration to WPA & 802.11i), can, nevertheless, be non-trivial and this paper has explored the various emerging strategies that will help to phase a smooth transition to the eventual 802.1X framework. REFERENCES [1] IDA, Intel, “Public WLAN Interworking Study”, Draft Revision 0.8, 1st edition, Jan
12, 2004 [2] IEEE-SA Standards Board, IEEE Standard for Local and metropolitan area
networks, “Port Based Network Access Control”, IEEE 802-1X-REV/D7.1, 14 June 2001
[3] H. Haverinen, J.Salowey, “EAP SIM Authentication”, draft-haverinen-pppext-eap-sim-0x.txt (work in progress), 2002-2004.
[4] J.Arkko, H. Haverinen, “EAP AKA Authentication”, draft-arkko-pppext-eap-aka-0x.txt (work in progress), 2002-2004.
[5] Vivek Kamath, Ashwin Palekar “Microsoft EAP CHAP Extensions”, draft-kamath-pppext-eap-mschapv2-01.txt (work in progress), April 2004.
[6] Blunk, L. and J. Vollbrecht, ”PPP Extensible Authentication Protocol (EAP)”, RFC 2284, March 1998.
[7] Paul Funk, Simon Blake-Wilson, “EAP Tunneled TLS Authentication Protocol (EAP-TTLS)”, draft-ietf-pppext-eap-ttls-04.txt (work in progress), April 2004
[8] C. Rigney, S. Willens, A. Rubens, W. Simpson, “Remote Authentication Dial In User Service (RADIUS), RFC 2865, June 2000
[9] B. Aboba, D. Simon, “PPP EAP TLS Authentication Protocol”, RFC 2716, October 1999.
[10] WiFi Alliance, “WiFi Protected Access (WPA)”, Version 1.2, December 16, 2002
10