Multilayer sensors for the sensorial radio bubble09.pdf · Multilayer sensors for the sensorial...
34
Multilayer sensors for the sensorial radio bubble Jacques Palicot, Christophe Moy and Rachid Hachemani SUPELEC / IETR, Campus de Rennes, Avenue de la Boulaie, CS 47601 F-35576 Cesson-S´ evign´ e, France Email:<jacques.palicot,christophe.moy,rachid.hachemani>@supelec.fr phone:+33 [0]2 99 84 45 00 fax: +33 [0]2 99 84 45 99 Abstract We propose to define a volume around cognitive radio equipments, typically terminals, called the ”Sensorial Radio Bubble” or SRB, the diameter of which is at the scale of the sensing possibility of the equipment. The SRB gives communication equipments the ability to explore the radio environment in order to provide knowledge about the spatial and spectral environment, and some context awareness. By analogy to the human sensorial bubble, we as- sert that this could permit the cognitive radio equipment to plan his coming behavior in order to predict and anticipate its reaction to environment evolu- tion. In this paper we present details of the sensors required in the Sensorial Radio Bubble. The sensors of the SRB may be classified in function of the OSI layers. A simplified three layer model is presented for our purpose. An example of sensor of the lower layer is spectrum hole detection, for the inter- mediate layers the blind standard recognition sensor is described, and finally for the higher layers a video sensor is presented. Key words: Sensing system, environment analysis, sensors, cognitive radio, software radio, reconfigurable radio, handover. 1. Introduction 1.1. Cognitive Radio Cognitive radio relies on Mitola’s work in [1] and [2]. Mitola argues that radio will become more and more autonomous, and thanks to the support of flexible technology (namely SDR) will acquire some self-autonomy to dy- namically modify its functionality. As explained in the schematic of Figure 1, Preprint submitted to Nuclear Physics B January 20, 2009
Transcript of Multilayer sensors for the sensorial radio bubble09.pdf · Multilayer sensors for the sensorial...
Multilayer sensors for the sensorial radio bubble
Jacques Palicot, Christophe Moy and Rachid Hachemani
SUPELEC / IETR,Campus de Rennes, Avenue de la Boulaie, CS 47601 F-35576 Cesson-Sevigne, France
Email:<jacques.palicot,christophe.moy,rachid.hachemani>@supelec.frphone:+33 [0]2 99 84 45 00 fax: +33 [0]2 99 84 45 99
Abstract
We propose to define a volume around cognitive radio equipments, typicallyterminals, called the ”Sensorial Radio Bubble” or SRB, the diameter of whichis at the scale of the sensing possibility of the equipment. The SRB givescommunication equipments the ability to explore the radio environment inorder to provide knowledge about the spatial and spectral environment, andsome context awareness. By analogy to the human sensorial bubble, we as-sert that this could permit the cognitive radio equipment to plan his comingbehavior in order to predict and anticipate its reaction to environment evolu-tion. In this paper we present details of the sensors required in the SensorialRadio Bubble. The sensors of the SRB may be classified in function of theOSI layers. A simplified three layer model is presented for our purpose. Anexample of sensor of the lower layer is spectrum hole detection, for the inter-mediate layers the blind standard recognition sensor is described, and finallyfor the higher layers a video sensor is presented.
Key words: Sensing system, environment analysis, sensors, cognitive radio,software radio, reconfigurable radio, handover.
1. Introduction
1.1. Cognitive Radio
Cognitive radio relies on Mitola’s work in [1] and [2]. Mitola argues thatradio will become more and more autonomous, and thanks to the supportof flexible technology (namely SDR) will acquire some self-autonomy to dy-namically modify its functionality. As explained in the schematic of Figure 1,
Preprint submitted to Nuclear Physics B January 20, 2009
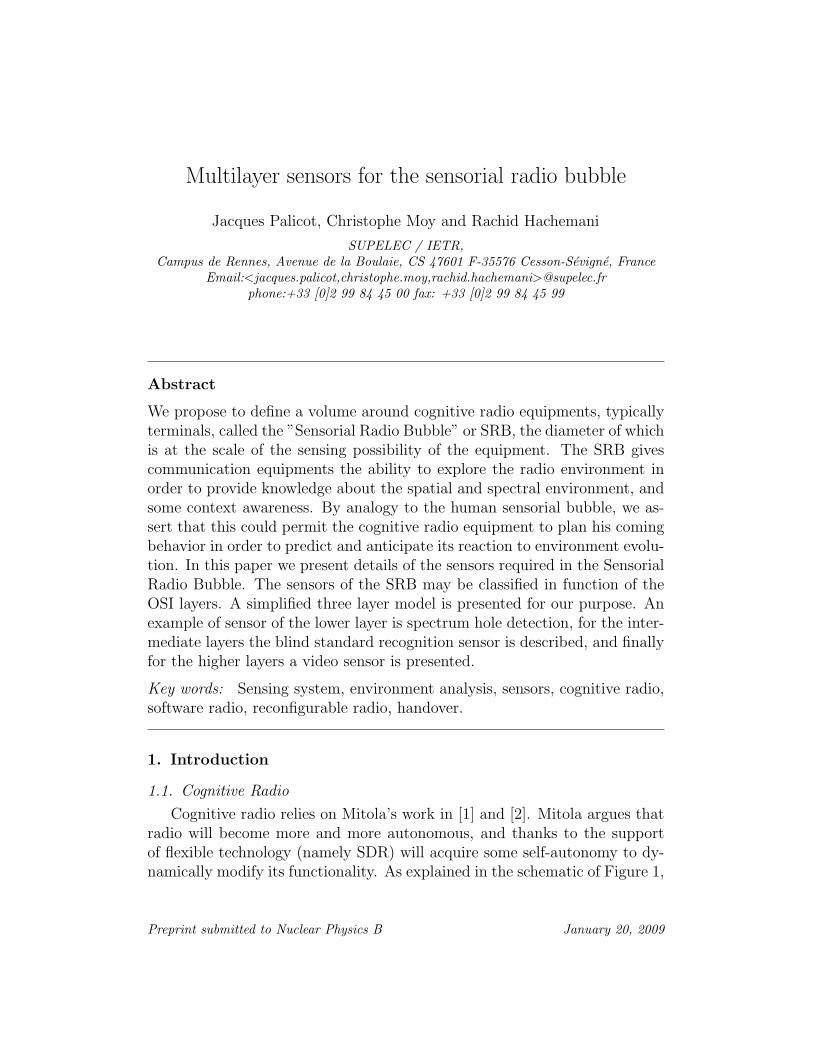
this relies on a cognitive cycle. Figure 1(a) is from [1] and Figure 1(b) is asimplified view of the cycle summarized in three main steps:
• Observe: Gathers all the sensing means of a CR,
• Decide: Represents all that implies some intelligence including learning,planning decision taking,
• Adapt: Reconfigures the radio, designed with SDR principles in orderto be as flexible as possible.
1
1.1. Cognitive Radio
Cognitive radio relies on Mitola’s work in [1] and [8]. Mitola argues that radio will become more and
more autonomous, and thanks to the support of flexible technology (namely SDR) will acquire some
self-autonomy to dynamically modify its functionality. As explained in the schematic of Figure 1, this
relies on a cognitive circle. Figure 1(a) is from [1] and Figure 1(b) is a simplified view of the cycle
summarized in three main steps:
• observe: gathers all the sensing means of a CR,
• decide: represents all that implies some intelligence including learning, planning decision
taking,
• adapt: reconfigures the radio, designed with SDR principles in order to be as flexible as
possible.
Figure 1 – (a) Mitola’s cognitive cycle, (b) simplified version
In this paper, we address sensing in its largest scale. All information that can help the radio to better
adapt its functionality for a given service in a given environment, in other words under given
constraints, is worth being taking into account. Then as we make no restriction on the sensors nature, it
is possible to draw the general approach exposed in Figure 2.
Figure 2 – Simplified OSI model for cognitive radio context
Sensors are classified in function of the OSI layers they correspond to, with a rough division in three
layers. Corresponding to the lower layers of the OSI model, we find especially all the sensing
information related to the physical layer: propagation, power consumption, coding scheme, etc. At the
intermediate level are all information that participate to vertical handovers, or can help to make a
standard choice, as a standard detection sensor for instance. The network load of the standards
supported by the equipment may be of interest. It also includes the policies concerning the vicinity, the
town or the country. The highest layer is especially related to the applications and all that concerns the
Figure 1: (a) Mitola’s cognitive cycle, (b) simplified version
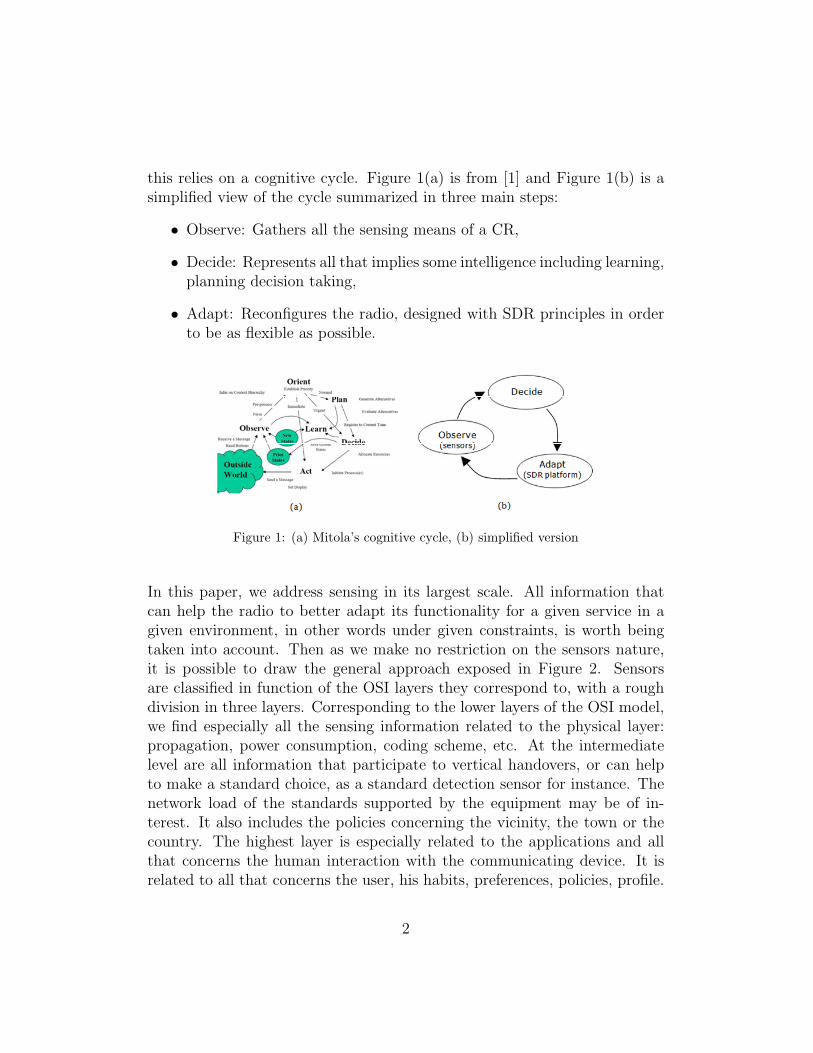
In this paper, we address sensing in its largest scale. All information thatcan help the radio to better adapt its functionality for a given service in agiven environment, in other words under given constraints, is worth beingtaken into account. Then as we make no restriction on the sensors nature,it is possible to draw the general approach exposed in Figure 2. Sensorsare classified in function of the OSI layers they correspond to, with a roughdivision in three layers. Corresponding to the lower layers of the OSI model,we find especially all the sensing information related to the physical layer:propagation, power consumption, coding scheme, etc. At the intermediatelevel are all information that participate to vertical handovers, or can helpto make a standard choice, as a standard detection sensor for instance. Thenetwork load of the standards supported by the equipment may be of in-terest. It also includes the policies concerning the vicinity, the town or thecountry. The highest layer is especially related to the applications and allthat concerns the human interaction with the communicating device. It isrelated to all that concerns the user, his habits, preferences, policies, profile.
2

�
��������
���������������� �
����������������
��������� ������ ����� �
������ ������ ����������
������������� ����������
������������������������ �
��������� �����
������������ �������
�������� ����� �
!��"����� �����������
#������$��������
����
���������
%���������
&�������
�
'�������
(�������
������ ������������
#����)��������
�
����������*����
��*�������������
�
��������������
���������������� ��������������
����������������������������
�
Figure 2: Simplified OSI model for cognitive radio context
The equipment can be aware of its environment with the help of sensors likemicrophone, video-camera, bio-sensors, etc. As we are at the early beginningof such technology, it is difficult to foresee all the possibilities. We can thinkfor instance that user’s bio metric information and/or facial recognition willensure equipment security as shown in the scenario of section 3.1. Video-camera could also be used to indicate if the terminal is outside or inside abuilding. This may impact propagation features, but also the capability ornot to receive GPS signals. Another example could be given in the contextof video conferencing, a separation between the face of the speaker and thebackground could help decreasing the data rate while refreshing slowly thebackground of the image [4]. At each level, are associated examples of sen-sors which are able to give information related to this layer (left side of theFigure 2). In addition, at the right side, we identify areas of current researchwhich are more or less connected to CR. As we would like to optimize theoverall system, we are obviously also connected to the cross layer adaptationand optimization topics. Note that this classification is also related to threewell-known concepts of the literature:
• context aware for higher layers [7],
• inter-operability for intermediate layers [8],
• link adaptation for lower layers [9].
3

All this may be combined to proceed cross-layer optimizations. This isone of the responsibilities of the cognitive engine in our mind.
However, due to the high financial pressure on spectrum issues, CR isoften restricted in the research community to spectrum management aspectsas in [10] [5] [11]. Opportunistic spectrum access approaches are exploredto increase the global use of the spectrum resources. FCC has been alreadyopening the door for several years, in the TV broadcasting bands [6], andpermits to secondary users (e.g. not licensed) to occupy primary users spec-trum when available. Most of them indeed are not used in time, space andfrequency. This is current commercial state-of-the-art of CR.
More futuristic CR scenarios may also be considered concerning the spec-trum management. We may even imagine in the very long term a fully dereg-ulated spectrum access where all radio connections features would be definedon-the-fly: carrier frequency, modulation, data rate, coding scheme, etc. Butthis means also to overcome regulatory issues in addition to technologicalchallenges.
1.2. Cognitive Radio Equipment
We can derive from the considerations of previous paragraph what shoulda CR equipment be made of. This is exposed in Figure 3 which schemat-ically represents a CR equipment. The SDR system sub-part is composed
1
stimuli orders
smartsub-system
analysis
learningdecision
SDR communication sub-system
adaptingmeans…
Application layer
Multiple physical layersMultiple physical layersMultiple physical layers
sensingmeans
user
hardware
network environment
electro-magneticenvironment
Figure 1 – Cognitive radio equipment functional block diagram
The SDR system sub-part (in blue) is composed of multiple radio protocol stacks (from the physical to
the application layer) executed in a flexible hardware (and corresponding necessary software) platform.
Let us just stress that it should include in particular a reconfiguration management software
architecture. As explained in Erreur ! Source du renvoi introuvable., to make a SDR become a CR,
two main parts are to be added: sensing means and a smart sub-system. Sensors in our mind are the
combination of electronic devices and algorithms that translate the signals into metrics of interest. For
instance we may consider a standard recognition sensor is composed of a RF front-end and a set of
processing functions that extract the metric of presence or absence of a set of standards. This will be
detailed in the CR scenario of part 5. This information feeds the smart or cognitive engine of the CR
equipment that takes decisions accordingly. This means that reconfiguration may be done to adapt the
behavior of the equipment to the situation revealed by the sensors of the equipment, or sent by the
network, or both of them.
Four categories of sensing information worth to be taken into account are given in Figure 1:
− electromagnetic environment: spectrum occupancy, Signal to Noise Ratio (SNR), multi-paths
propagation, etc.
− hardware environment: battery level, power consumption, processors using rate, FPGAs gates
occupation, etc.
− network environment: telecommunication standards (GSM, UMTS, WiFi, etc.), operators and
services available in the vicinity, traffic load on a link, etc.
− user-related environment: position, speed, time of day; user preferences, user profile (access
rights, contract, etc.), video and audio sensor (presence detection, voice recognition), etc.
1. References
[1] J. Mitola, “Cognitive Radio: An Integrated Agent Architecture for Software Defined Radio”,
Ph.D. dissertation, Royal Inst. of Tech., Sweden, May 2000
[2] J Mitola, “The Software Radio”, IEEE National Telesystems Conference , 1992 - Digital Object
Identifier 10.1109/NTC.1992.267870
[3] F. K. Jondral, “Software-Defined Radio-Basics and Evolution to Cognitive Radio”, EURASIP
Journal on Wireless Communications and Networking 2005:3, 275-283
Figure 3: Cognitive radio equipment functional block diagram
4

of multiple radio protocol stacks (from the physical to the application layer)executed in a flexible hardware (and corresponding necessary software) plat-form. Let us just stress that it should include in particular a reconfigurationmanagement software architecture. To make a SDR become a CR, two mainparts are to be added: sensing means and a smart sub-system. Sensorsin our mind are the combination of electronic devices and algorithms thattranslate the signals into metrics of interest. For instance we may considera standard recognition sensor is composed of a RF front-end and a set ofprocessing functions that extract the metric of presence or absence of a setof standards. This information feeds the smart or cognitive engine of the CRequipment that takes decisions accordingly. This means that reconfigurationmay be done to adapt the behavior of the equipment to the situation revealedby the sensors of the equipment, or sent by the network, or both of them.Four categories of sensing information worth to be taken into account aregiven in Figure 3 :
• electromagnetic environment: spectrum occupancy, Signal to Noise Ra-tio (SNR), multi-paths propagation, etc.
• hardware environment: battery level, power consumption, processorsusing rate, FPGAs gates occupation, etc.
• network environment: telecommunication standards (GSM, UMTS,WiFi, etc.), operators and services available in the vicinity, traffic loadon a link, etc.
• user-related environment: position, speed, time of day; user prefer-ences, user profile (access rights, contract, etc.), video and audio sensor(presence detection, voice recognition), etc.
The paper is organized as follows. In section 2, a definition and a presen-tation of the concept of SRB are provided. To understand the concept ofthe radio bubble, Section 2.2 gives two analogies. Sections 3, 4 and 5present the sensors according to the 3 layer of the simplified model of Fig-ure 2. Finally section 6 addresses the conclusions and future evolution ofSRB concept.
5

2. The ”sensorial radio bubble” for cognitive radio equipment
2.1. Generalities and Definition
Having in mind the ”‘Human bubble”’ (see section 2.2.1), the SRB is amulti-dimensional space around a CR equipment, with one dimension for eachsensing capability, exactly as the human sensorial bubble gives informationto a person of its surrounding environment thanks to the five human senses.We extend, with this SRB concept, the well-known human or animals bubblesto inanimate objects like a CR equipment. From this point of view, this workbelongs to the bio-inspired systems domain.Each dimension (sensor) can be represented with several parameters (suchas temperature and time for a thermometer).Therefore associated with eachsensor Si exists a vector of parameters defined as Vi = [P i
0, ..., Pij , ..., P
iJ−1] for
i = 0, ..., N − 1 and j = 0, ..., J − 1 where N is the total number of sensorsand J the number of parameters of the i th sensor. It may happen that Vicontains only one parameter P i
0. One of these parameters may be a rangefor particular sensors, as the sight distance parameter is a range for the sightsensor.
The SRB provides sensing information to the CR engine ( decide func-tion). It will be the responsibility of a CR equipment to be aware andinteract with all the pertinent information available in the area that can helpthe equipment to match its functionality to the global state of its environ-ment. Considering the cognitive cycle, SRB is situated in the Observe stepas illustrated in Figure 1. The SRB uses all the 3 layers already defined inFigure 2 (from PHY to application layer) to explore the environment of theequipment. Section 3, 4 and 5 describe it in detail. As it will be illustrated insections 4 and 5 it could happen that a sensor of one layer uses informationproviding by sensors of another layer.
Moreover, this work addresses the issue of a double mobility:
• A classical mobility associated with the horizontal handover, in space.The spatial representation of the information given by the SRB willbe the result of the combination of all spatial parameters of a sub-setof sensors, and is given through the information provided for instanceby the positioning sensor for the SRB center, the Direction Of Arrivalsensor for the position of the Base Station,...
6

• A spectrum mobility associated with the vertical handover, in fre-quency. By the same way the spectrum representation of the infor-mation given by the SRB will be the result of the combination of allspectrum parameters of a sub-set of sensors. It may be given throughthe carrier frequency sensor, the channel bandwidth sensor, the stan-dards recognition sensor, etc.
We suggested in [13] to map these two mobilities on two different maps,in order to illustrate and validate our concept of the SRB:
• One is the classical spatial map, which already exists, and in which theequipment is moving.
• We proposed to add a new one: the spectrum map. It contains allthe environment information given by the corresponding sensors of theSRB. The way to build this map is described in [13].
These two maps permit to build a model of the CR equipment environmentin order to predict its future states. The aim of this model is to applyon it some rules of the ”human bubble” when the human is moving in itsown environment and then to derive CR equipment behavior rules when CRequipment is moving in space and in spectrum. The goal of the SRB isto permit the terminal to safely transmit and receive its communications,taking into account overall environment given by the SRB. That is why wealso introduce the notion of a ”safety bubble”. The word ”safety” here meansthat the equipment can ensure the integrity of the transmitted and receivedinformation.
How to use this mapping and the resulting model is not discussed in thispaper and is still under consideration.
2.2. Analogies
In order to simply expose our concept, we use two analogies. The firstand the most important one is the well known psychological and physiologicalhuman bubble. The second analogy addresses the human bubble within acar. A spectrum map is defined as a road map, therefore we can translaterules from the latter to the spectrum approach with the objective to securetransmissions the same way as motorists on the road. We already proposed in[13] a traffic code analogy. A close analogy was proposed also in [14]. It hasto be stressed that this new spectrum map evolves as soon as the equipment
7
is moving in the spatial map. So as to better explain this approach, wepropose in the following to describe two analogies at the origin of the SRBconcept.
2.2.1. The ”human bubble” analogy
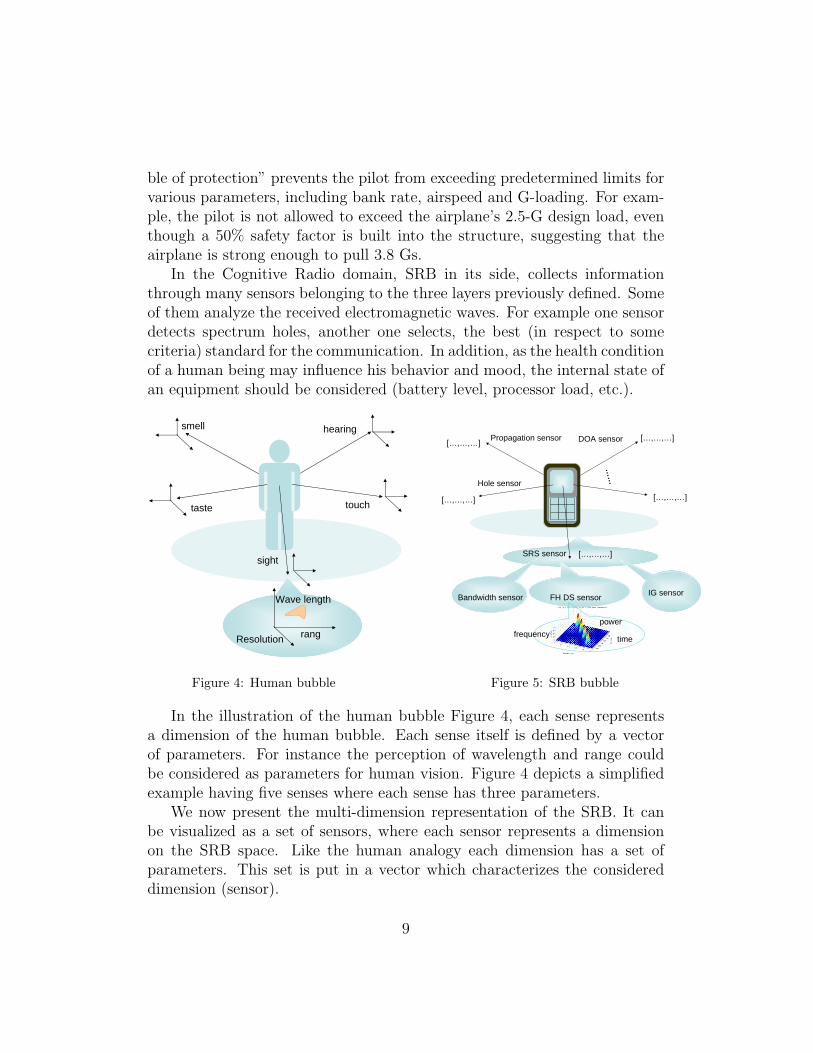
The well-known physiological and psychological ”human bubble” is a vir-tual space, whose dimensions are given thanks to the human senses. A per-son knows all information inside his bubble and consequently has a feelingof safety and comfort. In fact, a lot of common expressions use this concept( at least in French) like to be safe in his bubble, to be well in his bubble or,when a person has some social relationship trouble, it is said to be lockedin its bubble... It is partly given by the five human senses. The range ina specific dimension is directly dependent on the limitations of the physicalsenses. For example, human eyes are said to be capable of detecting a rangeof frequencies between 400 to 700 nm. If frequencies outside this spectrumrange are undetectable by humans, it is not the case for some animals. Asanother example to illustrate this parameter, consider the hearing dimen-sion, it is obvious that this range in the dog bubble will be greater than theone of the human bubble. The safety and comfort impression in a humanbeing bubble is different the night and the day, mainly because the rangeparameter of the vision dimension is different.
This concept is widely used mainly by the Health and Social domains butalso by industry.The human bubble is clearly a concept connected to Health (mainly psy-chological area). An example could be the Multi-sensory Room for use bystudents for Learning Disability nursing courses [15]. The room is designedas a multi sensory area usually utilised by people with Learning Disabilityand others as a form of sensory stimulation to promote relaxation, or stim-ulation and can be used in conjunction with other therapeutic approachessuch as aromatherapy etc.
The room consists of lights, fibre optics, projections, bubble tubes, soundequipment and vibrating equipment that can be operated in a number ofways, to promote stimulation of all senses. Programmes need to be carefullythought out and designed for individuals with specific needs.
Concerning the industry use of the human Bubble concept, the ”‘Flysafety bubble”’for safety in avionics seems to be a good example. This ”bub-
8
ble of protection” prevents the pilot from exceeding predetermined limits forvarious parameters, including bank rate, airspeed and G-loading. For exam-ple, the pilot is not allowed to exceed the airplane’s 2.5-G design load, eventhough a 50% safety factor is built into the structure, suggesting that theairplane is strong enough to pull 3.8 Gs.
In the Cognitive Radio domain, SRB in its side, collects informationthrough many sensors belonging to the three layers previously defined. Someof them analyze the received electromagnetic waves. For example one sensordetects spectrum holes, another one selects, the best (in respect to somecriteria) standard for the communication. In addition, as the health conditionof a human being may influence his behavior and mood, the internal state ofan equipment should be considered (battery level, processor load, etc.).
smell
touch
sight
taste
hearing
Resolution
Wave length
rang
Figure 4: Human bubble
1
SRS sensor
Hole sensor
DOA sensorPropagation sensor
……
frequencypower
Bandwidth sensor FH DS sensor
time
IG sensor
[…,…,…][…,…,…]
[…,…,…] […,…,…]
[…,…,…]
Figure 5: SRB bubble
In the illustration of the human bubble Figure 4, each sense representsa dimension of the human bubble. Each sense itself is defined by a vectorof parameters. For instance the perception of wavelength and range couldbe considered as parameters for human vision. Figure 4 depicts a simplifiedexample having five senses where each sense has three parameters.
We now present the multi-dimension representation of the SRB. It canbe visualized as a set of sensors, where each sensor represents a dimensionon the SRB space. Like the human analogy each dimension has a set ofparameters. This set is put in a vector which characterizes the considereddimension (sensor).
9

As already said, it could happen that a sensor of one layer uses informationproviding by sensors of another layer. It is the case, for instance, with theStandard Recognition sensor (SRS) which belongs to the intermediate layerand uses sensors of the physical layer to synthesize the information. Anexample is given in Figure 5 where we depict the Standard Recognition Sensor(SRS). The SRS itself uses three sensors of the physical layer. The spreadingtechnique FH-DS discrimination sensor, which is one of the sensors of thephysical layer used by the SRS, has 3 parameters: time, frequency and energy.
In the human analogy, human beings have information about the envi-ronment (light, sound, etc.). The range parameter of a dimension of thehuman bubble represents the point where he does not have any informationabout the environment. The range of a specific dimension (sense) can changeaccording the environment. For example the range parameter of the visiondimension can decrease when it is foggy. On the other hand human beingscan focus on a specific sense to increase its range parameter. In fact, every-body did the experience to be hardly concentrated on a specific sense andthen success to increase the range parameter of the considered dimension (forexample to be concentrated on the hearing sense permits to hear far soundsand to take conscious of their existence). The range parameter of a dimen-sion of the SRB can also change according to the environment (obstacles,interferences, etc.) The bubble can focus also on one sensor to increase itsrange parameter. This focus could be reached thanks to Signal Processingtechniques for example.
2.2.2. The ”vehicle” analogy
For the second analogy we take into account is the ”vehicle bubble” anal-ogy. This is clearly an extension of the ”human bubble” to the car situationin the traffic. Now the virtual sphere is around the car and moves with thecar. The car driver should know everything within its bubble, and under-stand all the information inside the bubble. This bubble information is giventhanks to the human driver senses with the help of:
• Signs of other cars and road infrastructure,
• Rules known and respected by everybody,
• Anticipation, prediction, thanks to previous experiences.
Let us continue our analogy with the following example:
10

• The aim of a car driver is to go from one point to a destination withoutaccident with respect to some constraints (time, number of kilometers,price, etc.), thanks to its ”bubble” all along the trip.
• The aim of a CR equipment is to send its information to the rightrecipient without accident (good QoS) with respect to some constraints(time, throughput, price, etc.), thanks to its ”bubble” as well.
2.3. Information exchange between the ”bubbles”
As already explained, the SRB perception will be limited by the sensorcapability.The range parameter of a dimension of the SRB can also change ac-cording to the environment (obstacles, interferences, etc.) The consequenceis that, to better know the environment and to avoid problems as for ex-ample the hidden nodes problem in the holes detection sensor, the bubblesshould exchange information and therefore communicate. The ”Sunny Day”example: ”‘Person A is in a home with no windows. Person B resides inthe same city as A, and is in a home that has windows. A telephones B andasks, ”‘Is today a sunny day?” How B does arrive at an answer to this ques-tion ? B will probably rely on his physical senses to provide data about hissurroundings. In this example, vision will be an important physical sense, asB will probably look out a window to evaluate the amount of sunlight outside.B will also utilize his brain to perform the thought-computations necessaryto determine an answer. Those thought-computations will be unique to thesituation because B is in a particular place, at a particular time, workingwith a particular set of cognitive capabilities and available information.”’ ex-plained in [16] in the context of human bubble could be simply transpose inour CR context. That means the communication between the bubbles willextend the environment knowing of the CR equipment, and give access toinformation unavailable at a particular location, at a particular time to theCR equipment (like the hidden nodes example). Because the bubbles arerunning on SWR technology, they should have all the technological meansto establish a radio communication, with the adapted standard to the cur-rent situation (distance between them, state of their spectrum maps,...) Thiscommunication aspects between the bubbles will be described in details in afurther paper.
2.4. The sensors of the SRB
We show that the word sensor it used in its broad sense. It representsall means that can give information of the environment. It could be either
11
a classical sensor (microphone, etc.) or it could be a smart sensor based onadvanced signal processing. We classify the sensors in regards to the layermodel we gave in section 1 so that we speak about multilayer sensors. Wesimply recall here this classification obtained with this model.
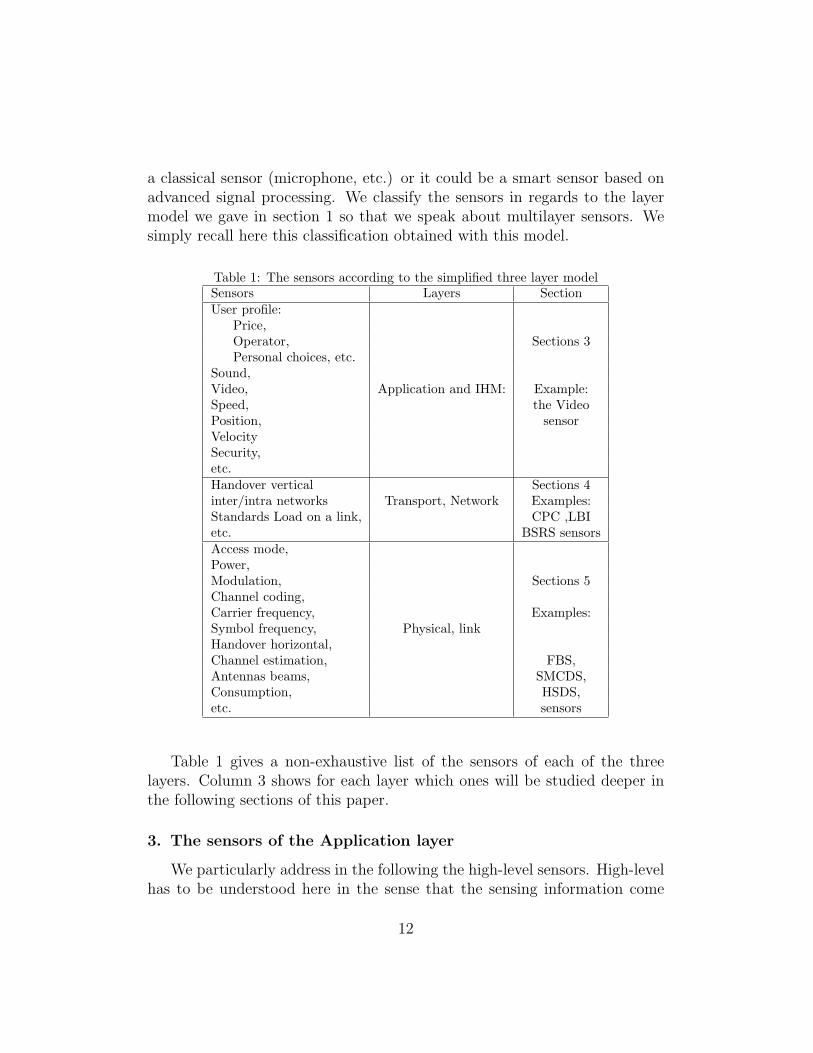
Table 1: The sensors according to the simplified three layer modelSensors Layers SectionUser profile:
Price,Operator, Sections 3Personal choices, etc.
Sound,Video, Application and IHM: Example:Speed, the VideoPosition, sensorVelocitySecurity,etc.Handover vertical Sections 4inter/intra networks Transport, Network Examples:Standards Load on a link, CPC ,LBIetc. BSRS sensorsAccess mode,Power,Modulation, Sections 5Channel coding,Carrier frequency, Examples:Symbol frequency, Physical, linkHandover horizontal,Channel estimation, FBS,Antennas beams, SMCDS,Consumption, HSDS,etc. sensors
Table 1 gives a non-exhaustive list of the sensors of each of the threelayers. Column 3 shows for each layer which ones will be studied deeper inthe following sections of this paper.
3. The sensors of the Application layer
We particularly address in the following the high-level sensors. High-levelhas to be understood here in the sense that the sensing information come
12
from the higher layers of the system. From our model, we deduce that itis mandatory to adapt the equipment to the user’s needs, user’s behaviors.In this context we have to detect its presence, to identify him to analyze itsbehavior and finally to interact with him. The less invasive sensor for thattype of purposes is the video sensor. It is now possible to detect, in real time,faces in video sequences. In this section two scenarii using video sensor aredescribed. The first one is the military Mitola’s scenario whereas the secondone is more throughput oriented for telecommunications networks. To beable to perform this second scenario, an efficient face characteristics pointsalignment is needed. A solution based on AAM techniques is described inthe same section.
.
3.1. Mitola’s scenario
In one of his papers, J.Mitola [3] described a scenario which involves a lotof application layer sensors, and particularly the video sensor. This scenariois a military scenario in which after an accident the video sensor should rec-ognize its new holder and act in consequence:First the CPDA (for Cognitive PDA) should sense the environment: ”‘Themilitary CPDA continuously processes acoustics, video, accelerometer,RF,and other signals from the environment, continuously attributing the signalsto ontological objects such as the self, the user,the users home (e.g. quarters,bivouac location), the users host vehicle (e.g. HMWWV, tank), other knownstructures and vehicles, and geospatial reference points (e.g. highways, land-marks).”Then an accident occurs and the CPDA is ejected from the vehicle: ”‘theCPDA recognizes the change in shock and vibration signature between theHMWWV ride (relatively high vibration with occasional shock and intermit-tent GPS coverage) and the exit from the vehicle (e.g. relatively high accelera-tion followed by zero-shock/vibration high-speed movement, possibly tumbling,followed by the shock, tumbling of landing). Associated with the shock/ vibra-tion profile of the ride, ejection, and landing would be related images, sounds,and RF signatures, such as relatively high RF power from the vehicles radiowhen aboard.”At the end of the scenario, the CPDA should recognize its new holder andundertake appropriate behavior: ”‘This might include, for example, a call forhelp via reliable low data rate RF, such as HF. It might then go into a powerconservation mode to maximize its probability of resuming its mission once
13

recovered. If subsequently picked up by hand, the CPDA could compute thefacial features and speech parameters of its new holder to determine whetherit has been recovered or may be in the possession of coalition or hostile forces.The CPDA might be able to protect its internal data in stages, preserving asmuch of the data as possible in case it is returned to its rightful owner.”’
3.2. Radio link adaptation with video compression changes scenario
This scenario consists basically in using application layer information totake decisions of modification of the radio configuration. The new object-oriented algorithms for video compression are able to generate a variabledata stream over the time in terms of data throughput (ratio from one totwenty). A video stream representing a tennis player with the audience inthe background for instance, may be divided in two objects: the audienceand the tennis court on the one hand for the background of the image, andthe tennis player himself on the other hand. This permits to transmit onlyfrom time to time the background of the picture, which is very demandingin terms of data throughput otherwise, while the tennis player is frequentlyrefreshed, demanding a low throughput at each time. Consequently, thesavings in terms of data to transmit is very significant. Cognitive radio aimsat defining and transmitting the optimal radio link for each situation. Thisrequires in particular to take into account permanently the parameters ofthe algorithms of the video compression in order to reconfigure the radiolink. This can go from changes of parameters of the modulation inside astandard, up to a complete waveform reconfiguration. The suggested scenarioillustrates the adaptation of the radio link according to the compression ofthe source in a video-telephony context. A person switches-on his terminalin order to engage an audio-video conversation with another person. At thebeginning of the communication, the face of the speaker and the backgroundof the image are transmitted using a traditional compression mode. Thisrequires a relatively high data-rate. Over the time, a model of the person’sface is generated at the transmitter’s side, and sent to the receiver. Once thismodel is understood by the receiver, the transmitted parameters of the face’smodel (orientation, opening of the mouth, of the eyes, direction of the glance)are enough to reproduce the face behaviour at the receiver. This permitsto save the data amount required to transmit the face of the speaker, byreducing very significantly the data to be transmitted through the air. Thispermits to move the video transmission from higher date rate and powerconsuming radio standards, such as UMTS or WiFi, towards low data rate
14
standards such as GSM, thus enabling spectrum savings as well as batterysavings. The standard vertical handovers are performed thanks to dynamicreconfigurations of the radio link. The use of such video processing facilitiesin a CR context is detailed in [4]. All the applications which will use videosensor, like face detection and face analysis in the previous scenario need thatall the face characteristics points (nose, eyes, mouse, etc.) are well identifiedand well aligned. This is still today a very big technical challenge, specificallywhen the user is moving and when the scene illumination is variable. Onepossible answer for that challenge is the used of Active Appearance Model(AAM). AAM and its improvement are described below.
3.2.1. Active Appearance Model
Active Appearance Model has been proposed by Edwards, Cootes et Tay-lor [18]. They offer the possibility to jointly syntethize a form and a texturewith three Principal Component Analysis PCA. With a data base of objectsexamples to be modellized we apply an PCA on all the forms and then an-other PCA on the textures normalized with the average form. We obtain twovectors of form and texture appearance. Then with a third PCA on thesevectors we obtain a appearance vector which represents the model. Anymodification of this vector permits to obtain new forms and textures of theconsidered object. When the model receives a new unknow image we put thesynthesize model on it and we modify iteratively (using regression matricesor simplex [19]) the appearance vector in order to decrease the error betweenthe model and the unknown object. Thus, after some iterations the AAMmodel converges and the model is exactly aligned on the unknown object.
3.2.2. Active Appearance Model Improvement
These models are very promising but not yet sufficiently robust againstluminosity variations. A promising solution to tackle this difficulty has beenproposed in [17]. This work consists in making them more robust in realconditions. It proposes a specific robust pretreatment to lighting variationsfor deformable models methods. It consists in replacing AAM input tex-tures by oriented maps (Figure 6(f)) extracted from the original textures(Figure 6(a)) specifically equalized on which the orientation of each pixel isevaluated (Figure 6(b)), maped between 0 and Π/2 (Figure 6(c)) and mod-ulated by the gradient (Figure 6(d)) of the image. In addition, an adaptedmetric to evaluate those new textures during the AAM convergence is used.Authors illustrate their proposal with test on the BioId data base with ”nor-
15
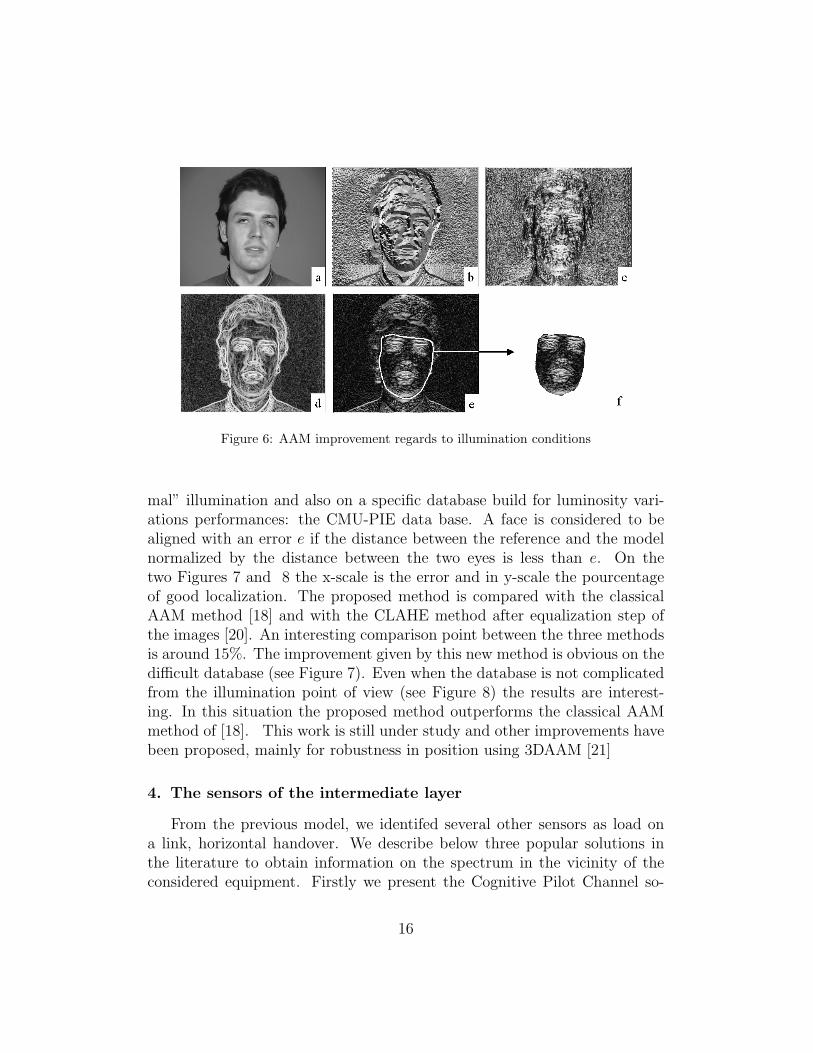
Figure 6: AAM improvement regards to illumination conditions
mal” illumination and also on a specific database build for luminosity vari-ations performances: the CMU-PIE data base. A face is considered to bealigned with an error e if the distance between the reference and the modelnormalized by the distance between the two eyes is less than e. On thetwo Figures 7 and 8 the x-scale is the error and in y-scale the pourcentageof good localization. The proposed method is compared with the classicalAAM method [18] and with the CLAHE method after equalization step ofthe images [20]. An interesting comparison point between the three methodsis around 15%. The improvement given by this new method is obvious on thedifficult database (see Figure 7). Even when the database is not complicatedfrom the illumination point of view (see Figure 8) the results are interest-ing. In this situation the proposed method outperforms the classical AAMmethod of [18]. This work is still under study and other improvements havebeen proposed, mainly for robustness in position using 3DAAM [21]
4. The sensors of the intermediate layer
From the previous model, we identifed several other sensors as load ona link, horizontal handover. We describe below three popular solutions inthe literature to obtain information on the spectrum in the vicinity of theconsidered equipment. Firstly we present the Cognitive Pilot Channel so-
16
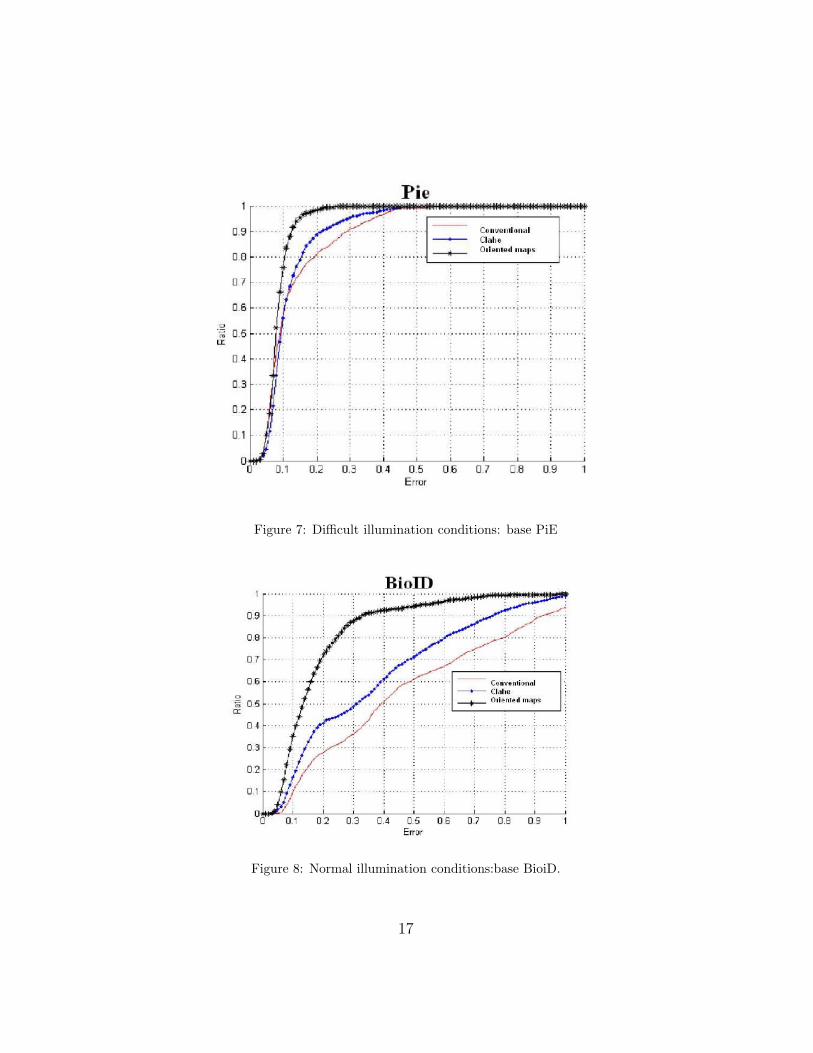
Figure 7: Difficult illumination conditions: base PiE
Figure 8: Normal illumination conditions:base BioiD.
17
lution then another solution based on geo-localization and thirdly the blindstandard recognition. The latest is in our point of view the most promisingregarding several criteria and this will be illustrated with a comparison. Itwill be described in detail below. This sensor is very interesting for under-standing the X-layer sensor approach. In fact it uses several sensors fromthe lower layer (physical layer) as bandwidth, access type, modulation typesensors.
4.1. The Cognitive Pilot Channel
The CPC (Cognitive Pilot Channel) is a recent concept issued from theCognitive Radio (CR) domain. It is mainly studied within the framework ofthe IST European project E2R. It has been published in [23], [24]and [25].It has also been proposed to the standardization bodies. The concept is aparticular radio channel in which the CR equipment can find information suchas frequency band allocation, Radio Access Technologies (RAT), operatorsetc.This way to find the RAT thanks to the CPC offers several advantages:
• The connection time to a network could be very short.
• Reduce the computation time
• Consequently reduce the consumption.
• It should facilitate spectrum management like DSA/FSM.
The main drawbacks are:
• Find a common frequency (or frequency band) for all countries and allregions in the ITU sense. For people who know the difficulty of bandallocation during WARC1, this seems a very hard challenge.
• Operators should accept to share information, which today is oftenhidden for business reasons.
1WARC= World Administrative Radio Conference
18

4.2. Spectrum knowledge thanks to positioning function: the LocalizationBased Identification method (LBI)
This very simple solution has been published several years ago (usingGPS for localization purpose)[26]. The assumption is: ”At each locationand at each time there is a predefined set of known standards”. Thereforeknowing this information and knowing the location we know the standardsavailable in the vicinity of the CR equipment. Four types of coverage aredefined in order to fill the table. Each standard of the previous assumptionhas a particular type of coverage. This knowledge linked to a loaded database(reconfigurable by downloading) and possibly controlled by the user rightsallows the adequate system to be selected.
4.2.1. System description
We briefly here describe the system. More details could be found inreference [26]. The technique proposed would allow the standard to be auto-matically researched by the terminal without user intervention. A study ofthe parameters of all the systems currently available allowed to identify thefrequency plan in a precise geographic location, as a discriminant parameter.We therefore propose to insert a GPS function into multistandard terminalsin order to determine the geographic location. This knowledge eventuallyalso linked to user’s rights allows the selection of an adequate system from aloaded database. This could be re-configured by download.
4.2.2. Types of coverage
Four types of coverage are defined according to their area of use as de-scribed in Figure 9.
1. The first is worldwide and does not usually require GPS localisation.It should be stated that there are always exceptions. The followingstandards are part of this group: UMTS, Globalstar, S-UMTS.
2. Coverage by region (in the ITU sense) or by continent. This type ofcoverage is relatively easy to manage. The lines follow the time zones.Once again there are exceptions which can complicate handling. Withregards to this we have GSM, IS95, PDC and DAB systems etc.
3. Regional or national coverage. Boundary management is necessary.This is the main difficulty in the managing the database. We havesystems such as DVB-T, radio FM
19
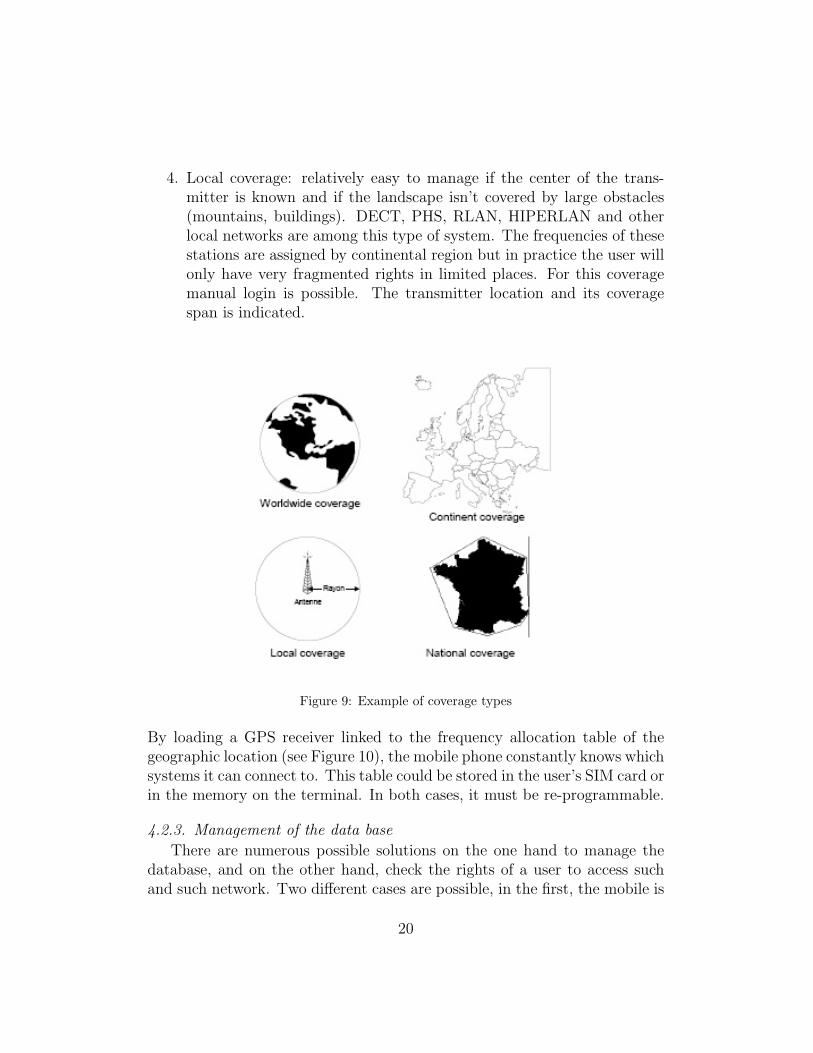
4. Local coverage: relatively easy to manage if the center of the trans-mitter is known and if the landscape isn’t covered by large obstacles(mountains, buildings). DECT, PHS, RLAN, HIPERLAN and otherlocal networks are among this type of system. The frequencies of thesestations are assigned by continental region but in practice the user willonly have very fragmented rights in limited places. For this coveragemanual login is possible. The transmitter location and its coveragespan is indicated.
Figure 9: Example of coverage types
By loading a GPS receiver linked to the frequency allocation table of thegeographic location (see Figure 10), the mobile phone constantly knows whichsystems it can connect to. This table could be stored in the user’s SIM card orin the memory on the terminal. In both cases, it must be re-programmable.
4.2.3. Management of the data base
There are numerous possible solutions on the one hand to manage thedatabase, and on the other hand, check the rights of a user to access suchand such network. Two different cases are possible, in the first, the mobile is
20
free to choose the operator and therefore play on the competition. Thoughin the second, it is confined to its own provider or those with which it hasagreements. Both ideas clash with those of the operator which favours itsown network, and the user, who, according to their own cost or performancecriteria, would like the widest choice possible. Updating the database can bedone in four ways:
• Over The Air Reconfiguration.
• Downloading using the SIM (Subscriber Identification Module) module.
• Downloading trough classical network (internet) before traveling.
• Manual reconfiguration in case unidentified. Manual configuration isuseful in order to allow modifications in unforeseen circumstances.
These four possibilities are illustrated in Figure 11. This is clearly the mostdifficult point of this system. The question is: How big should be the database? Coverage management is definitely the crucial point of the system.The optimisation of the management method and the database size are atthe root of the problem to be resolved. The system cartography must takethe least space possible in the database. This should not be a problem asthis is something obtained classically in GPS devices.
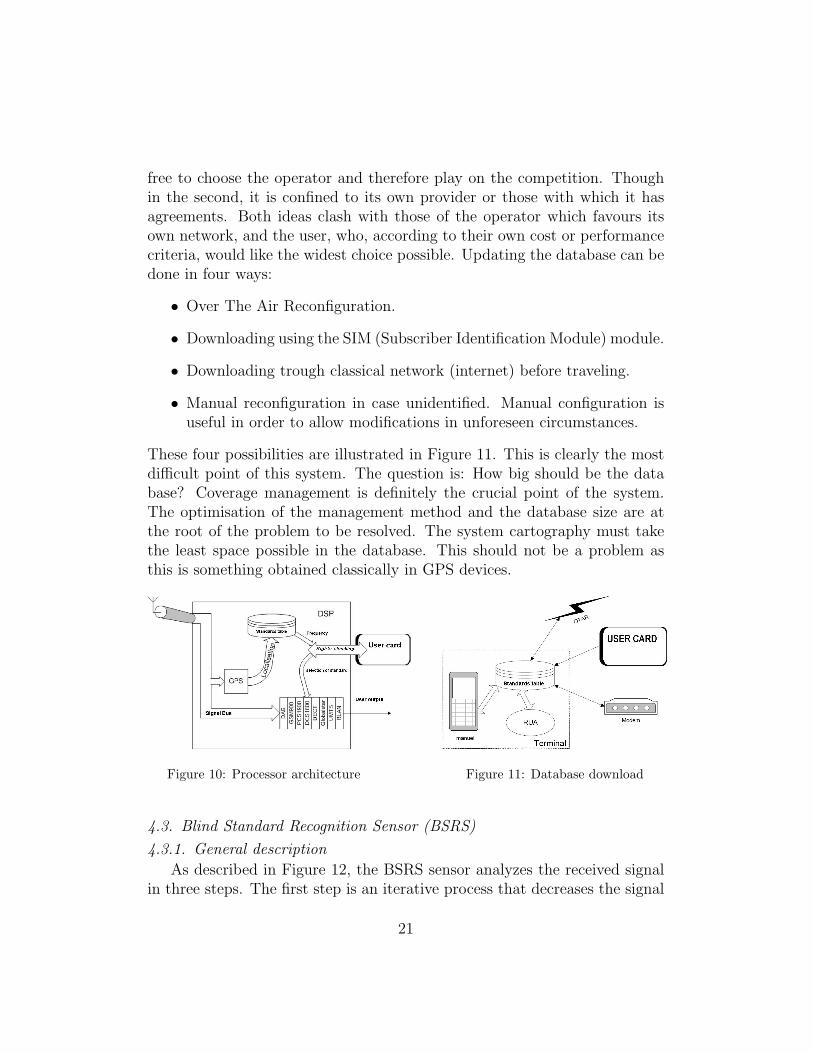
Figure 10: Processor architecture Figure 11: Database download
4.3. Blind Standard Recognition Sensor (BSRS)
4.3.1. General description
As described in Figure 12, the BSRS sensor analyzes the received signalin three steps. The first step is an iterative process that decreases the signal
21

bandwidth to be analyzed further, so that the band of analysis is reduced tothe only non zero regions. During the second step an analysis is performedthanks to several sensors. Then during the third step, a fusion of all the in-formation given by the analysis phase is performed in order to decide whichstandard is present. During the second step, different sensors analyze the
Standard
FUSION
HoleDetection of features with Cyclostationnaritytechniques (SHDS)
IGDetection Mono/ Multi carrier with Cyclostationnarity techniques on the Guard Interval
DS/FHDetection DS / FH access mode with Time frequency analysis
BPcDSP
Couche de(J) sorties
Couche cachéede (I) RBF
1w
Iw
)( emTtx +
100 kHz
200 kHz
300 kHz
8 MHz
Prét
raite
men
t
Logi
que
de s
ortie
1y
Jy
)1(γ
)2/( TFDLγ
)0(γ ),( iCf γ
),( 1−ICf γ
),( ICf γ
),( 1Cf γ
Band adaptation
STEP 1 STEP 2 STEP 3
Detection of features with Cyclostationnaritytechniques (SFS, CFS)
CF
X(t)
1
2
4 GHz
400 MHz
40 MHz
Figure 12: The new standard recognition sensor
bands selected in step one. Many sub-sensors could be used for the recog-nition of the standard in use as: positioning of the equipment, presence ofthe telecommunication signal, detection of the carrier frequency, recognitionof the bandwidth of the received signal, recognition of the FH/DS signal,recognition of Single/Multi carrier. In our results (see below) only threesub-sensors are used for the recognition of the standards.
4.3.2. Step 1: Bandwidth adaptation
The difficulty here relies in the fact that the ratio between the globalbandwidth to be analyzed and the smallest bandwidth parameter to be rec-ognized may be very high. Therefore an iterative adaptation of the band-width to be analyzed is performed to solve it. At each iteration, the processanalyzes energy in the band with a conventional periodogram, then filtersand decimates the samples around the detected peak of energy.
22
4.3.3. Step 2: Analysis with sensors
We chose three sub-sensors to analyse and identify the received signal ac-cording with a list of predetermined standards: The bandwidth recognition,Single/Multicarrier detection and FH/DS signal detection. Other sensorscould be used to identify other parameters.
4.3.4. Step 3: Fusion
Then during the third step, a fusion of all the information given by theanalysis phase is performed in order to decide which standard is present. Atthe end of the analysis step, three indicators are obtained. The simplest wayto make the fusion is to apply some logical rules on these indicators. Thismethod could be improved by the use of a neural network (like a MultilayerPerceptron). Moreover as these indicators give information which could beweighted by a reliability factor, a future work will further explore solutionsbased on Bayesian network.
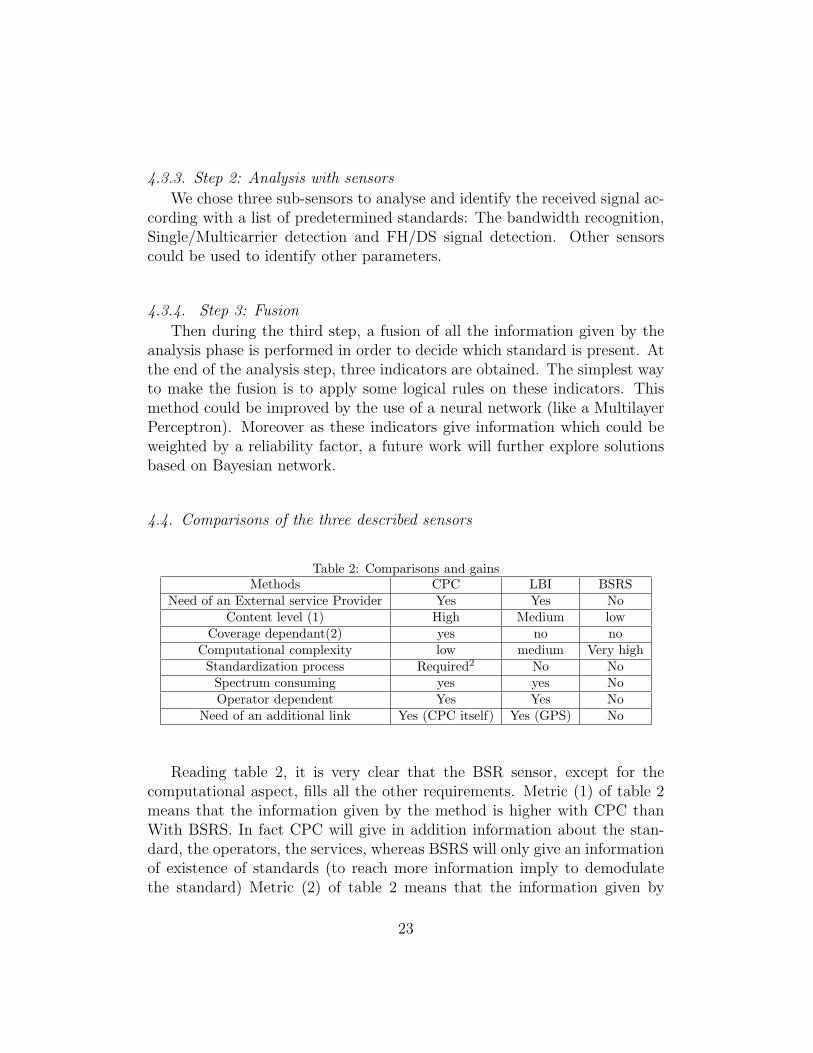
4.4. Comparisons of the three described sensors
Table 2: Comparisons and gainsMethods CPC LBI BSRS
Need of an External service Provider Yes Yes NoContent level (1) High Medium low
Coverage dependant(2) yes no noComputational complexity low medium Very highStandardization process Required2 No NoSpectrum consuming yes yes NoOperator dependent Yes Yes No
Need of an additional link Yes (CPC itself) Yes (GPS) No
Reading table 2, it is very clear that the BSR sensor, except for thecomputational aspect, fills all the other requirements. Metric (1) of table 2means that the information given by the method is higher with CPC thanWith BSRS. In fact CPC will give in addition information about the stan-dard, the operators, the services, whereas BSRS will only give an informationof existence of standards (to reach more information imply to demodulatethe standard) Metric (2) of table 2 means that the information given by
23
the method is dependent of the coverage. In fact it is difficult to imaginethat CPC gives precise information on WiFi standards in a small specificarea whereas BSRS could detect these standards as well as LBI under theassumption the data base is correctly filled.
5. The sensors of the physical layer
The starting point of CR was to optimize the spectrum resources use,considering that most of spectrum is under-used in space and in time. Spec-trum sensors are of major importance. In our model, these sensors belong tothe physical layer. We propose to describe some of them below.
5.1. Free Band Sensor (FBS)
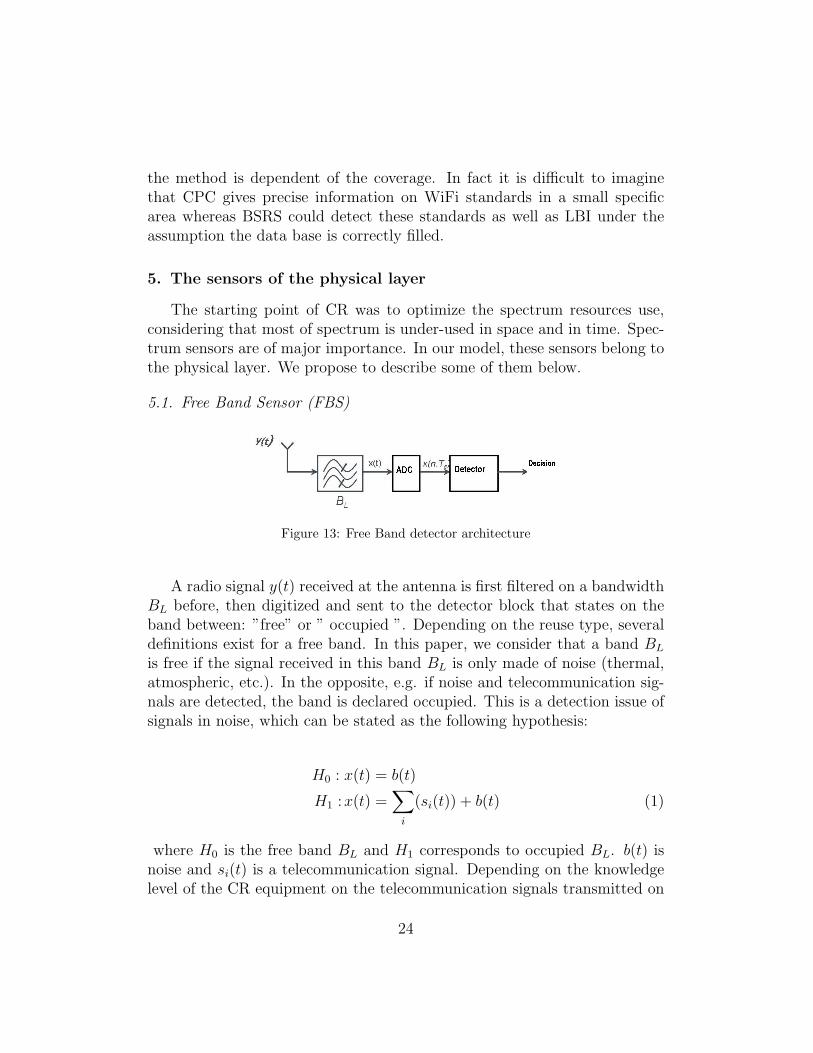
Figure 13: Free Band detector architecture
A radio signal y(t) received at the antenna is first filtered on a bandwidthBL before, then digitized and sent to the detector block that states on theband between: ”free” or ” occupied ”. Depending on the reuse type, severaldefinitions exist for a free band. In this paper, we consider that a band BL
is free if the signal received in this band BL is only made of noise (thermal,atmospheric, etc.). In the opposite, e.g. if noise and telecommunication sig-nals are detected, the band is declared occupied. This is a detection issue ofsignals in noise, which can be stated as the following hypothesis:
H0 : x(t) = b(t)
H1 :x(t) =∑i
(si(t)) + b(t) (1)
where H0 is the free band BL and H1 corresponds to occupied BL. b(t) isnoise and si(t) is a telecommunication signal. Depending on the knowledgelevel of the CR equipment on the telecommunication signals transmitted on
24
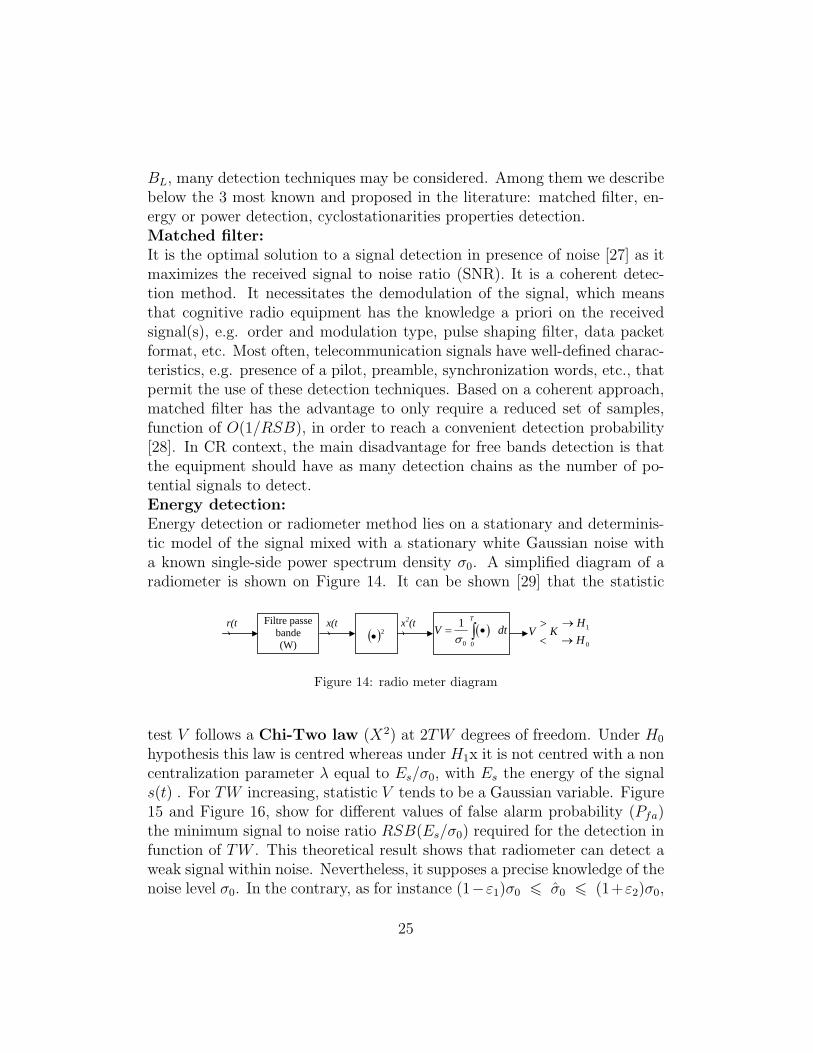
BL, many detection techniques may be considered. Among them we describebelow the 3 most known and proposed in the literature: matched filter, en-ergy or power detection, cyclostationarities properties detection.Matched filter:It is the optimal solution to a signal detection in presence of noise [27] as itmaximizes the received signal to noise ratio (SNR). It is a coherent detec-tion method. It necessitates the demodulation of the signal, which meansthat cognitive radio equipment has the knowledge a priori on the receivedsignal(s), e.g. order and modulation type, pulse shaping filter, data packetformat, etc. Most often, telecommunication signals have well-defined charac-teristics, e.g. presence of a pilot, preamble, synchronization words, etc., thatpermit the use of these detection techniques. Based on a coherent approach,matched filter has the advantage to only require a reduced set of samples,function of O(1/RSB), in order to reach a convenient detection probability[28]. In CR context, the main disadvantage for free bands detection is thatthe equipment should have as many detection chains as the number of po-tential signals to detect.Energy detection:Energy detection or radiometer method lies on a stationary and determinis-tic model of the signal mixed with a stationary white Gaussian noise witha known single-side power spectrum density σ0. A simplified diagram of aradiometer is shown on Figure 14. It can be shown [29] that the statistic
216715 NEWCOM++ DR.9.1
42/70
Energy detection:
Energy detection or radiometer method lies on a stationary and deterministic model of the signal mixed with a stationary white Gaussian noise with a known single-side power spectrum density 0σ . A simplified diagram of a radio meter is shown on Figure 18.
Figure 18 : Radio-meter block diagram It can be shown [19] that the statistic test V follows a Chi-Two law ( 2χ ) at 2TW degrees of freedom. Under 0H hypothesis this law is centred whereas under 1H it is not centred with a non centralization parameter λ equal to 0sE σ , with sE the energy of the signal ( )s t . For TW increasing, statistic V tends to be a Gaussian variable. Figure 19 and Figure 20, show for different values of faP the minimum signal to noise ratio RSB ( 0sE σ ) required for the detection in function of TW .
Figure 19 : Minimum required SNR: known noise.
Figure 20 : Minimum required SNR: unknown noise; U=3 dB.
This theoretical result shows that radiometer can detect a weak signal within noise. Nevertheless, it supposes a precise knowledge of the noise level 0σ . In the contrary, as for instance
1 0 0 2 0ˆ(1 ) (1 )ε σ σ ε σ− ≤ ≤ + , radiometer performances decrease [20] even if TW is infinitely increased, as it is shown on the theoretical curve of Figure 20. U is defined by :
210
1
110log1
U εε
⎡ ⎤+= ⎢ ⎥−⎣ ⎦
(2)
[21] and [22] give examples of statistical distribution of V when the searched signal is an amplitude modulation one or has been submitted to a Rayleigh, Rice or mutli-path channel.
Filtre passe bande (W)
r(t)
( )2• ( )
0 0
1 T
V dtσ
= •∫ x2(t)
x(t)
0
1
HH
KV→→
<>
Figure 14: radio meter diagram
test V follows a Chi-Two law (X2) at 2TW degrees of freedom. Under H0
hypothesis this law is centred whereas under H1x it is not centred with a noncentralization parameter λ equal to Es/σ0, with Es the energy of the signals(t) . For TW increasing, statistic V tends to be a Gaussian variable. Figure15 and Figure 16, show for different values of false alarm probability (Pfa)the minimum signal to noise ratio RSB(Es/σ0) required for the detection infunction of TW . This theoretical result shows that radiometer can detect aweak signal within noise. Nevertheless, it supposes a precise knowledge of thenoise level σ0. In the contrary, as for instance (1−ε1)σ0 6 σ0 6 (1+ε2)σ0,
25
216715 NEWCOM++ DR.9.1
42/70
Energy detection:
Energy detection or radiometer method lies on a stationary and deterministic model of the signal mixed with a stationary white Gaussian noise with a known single-side power spectrum density 0σ . A simplified diagram of a radio meter is shown on Figure 18.
Figure 18 : Radio-meter block diagram It can be shown [19] that the statistic test V follows a Chi-Two law ( 2χ ) at 2TW degrees of freedom. Under 0H hypothesis this law is centred whereas under 1H it is not centred with a non centralization parameter λ equal to 0sE σ , with sE the energy of the signal ( )s t . For TW increasing, statistic V tends to be a Gaussian variable. Figure 19 and Figure 20, show for different values of faP the minimum signal to noise ratio RSB ( 0sE σ ) required for the detection in function of TW .
Figure 19 : Minimum required SNR: known noise.
Figure 20 : Minimum required SNR: unknown noise; U=3 dB.
This theoretical result shows that radiometer can detect a weak signal within noise. Nevertheless, it supposes a precise knowledge of the noise level 0σ . In the contrary, as for instance
1 0 0 2 0ˆ(1 ) (1 )ε σ σ ε σ− ≤ ≤ + , radiometer performances decrease [20] even if TW is infinitely increased, as it is shown on the theoretical curve of Figure 20. U is defined by :
210
1
110log1
U εε
⎡ ⎤+= ⎢ ⎥−⎣ ⎦
(2)
[21] and [22] give examples of statistical distribution of V when the searched signal is an amplitude modulation one or has been submitted to a Rayleigh, Rice or mutli-path channel.
Filtre passe bande (W)
r(t)
( )2• ( )
0 0
1 T
V dtσ
= •∫ x2(t)
x(t)
0
1
HH
KV→→
<>
Figure 15: Minimum required SNR:known noise
216715 NEWCOM++ DR.9.1
42/70
Energy detection:
Energy detection or radiometer method lies on a stationary and deterministic model of the signal mixed with a stationary white Gaussian noise with a known single-side power spectrum density 0σ . A simplified diagram of a radio meter is shown on Figure 18.
Figure 18 : Radio-meter block diagram It can be shown [19] that the statistic test V follows a Chi-Two law ( 2χ ) at 2TW degrees of freedom. Under 0H hypothesis this law is centred whereas under 1H it is not centred with a non centralization parameter λ equal to 0sE σ , with sE the energy of the signal ( )s t . For TW increasing, statistic V tends to be a Gaussian variable. Figure 19 and Figure 20, show for different values of faP the minimum signal to noise ratio RSB ( 0sE σ ) required for the detection in function of TW .
Figure 19 : Minimum required SNR: known noise.
Figure 20 : Minimum required SNR: unknown noise; U=3 dB.
This theoretical result shows that radiometer can detect a weak signal within noise. Nevertheless, it supposes a precise knowledge of the noise level 0σ . In the contrary, as for instance
1 0 0 2 0ˆ(1 ) (1 )ε σ σ ε σ− ≤ ≤ + , radiometer performances decrease [20] even if TW is infinitely increased, as it is shown on the theoretical curve of Figure 20. U is defined by :
210
1
110log1
U εε
⎡ ⎤+= ⎢ ⎥−⎣ ⎦
(2)
[21] and [22] give examples of statistical distribution of V when the searched signal is an amplitude modulation one or has been submitted to a Rayleigh, Rice or mutli-path channel.
Filtre passe bande (W)
r(t)
( )2• ( )
0 0
1 T
V dtσ
= •∫ x2(t)
x(t)
0
1
HH
KV→→
<>
Figure 16: Minimum required SNR: un-known noise; U=3 dB
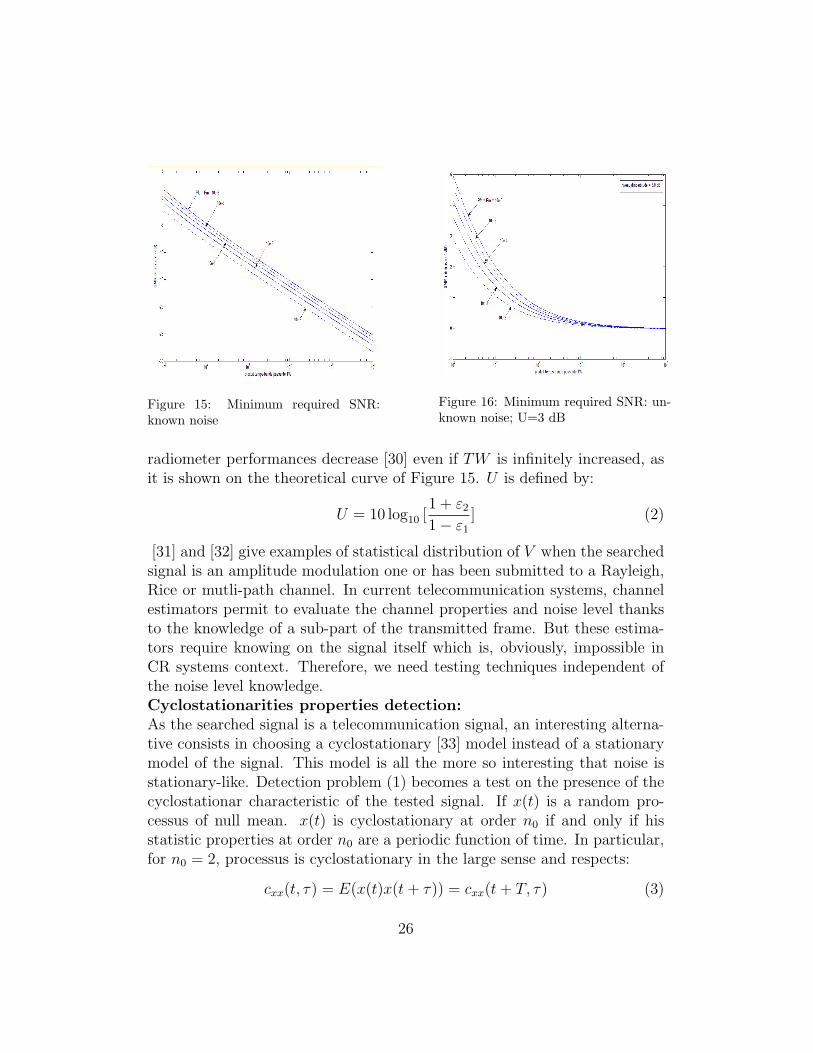
radiometer performances decrease [30] even if TW is infinitely increased, asit is shown on the theoretical curve of Figure 15. U is defined by:
U = 10 log10 [1 + ε2
1 − ε1
] (2)
[31] and [32] give examples of statistical distribution of V when the searchedsignal is an amplitude modulation one or has been submitted to a Rayleigh,Rice or mutli-path channel. In current telecommunication systems, channelestimators permit to evaluate the channel properties and noise level thanksto the knowledge of a sub-part of the transmitted frame. But these estima-tors require knowing on the signal itself which is, obviously, impossible inCR systems context. Therefore, we need testing techniques independent ofthe noise level knowledge.Cyclostationarities properties detection:As the searched signal is a telecommunication signal, an interesting alterna-tive consists in choosing a cyclostationary [33] model instead of a stationarymodel of the signal. This model is all the more so interesting that noise isstationary-like. Detection problem (1) becomes a test on the presence of thecyclostationar characteristic of the tested signal. If x(t) is a random pro-cessus of null mean. x(t) is cyclostationary at order n0 if and only if hisstatistic properties at order n0 are a periodic function of time. In particular,for n0 = 2, processus is cyclostationary in the large sense and respects:
cxx(t, τ) = E(x(t)x(t+ τ)) = cxx(t+ T, τ) (3)
26
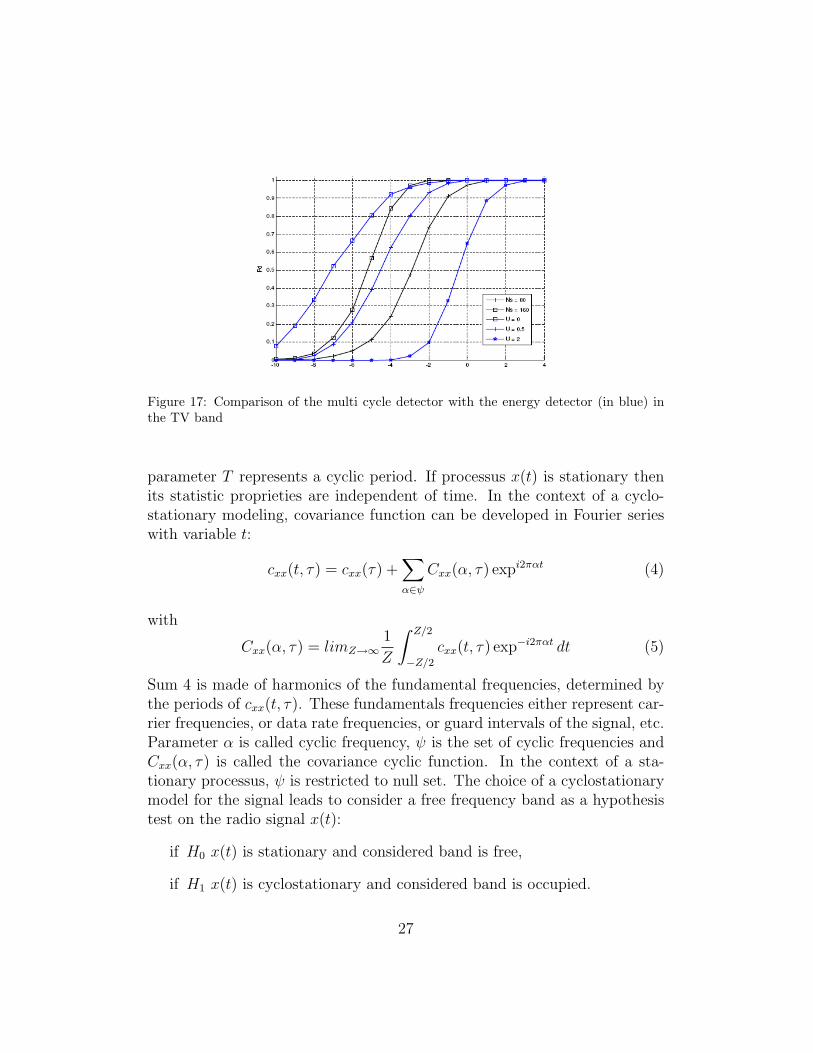
Figure 17: Comparison of the multi cycle detector with the energy detector (in blue) inthe TV band
parameter T represents a cyclic period. If processus x(t) is stationary thenits statistic proprieties are independent of time. In the context of a cyclo-stationary modeling, covariance function can be developed in Fourier serieswith variable t:
cxx(t, τ) = cxx(τ) +∑α∈ψ
Cxx(α, τ) expi2παt (4)
with
Cxx(α, τ) = limZ→∞1
Z
∫ Z/2
−Z/2cxx(t, τ) exp−i2παt dt (5)
Sum 4 is made of harmonics of the fundamental frequencies, determined bythe periods of cxx(t, τ). These fundamentals frequencies either represent car-rier frequencies, or data rate frequencies, or guard intervals of the signal, etc.Parameter α is called cyclic frequency, ψ is the set of cyclic frequencies andCxx(α, τ) is called the covariance cyclic function. In the context of a sta-tionary processus, ψ is restricted to null set. The choice of a cyclostationarymodel for the signal leads to consider a free frequency band as a hypothesistest on the radio signal x(t):
if H0 x(t) is stationary and considered band is free,
if H1 x(t) is cyclostationary and considered band is occupied.
27
This leads to a cyclostationarity test instead of a noisy signal detection. Thisleads the solution independent of noise. Several articles [33], [34], [35] andespecially [36] propose different tests on a cyclic given frequency. In [37] atest is proposed and permits to test a set of cyclic frequencies (for unfilteredsignals) enabling to improve detection performance. A convincing result from[37] is given in Figure 17.The vector of parameters of this sensor will comprise one parameter whichsay yes or no if the band is or not free. A second parameter could be thereliability of the decision H0 or H1. This second parameter could be used bythe decision making engine to improve the decisions at a higher level of theequipment.
5.2. The Bandwidth Recognition Sensor (BRS)
In [12] it was claimed that, in the frequency domain, the channel band-width (BWc) was a fully discriminant parameter. To find the bandwidth
29/09/2008 A new standard recognition sensor for cognitive radio teminal
13
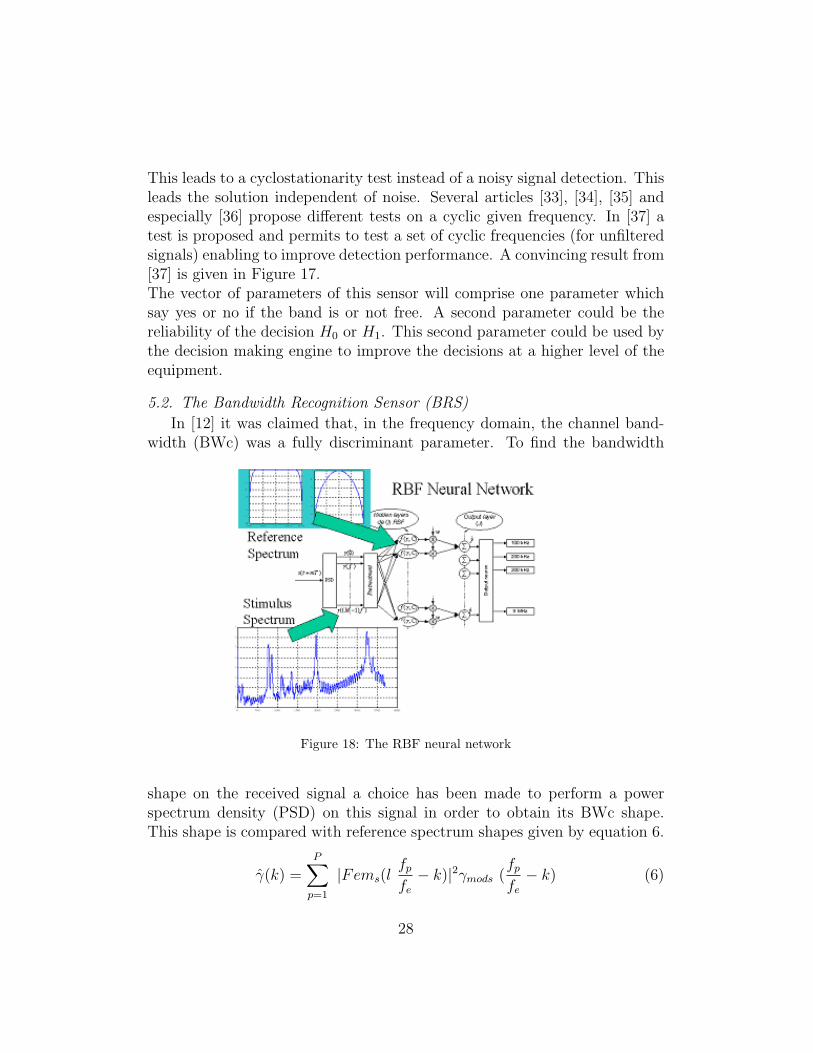
Figure 18: The RBF neural network
shape on the received signal a choice has been made to perform a powerspectrum density (PSD) on this signal in order to obtain its BWc shape.This shape is compared with reference spectrum shapes given by equation 6.
γ(k) =P∑p=1
|Fems(lfpfe
− k)|2γmods (fpfe
− k) (6)
28

With Fems the filtering shape (Nyquist Square Root, for example) of themodulated carrier P of the considered standard S and γmods the Power Spec-trum Density (PSD) of the modulation of the carrier P of the standard.This comparison is performed using Radial Basis Functional Neural Net-works (RBF NN). Using the RBF NN, the received signal PSD is comparedwith the reference signals PSD. Then a neuron will be active. To each neuronnumber i corresponds the bandwidth of the standard number i.
5.3. Single/Multi Carrier Detection Sensor (SMCDS)
The overall results presented in [12] show that the recognition rate be-tween DVB-T and LMDS on the one hand, DAB and DECT on the otherhand, is not good enough. Therefore we propose to improve this recognitionadding a new sensor that discriminates between single and multi-carriers sys-tems based on Guard Interval (GI) detection. It is well known that a GI isinserted in multi-carriers systems in order to avoid inter-symbol interference(ISI). There are several possibilities for creating this GI. The simplest andthe most usual way is to copy the end of the symbol in the GI. After the com-putation of the autocorrelation function, the cyclic frequency correspondingto the GI is derived. An example of this detection is presented in Figure 19.
29/09/2008 A new standard recognition sensor for cognitive radio teminal
15Figure 19: Detection of GI in OFDM signal (Symbol OFDM 2K, GI/Tu = 1/6)
29

5.4. FH/DS Signal Detection Sensor (FDSDS)
The results previously presented with the fusion of the two previous sen-sors are not sufficient yet. It fails in the discrimination of Bluetooth and IEEE802.11b at 2.4 GHz in FHSS mode. In this situation, the two standards co-exist at the same time in the same frequency band, so the resulting spectrumis the product of the original spectrum and consequently the previous sensordoes not run correctly. Therefore, we need to find another parameter. Forthat purpose we decide to find the spread spectrum type which is in this situ-ation a discrimating parameter. A previous study has been proposed in [22],[39],a more efficient solution has been proposed in [38]. This solution uses aChoi-William’s transform (see Figure 20 followed by a segmentation of theobtained image. Then, thanks to a appropriate criteria, which consider thelength, the starting and the duration of each segment, the obtained resultsare very promising.
Figure 20: Detection of FH access type
6. Conclusion
This paper introduces the new concept of the Sensorial Radio Bubblefor Cognitive Radio equipments, typically smart terminals. As the humansensorial bubble gives information to a person of its surrounding environ-ment thanks to the five human senses, the SRB provides to the cognitive
30
radio equipment knowledge about the equipment environment. The SRB iscomposed of sensors of all layers of the OSI model. We simplified the OSIdecomposition in 3 layers and gave an example of sensor for each of the 3proposed layers: physical, intermediate and application layers. The SRB isa multilayer view of the sensing for cognitive radio, beyond the usual viewwhich is often limited to spectrum issues. The SRB is the ”observe” sub-part of the cognitve cycle and provides the cognitive engine of a cognitiveradio equipment with all the necessary information to take reconfigurationdecisions of the radio chain so that the equipment better runs. Moreover,by analogy to the human sensorial bubble, we also beleive this will permitthe cognitive radio equipment to plan his behavior in order to predict andanticipate its reaction to environment evolution. This is the scope of someof our next working items in the field of decision taking for cognitive radio.In that sense, based on our previous work on reconfiguration management,this will permit to have a global view of the cognitive cycle: sense, decide,adapt.
References
[1] J. Mitola, ”Cognitive Radio: An Integrated Agent Architecture for Software DefinedRadio”, Ph.D. dissertation, Royal Inst. of Tech., Sweden, May 2000.
[2] J. Mitola, G. Maguire, ”Cognitive radio: making software radios more personal, IEEEPersonal Communications”, Vol. 6, No. 4. (1999), pp. 13-18.
[3] J. Mitola III ”Signal Processing Technology Challenges of Cognitive Radio”, DefenseAdvanced Research Projects Agency.
[4] A. Nafkha, R. Seguier, J. Palicot, C. Moy, J.P. Delahaye, ”A Reconfigurable BaseBandTransmitter for Adaptive Image Coding”, IST Mobile and Wireless CommunicationsSummit’07, 1-5 July 2007, Budapest, Hungary.
[5] W. Fan, M. Krunz, C. Shuguang; ”Price-Based Spectrum Management in CognitiveRadio Networks”, IEEE Journal of Selected Topics in Signal Processing, Feb. 2008,Volume: 2, Issue: 1, p. 74-87.
[6] FCC about lower 700 MHz, http://wireless.fcc.gov/.
[7] G. Chen, D. Kotz, ”A Survey of Context-Aware Mobile Computing Research”, Tech-nical Report TR2000-381, Dept. of Computer Science, Dartmouth College, Nov. 2000.
[8] E. Aarts, H. Harwig, and M. Schuurmans, ”Ambient Intelligence, ”The Invisible Fu-ture””, J. Denning, ed., McGraw Hill, New York, 2001, pp. 235-250.
31

[9] X. Qiu, J. Chuang, ”Link adaptation in wireless data networks for throughput maxi-mization under retransmissions”, in Proceedings of International Conference on Com-munications (ICC), Vancouver, Canada, 1999.
[10] S. Haykin, ”Cognitive Radio: Brain-Empowered Wireless Communications”, IEEEJournal on Selected Area in Communications, 23(5), pp. 201-220, Feb 2005.
[11] M. Ghozzi, M. Dohler, F. Marx, J. Palicot, ”Cognitive radio: methods for the de-tection of free bands”, Comptes Rendus Physique, Elsevier, volume 7, pp 794-804,september 2006.
[12] C. Roland, J. Palicot, ”A New Concept of Wireless Reconfigurable Receiver”, IEEEcommunications Magazine, pp 124-132, july 2003.
[13] J. Palicot, R. Hachemani, C. Moy,”La bulle sensorielle radio intelligente”, in French,REE, No9, Octobre 2007.
[14] Y. Zhao, B. Le, J.H. Reed, ”Cognitive Radio Technology”, edited by B.Fette, 2006,Chap.11.
[15] School of Human & Health Sciences, University of Huddersfield.
[16] P. Rebhan, ”Bubbles of Perception: exploring the limits and the future of humanperception”,http://www.rebfile.com/bop-images/Bubbles of Perception Ebook.pdf.
[17] S. Le Gallou, G. Breton, C. Garcia, R. Seguier, Distance Maps: a robust illuminationpreprocessing for active appearence models, International Conference on ComputerVision Theory and Applications (VISAPP) Setubal, Portugal, February 2006.
[18] T.F. Cootes, G.J. Edwards et C.J. Taylor. Active Appearence Models. EuropeenConference on Computer Vision,1998.
[19] Y. Aidarous, S. Le Gallou, A. Sattar et R. Seguier, ”‘Face alignment using active ap-pearence model optimized by simplex”’. International Conference on Computer VisionTheory and Applications, 2007.
[20] K. Zuiderveld. Contrast Limited Adaptive Histogram Equalization. Graphics GemsIV, 1994.
[21] A Sattar, Y Adarous, R Seguier, ”‘GAGM-AAM: A Genetic Optimization with Gaus-sian Mixtures for Active Appearance Models”’, 15th International Conference on ImageProcessing (ICIP 2008), San Diego, California, USA, 12-15 October 2008.
[22] M. Gandetto, A. F. Cattoni, M. Musso and Carlo S. Regazzoni, ”Distributed Co-operative Mode Identification For Cognitive Radio Applications”, XXVIIIth GeneralAssembly of international URSI October 23-29, 2005, New Delhi, INDIA.
32

[23] P. Cordier et al., ”E2R Cognitive Pilot Channel concept,” IST Summit, Mykonos,June, 2006.
[24] P.Houze, S. Ben Jemaa, P. Cordier, ”Common Pilot Channel for network selection,”IEEE VTC in spring conf., Melbourne, May 2006.
[25] J. Prez-Romero, O. Sallent, R. Agust, L. Giupponi ”A Novel On-Demand CognitivePilot Channel enabling Dynamic Spectrum Allocation”, Second IEEE InternationalSymposium on New Frontiers in Dynamic Spectrum Access Networks, (DySPAN),Dublin, April, 2007.
[26] C. Roland, J. Palicot, ” Un Terminal Multistandard Utilisant le GPS pour se Con-figurer ”, ISVIC 2000,Rabat(Maroc),17-20 Avril 2000.
[27] J.G.Proakis, Digital Communications, 3rd edition, Mc Graw Hill.
[28] D. Cabric, S. M. Mishra, and R. W. Brodersen, ”Implementation issues in spectrumsensing for cognitive radios,” in Proc. 38th. Asilomar Conf. Signal Systems, Computers,2004.
[29] H. Urkowitz, Energy detection of unknown deterministic signals, Proceeding of theIEEE, Vol. 55, No. 4, pp. 523-531, Apr. 1967.
[30] P Sonnenschein, M Fishman, Radiometric detection of spread-spectrum signals innoise of uncertain power, IEEE Transactions on Aerospace and Electronic Systems,Vol. 28, No. 3, July 1992.
[31] V. I. Kostylev, Energy detection of a Signal with Random Amplitude, IEEE Interna-tional Conference on Communications, Vol. 3, pp. 1606 - 1610, April 2002.
[32] F. F. Digham, M. -S. Alouini et M. K. Simon, On the Energy Detection of Unknownsignals over Fadings Channels, in Proc. IEEE Int. Conf. on Commun. (ICC’03), May2003.
[33] W. A Gardner, Statistical Spectral Analysis: A Nonprobabilistic Theory, Prentice-Hall, Englewood Cliffs, New Jersey, 1988.
[34] H. L. Hurd et N. L. Gerr, Graphical methods for determining the presence of periodiccorrelation, Journal of Time Series Analysis, Vol. 12, No. 4, p. 337 - 350, 1991.
[35] J. Wang, T. Chen et B. Huang, Cyclo-period estimation for discrete-time cyclo-stationary signals, IEEE Transaction on Signal Processing, Vol. 54, No. 1, p. 83 - 94,Jan. 2006.
[36] A. V. Dandwat et G.B. Giannakis, Statistical tests for presence of cyclostationarity,IEEE Transactions on Signal Processing, Vol. 42, Issue 9, Sept. 1944, pp 2355-2369.
33
[37] M. Ghozzi et al, ”Cyclostationarity based test for detection of vacant frequencybands,” IEEE Crowncom’06, 2006.
[38] R Hachemani,J Palicot , C Moy, ”Choi/Williams Transform to discriminate betweenFH and DS spread spectrum”, submitted to IWCWMC, Cote d’Azur, France.
[39] M. Gandetto, M. Guainazzo and C. S. Regazzoni. ”Use of time-frequency analysis andneural networks for mode identification in a wireless software-defend radio approach”,Eurasip Journal of Applied Signal Processing, Special Issue on Non Linear SignalProcessing and Image Processing, Vol 13, pp 1778-1790, October 2004.
34