Multilateralism and Regionalism: Trade Agreement Effects on Southern Agricultural Products Lynn...
31
Multilateralism and Multilateralism and Regionalism: Regionalism: Trade Agreement Effects on Trade Agreement Effects on Southern Agricultural Products Southern Agricultural Products Lynn Kennedy, Brian Hilbun, and Elizabeth Lynn Kennedy, Brian Hilbun, and Elizabeth Dufour Dufour LSU AgCenter LSU AgCenter
-
Upload
darren-maxwell -
Category
Documents
-
view
220 -
download
0
Transcript of Multilateralism and Regionalism: Trade Agreement Effects on Southern Agricultural Products Lynn...

Multilateralism and Regionalism:Multilateralism and Regionalism:Trade Agreement Effects on Southern Trade Agreement Effects on Southern
Agricultural ProductsAgricultural Products
Lynn Kennedy, Brian Hilbun, and Elizabeth DufourLynn Kennedy, Brian Hilbun, and Elizabeth Dufour
LSU AgCenterLSU AgCenter
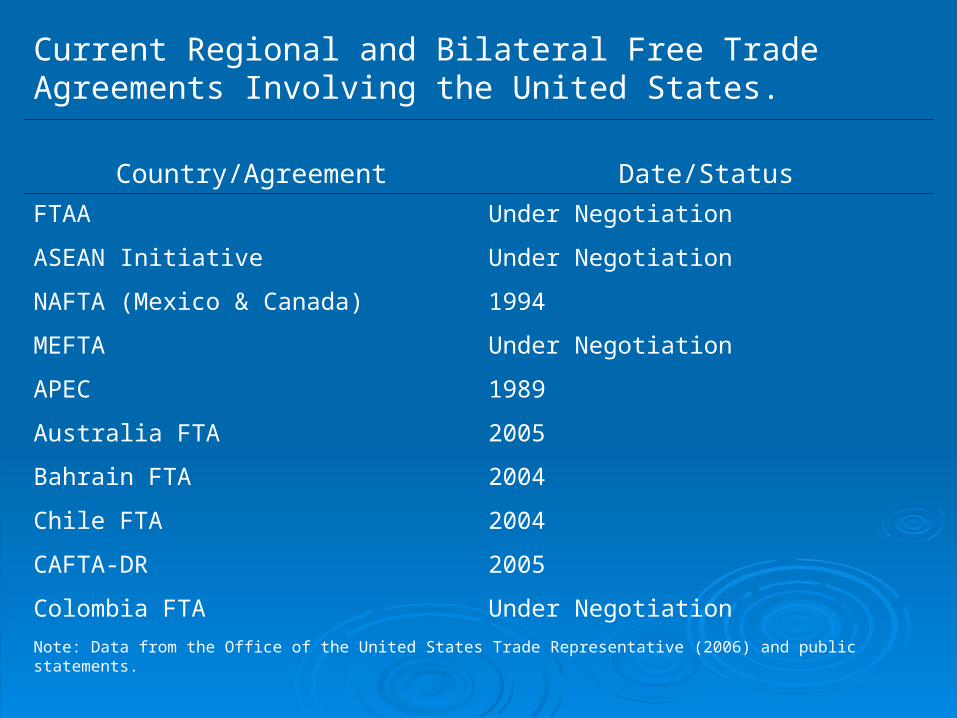
Current Regional and Bilateral Free Trade Agreements Involving the United States.
Country/Agreement Date/Status
FTAA Under Negotiation
ASEAN Initiative Under Negotiation
NAFTA (Mexico & Canada) 1994
MEFTA Under Negotiation
APEC 1989
Australia FTA 2005
Bahrain FTA 2004
Chile FTA 2004
CAFTA-DR 2005
Colombia FTA Under Negotiation
Note: Data from the Office of the United States Trade Representative (2006) and public statements.
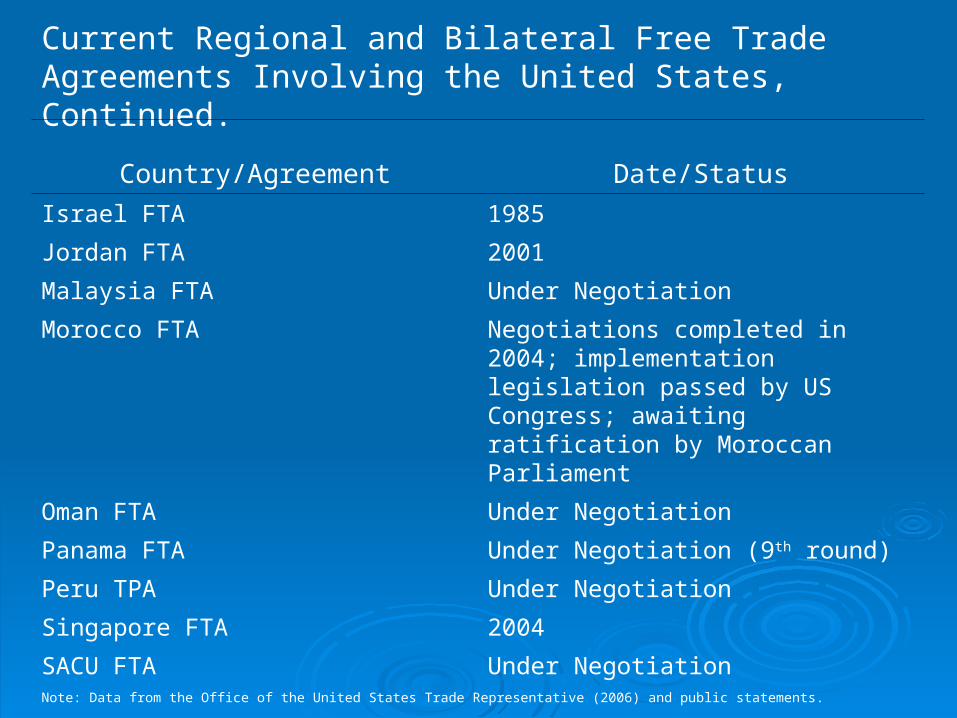
Current Regional and Bilateral Free Trade Agreements Involving the United States, Continued.
Country/Agreement Date/Status
Israel FTA 1985
Jordan FTA 2001
Malaysia FTA Under Negotiation
Morocco FTA Negotiations completed in 2004; implementation legislation passed by US Congress; awaiting ratification by Moroccan Parliament
Oman FTA Under Negotiation
Panama FTA Under Negotiation (9th round)
Peru TPA Under Negotiation
Singapore FTA 2004
SACU FTA Under NegotiationNote: Data from the Office of the United States Trade Representative (2006) and public statements.
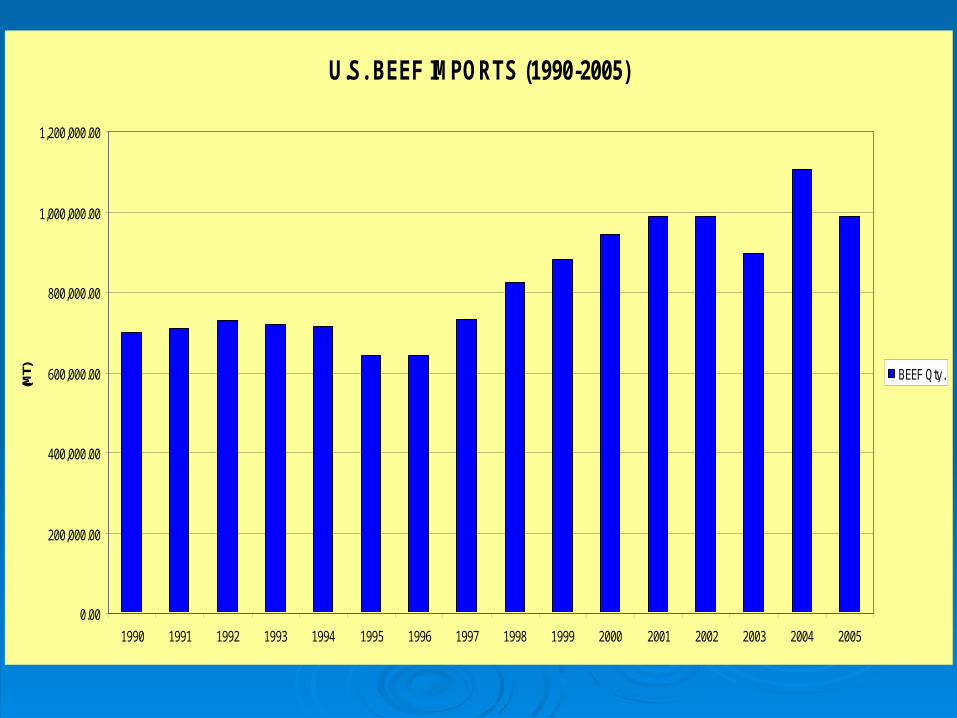
U.S. BEEF IMPORTS (1990-2005)
0.00
200,000.00
400,000.00
600,000.00
800,000.00
1,000,000.00
1,200,000.00
1990 1991 1992 1993 1994 1995 1996 1997 1998 1999 2000 2001 2002 2003 2004 2005
(MT) BEEF Qty.

U.S. BEEF EXPORTS (1990-2005)
0.00
100,000.00
200,000.00
300,000.00
400,000.00
500,000.00
600,000.00
700,000.00
800,000.00
900,000.00
1990 1991 1992 1993 1994 1995 1996 1997 1998 1999 2000 2001 2002 2003 2004 2005
(MT) BEEF Qty.

Top Ten Beef Importers, 2002-2005
Rank Country Trade Value
1 U.S.A. $11,958,091,799
2 Japan $7,487,603,376
3 Italy $7,053,713,005
4 EU-25 $4,603,018,161
5 France $3,816,317,510
6 United Kingdom $3,758,528,651
7 Mexico $3,450,140,285
8 Rep. of Korea $3,133,719,125
9 Germany $2,930,913,632
10 Netherlands $2,876,737,219

Top Ten Beef Exporters, 2002-2005
Rank Country Trade Value
1 Australia $11,548,886,987
2 U.S.A. $6,979,570,097
3 Brazil $6,312,995,689
4 Netherlands $6,269,945,792
5 Germany $5,205,982,736
6 Canada $5,180,546,675
7 Ireland $4,587,618,455
8 New Zealand $4,259,704,799
9 France $3,458,824,722
10 Argentina $2,801,766,906

U.S. POULTRY IMPORTS (1990-2005)
0.00
5,000.00
10,000.00
15,000.00
20,000.00
25,000.00
30,000.00
1990 1991 1992 1993 1994 1995 1996 1997 1998 1999 2000 2001 2002 2003 2004 2005
(MT) POULTRY Qty.

U.S. POULTRY EXPORTS (1990-2005)
0.00
500,000.00
1,000,000.00
1,500,000.00
2,000,000.00
2,500,000.00
3,000,000.00
3,500,000.00
1990 1991 1992 1993 1994 1995 1996 1997 1998 1999 2000 2001 2002 2003 2004 2005
(MT) POULTRY Qty.

Top Ten Poultry Importers, 2002-2005
Rank Country Trade Value
1 United Kingdom $4,628,774,548
2 Germany $4,011,311,816
3 Japan $3,447,711,124
4 Russian Federation $3,024,347,628
5 China, Hong Kong SAR $2,387,709,878
6 Saudi Arabia $1,850,391,175
7 EU-25 $1,849,809,595
8 Netherlands $1,668,899,890
9 France $1,593,180,831
10 Mexico $1,492,442,741

Top Ten Poultry Exporters, 2002-2005
Rank Country Trade Value
1 Brazil $9,504,923,053
2 U.S.A. $7,793,727,317
3 Netherlands $4,544,921,528
4 France $4,453,486,635
5 EU-25 $3,553,938,605
6 Belgium $2,177,891,905
7 Germany $1,967,494,344
8 Hungary $1,379,549,954
9 Thailand $1,277,872,794
10 United Kingdom $1,218,761,525

U.S. CORN IMPORTS (1990-2005)
0.00
50,000.00
100,000.00
150,000.00
200,000.00
250,000.00
300,000.00
350,000.00
400,000.00
450,000.00
500,000.00
1990 1991 1992 1993 1994 1995 1996 1997 1998 1999 2000 2001 2002 2003 2004 2005
(MT) MAIZE Qty.

U.S. CORN EXPORTS (1990-2005)
0.00
10,000,000.00
20,000,000.00
30,000,000.00
40,000,000.00
50,000,000.00
60,000,000.00
70,000,000.00
1990 1991 1992 1993 1994 1995 1996 1997 1998 1999 2000 2001 2002 2003 2004 2005
(MT) MAIZE Qty.

Top Ten Corn Importers, 2002-2005
Rank Country Trade Value
1 Japan $9,915,397,378
2 Rep. of Korea $4,676,048,231
3 Mexico $2,831,713,217
4 Other Asia, nes $2,808,226,499
5 EU-25 $2,504,482,718
6 Spain $2,365,056,999
7 Netherlands $1,555,073,665
8 Egypt $1,487,677,232
9 Canada $1,307,521,659
10 Iran $1,288,807,786

Top Ten Corn Exporters, 2002-2005
Rank Country Trade Value
1 U.S.A. $21,275,696,866
2 France $5,510,483,907
3 Argentina $4,721,339,464
4 China $4,354,895,604
5 Brazil $1,360,930,703
6 Hungary $973,913,283
7 Germany $696,461,664
8 South Africa $644,681,550
9 Ukraine $588,564,164
10 EU-25 $517,689,100

U.S. RICE IMPORTS (1990-2005)
0.00
50,000.00
100,000.00
150,000.00
200,000.00
250,000.00
300,000.00
350,000.00
400,000.00
450,000.00
500,000.00
1990 1991 1992 1993 1994 1995 1996 1997 1998 1999 2000 2001 2002 2003 2004 2005
(MT) RICE Qty.

U.S. RICE EXPORTS (1990-2005)
0.00
500,000.00
1,000,000.00
1,500,000.00
2,000,000.00
2,500,000.00
3,000,000.00
3,500,000.00
4,000,000.00
4,500,000.00
5,000,000.00
1990 1991 1992 1993 1994 1995 1996 1997 1998 1999 2000 2001 2002 2003 2004 2005
(MT) RICE Qty.
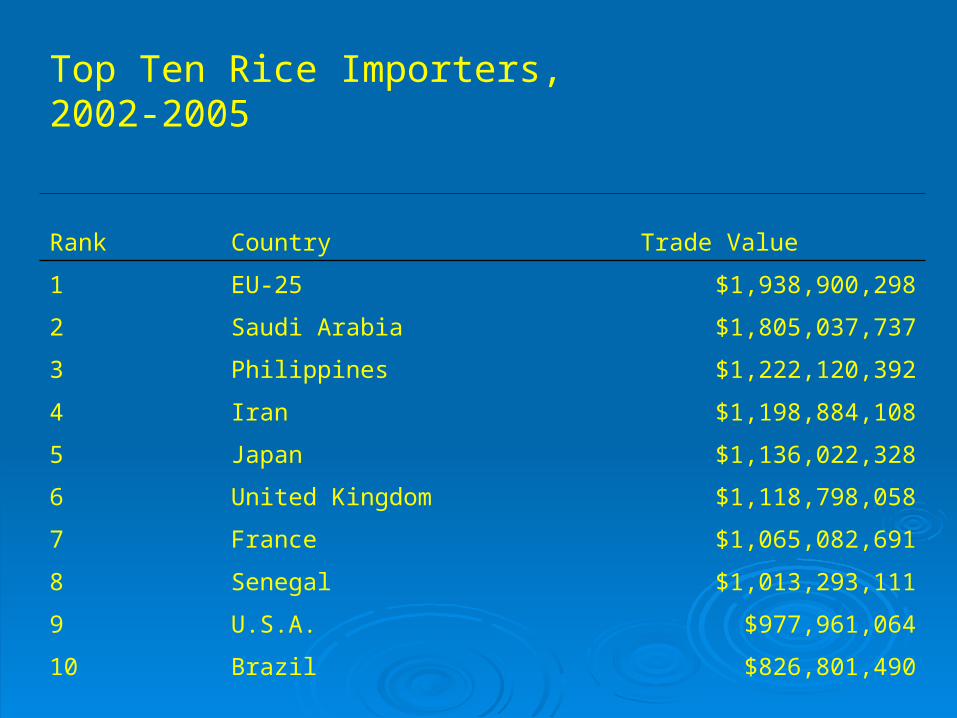
Top Ten Rice Importers, 2002-2005
Rank Country Trade Value
1 EU-25 $1,938,900,298
2 Saudi Arabia $1,805,037,737
3 Philippines $1,222,120,392
4 Iran $1,198,884,108
5 Japan $1,136,022,328
6 United Kingdom $1,118,798,058
7 France $1,065,082,691
8 Senegal $1,013,293,111
9 U.S.A. $977,961,064
10 Brazil $826,801,490

Top Ten Rice Exporters, 2002-2005
Rank Country Trade Value
1 Thailand $8,473,915,876
2 India $4,997,107,060
3 U.S.A. $4,265,661,138
4 Pakistan $2,877,973,916
5 Italy $1,458,404,309
6 Viet Nam $1,446,182,000
7 China $1,332,260,690
8 Uruguay $707,074,185
9 Spain $605,309,613
10 Belgium $556,430,591
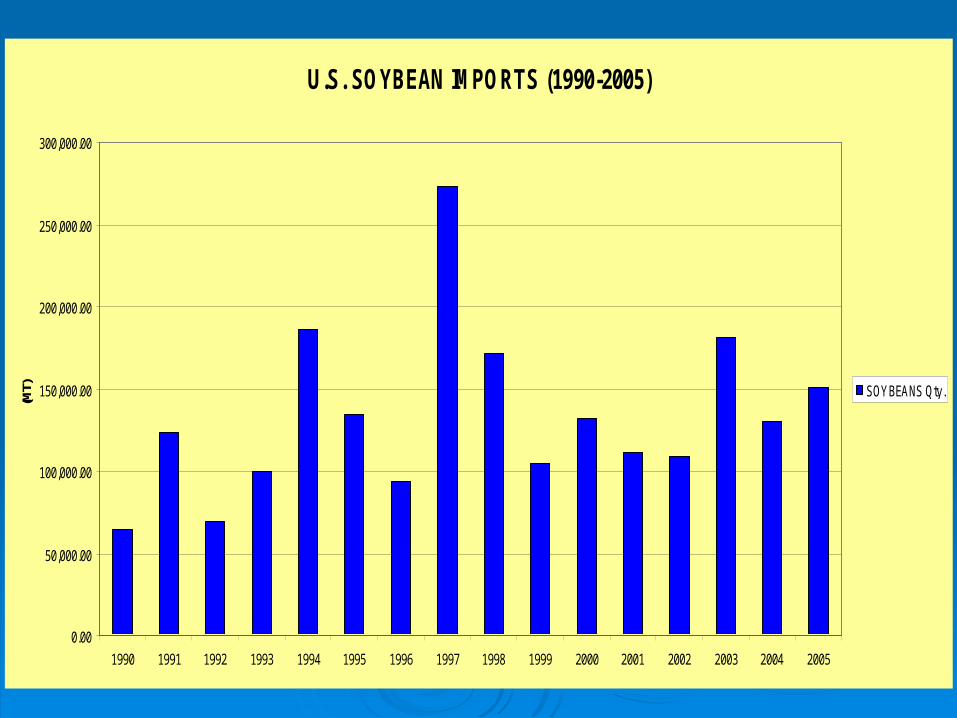
U.S. SOYBEAN IMPORTS (1990-2005)
0.00
50,000.00
100,000.00
150,000.00
200,000.00
250,000.00
300,000.00
1990 1991 1992 1993 1994 1995 1996 1997 1998 1999 2000 2001 2002 2003 2004 2005
(MT) SOYBEANS Qty.
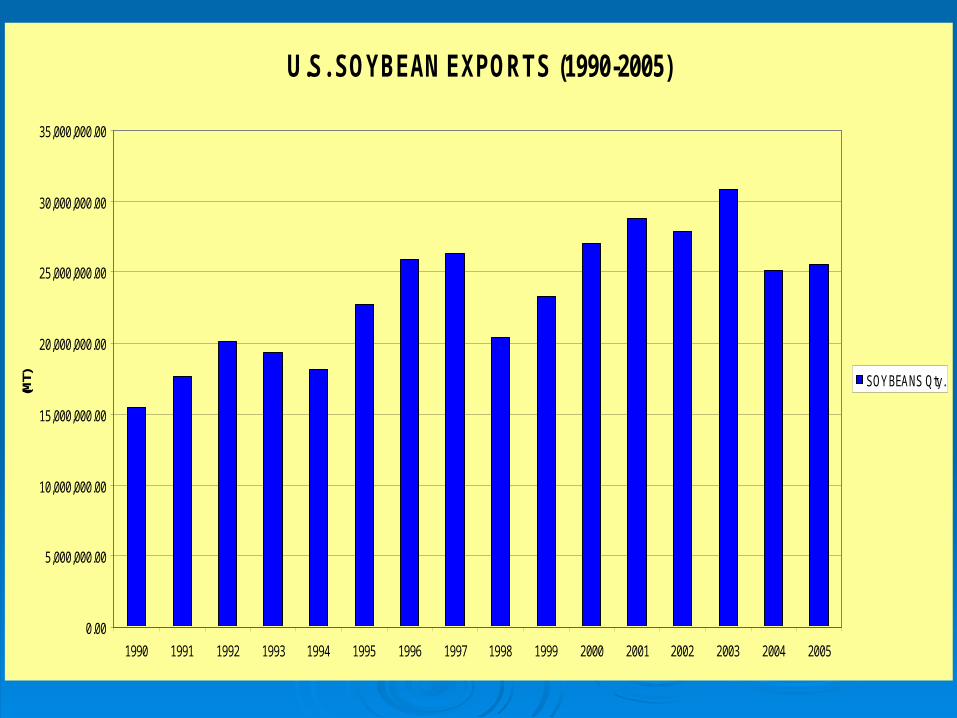
U.S. SOYBEAN EXPORTS (1990-2005)
0.00
5,000,000.00
10,000,000.00
15,000,000.00
20,000,000.00
25,000,000.00
30,000,000.00
35,000,000.00
1990 1991 1992 1993 1994 1995 1996 1997 1998 1999 2000 2001 2002 2003 2004 2005
(MT) SOYBEANS Qty.
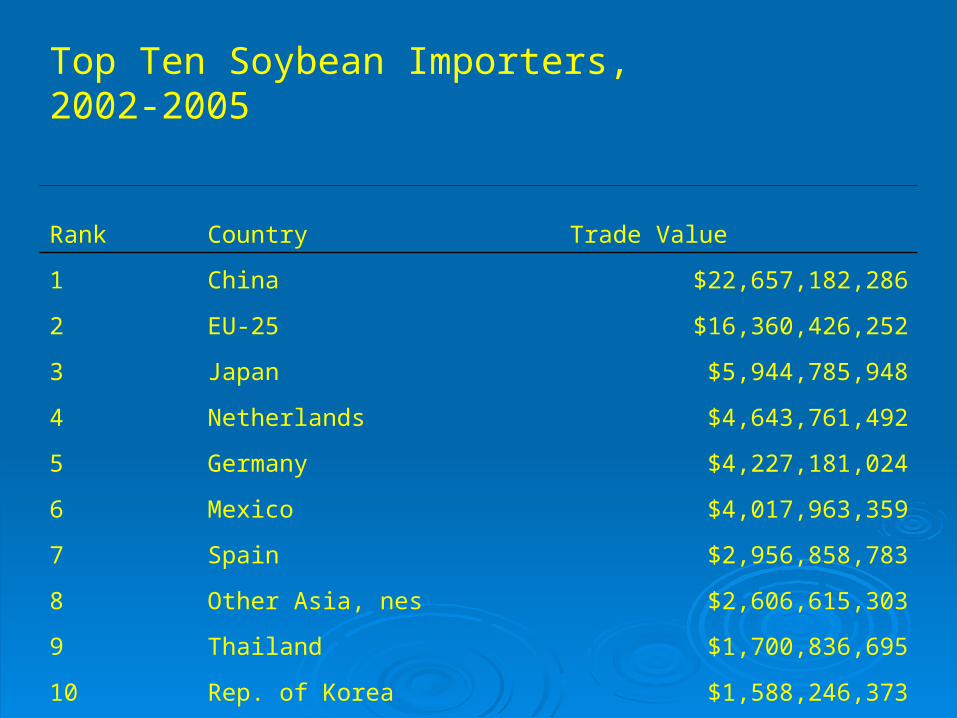
Top Ten Soybean Importers, 2002-2005
Rank Country Trade Value
1 China $22,657,182,286
2 EU-25 $16,360,426,252
3 Japan $5,944,785,948
4 Netherlands $4,643,761,492
5 Germany $4,227,181,024
6 Mexico $4,017,963,359
7 Spain $2,956,858,783
8 Other Asia, nes $2,606,615,303
9 Thailand $1,700,836,695
10 Rep. of Korea $1,588,246,373

Top Ten Soybean Exporters, 2002-2005
Rank Country Trade Value
1 U.S.A. $26,576,204,578
2 Brazil $18,062,380,515
3 Argentina $6,994,885,066
4 Paraguay $1,436,347,976
5 Netherlands $1,172,186,907
6 Canada $1,039,360,425
7 China $478,190,827
8 Uruguay $229,748,749
9 Belgium $118,522,369
10 Bolivia $87,775,122

U.S. PEANUT IMPORTS (1990-2005)
0
10000
20000
30000
40000
50000
60000
70000
1990 1991 1992 1993 1994 1995 1996 1997 1998 1999 2000 2001 2002 2003 2004 2005
(MT) PEANUTS Qty.

U.S. PEANUT EXPORTS
0.00
50,000.00
100,000.00
150,000.00
200,000.00
250,000.00
300,000.00
350,000.00
400,000.00
1990 1991 1992 1993 1994 1995 1996 1997 1998 1999 2000 2001 2002 2003 2004 2005
(MT) PEANUTS Qty.

Top Ten Peanut Importers, 2002-2005
Rank Country Trade Value
1 EU-25 $1,829,468,965
2 Netherlands $783,512,884
3 United Kindgom $341,766,710
4 Germany $323,777,376
5 Mexico $285,709,767
6 Canada $279,401,360
7 Japan $165,620,185
8 Russian Federation $152,498,469
9 Indonesia $150,949,055
10 Italy $146,109,840

Top Ten Peanut Exporters, 2002-2005
Rank Country Trade Value
1 China $1,199,847,431
2 U.S.A. $582,500,632
3 India $381,164,827
4 Netherlands $326,767,043
5 Argentina $266,213,493
6 Nicaragua $137,072,217
7 Viet Nam $100,163,000
8 South Africa $78,260,146
9 Brazil $73,276,181
10 Belgium $63,000,197

U.S. COTTON IMPORTS (1990-2005)
0
20000
40000
60000
80000
100000
120000
140000
160000
180000
200000
1990 1991 1992 1993 1994 1995 1996 1997 1998 1999 2000 2001 2002 2003 2004 2005
(MT) COTTON Qty.

U.S. COTTON EXPORTS (1990-2005)
0.00
500,000.00
1,000,000.00
1,500,000.00
2,000,000.00
2,500,000.00
3,000,000.00
3,500,000.00
4,000,000.00
1990 1991 1992 1993 1994 1995 1996 1997 1998 1999 2000 2001 2002 2003 2004 2005
(MT) COTTON Qty.

Top Ten Cotton Importers, 2002-2005
Rank Country Trade Value
1 China $7,906,077,676
2 EU-25 $3,897,129,455
3 Turkey $2,927,251,832
4 Indonesia $2,627,749,786
5 Thailand $2,187,963,189
6 Mexico $2,039,799,253
7 Pakistan $1,827,348,854
8 Bangladesh $1,674,305,346
9 Rep. of Korea $1,569,643,583
10 Italy $1,506,599,626
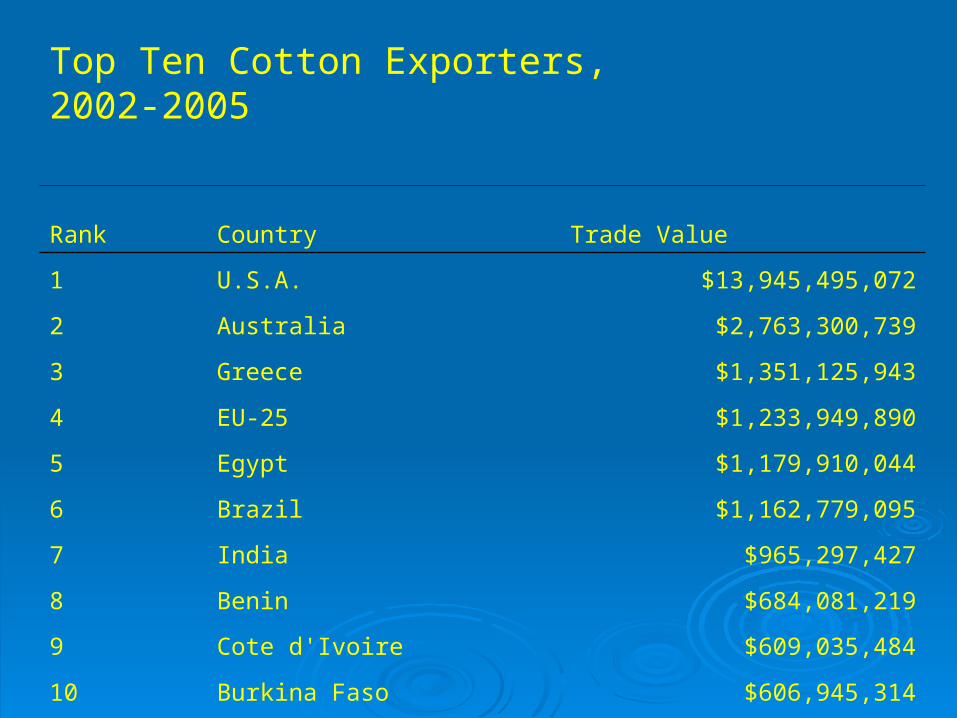
Top Ten Cotton Exporters, 2002-2005
Rank Country Trade Value
1 U.S.A. $13,945,495,072
2 Australia $2,763,300,739
3 Greece $1,351,125,943
4 EU-25 $1,233,949,890
5 Egypt $1,179,910,044
6 Brazil $1,162,779,095
7 India $965,297,427
8 Benin $684,081,219
9 Cote d'Ivoire $609,035,484
10 Burkina Faso $606,945,314